Article

Spatial and Temporal Variability of Rainfall in the Gandaki River Basin of Nepal Himalaya

1
The Small Earth Nepal, Kathmandu 44600, Nepal
2
Nepal Academy of Science and Technology, Khumaltar 44700, Nepal
3
International Centre for Applied Climate Sciences (ICACS), University of Southern Queensland, Toowoomba, QLD 4350, Australia
4
Departments of Civil Engineering and NOAA-CREST, The City College of New York, New York, NY 10031, USA
5
Department of Geosciences, University of Rhode Island, Kingston, RI 02881, USA
6
Departments of Horticulture and Landscape Architecture, Colorado State University, Fort Collins, CO 80523, USA
7
Agriculture and Forestry University, Rampur 44209, Nepal
8
Department of Hydrology and Meteorology, Government of Nepal, Kathmandu 44600, Nepal
*
Author to whom correspondence should be addressed.
Climate 2015, 3(1), 210-226; https://doi.org/10.3390/cli3010210
Submission received: 21 November 2014 / Revised: 26 January 2015 / Accepted: 16 February 2015 / Published: 5 March 2015
(This article belongs to the Special Issue Climate Change and Development in South Asia)

Abstract

:
Landslides, floods, and droughts are recurring natural disasters in Nepal related to too much or too little water. The summer monsoon contributes more than 80% of annual rainfall, and rainfall spatial and inter-annual variation is very high. The Gandaki River, one of the three major rivers of Nepal and one of the major tributaries of the Ganges River, covers all agro-ecological zones in the central part of Nepal. Time series tests were applied for different agro-ecological zones of the Gandaki River Basin (GRB) for rainfall trends of four seasons (pre-monsoon, monsoon, post-monsoon and winter) from 1981 to 2012. The non-parametric Mann-Kendall and Sen’s methods were used to determine the trends. Decadal anomalies relative to the long-term average were analyzed using the APHRODITE precipitation product. Trends in number of rainy days and timing of the monsoon were also analyzed. We found that the post-monsoon, pre-monsoon and winter rainfalls are decreasing significantly in most of the zones but monsoon rainfall is increasing throughout the basin. In the hill region, the annual rainfall is increasing but the rainy days do not show any trend. There is a tendency toward later departure of monsoon from Nepal, indicating an increase in its duration. These seasonally and topographically variable trends may have significant impacts for the agriculture and livestock smallholders that form the majority of the population in the GRB.

1. Introduction

Climate change is a global concern. Global temperature is rising and it is projected that the global mean temperature will rise between 1.4 and 5.8 °C by the year 2100 [1,2]. The rising temperature affects all major components of hydrological systems: it induces change in precipitation pattern, enhances melting of snow and ice, and increases evaporation, altering soil moisture and runoff [3,4]. The relationship between the climate system and the hydrologic cycle underlies the risk of floods and drought and possible future influences of global warming on water resources [5].
Mountainous environments are considered sensitive to climate change [6]. In spite of the fact that the climate of the Himalayan region is changing rapidly [7], the majority of precipitation studies of South Asia have excluded the Himalayan belt due to its complex topography and lack of rain-gauge coverage [8,9]. Climate models have less skill in capturing precipitation patterns in high mountains [10]. There is very low consistency among climate models in precipitation predictions in Himalaya region for either the winter or the monsoon seasons; an overall increase in annual precipitation is projected, but the magnitude of change is low [5,11]. The Himalayas are at the headwaters for the major river systems of Asia [12,13], and understanding how climate change is operating in the region is critically important [14]. Change in precipitation is expected to significantly affect cryospheric processes and the hydrology of headwater catchments in the Himalayas [15]. Ice core analysis showed that South Asian monsoon variability in the Himalayas has been significant [16].
Climate of Nepal is dominated by the southeasterly monsoon coming from the Bay of Bengal. This monsoon provides most (around 80%) of the annual precipitation during the summer months from June to September [17]. The summer monsoon is more active in eastern and central Nepal while a winter monsoon is active in western Nepal [18,19] particularly on the leeward side of the High Mountain and High Himalaya in the northwest [8]. The northern side of the Himalayas receives scanty precipitation year-round and therefore is known as a ‘rain shadow region’ [20]. Due to the steep slopes and rugged topography, precipitation estimation in Nepal is very difficult. The topography of Nepal varies from lowland plain in the south to the high Himalaya range peaks (more than 8000 m) towards the north, which has a profound influence on precipitation. Climatic regimes similarly vary from subtropical in the southern plains to the alpine in the high mountains [18]. Large variation of precipitation occurs even over small distances due to highly undulating surface topography with high mountains and deep valleys [21]. Analysis of observed precipitation data in Nepal is very limited and one of the reasons for this is the relatively short period of data availability [17]. Previous analyses of precipitation data have not revealed any significant trend [13,17].
In this paper, we analyze the spatial and temporal trend of precipitation across different agro-ecological zones of the Gandaki River basin (GRB). Due to topographic variation and orographic effects, precipitation estimation is a complex task and the analysis combining data from different altitudes to report a single pattern cannot distinguish variations in trends between agro-ecological zones. Therefore, it is important to understand the distribution of precipitation and its trend in different altitudinal belts separately. The GRB includes all the agro-ecological zones of Nepal, from plains (Terai) in the south to the high Mountain and Trans-Himalaya in the north. Additionally, the Trans and the high Himalaya regions of the basin receive the lowest amount of the precipitation and the Pokhara area in the Hill region receives the highest precipitation in the country. Thus, we focus on the GRB as a microcosm of the sharp precipitation variations and disparate trends found in the topographically and culturally complex Himalayas region.

2. Method

2.1. Study Area

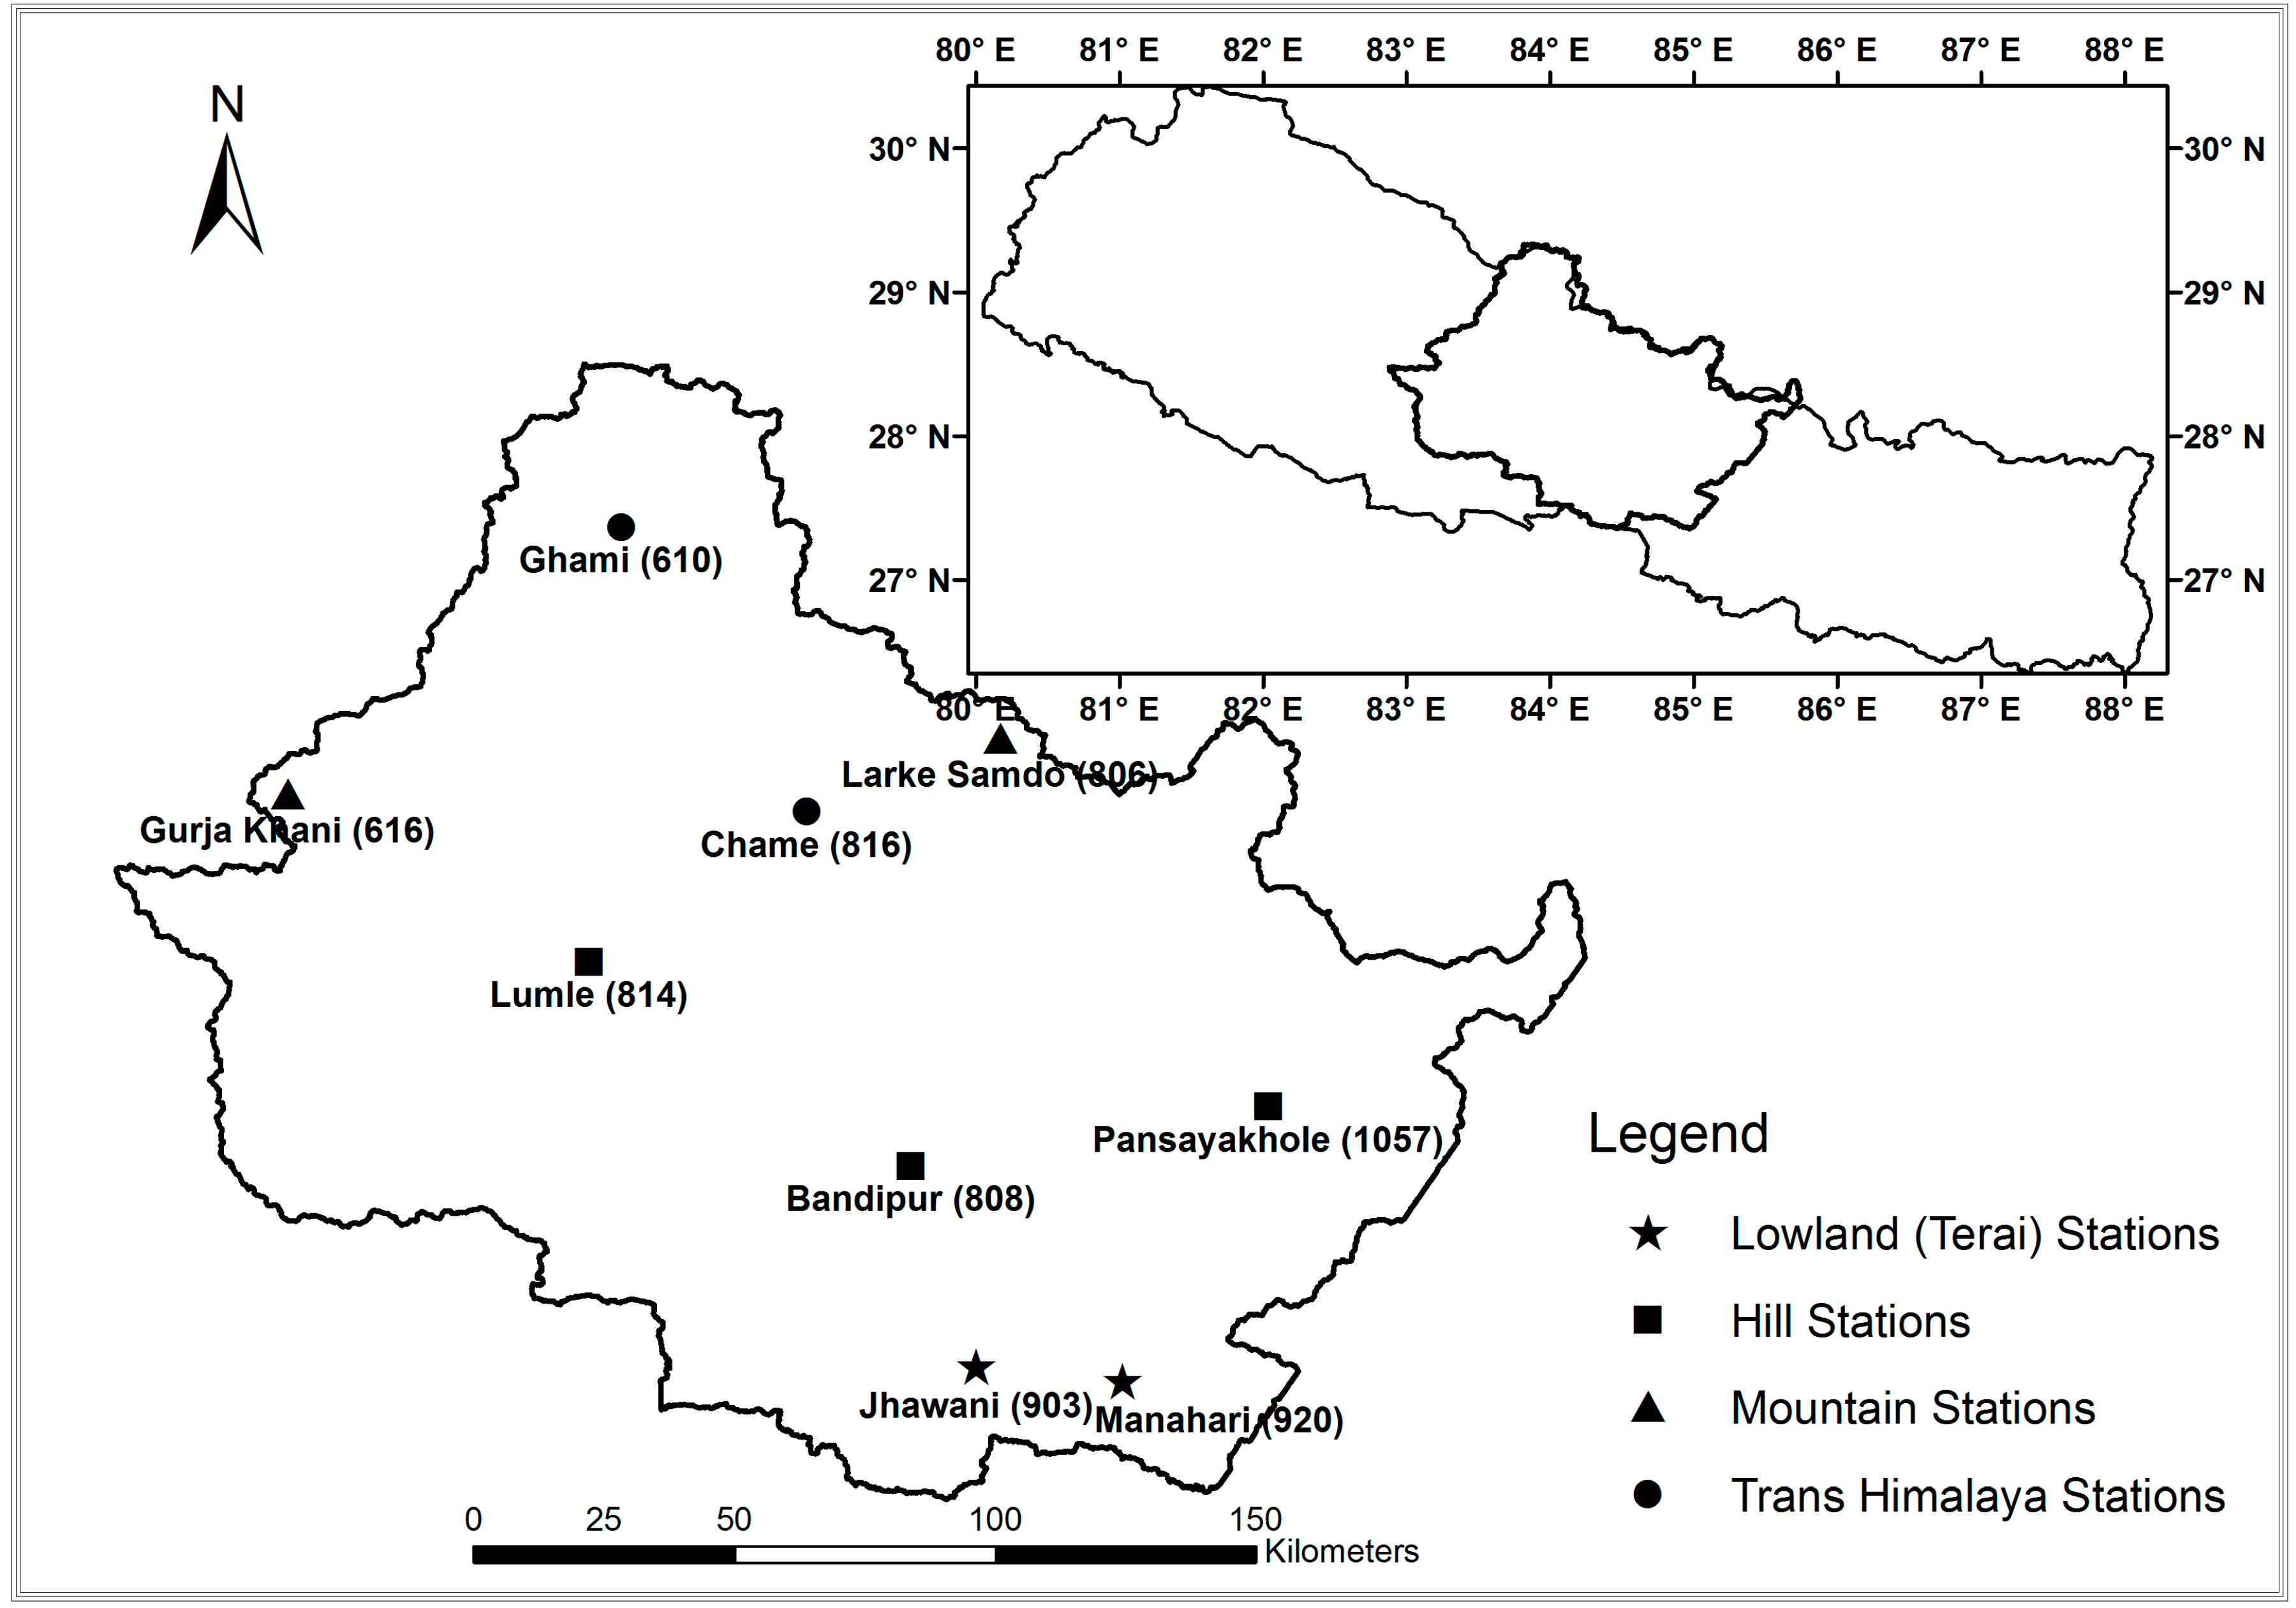
Gandaki River Basin (Figure 1) lies in the central part of Nepal and is one of the three major river basins of Nepal. The Gandaki River is partly snow-fed, originating from the southern edge of the Tibetan Plateau [22], flows through Nepal to India, and drains into the Ganges River. Elevations range from 60 m in the south to higher than 8000 m in the north where the watershed contains the Dhaulagiri (8167 m) and Annapurna (8091 m) peaks [23]. The area of the basin in Nepal is about 35,000 sq km and it covers all the agro-ecological zones in Nepal (Terai, Hill, and Mountain, including Trans-Himalaya), which have very contrasting climates. The presence of the Langtang, Machhapuchhre, Dhawalagiri and Annapurna mountains have created steep variation of climate over the basin. The GRB thus represents topographic, climatic, ecological and socio-economic variations along the elevation gradient of Nepal.

2.2. Data and Their Sources

Monthly and daily precipitation data for 32 years (1981–2012) were obtained from the Department of Hydrology and Meteorology (DHM), Government of Nepal. We examined the data completeness for the available 35 stations in the basin and ranked them according to the fraction of missing data. These stations were distributed in the four agro-ecological zones of the GRB. Two representative stations (Table 1) having the fewest missing values were considered for precipitation analysis in each of the zones except in the Hill region where three stations were considered as this zone covers the largest area (Figure 1 and Table 1). There is an average of 2.8% (0 to 12.5%) of missing data in the selected stations with the most missing data in the Trans-Himalaya region. Missing data from 1982 to 2004 were replaced with the APHRODITE (0.05° × 0.05°) monthly value after bias correction for each month. Beyond 2004, as the APHRODITE data is not available, spatial statistical interpolation was performed using Kriging to fill the missing values.
Figure 1. Gandaki River Basin and the meteorological stations taken from different agro-ecological zones.
Climate 03 00210 g001
Table 1. Precipitation stations selected from different agro-ecological zones in the GRB.
Agro-Ecological ZonesStation IndexLatitude (E)Longitude (N)Elevation (m)LocationDistrict
Trans-Himalaya (>2500 m)61029.05°83.88°3465GhamiMustang
81628.55°84.23°2680ChameManang
Mountain (>2500 m)80628.40°84.37°3650Larke SamdoGorkha
61628.36°83.13°2530Gurja KhaniMyagdi
Hill (500 m–2500 m)81428.18°83.48°1740LumleKaski
105728.01°85.07°1240PansayakholaNuwakot
80827.93°84.42°965BandipurTanahun
Lowland (Terai) (<500 m)90327.35°84.32°270JhawaniChitwan
92027.55°84.82°274ManahariMakwanpur
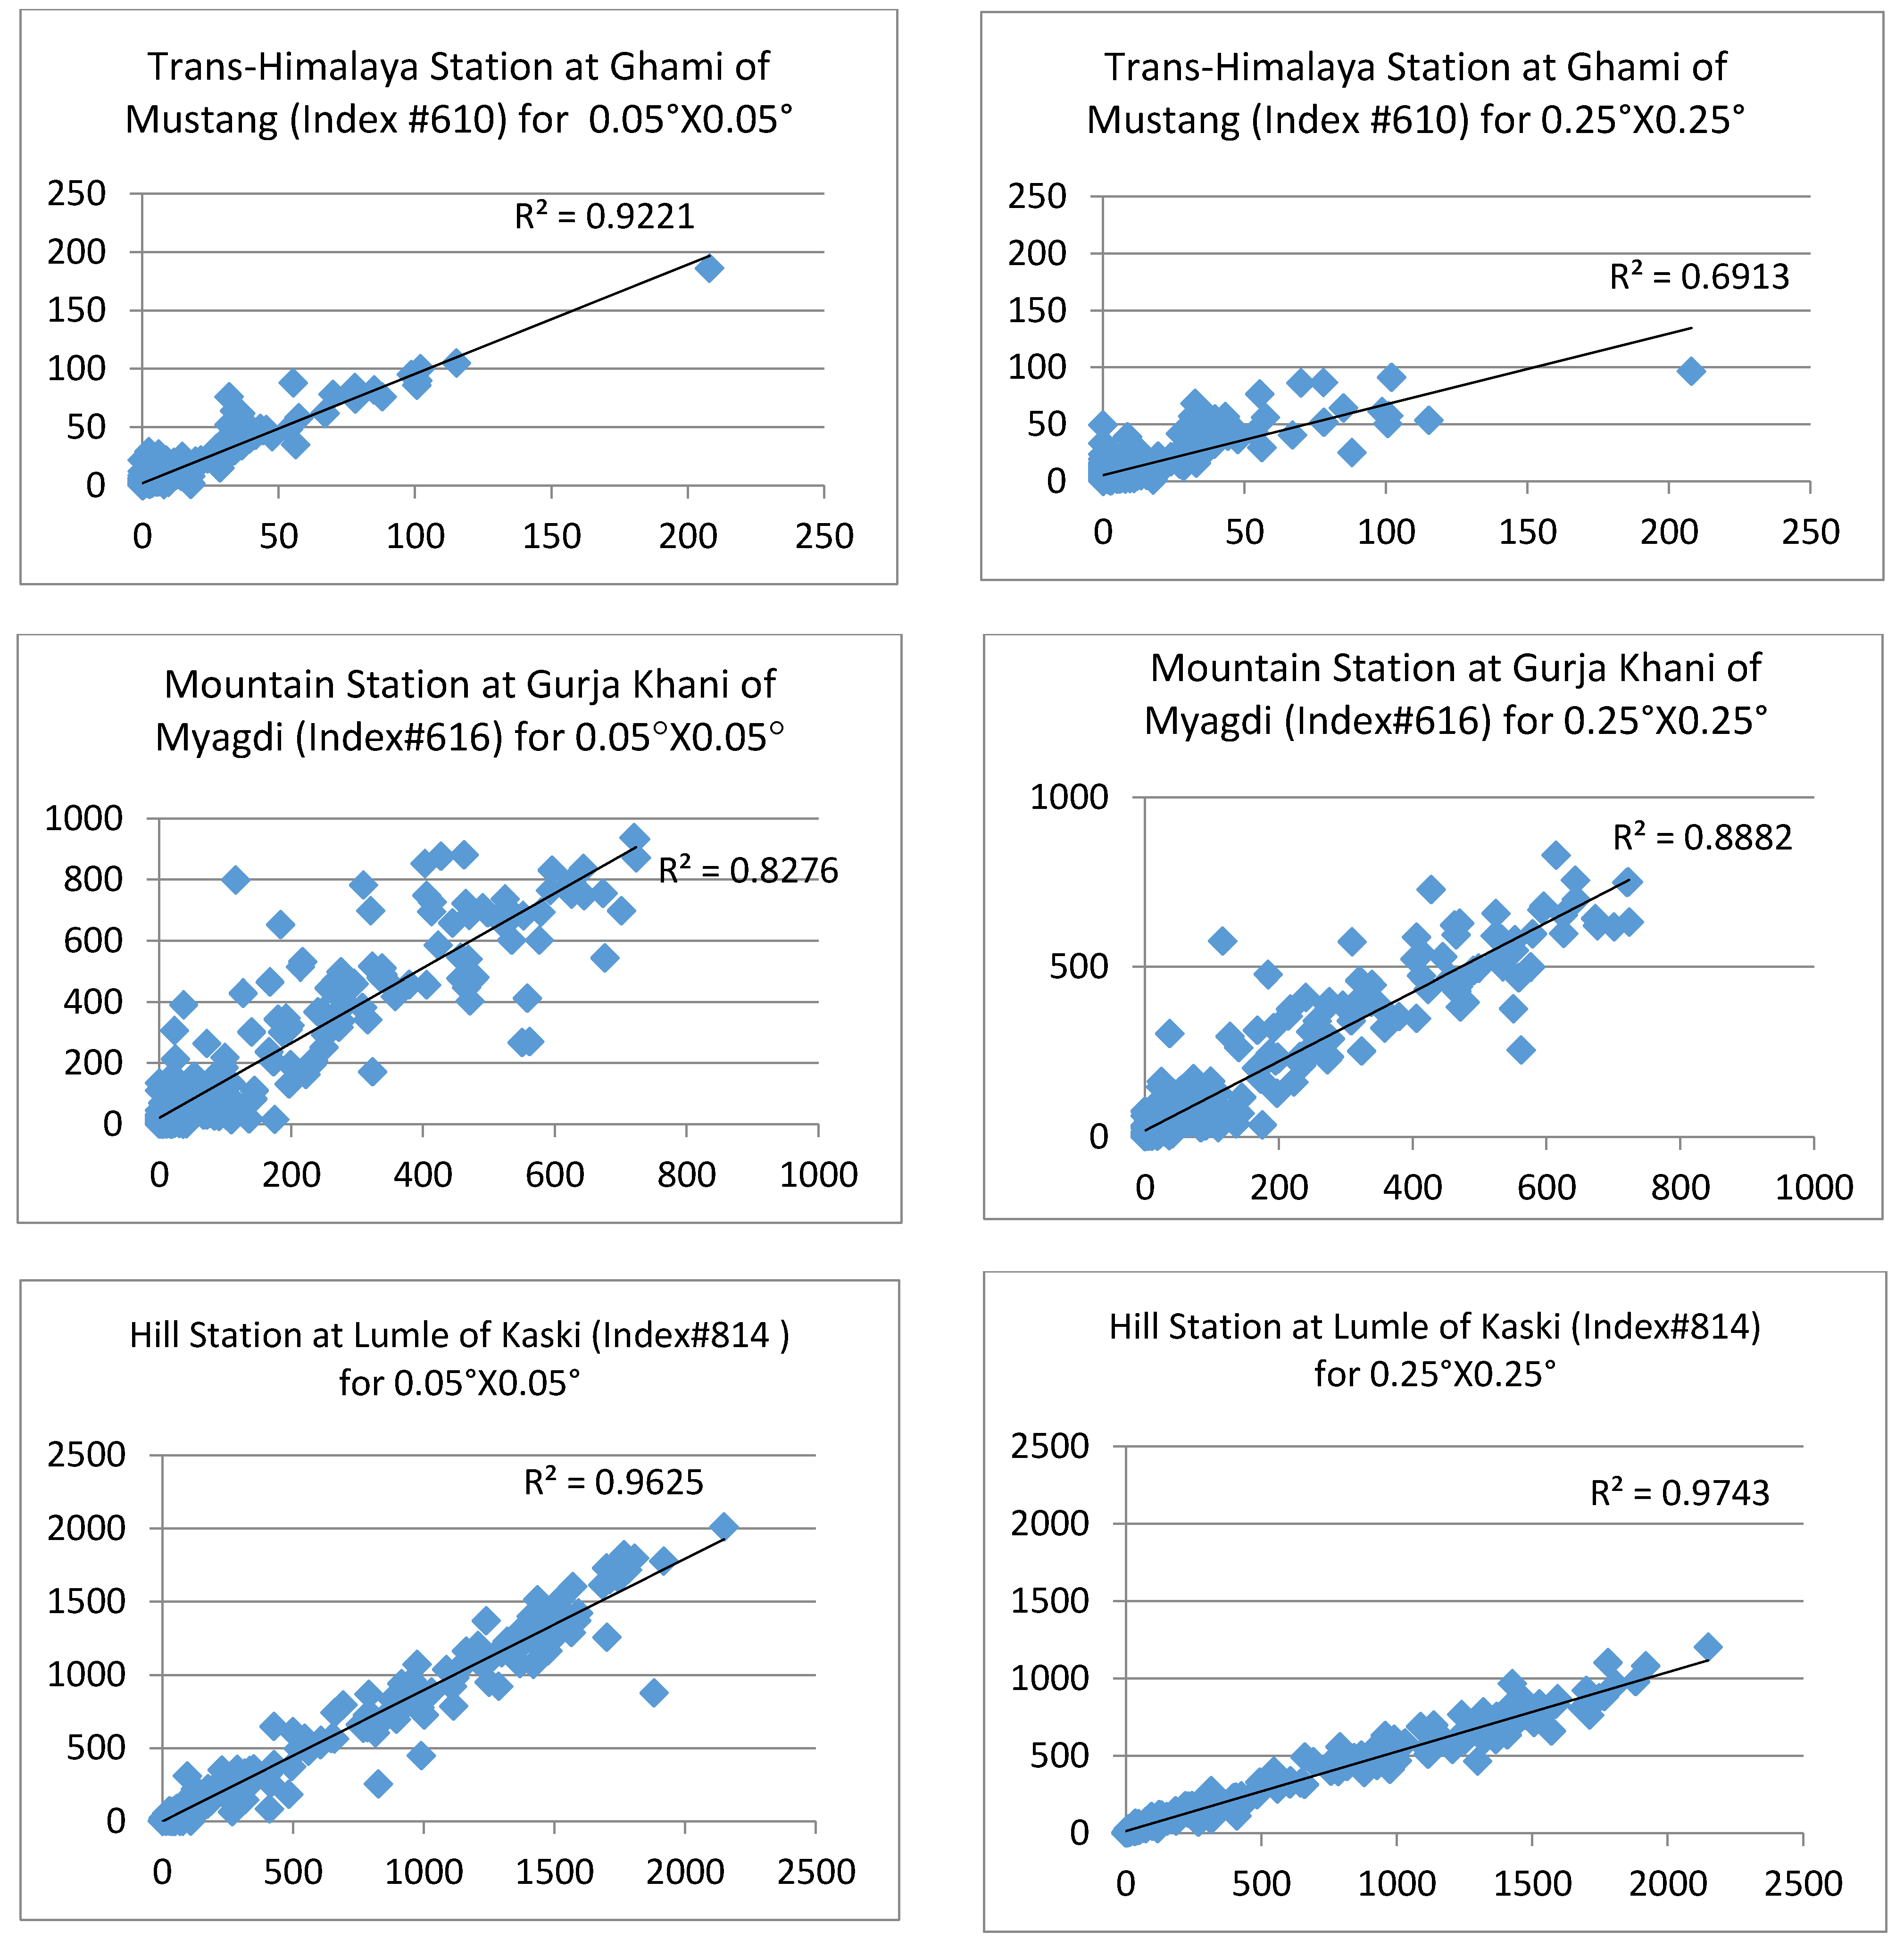
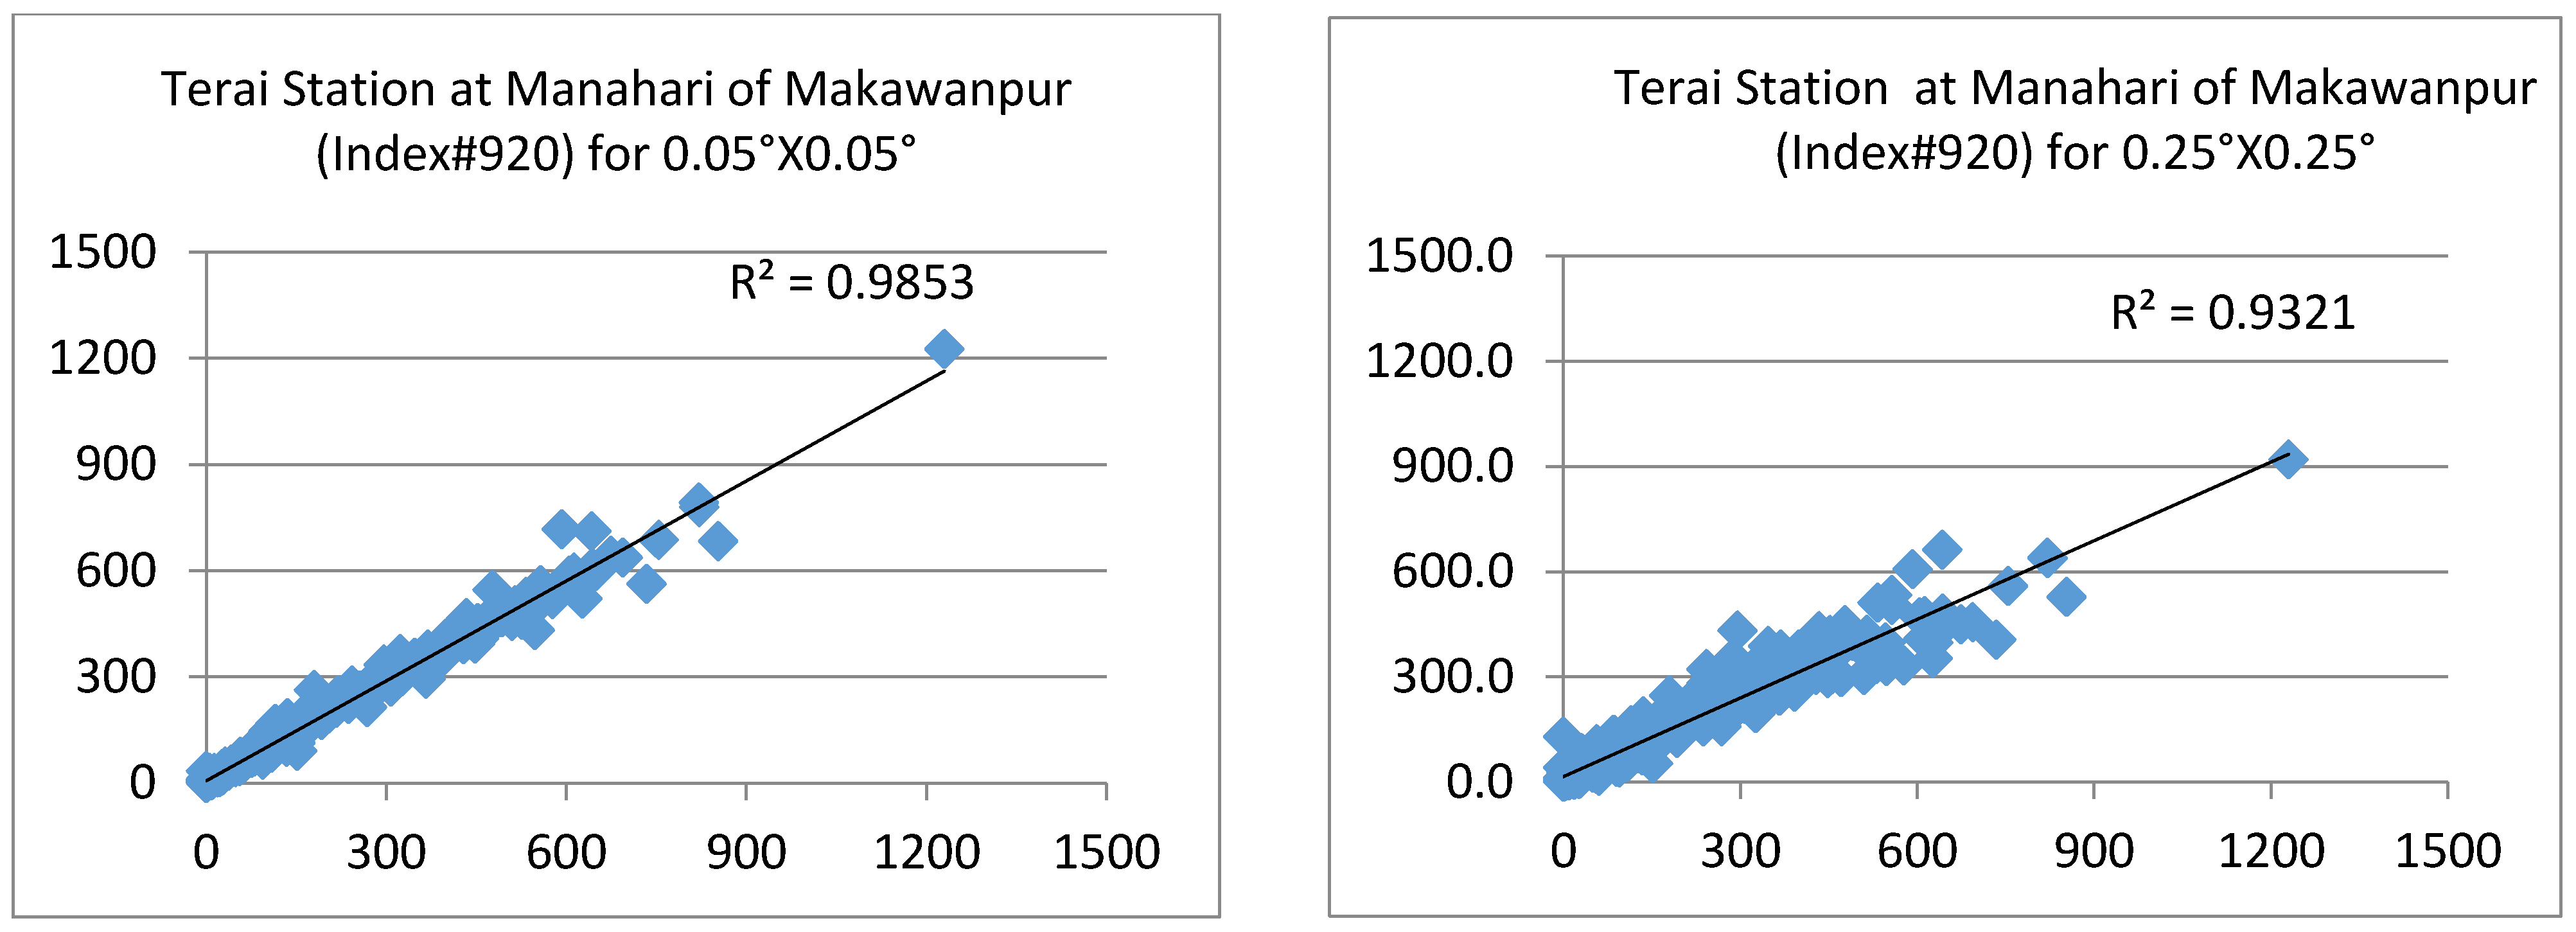
The averages of the selected stations in each of agro-ecological zones were used to analyze the precipitation statistics and estimate the rate of change of precipitation in respective zones. We also applied the APHRODITE 0.05°×0.05° high resolution gridded daily precipitation data (1961–2004) obtained from DHM for Nepal to analyze the annual and seasonal precipitation distribution after summing the daily amount to monthly. For the precipitation anomaly in different decades, we used the 0.25°×0.25° APHRODITE data from 1961 to 2007 which were obtained freely from http://www.chikyu.ac.jp/precip/. Validation of the APHRODITE data with the station observations is satisfactory, as shown in Appendix I. APHRODITE data is based on observed precipitation data in conjunction with other precompiled datasets [24]. For the calculation of the rainy days, DHM daily observation data were used, where missing data were filled with the APHRODITE 0.05° × 0.05° data (up to 2004) and with nearest station data after 2004. After 2004, there are very few missing data, mostly in Trans-Himalaya in periods other than monsoon season. These missing data were filled in with values from the nearest available station, under the assumption that monsoon precipitation distribution within the Trans-Himalaya may on average be fairly uniform. The country-wide summer monsoon onset and withdrawal dates for Nepal were also collected from DHM to analyze trends in the monsoon timing and duration.

2.3. Data Analysis

The data analysis methods included the following: (1) Sen’s slope estimator to calculate the slope of precipitation changes; (2) the Mann-Kendall [25,26] test to determine the significance of the temporal trend of precipitation; (3) spatial interpolation of the gridded data for visualization of spatial pattern; (4) Precipitation anomalies by decade expressed as departures from the long-term mean; and (5) calculation of precipitation statistics as carried out by Keuser, 2014 [27]. Due to the presence of outliers and non-normality in a short record, we used the nonparametric Mann-Kendall test rather than linear regression for quantifying trends [28], as it is a rank based test that does not assume any specific distribution of the data [29,30,31]. The Microsoft Excel spreadsheet for the estimation of Sen’s slope and Mann-Kendall test developed by Salmi et al. 2002 [32] and applied by Manly [33] and Keuser [27] were used. The calculations are described below:

2.3.1. Mann-Kendall Test for Trend

S = i = 2 n j = 1 i 1 s i g n   ( x i x j )
where, S is sum of signs of the differences between any two observations for a series xn. Also, where sign (z) is 0 when z is zero, and 1 when z > and −1 when z < 1.
If the series of values are in a random order, the expected value of S is zero and the variance V is given as:
V = n ( n 1 ) ( 2 n + 5 ) / 18
The significance of differences of S from zero can be tested by transforming it to a standard normal distributed Z, which is:
Z = S 1 V   if S > 0, otherwise,   Z = S + 1 V
Assuming there is a significant linear trend; Sen's slope estimator can be used to quantify its magnitude [34,35].

2.3.2. Sen’s Slope

The slope estimator (S) of the data x is expressed as below:
S = median ( y ) y = ( x i x j i j )
where i = 1, 2, 3, …, N and I < j.
Based on the Mann-Kendall test, we state whether trends are significant at the 99.9%, 99%, 95% and 90% confidence levels.
The decadal anomaly in precipitation was calculated for different ten-year periods (1961–1970, 1971–1980, 1981–1990, 1991–2000 and 2001–2007) as the departure from the long-term average precipitation (1961–2007). We simply subtracted the long term average from decadal average for annual and seasonal values and expressed it as a percentage anomaly of precipitation amount as done by Su and Neelin, 2003 [36]. In this paper, we defined rainy days as the days with precipitation at least 2.5 mm, as defined by Indian Meteorological Department (IMD) and applied by Dash et al. 2009 [37]. The seasons considered were March to May as pre-monsoon, June to September as monsoon, October to November as post-monsoon and December to February as winter. We used least squares method for the detection of trend characteristics in number of rainy days.

3. Results

3.1. Precipitation Statistics
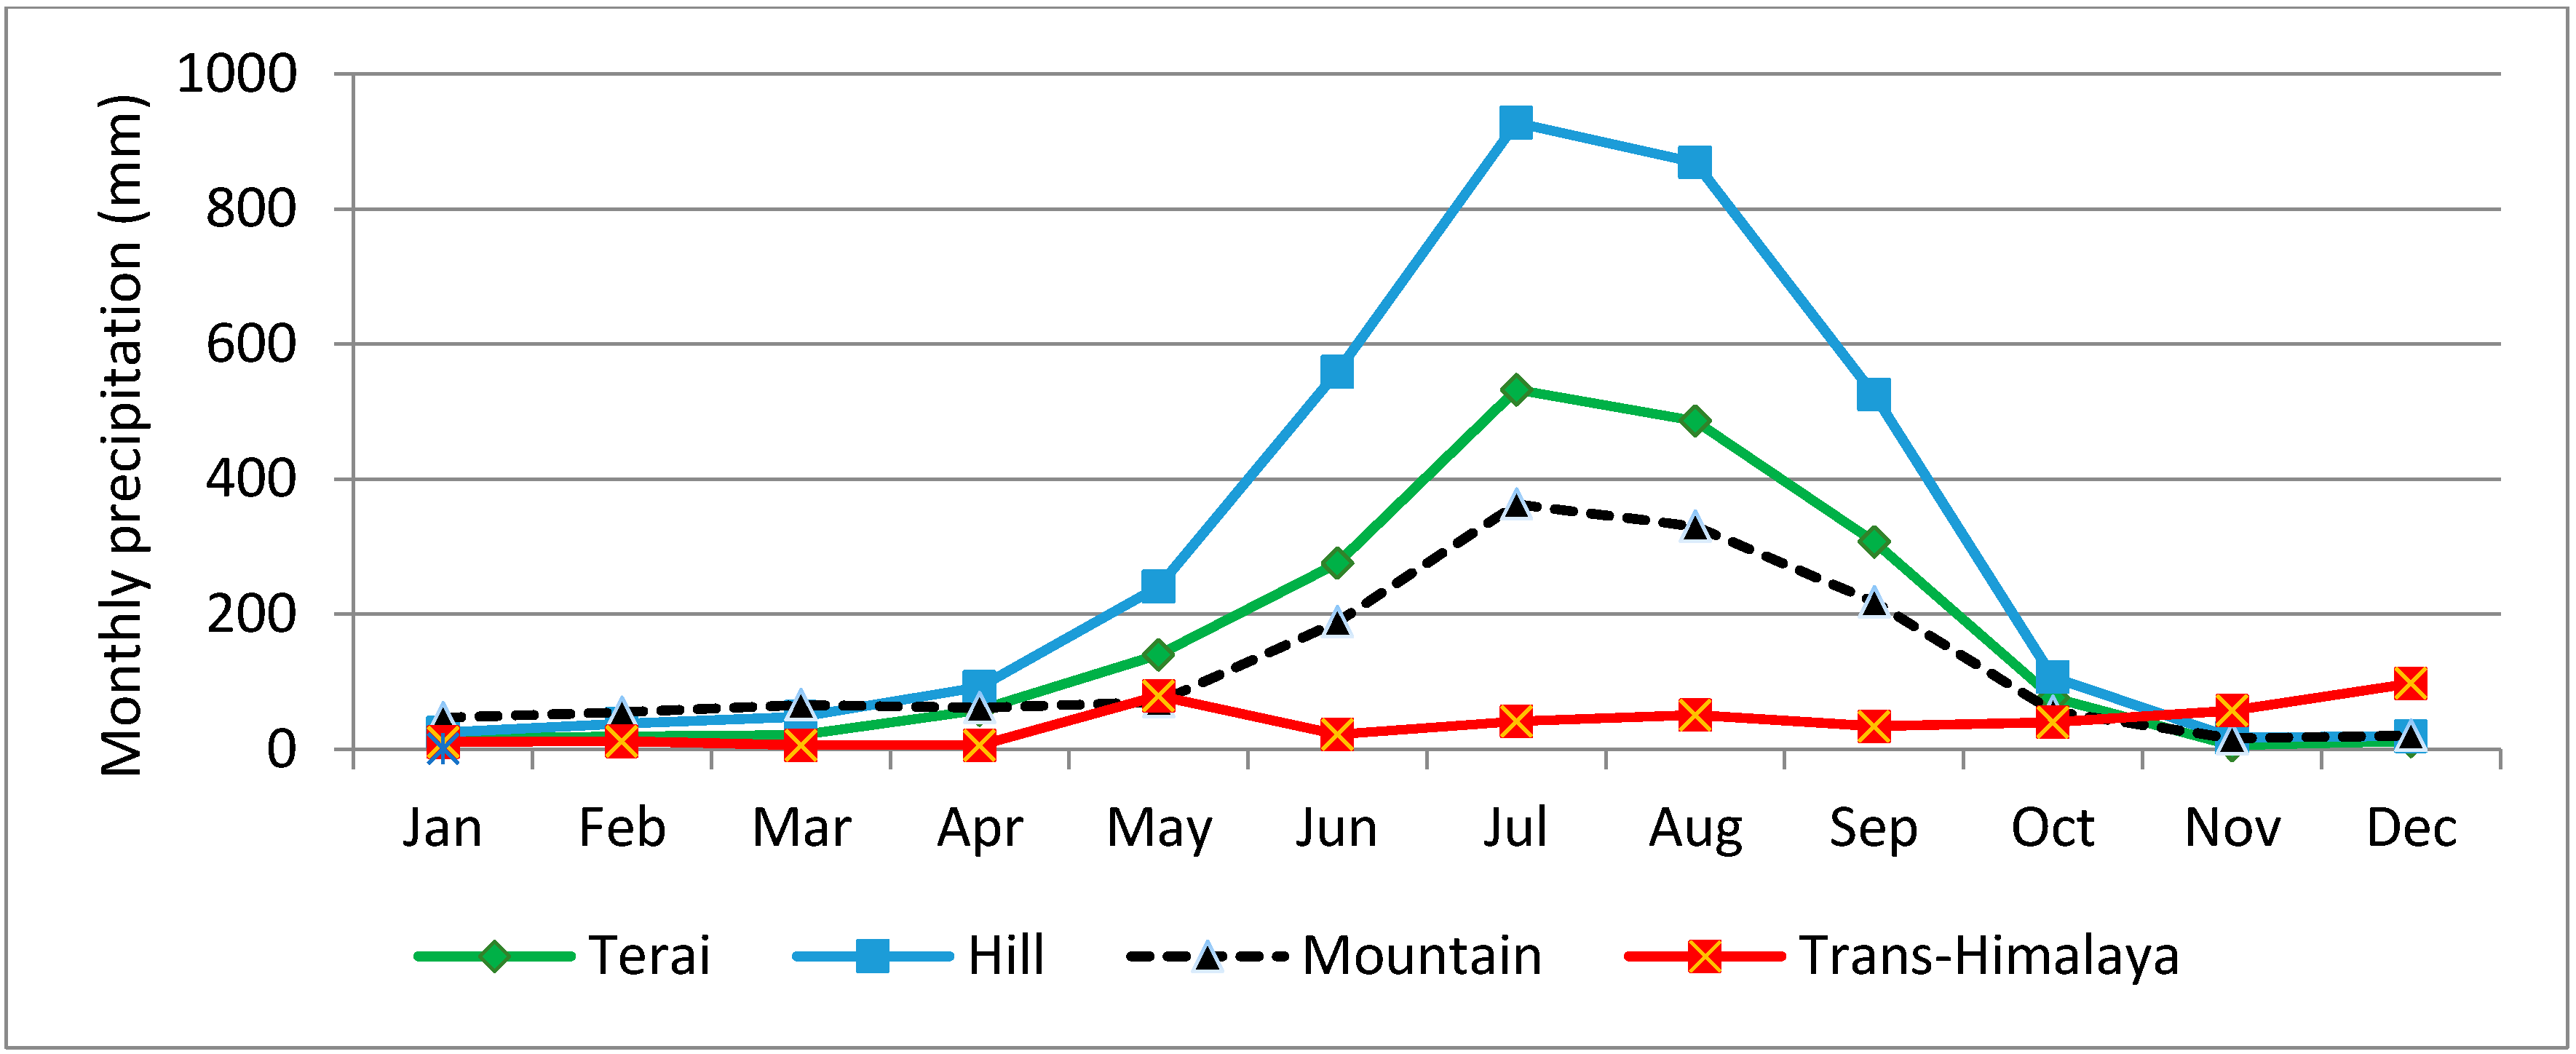
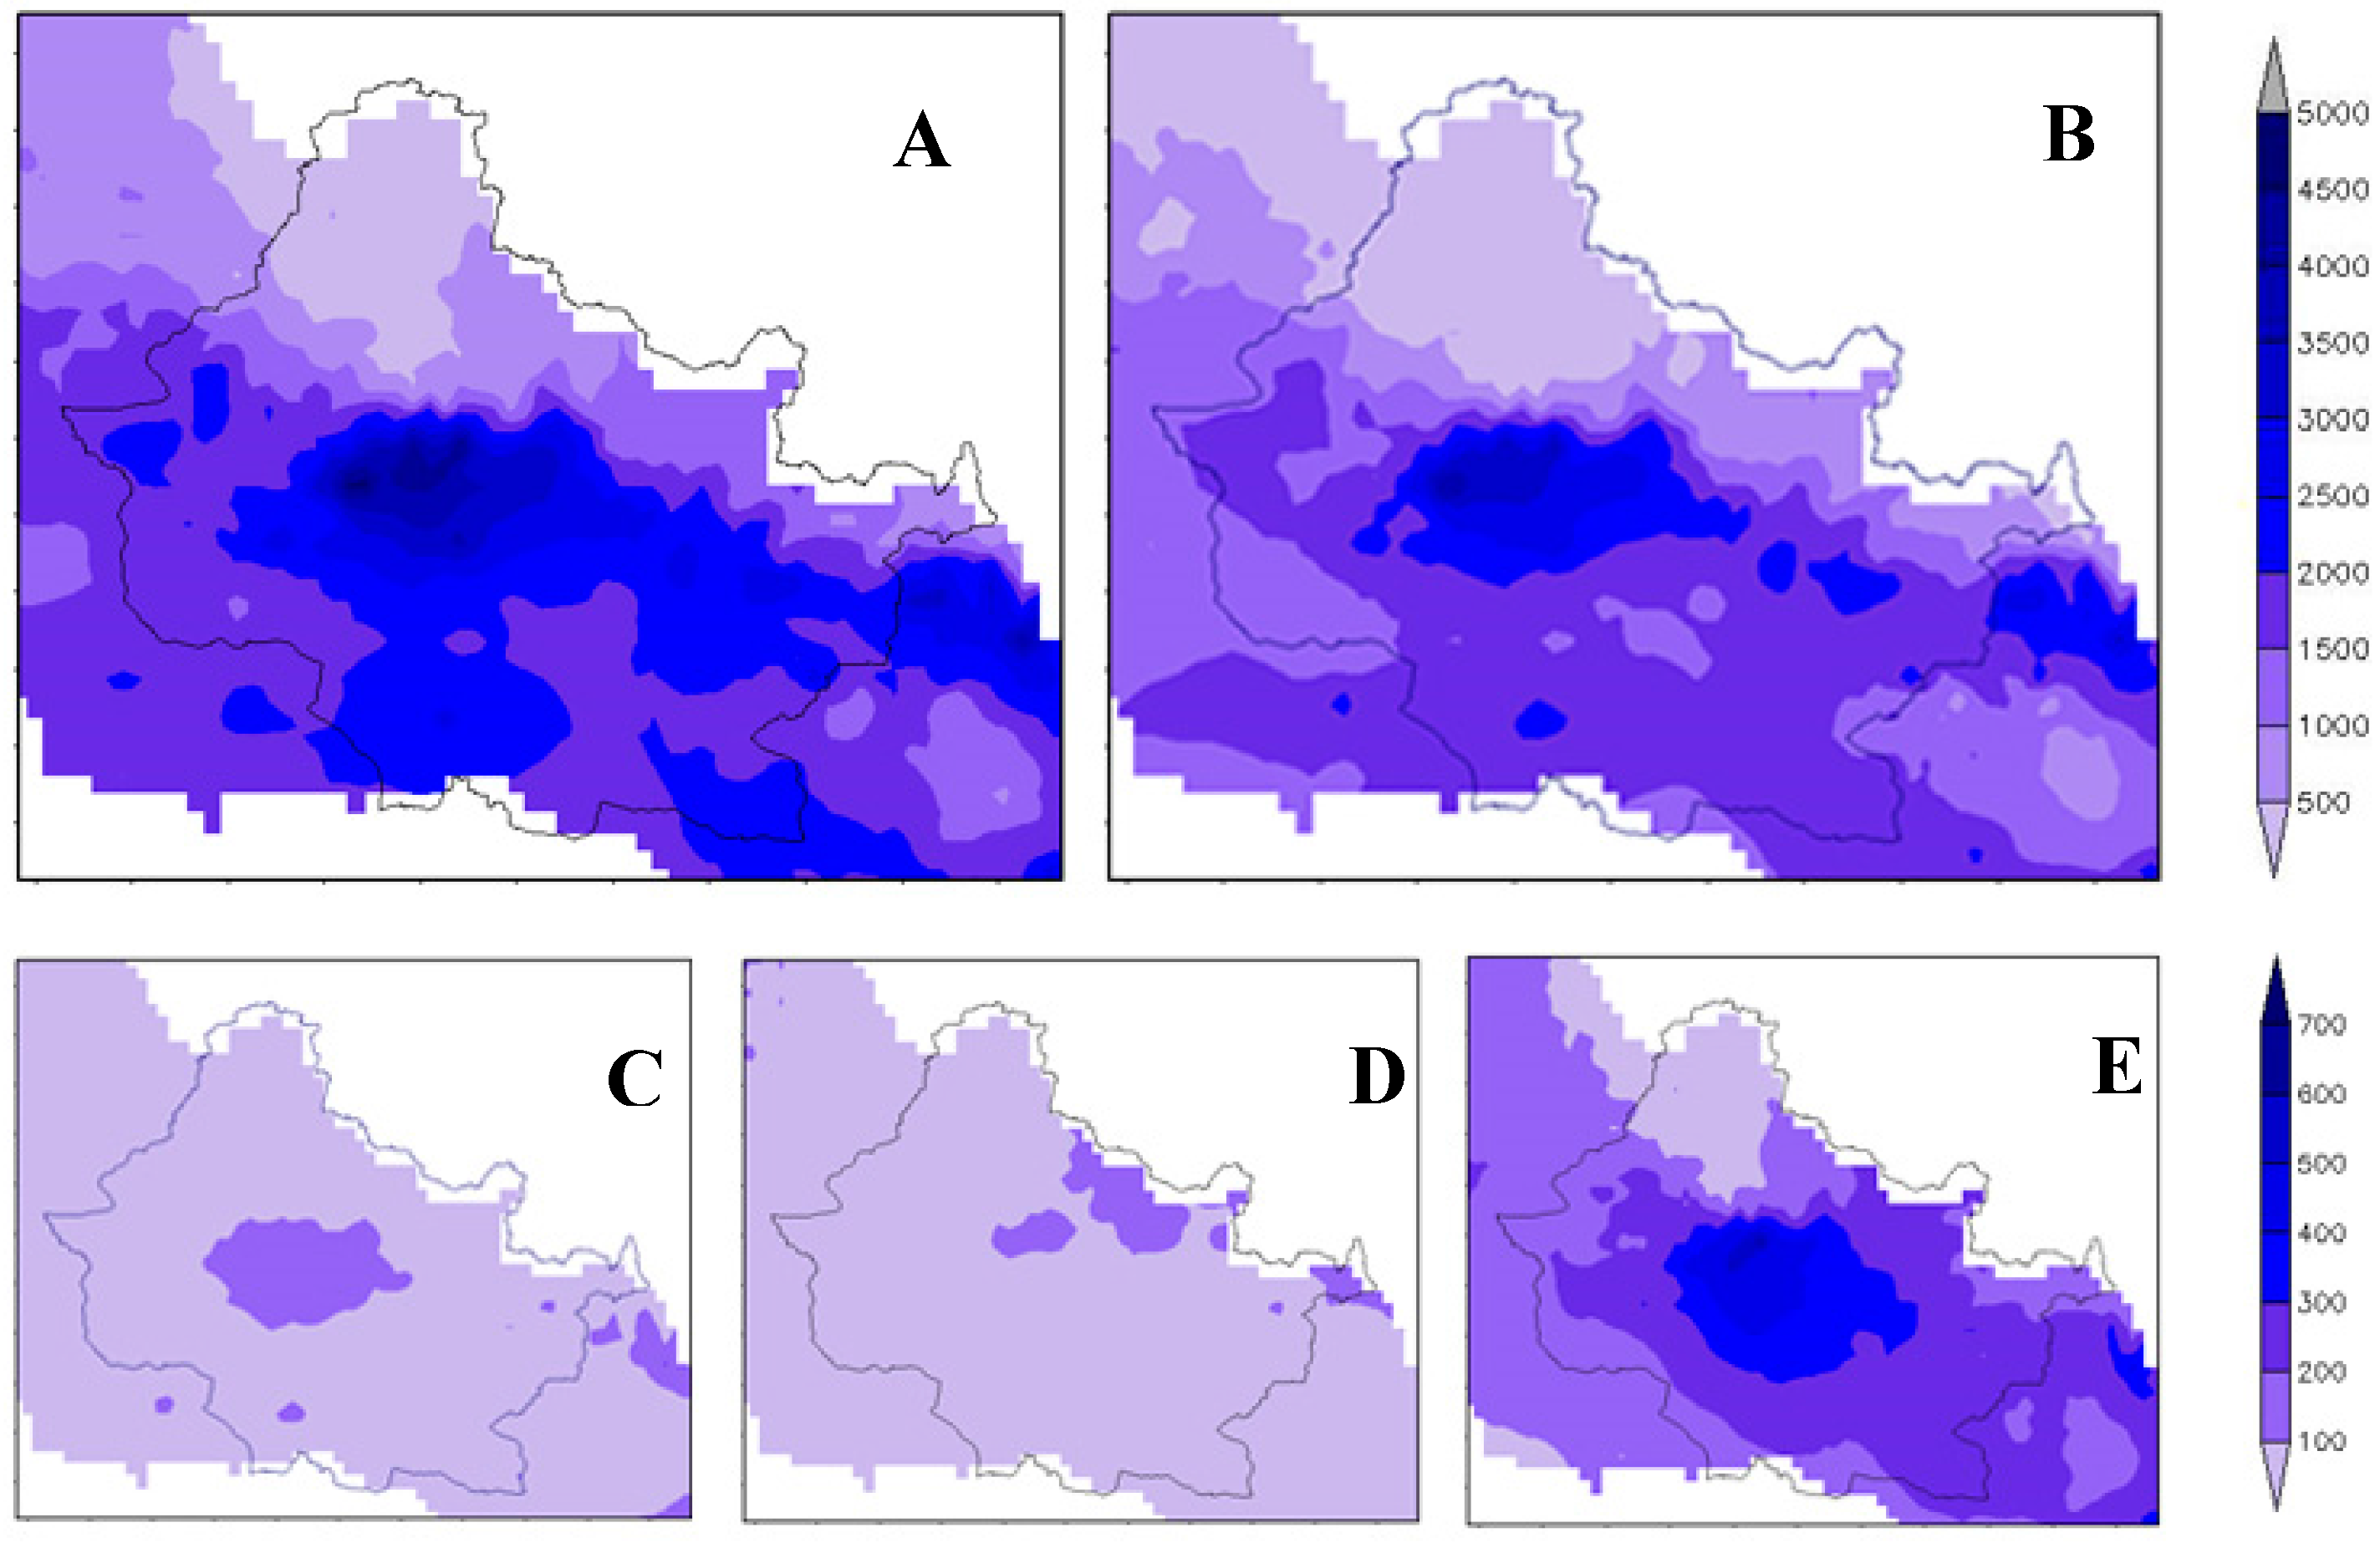
The average annual precipitation in the Gandaki River Basin ranged from 152 mm to 5493 mm according to the gridded APHRODITE dataset. The Hill region (Kaski, Tanahun districts) receives the highest amount of precipitation whereas the Trans-Himalaya region (Mustang, Manang districts) receives the lowest precipitation amount (Figure 2). July is the highest precipitation month followed by August in the Mountain, Hill and Terai regions, but the precipitation in the Trans-Himalaya is bi-modal, peaking in May and December. November is the lowest precipitation month for the regions other than the Trans-Himalaya. In GRB, 78% of the annual precipitation occurs in monsoon (June–September). The monsoon contribution is the highest in the Hill region (83%) and lowest in the Trans-Himalaya region (32%) as shown in Table 2 and Figure 3. The proportion of winter precipitation to the annual amount is the highest in Trans-Himalaya region (26%).
Post-monsoon and winter precipitation showed large year-to-year variation in all the zones. The greatest variation was found for post-monsoon precipitation in the Trans-Himalaya (coefficient of variation is 133.9%). The variability in annual precipitation was also highest for the Trans-Himalaya, whereas it is lowest for the Hills region. The monsoon precipitation pattern resembles the annual precipitation pattern (Figure 3) as it includes about 80% of the precipitation amount.
Figure 2. Monthly average precipitation in different agro-ecological zones of the Gandaki river basin.
Climate 03 00210 g002
Table 2. Average seasonal and annual precipitation and their coefficients of variation (CV) in different agro-ecological zones of the GRB. The values in parenthesis are CV in percentage.
Agro-Ecological ZoneWinter (mm)Pre-Monsoon (mm)Monsoon (mm)Post-Monsoon (mm)Annual (mm)
Trans Himalaya61.7 (56.5)102.7 (34.0)342.9 (30.6)40.1 (133.9)547.4 (25.0)
Mountain123.1 (104.6)198.6 (60.4)1100.9 (20.8)73.1 (85.1)1495.7 (21.5)
Hill21.4 (60.5)381.6 (24.9)2880.9 (11.6)124.0 (48.3)3468.6 (10.3)
Terai46.8 (85.7)219.7 (36.3)1601.6 (22.0)82.6 (81.5)1950.7 (21.9)
GRB (Basin average)63.2 (72.6)225.7 (21.17)1481.6 (11.8)79.9 (61.6)1865.6 (10.7)
Figure 3. Average precipitation in mm (1961–2004) over the Gandaki river basin from APHRODITE high resolution (0.05° × 0.05°) data for (A) annual; (B) monsoon; (C) post-monsoon; (D) winter; and (E) pre-monsoon seasons.
Climate 03 00210 g003

3.2. Precipitation Change

Trends of annual as well as seasonal precipitation are presented for different agro-ecological zones and for the whole GRB (Table 3). Annual precipitation showed a decreasing trend for Trans-Himalaya, Mountain and Terai whereas it showed increasing trend for Hill, though none of the trends were statistically significant. The Mountain region shows the largest decreasing trend (−6.293 mm/year) in annual precipitation. Averaging over the entire basin, monsoon precipitation showed an increasing trend whereas winter, pre-monsoon, post-monsoon and annual precipitation showed decreasing trends. The decreasing trends in winter and pre-monsoon were found to be statistically significant (Table 3). The post-monsoon precipitation in Trans-Himalaya, winter and pre-monsoon precipitation in Mountain and winter precipitation in Hill showed significantly decreasing trends. Interestingly, monsoon is the season which shows increasing trend in all the zones, although none of these trends were statistically significant.
Table 3. The annual and seasonal trend in precipitation (mm/year) in different agro-ecological zones of the GRB.
Agro-Ecological ZoneWinterPre-MonsoonMonsoonPost-MonsoonAnnual
Trans-Himalaya−0.619−1.022+1.898−0.927 *−1.654
Mountain−4.717 ***−4.675 **+2.586−0.713−6.293
Hill−0.425 ++−0.218+3.233−0.128+2.745
Terai−0.580+0.908+0.168−0.435−0.362
Average basin−1.458 **−1.987 *+0.419−0.619−4.267
*** Trend at α = 0.001 level of significance; ** Trend at α = 0.01 level of significance; * Trend at α = 0.05 level of significance; ++ Trend at α = 0.1 level of significance.
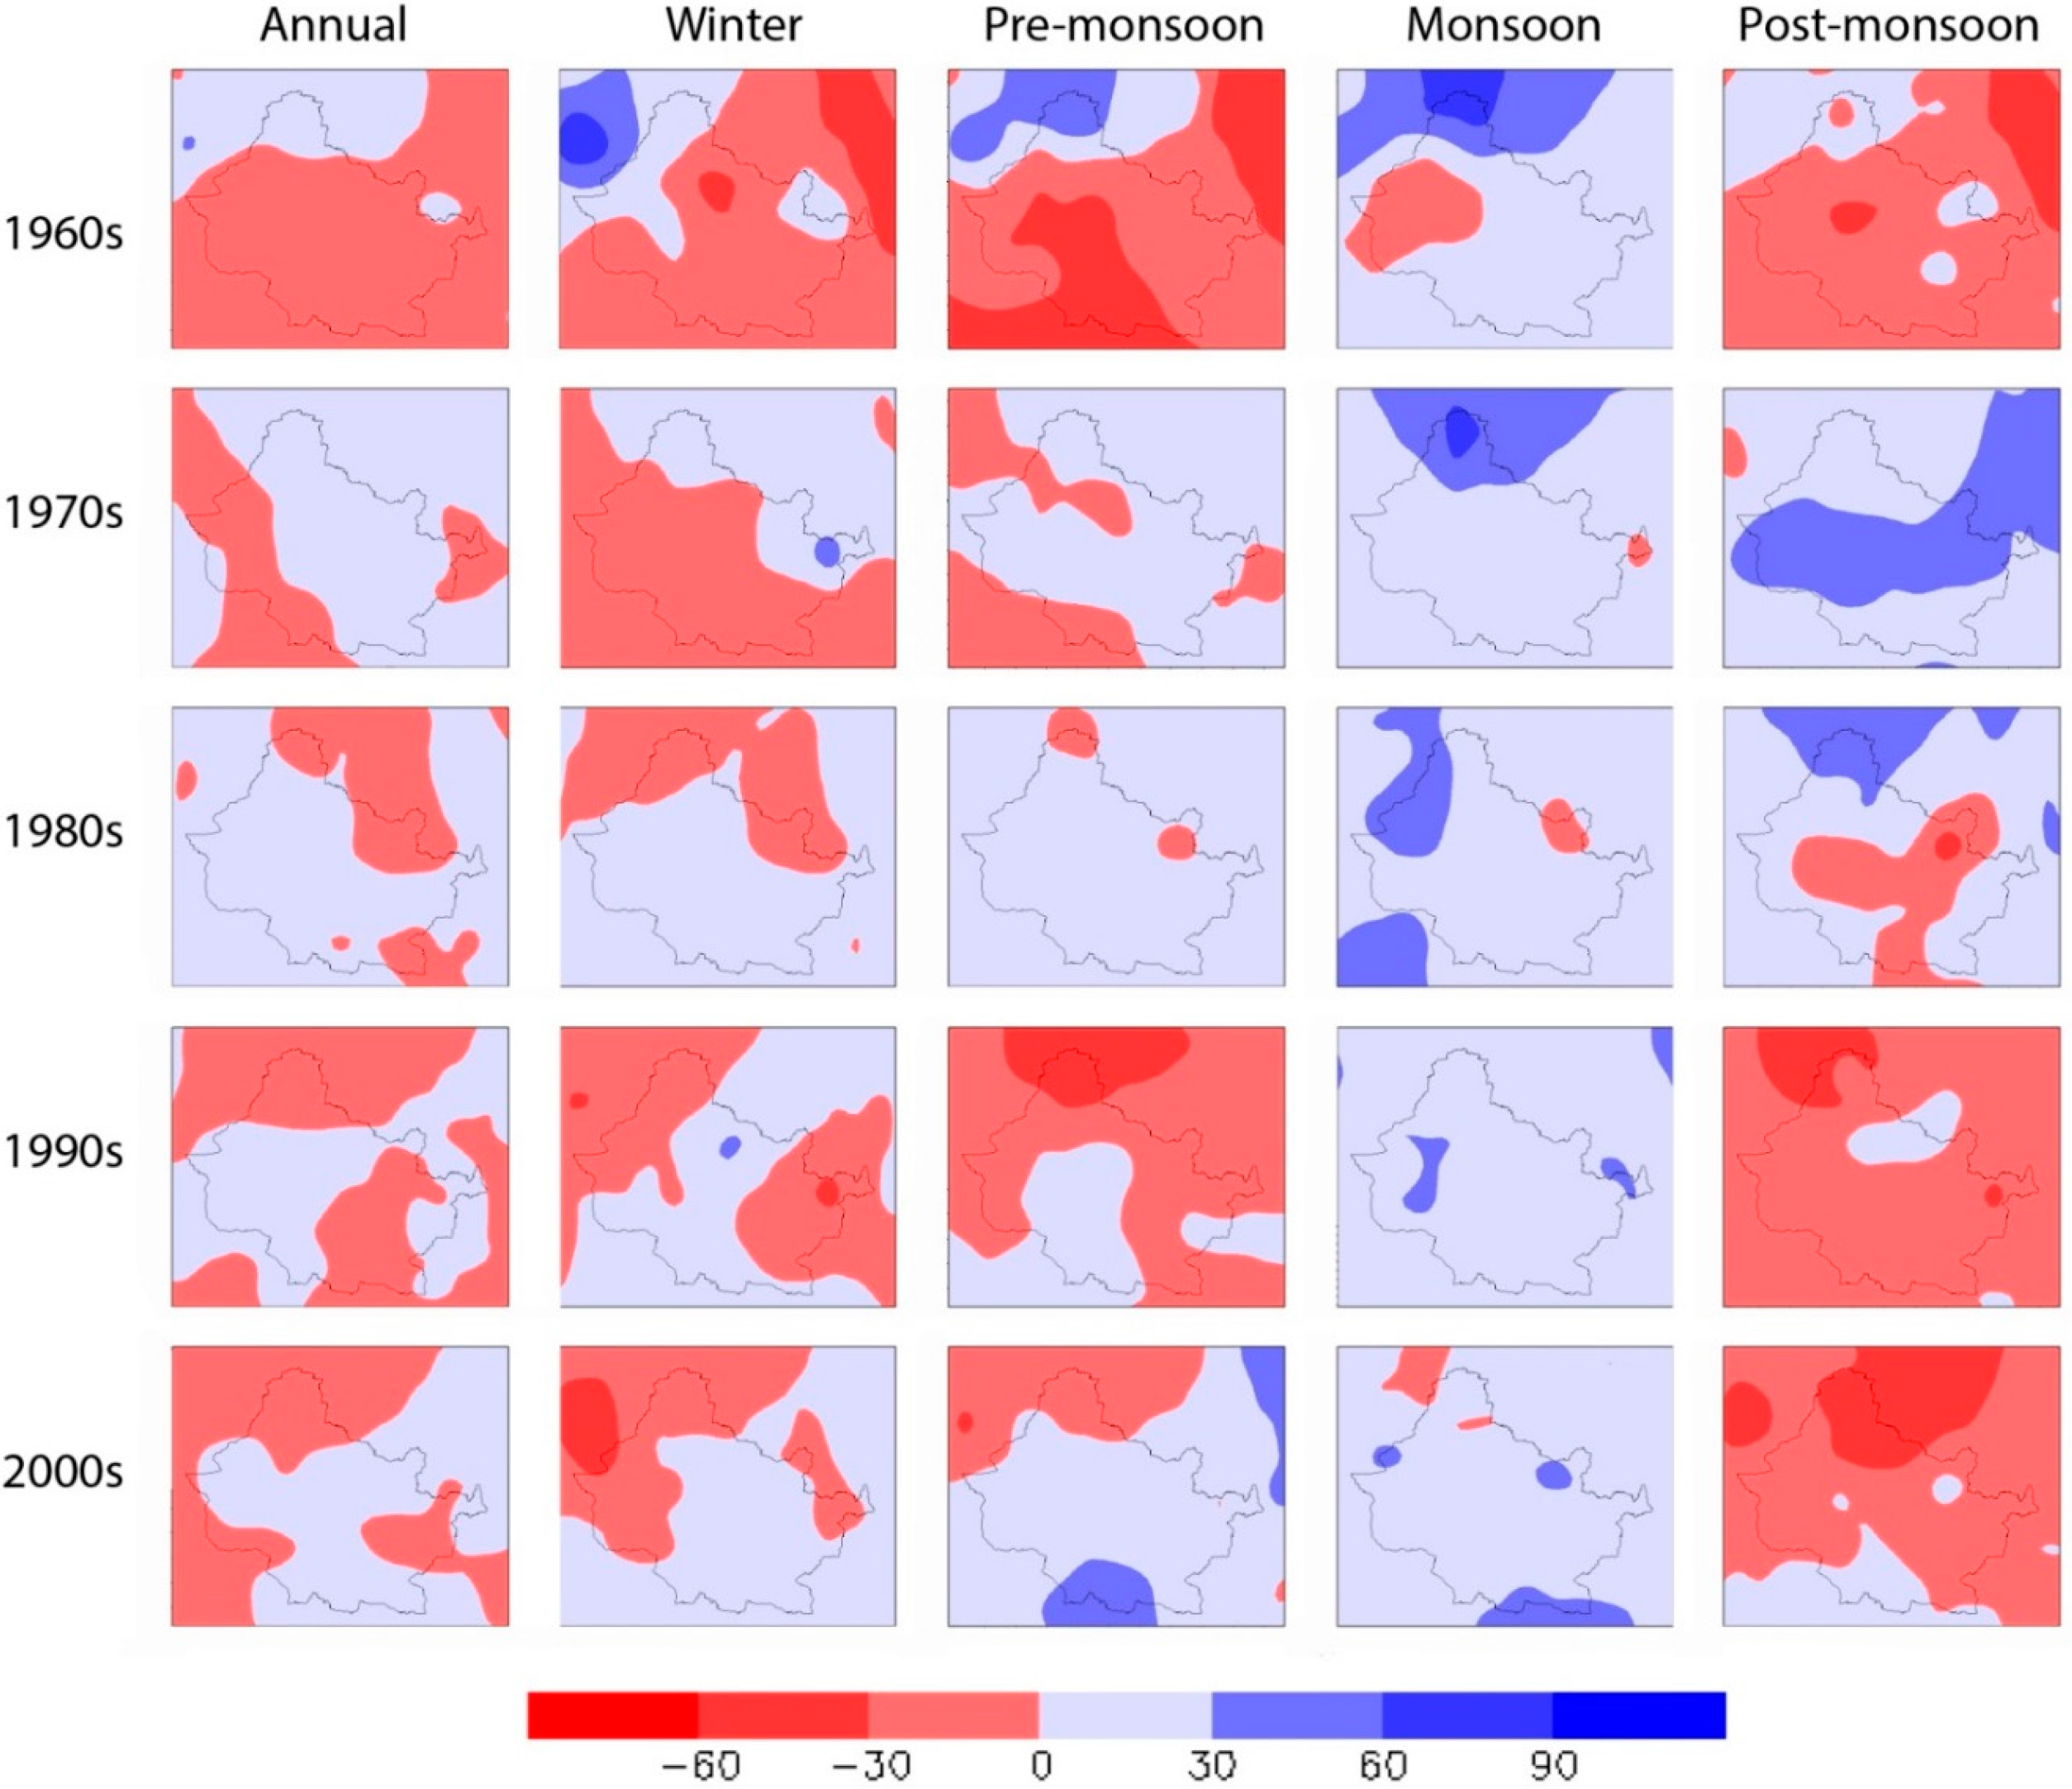
Figure 4. Annual and seasonal precipitation anomaly (%) in different decades from APHRODITE 0.25° × 0.25° resolution precipitation product. The baseline period was considered the whole period of data availability (1961–2007).
Climate 03 00210 g004
The precipitation anomaly maps for different decades were consistent with the winter and post-monsoon precipitation decreasing but the monsoon precipitation increasing, although with changing spatial patterns of anomalies (Figure 4). The post-monsoon precipitation was high in the 1970s and 1980s compared to the 1960s, suggesting that our analysis of the station records beginning in 1981 may miss some longer-term precipitation variability that is not necessarily linear in time.
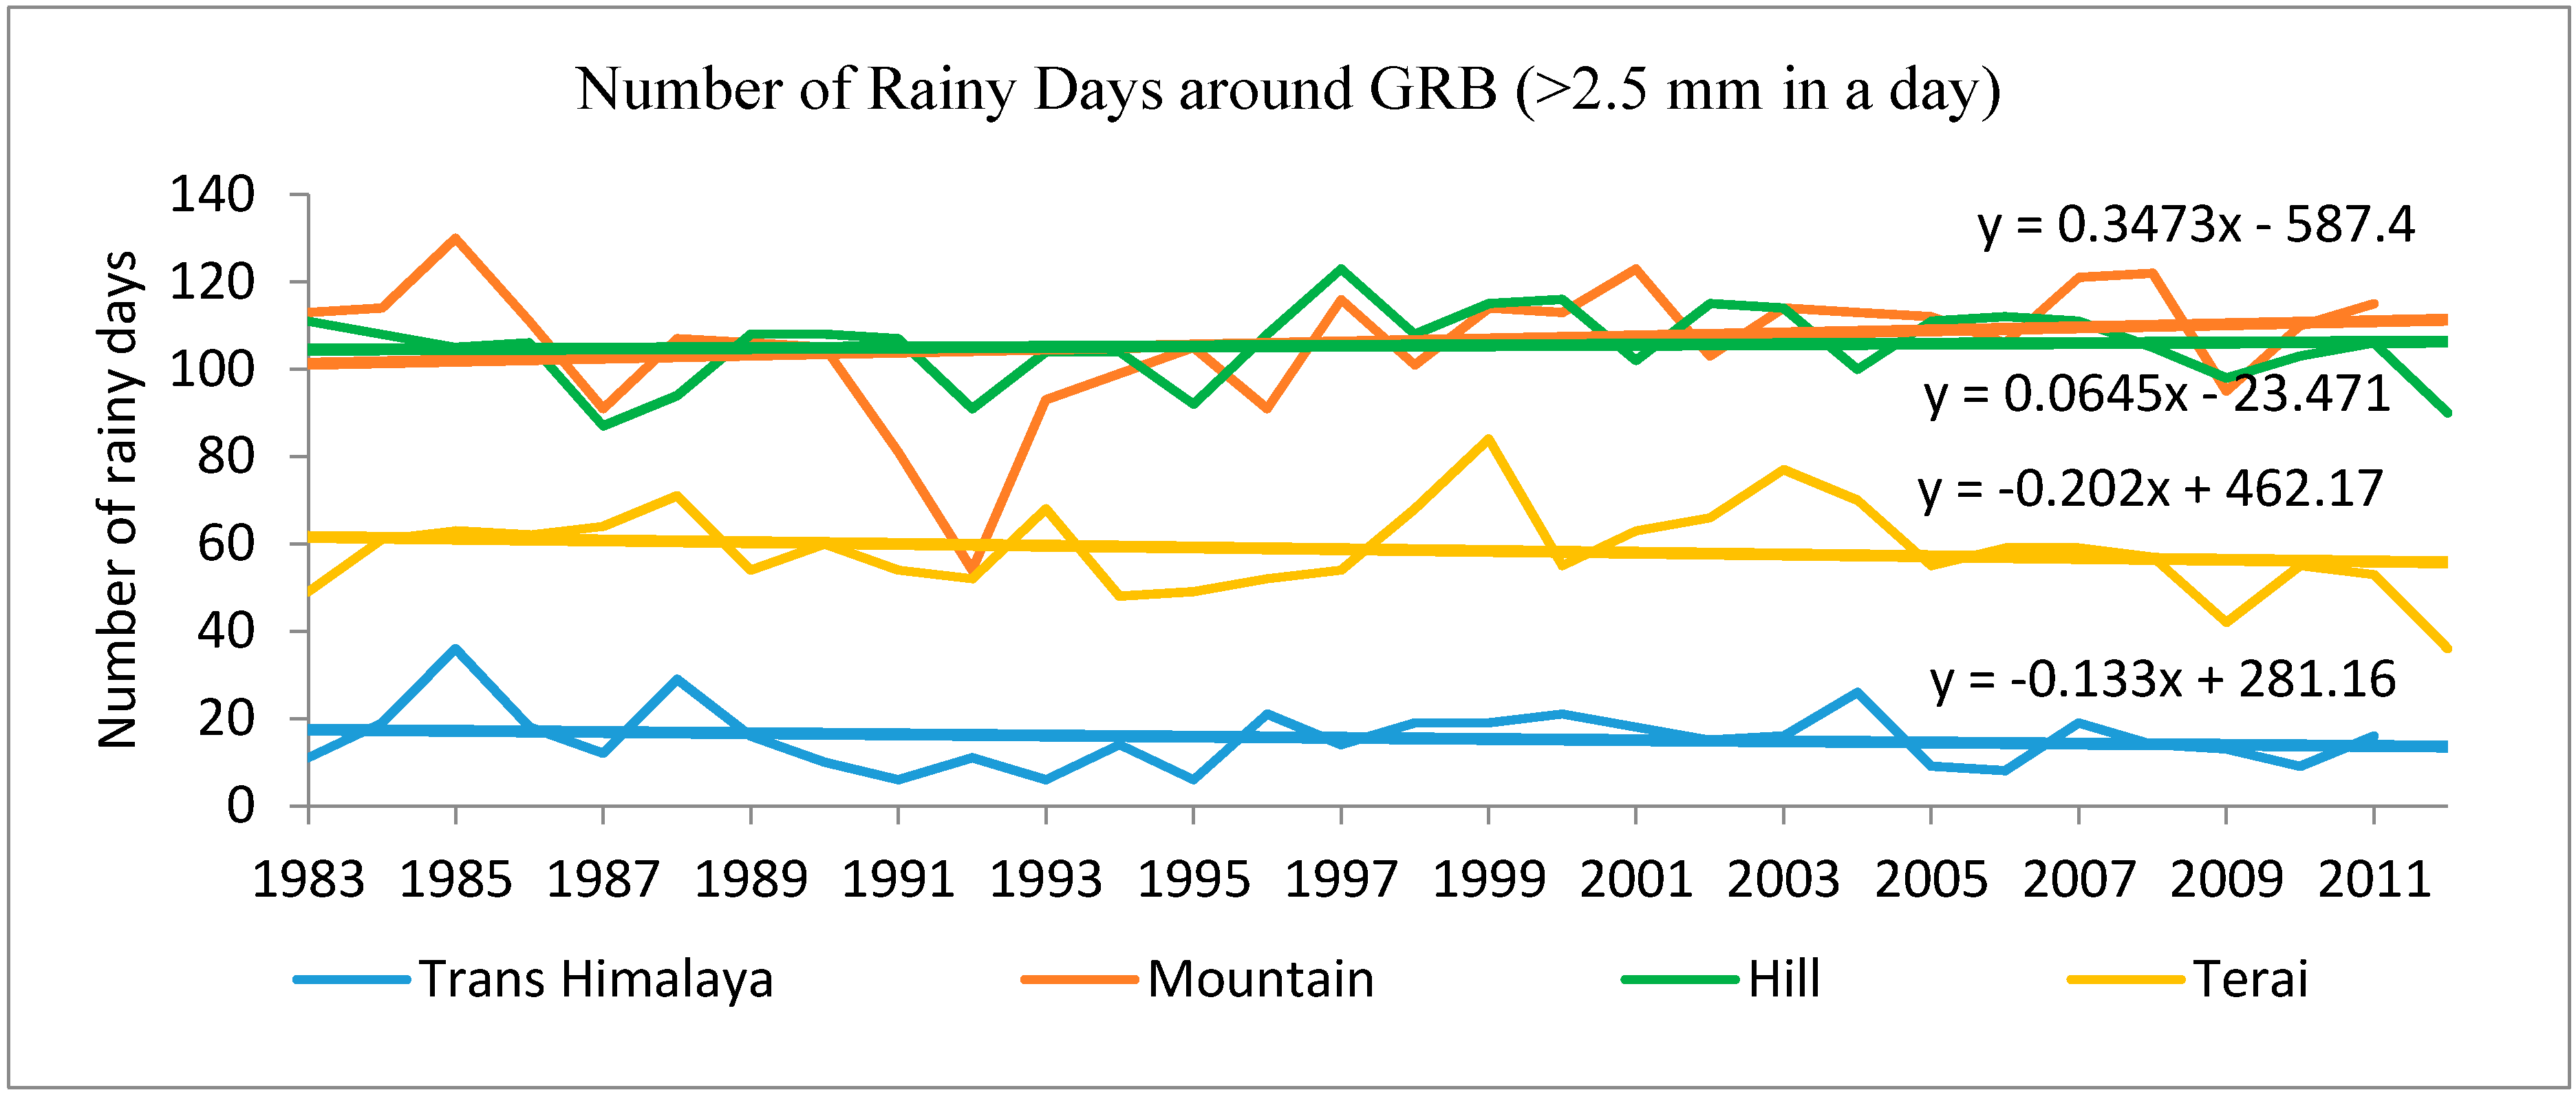
Figure 5. Number of rainy days in different agro-ecological zones of the GRB.
Climate 03 00210 g005
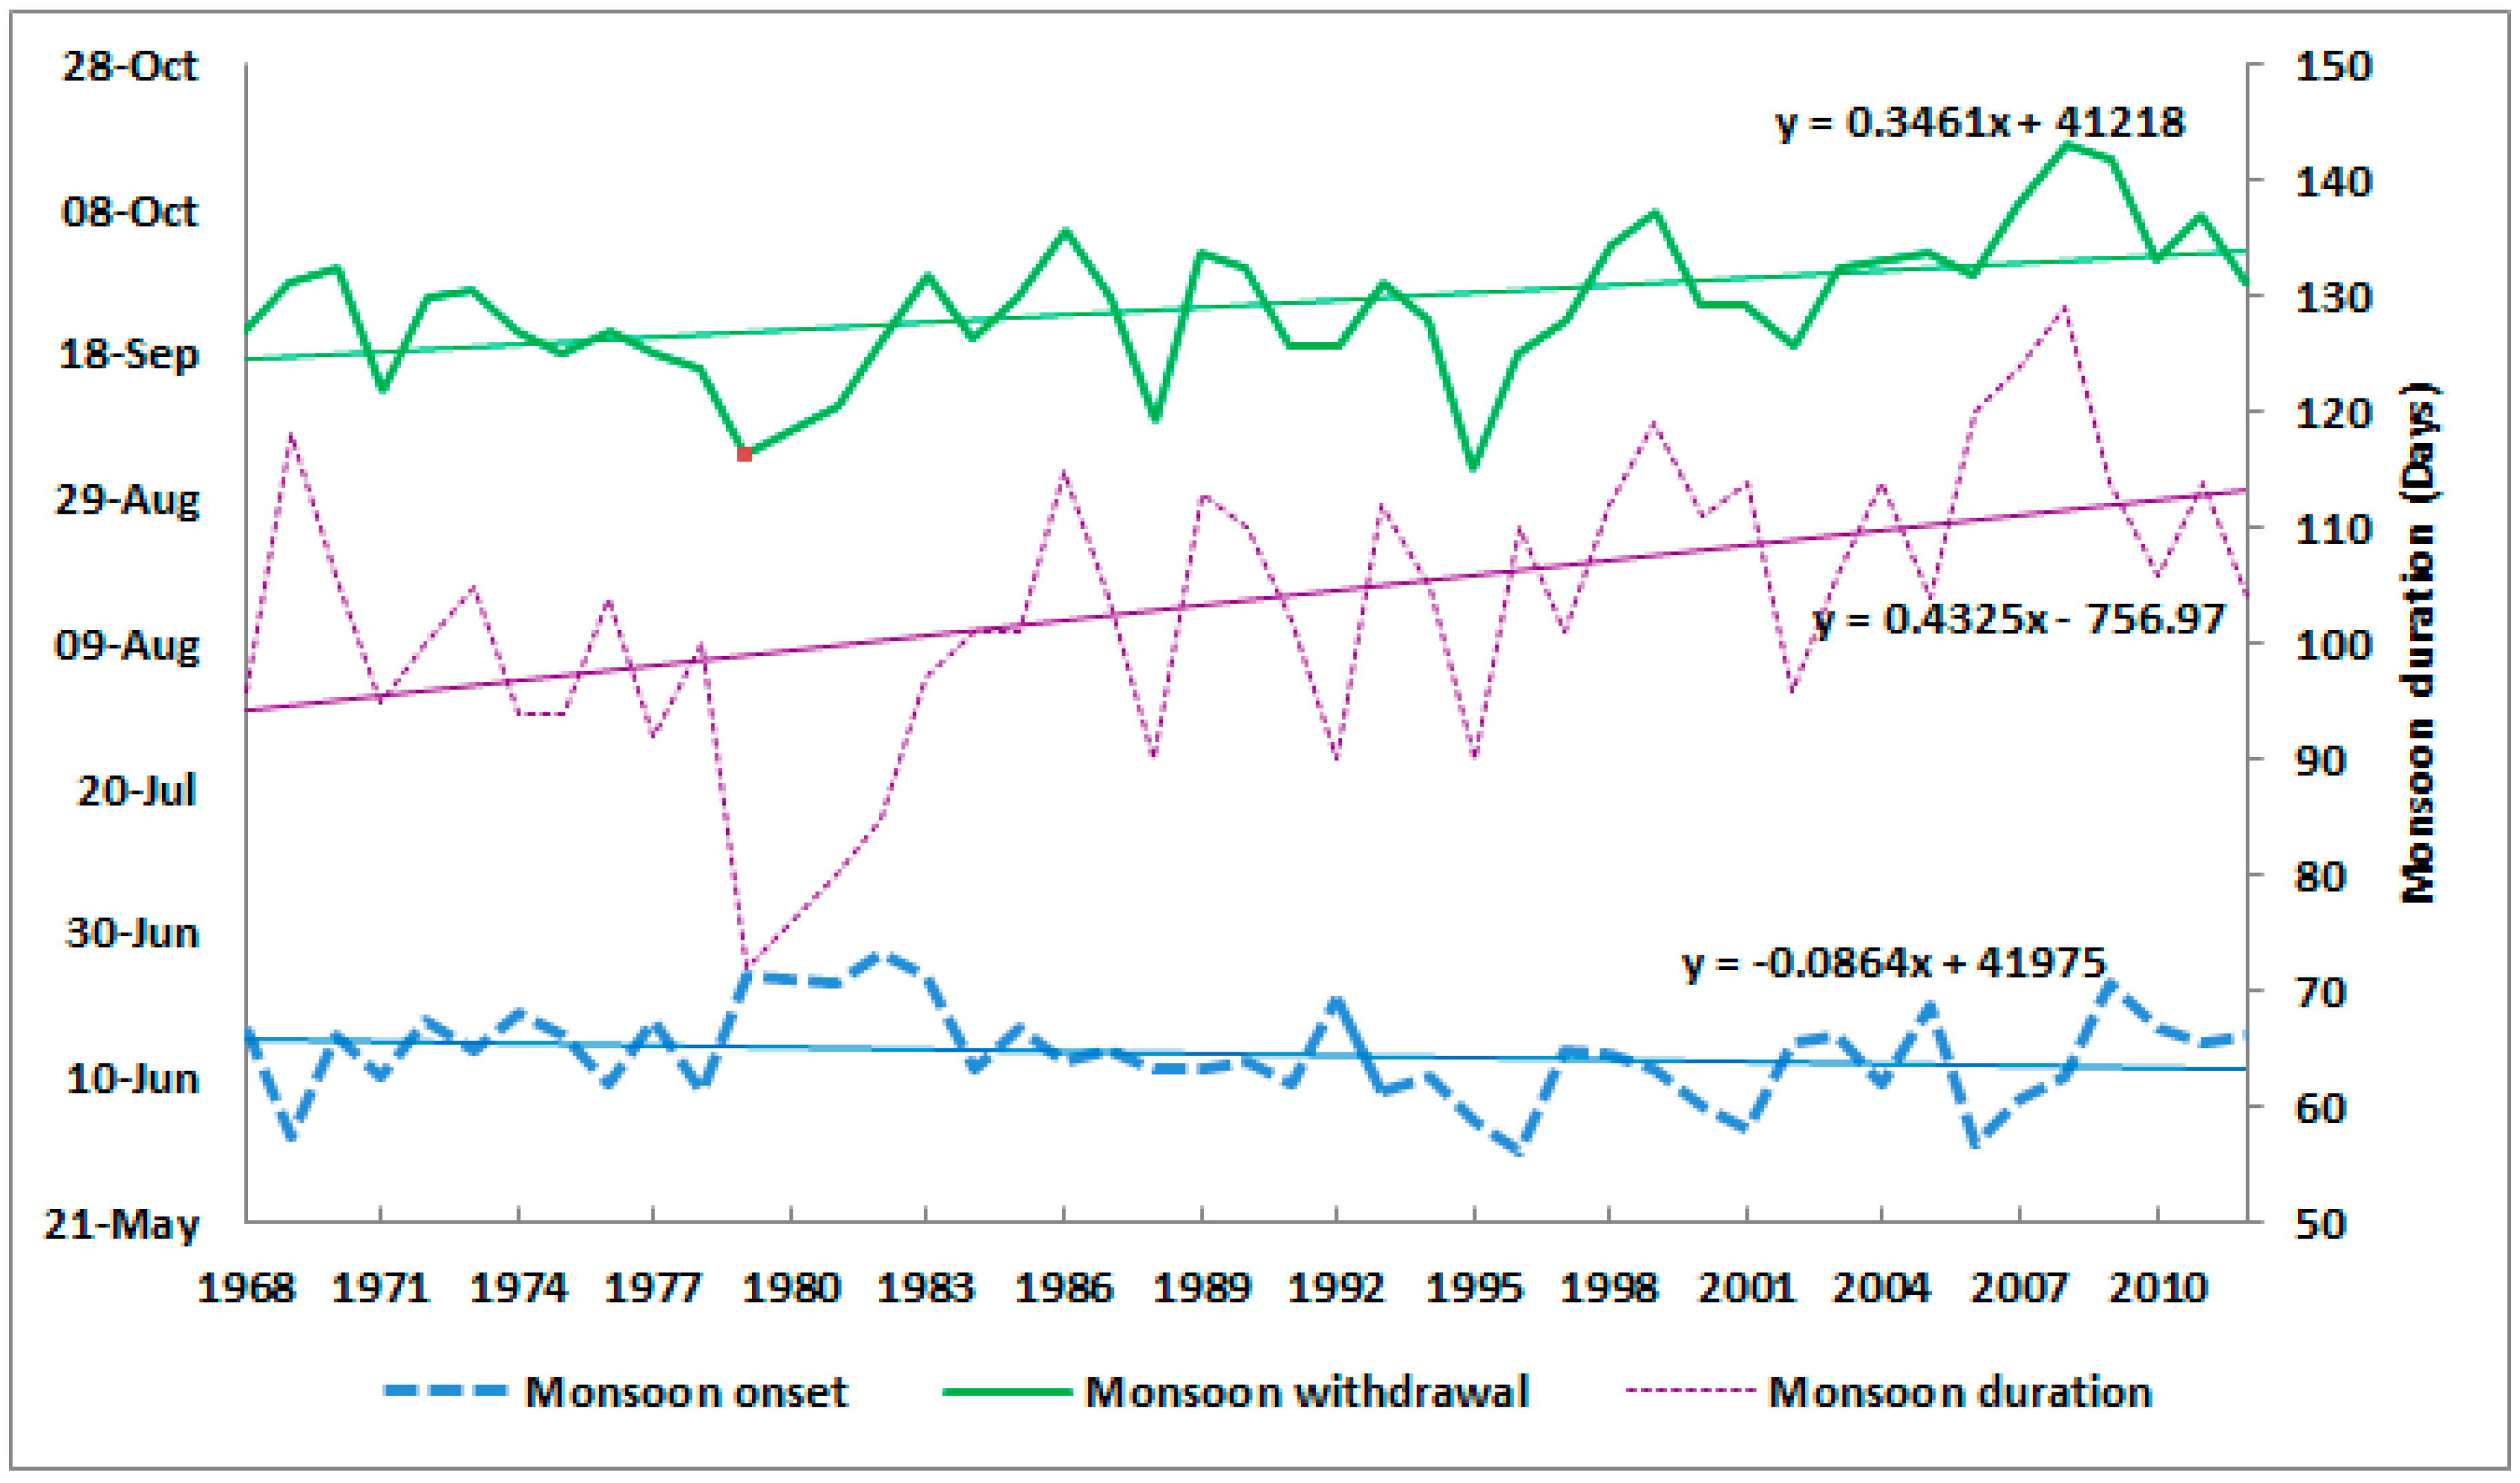
Figure 6. Monsoon onset, withdrawal and duration in Nepal.
Climate 03 00210 g006

3.3. Rainy Days

Figure 5 showed that the Mountain and Hill regions have the highest number of rainy days (106 days in a year on average) while the Trans-Himalaya has the lowest number of rainy days (16 days in a year on average). The rate of change in number of rainy days was negative in Terai and Trans-Himalaya regions, but positive for Hill and Mountain regions; these trends were not statistically significant.

3.4. Monsoon Onset and Withdrawal

From the long-term data, the mean summer monsoon onset date for Nepal is June 10 and the withdrawal date is 23 September. There was no significant trend on the summer monsoon arrival but there was a significant trend toward delay in departure (about a half day per year), therefore, the duration of the monsoon is increasing at the rate of five days per ten years (Figure 6).

4. Discussions

The GRB receives 78% of annual precipitation in the summer monsoon season, and the contribution of monsoon precipitation was the highest in Hill and Mountain and lowest in Trans-Himalaya regions. In general, Nepal receives 80% of the total annual precipitation in monsoon season [8]. The lower proportion of monsoon precipitation in the Trans-Himalaya region is due to the fact that this region lies in the leeward side of the Himalayan Massif. This region receives winter precipitation under the influence of western disturbances. The Gandaki River Basin receives the highest amount of precipitation in July followed by August for all the regions except the Trans-Himalaya, which shows peaks in May and December.
The comparison of total annual precipitation across agro-ecological zones showed that the Hill region receives the highest annual precipitation and the Trans-Himalaya receives the lowest. The same pattern applied for monsoon precipitation. The Pokhara and Lumle areas that receive the highest amount of precipitation in the country [38] lie in the Hill region of this basin. These areas are on the windward side of the Annapurna-Machhapuchhre mountain range. On the contrary, Manang and Mustang districts, which receive the lowest amount of precipitation in the country [39], lie in the leeward side of these mountains in the Trans-Himalaya region of the GRB. In high mountain areas, the local topography also plays an important role [40] in precipitation amount. One additional contributor for the low amount of precipitation measured in the Trans-Himalaya region may be the under-estimation of snowfall by both surface rain gauges and remote sensing [10].
The coefficient of variation in the amount of precipitation averaged for the whole GRB basin was highest for winter season, followed by the post-monsoon. The amount of precipitation in the monsoon season was the most stable. When we compare variability across agro-ecological zones and seasons, Trans-Himalaya had the greatest variability in the post- monsoon season followed in Mountain in the winter season. These patterns are related to the sporadic nature of the precipitation patterns in these seasons, which are dominated by the precipitation associated with the tropical disturbances during post-monsoon season and by western disturbances in the winter season. During winter season, occasional strong northeasterly winds from the Siberian High bring precipitation or snow across all agro-ecological zones, but particularly high-altitude areas [41].
The analysis of precipitation trends for different seasons across different agro-ecological zones revealed that the monsoon precipitation is increasing whereas precipitation in other seasons is decreasing, although most of these trends for 1981–2012 are not statistically significant (Table 3). These trends are consistent with previous studies [9,17,42] that report spatial variations in the precipitation in the Nepal and in the Himalayas. It is interesting to note that the precipitation records over the monsoon region around the globe reveal a decreasing trend [43], unlike what is seen in Nepal. In this study, the annual precipitation showed a large decreasing trend of 6.3 mm per year in the Mountain region though the trend was not significant. This is also supported by the findings of Shrestha et al. 2000 [42] for the entire Nepal. The trends for annual precipitation indicate that the dry parts of the basin (Trans-Himalaya and Mountain) could become even dryer as there is decreasing trend and the wet parts (Hill region) could become even wetter as they show an increasing trend. Both of these patterns can affect the livelihood of the people in the region.
The precipitation analysis shows that the recent decades (1990s and 2000s) are dryer than earlier decades. Decadal anomalies in precipitation within the basin range from −60% to +90%. The 1970s followed by 1980s are the wettest decades in terms of annual precipitation for the Gandaki River Basin as a whole. Increased amount of precipitation in monsoon may increase the severity of water-induced disasters, such as landslides in the Hill region and floods in the lowland region of the basin. An increased frequency and intensity of extreme precipitation events may cause flash floods [44]. In the Hill region, the annual precipitation rate is increasing but the number of rainy days does not show any trend, indicating more heavy precipitation events. Fragile and sensitive geology, deforestation and the heavy precipitation make the Hill region very susceptible for soil erosion and landslides [45,46,47]. The decreasing post-monsoon precipitation may adversely affect paddy rice production as this time coincides with the sensitive stage of the paddy (season for spikelet formation, fruiting and ripening) that demands more water [48]. In addition, the decreasing winter precipitation may lead to failure of winter crops such as wheat, barley and potatoes.
The monsoon onset (arrival date) does not show any significant trend but the withdrawal (departure date) is delaying, making the duration of summer monsoon period longer. An earlier study for Nepal found that the number of rainy days is decreasing but the total amount of annual precipitation does not show any trend [49]. This can be attributed to intense precipitation in rainy days accompanied by prolonged drought. Although the harvesting and planting times of crops vary across agro-ecological zones, the farming system is strongly dependent on the timely arrival of monsoon rain and its distribution [50]. Rising temperatures in combination with increasing precipitation anomalies can influence soil moisture, ultimately affecting the crop production and livelihood of the people depending upon rain-fed agriculture.
It is important to understand spatial and temporal patterns of precipitation from a hydro-climatological perspective for regional water resource management [51] and also for socioeconomic reasons [38]. Due to the higher number of rain gauge stations compared to temperature measurements, precipitation trends could be particularly useful to assess climatic changes in the higher Himalayas [52]. This study could be a first step for planning and development of water resources in the GRB and could be a model to study precipitation patterns in the basins with diverse topography [53].

5. Conclusions

Topography and altitude play dominant roles in precipitation distribution in Nepal. This study contributes to understanding the spatial and temporal pattern of precipitation and its trends across different agro-ecological zones of GRB. The belts considered in this study represent all the agro-ecological zones of Nepal and the Himalayan region. There was considerable variation in the trend of precipitation for a particular season across different regions and at the same time seasonal variation in precipitation trends is also noticeable. Studies in adjacent basins (such as Koshi to the east and Karnali to the west) are needed to confirm whether the characteristics of trends are similar to those found in the GRB. Within the basin, the Trans-Himalaya region gets the lowest amount of precipitation whereas the Hill and Mountain regions receive the most annual precipitation. The trends of the precipitation across different seasons and regions suggest that dry parts and seasons of the basin could become even dryer as there is decreasing trend and the wet parts and seasons could become even wetter, although over the 32-year period tested most precipitation trends were not statistically significant, reflecting high inter-annual and decadal variability. The arrival date for monsoon in Nepal has not changed, but the withdrawal is getting later. The increase in annual total amount of precipitation without increasing the number of rainy days suggests that there are more occurrences of intense precipitation. This suggest that the wet regions are likely to face more precipitation induced disasters such as landslides and floods while the decreasing trends for post-monsoon and winter seasons indicate that winter crops are likely to suffer from soil moisture deficiency. These precipitation trends might therefore have several socio-economic implications in the basin. These findings are useful for the planning and development of water resources and to design coping strategies. Furthermore, similar analysis methods could be applied to the other mountainous river basins to explore the spatial and temporal variability of precipitation.

Acknowledgment

Department of Hydrology and Meteorology (DHM), the government of Nepal, is highly acknowledged for providing the observed precipitation data. The Research Institute for Humanity and Nature (RIHN) is very much acknowledged for providing the high resolution APHRODITE data for Nepal. This work is part of a collaborative research project supported by the USAID; Feed the Future Innovation Lab for Collaborative Research on Adapting Livestock Systems to Climate Change at Colorado State University under sub-award 9650-32. All statements made are the views of the authors and not the opinions of the funders or the US government.

Author Contributions

Jeeban Panthi designed the entire research concept, collected and analyzed data and led for manuscript writing. Piyush Dahal analyzed the data and Ram Chandra Karki involved in research designing. Nir Krakauer, Soni M. Pradhanang and Suman Aryal were engaged in manuscript writing; Madan L. Shrestha, Tarendra Lakhankar, Ajay Jha and Mohan Sharma reviewed the manuscript and provided critical feedback.

Appendix

Figure A1. Validation of the APHRODITE two resolution (0.05° × 0.05° and 0.25° × 0.25°) monthly precipitation (mm) product with the ground observation from DHM stations (x-axis is for APHRODITE and y-axis is for DHM for all the graphs below).
Climate 03 00210 g007aClimate 03 00210 g007b

Conflicts of Interest

The authors declare no conflict of interest.

References

  1. IPCC. Summary for Policymakers, in Climate Change 2007: Impacts, Adaptation and Vulnerability; Cambridge University Press: Cambridge, UK, 2007; p. 1000. [Google Scholar]
  2. Locky, H.; Mackey, B. The nature of climate change: Reunite international climate change mitigation efforts with biodiversity conservation and wilderness protection. Int. J. Wilderness 2009, 15, 7–14. [Google Scholar]
  3. Xu, H.; Taylor, R.G.; Xu, Y. Quantifying uncertainty in the impacts of climate change on river discharge in sub-catchments of the yangtze and yellow river basins. Hydrol. Earth Syst. Sci. 2011, 15, 333–344. [Google Scholar] [CrossRef]
  4. Nijssen, B.; O’Donnell, G.M.; Hamlet, A.F.; Lettenmaier, D.P. Hydrologic sensitivity of global rivers to climate change. Clim. Change 2001, 50, 143–175. [Google Scholar] [CrossRef]
  5. Shelton, M.L. Hydroclimatology Perspective and Applications; Cambridge University Press: Cambridge, UK, 2009; p. 436. [Google Scholar]
  6. Barry, R.G. Changes in mountain climate and glacio-hydrological responses. Mt. Res. Dev. 1990, 10, 161–170. [Google Scholar] [CrossRef]
  7. Singh, S.P.; Khadka, B.; Karky, B.S.; Sharma, E. Climate Change in the Hindu Kush-Himalayas: The State of Current Knowledge; ICIMOD: Kathmandu, Nepal, 2011. [Google Scholar]
  8. Shrestha, M.L. Interannual variation of summer monsoon rainfall over Nepal and its relation to southern oscillation index. Meteorol. Atmos. Phys. 2000, 75, 21–28. [Google Scholar] [CrossRef]
  9. Xu, J.; Grumbine, R.E.; Shrestha, A.; Eriksson, M.; Yang, X.; Wang, Y.; Wilkest, A. The melting Himalayas: Cascading effects of climate change on water, biodiversity, and livelihoods. Conservat. Biol. 2009, 23, 520–530. [Google Scholar] [CrossRef]
  10. Ménégoz, M.; Gallée, H.; Jacobi, H.W. Precipitation and snow cover in the Himalaya: From reanalysis to regional climate simulations. Hydrol. Earth Syst. Sci. 2013, 17, 3921–3936. [Google Scholar] [CrossRef]
  11. Ramesh, V.K.; Goswami, P. Assessing reliability of regional climate projections: The case of Indian monsoon. Sci. Rep. 2014, 4. [Google Scholar] [CrossRef] [PubMed]
  12. Chalise, S.R. Management of water resources for poverty alleviation in the Hindu-Kush Himalayas. In FRIEND2002-Regional Hydrology; IAHS Press: Wallingford, UK, 2002; pp. 27–34. [Google Scholar]
  13. Krakauer, N.; Lakhankar, T.; Pradhanang, S.; Jha, A. Evaluating satellite products for precipitation estimation in Nepal. Remote Sens. 2013, 5, 4107–4123. [Google Scholar] [CrossRef]
  14. Rangwala, I.; Miller, J.R. Climate change in mountains: A review of elevation-dependent warming and its possible causes. Clim. Change 2012, 114, 527–547. [Google Scholar] [CrossRef]
  15. Immerzeel, W.W.; Beek, P.H.V.; Konz, M.; Shrestha, A.B.; Bierkens, M.F.P. Hydrological response to climate change in a glacierized catchment in the Himalayas. Clim. Change 2012, 110, 721–736. [Google Scholar] [CrossRef]
  16. Duan, K.; Thompson, L.G.; Yao, T.; Davis, M.E.; Mosley-Thompson, E. A 1000 year history of atmospheric sulfate concentrations in southern Asia as recorded by a Himalayan ice core. Geophys. Res. Lett. 2007, 34. [Google Scholar] [CrossRef]
  17. Shrestha, A.B.; Aryal, R. Climate change in nepal and its impact on Himalayan glaciers. Reg. Env. Change 2010, 11, 65–77. [Google Scholar] [CrossRef]
  18. Sigdel, M.; Ikeda, M. Seasonal contrast in precipitation mechanisms over Nepal deduced. Nepal J. Sci. Technol. 2012, 13, 115–123. [Google Scholar]
  19. Ichiyanagi, K.; Yamanaka, M.D.; Muraji, Y.; Vaidya, V.K. Precipitation in Nepal between 1987–1996. Int. J. Climatol. 2007, 27, 1753–1762. [Google Scholar] [CrossRef]
  20. Islam, N.; Das, S.; Uyeda, H. Calibration of trmm derived rainfall over Nepal during 1998–2007. Open Atmos. Sci. J. 2010, 4, 12–23. [Google Scholar] [CrossRef]
  21. Tamrakar, B.; Alfredsen, K. Satellite based precipitation estimation for hydropower development. Hydro Nepal 2013, 12, 52–58. [Google Scholar] [CrossRef]
  22. Manandhar, S.; Pandey, V.P.; Kazama, F. Application of water poverty index (WPI) in nepalese context: A case study of Kali Gandaki River Basin. Water Resour. Manag. 2012, 26, 89–107. [Google Scholar] [CrossRef]
  23. Shrestha, M.S.; Artan, G.A.; Bajracharya, S.R.; Gautam, D.K.; Tokar, S.A. Bias-adjusted satellite-based rainfall estimates for predicting floods: Narayani basin. J. Flood Risk Manag. 2011, 4, 1–14. [Google Scholar] [CrossRef]
  24. Yatagai, A.; Arakawa, O.; Kamiguchi, K.; Hamada, A.; Yasutomi, N.; Kitoh, A. Aphrodite: Constructing a long-term daily gridded precipitation dataset for Asia based on a dense network of rain gauges. Bull. Atmos. Meteor. Soc. 2012, 93, 1401–1415. [Google Scholar] [CrossRef]
  25. Kendall, M.G. Rank Correlation Method; Griffin: London, UK, 1975. [Google Scholar]
  26. Mann, H.B. Nonparametric tests against trend. Econometrica 1945, 13, 245–259. [Google Scholar] [CrossRef]
  27. Keuser, A.P.M. Precipitation patterns and trends in the metropolitan area of Milwaukee, Wisconsin. Int. J. Geospat. Environ. Res. 2014, 1, 1–14. [Google Scholar]
  28. Shrestha, A.B.; Wake, C.P.; Mayewski, P.A. Maximum temperature trends in the Himalaya and its vicinity: An analysis based on temperature records from nepal for the period 1971–94. Am. Meteorol. Soc. 1999, 12, 2775–2786. [Google Scholar]
  29. Toreti, A.; Fioravanti, G.; Perconti, W.; Desiato, F. Annual and seasonal precipitation over Italy from 1961 to 2006. Int. J. Climatol. 2009, 29, 1976–1987. [Google Scholar] [CrossRef]
  30. Zhang, Q.; Xu, C.Y.; Zhang, Z.; Chen, Y.D.; Liu, C.L. Spatial and temporal variability of precipitation over China, 1951–2005. Theor. Appl. Climatol. 2009, 95, 53–68. [Google Scholar] [CrossRef]
  31. Zhang, Q.; Jiang, T.; Gemmer, M.; Becker, S. Precipitation, temperature and runoff analysis from 1950 to 2002 in the Yangtze Basin, China. Hydrol. Sci. J. 2005, 50, 65–80. [Google Scholar] [CrossRef]
  32. Salmi, T.; Määttä, A.; Anttila, P.; Ruoho-Airola, T.; Amnell, T. Detecting Trends of Annual Values of Atmospheric Pollutants by Mann-Kendall Test and Sen’s Slope Estimates-the Excel Template Application Makesens; Finnish Meteorological Institute (FMI): Helsinki, Finland, 2002. [Google Scholar]
  33. Manly, B.F.J. Statistics for Environmental Science and Management; CRC Press: Boca Raton, FL, USA, 2009. [Google Scholar]
  34. Sen, P.K. Estimates of the regression coefficient based on kendall’s tau. J. Am. Stat. Assoc. 1968, 63, 1379–1389. [Google Scholar] [CrossRef]
  35. Gilbert, R.O. Statistical Methods for Environmental Pollution Monitoring; John Wiley & Sons: New York, NY, USA, 1987. [Google Scholar]
  36. Su, H.; Neelin, J.D. The scatter in tropical average precipitation anomalies. J. Climate 2003, 16, 3966–3977. [Google Scholar] [CrossRef]
  37. Dash, S.K.; Kulkarni, M.A.; Mohanty, U.C.; Prasad, K. Changes in the characteristics of rain events in India. J. Geophys. Res. 2009, 114, 1–12. [Google Scholar] [CrossRef]
  38. Kansakar, S.R.; Hannah, D.M.; Gerrard, J.; Rees, G. Spatial pattern in the precipitation regime in Nepal. Int. J. Climatol. 2004, 24, 1645–1659. [Google Scholar] [CrossRef]
  39. Aryal, A.; Brunton, D.; Raubenheimer, D. Impact of climate change on human-wildlife-ecosysteminteractions in the trans-Himalaya region of Nepal. Theory Appl. Climatol. 2014, 115, 517–529. [Google Scholar] [CrossRef]
  40. Yasunari, T. Seasonal weather variations in Khumbu Himal. Seppyo 1976, 38, 74–83. [Google Scholar]
  41. Kalsi, S.R. On some aspects of interaction between middle latitude westerlies and monsoon circulation. Mausam 1980, 38, 305–308. [Google Scholar]
  42. Shrestha, A.B.; Awake, C.P.; Dibb, J.E.; Mayewski, P.A. Precipitation fluctuations in the Nepal Himalaya and its vicinity and relationship with some large scale climatological parameters. Int. J. Climatol. 2000, 2, 317–327. [Google Scholar] [CrossRef]
  43. Wang, B.; Liu, Y.; Kim, H.J.; Webster, P.J.; Yim, S.Y. Recent change of the global monsoon precipitation (1979–2008). Clim. Dynam. 2012, 39, 1123–1135. [Google Scholar] [CrossRef]
  44. Rosenberg, E.A.; Keys, P.W.; Booth, D.B.; Hartley, D.; Burkey, J.; Steinemann, A.C.; Lettenmaier, D.P. Precipitation extremes and the impacts of climate change on stormwater infrastructure in Washington State. Clim. Change 2010, 102, 319–349. [Google Scholar] [CrossRef]
  45. Dhakal, S. Flood hazard in Nepal and new approach of risk reduction. Int. J. Landslide Environ. 2013, 1, 13–14. [Google Scholar]
  46. Dahal, R.K. Engineering Geology of Nepal. Available online: www.ranjan.net.np (accessed on 4 November 2014).
  47. Pokhrel, K.P. Chure forestry conservation and management plan: A case study of Arghakhanchi District, Nepal. J. Geogr. Reg. Plan. 2013, 6, 172–183. [Google Scholar] [CrossRef]
  48. Aryal, S. Rainfall and water requirement of rice during growing period. J. Agric. Environ. 2013, 13, 1–4. [Google Scholar] [CrossRef]
  49. Malla, G. Climate change and its impacts on Nepalese agriculture. J. Agric. Environ. 2008, 9, 62–71. [Google Scholar]
  50. Ahasan, M.N.; Chowdhary, M.A.M.; Quadir, D.A. Variability and trends of summer monsoon rainfall over Bangladesh. J. Hydrol. Meteorol. 2010, 7, 1–7. [Google Scholar]
  51. Karpouzos, D.K.; Kavalieratou, S.; Babajimopoulos, C. Trend analysis of precipitation data in pieria region (Greece). Eur. Water 2010, 30, 31–40. [Google Scholar]
  52. Sharma, K.P.; Moore, B., III; Vorosmarty, C.J. Anthropogenic, climatic and hydrologic trends in the Koshi Basin, Himalaya. Clim. Change 2000, 47, 141–165. [Google Scholar]
  53. Islam, D.M.N. Analysis of Trmm Data in Monitoring Rainfall over Mountainous Regions; SAARC Meteorological Research Centre (SMRC): Dhaka, Bangladesh, 2009. [Google Scholar]