
Regional Observed Trends in Daily Rainfall Indices of Extremes over the Indochina Peninsula from 1960 to 2007


Abstract
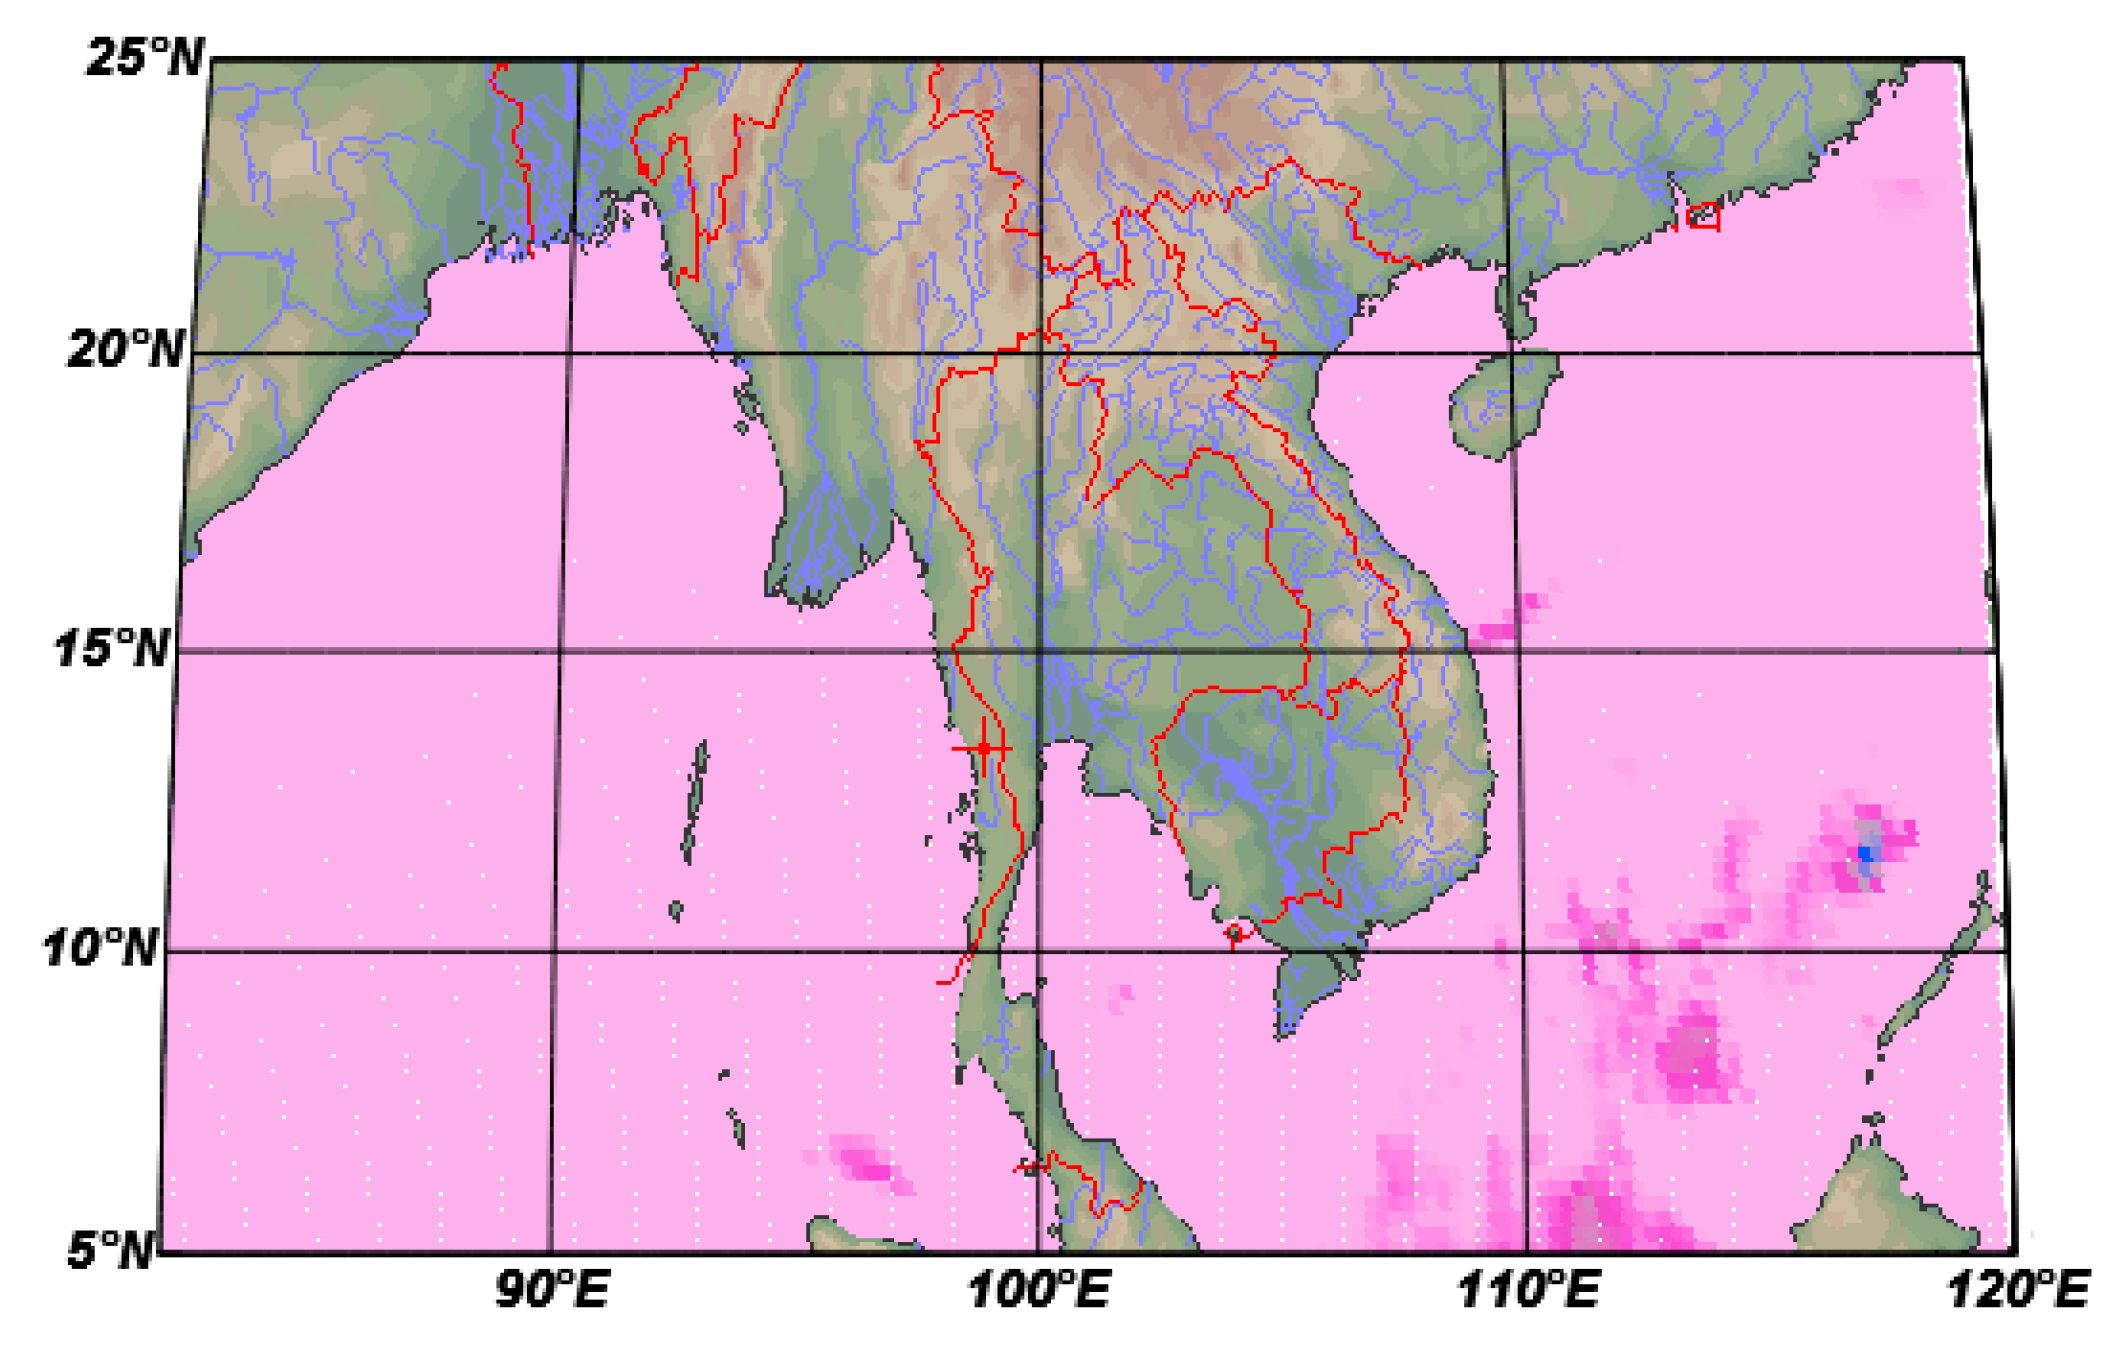
:1. Introduction
2. Methods
2.1. APHRODITE Datasets

2.2. Extreme Rainfall Indices

| Indices | Name | Indices Calculation | Definition | Unit |
|---|---|---|---|---|
| Frequency Indices (adapted from WMO 2009 and Santos et al. 2009 [5,13]) | ||||
| R10m | Number of heavy rainfall days | RRij ≥ 10 mm | Annual count of days when days rainfall ≥ 10 mm | Days |
| R20m | Number of very heavy rainfall days | RRij ≥ 20 mm | Annual count of days when days rainfall ≥ 20 mm | Days |
| R25m | Number of extremely heavy rainfall days | RRij ≥ 25 mm | Annual count of days when days rainfall ≥ 25 mm | Days |
| CDD | Consecutive dry days | RRij < 1 mm | Maximum number of consecutive days with RR < 1 mm | Days |
| CWD | Consecutive wet days | RRij ≥ 1 mm | Maximum number of consecutive days with RR 1 mm | Days |
| Intensity Indices (adapted from WMO 2009 and Santos et al. 2009 [5,13]) | ||||
| RX1day | Daily maximum rainfall | Rx1dayj = max (RRij) | Monthly maximum 1-day rainfall | Mm |
| RX5day | 5-day maximum rainfall | Rx5dayj = max (RRij) | Monthly maximum 5-day rainfall | Mm |
| PRCPTOT | Annual wet-day rainfall total | Annual total rainfall in wet day (RR > 1 mm) | Mm | |
| SDII | Simple daily intensity index | Annual mean rainfall when PRCP ≥ 1 mm | Mm/day | |
| R95p | Very wet day | Annual total rainfall when RR > 95 percentile | Mm | |
| R99p | Extremely wet day | Annual total rainfall when RR > 99 percentile | Mm | |
2.3. Temporal Trend Analysis
2.4. Spatial Analysis
3. Results and Discussion
3.1. Mean Climatology of Annual Indices

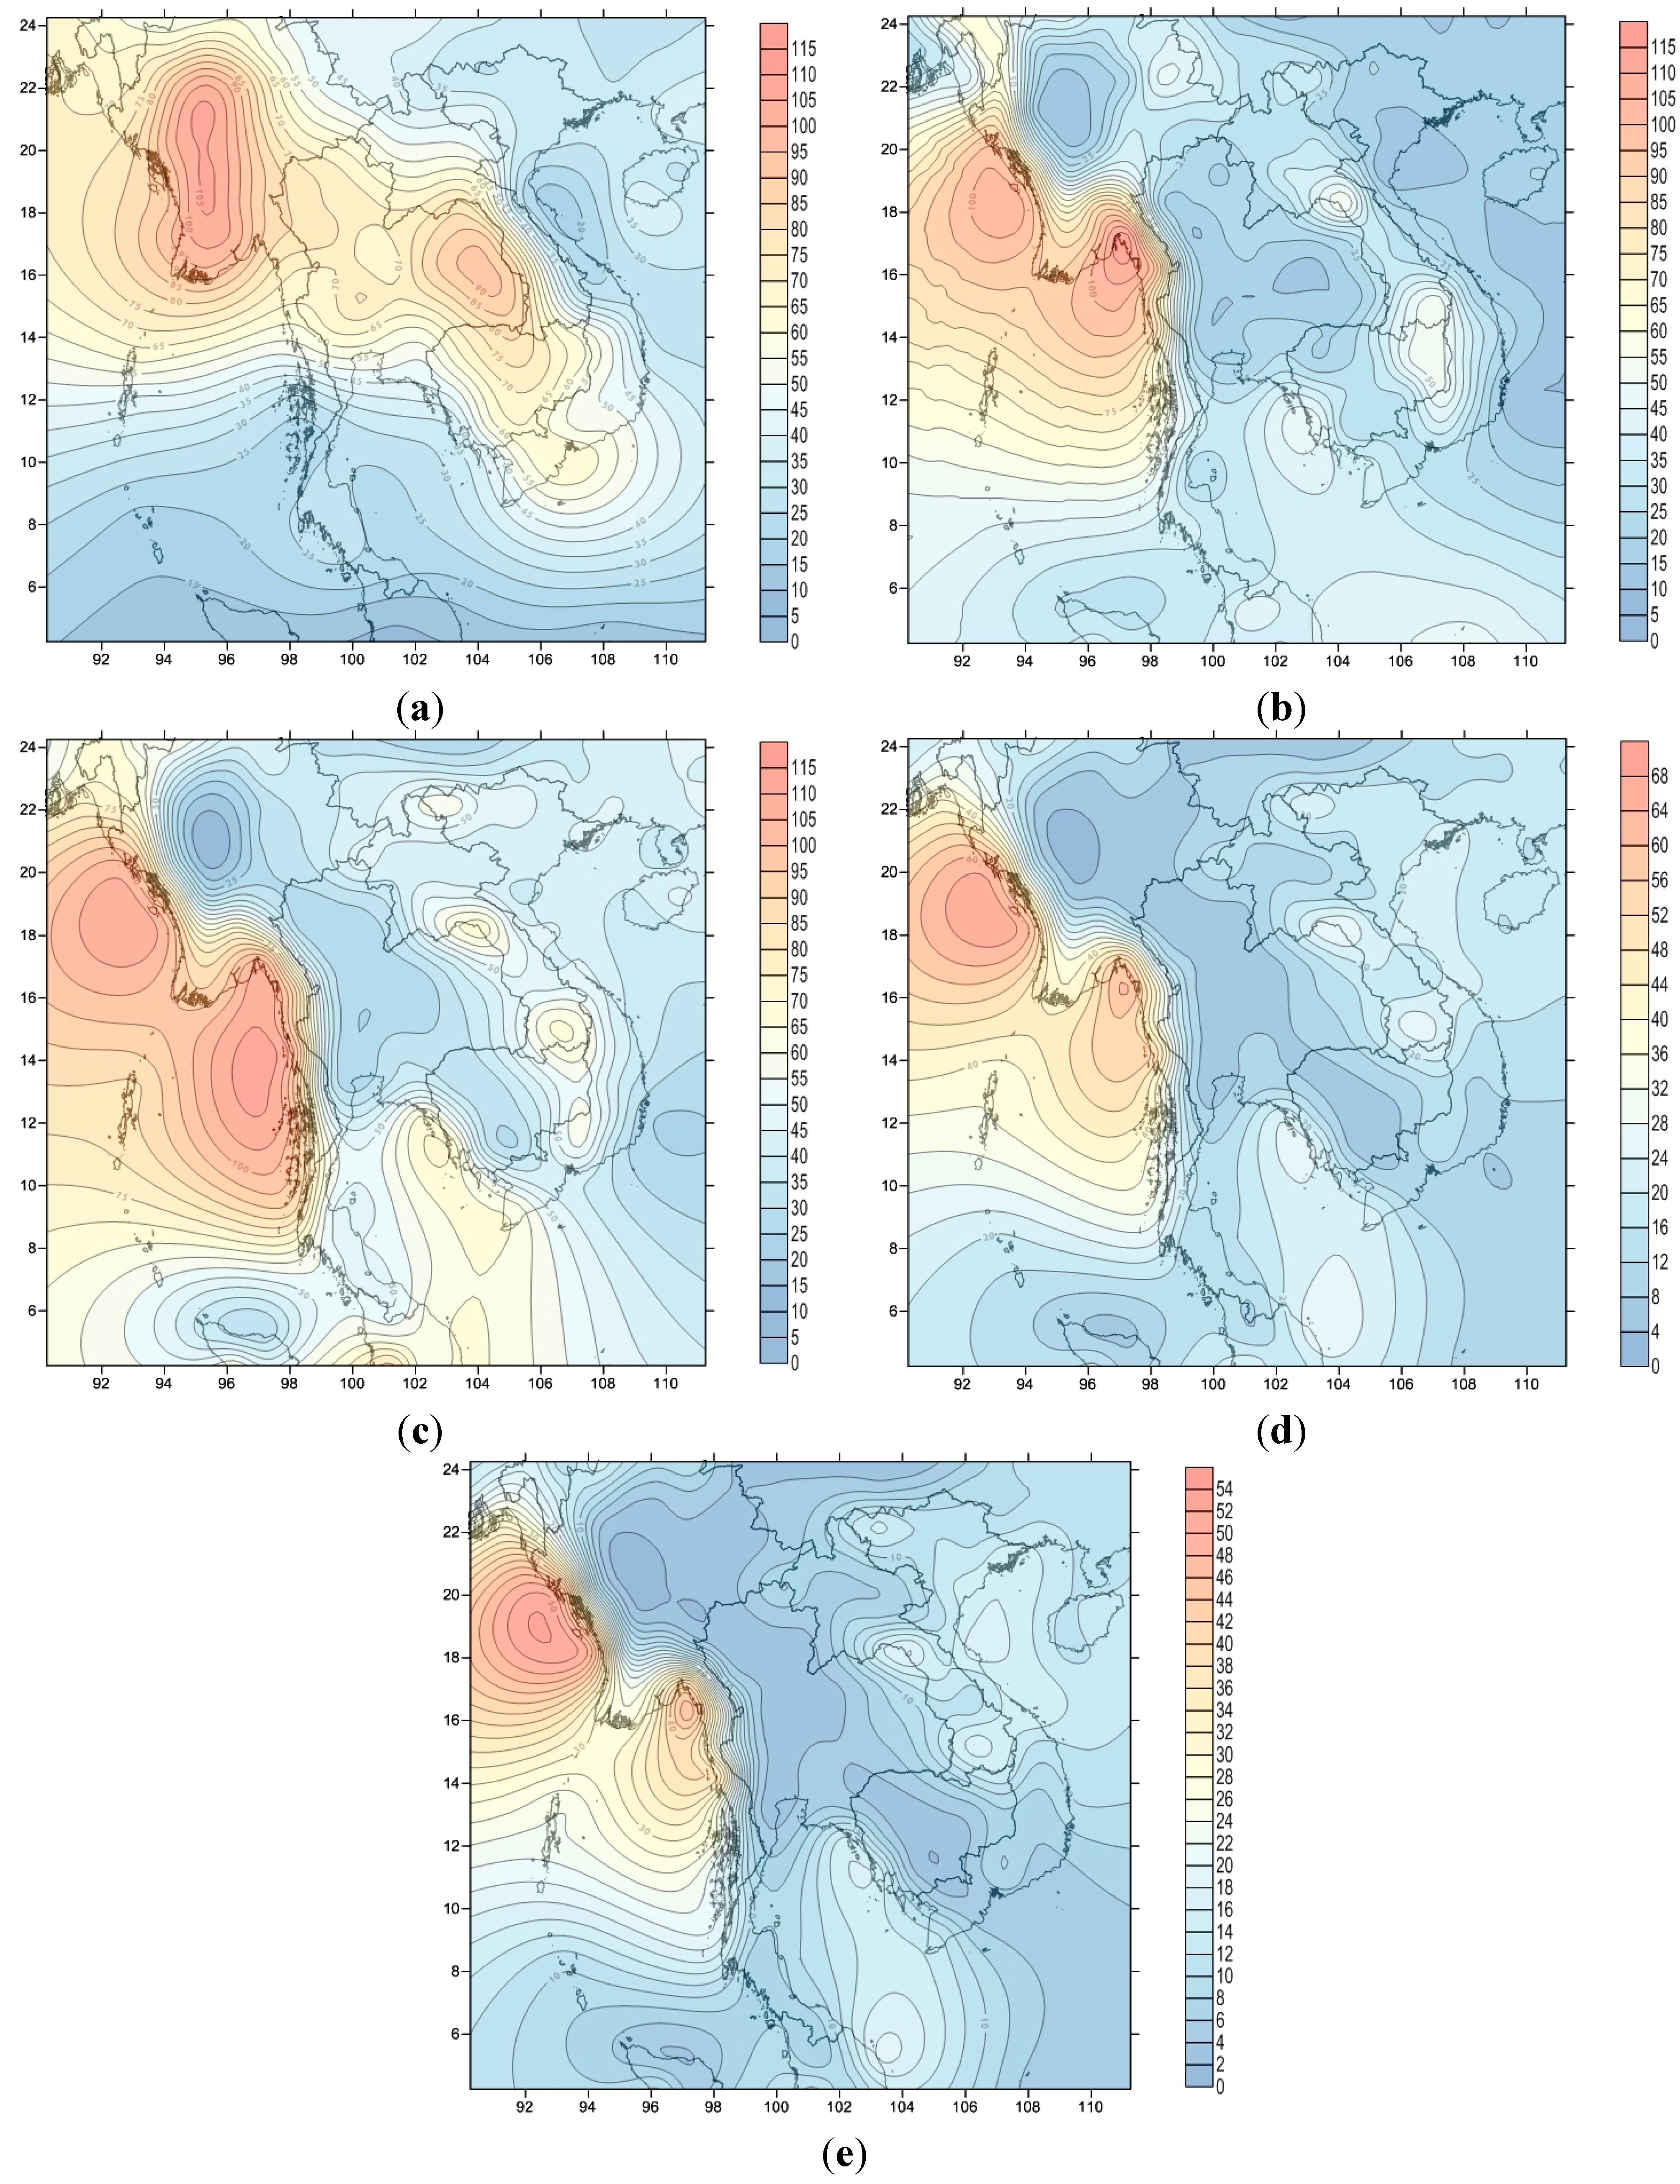
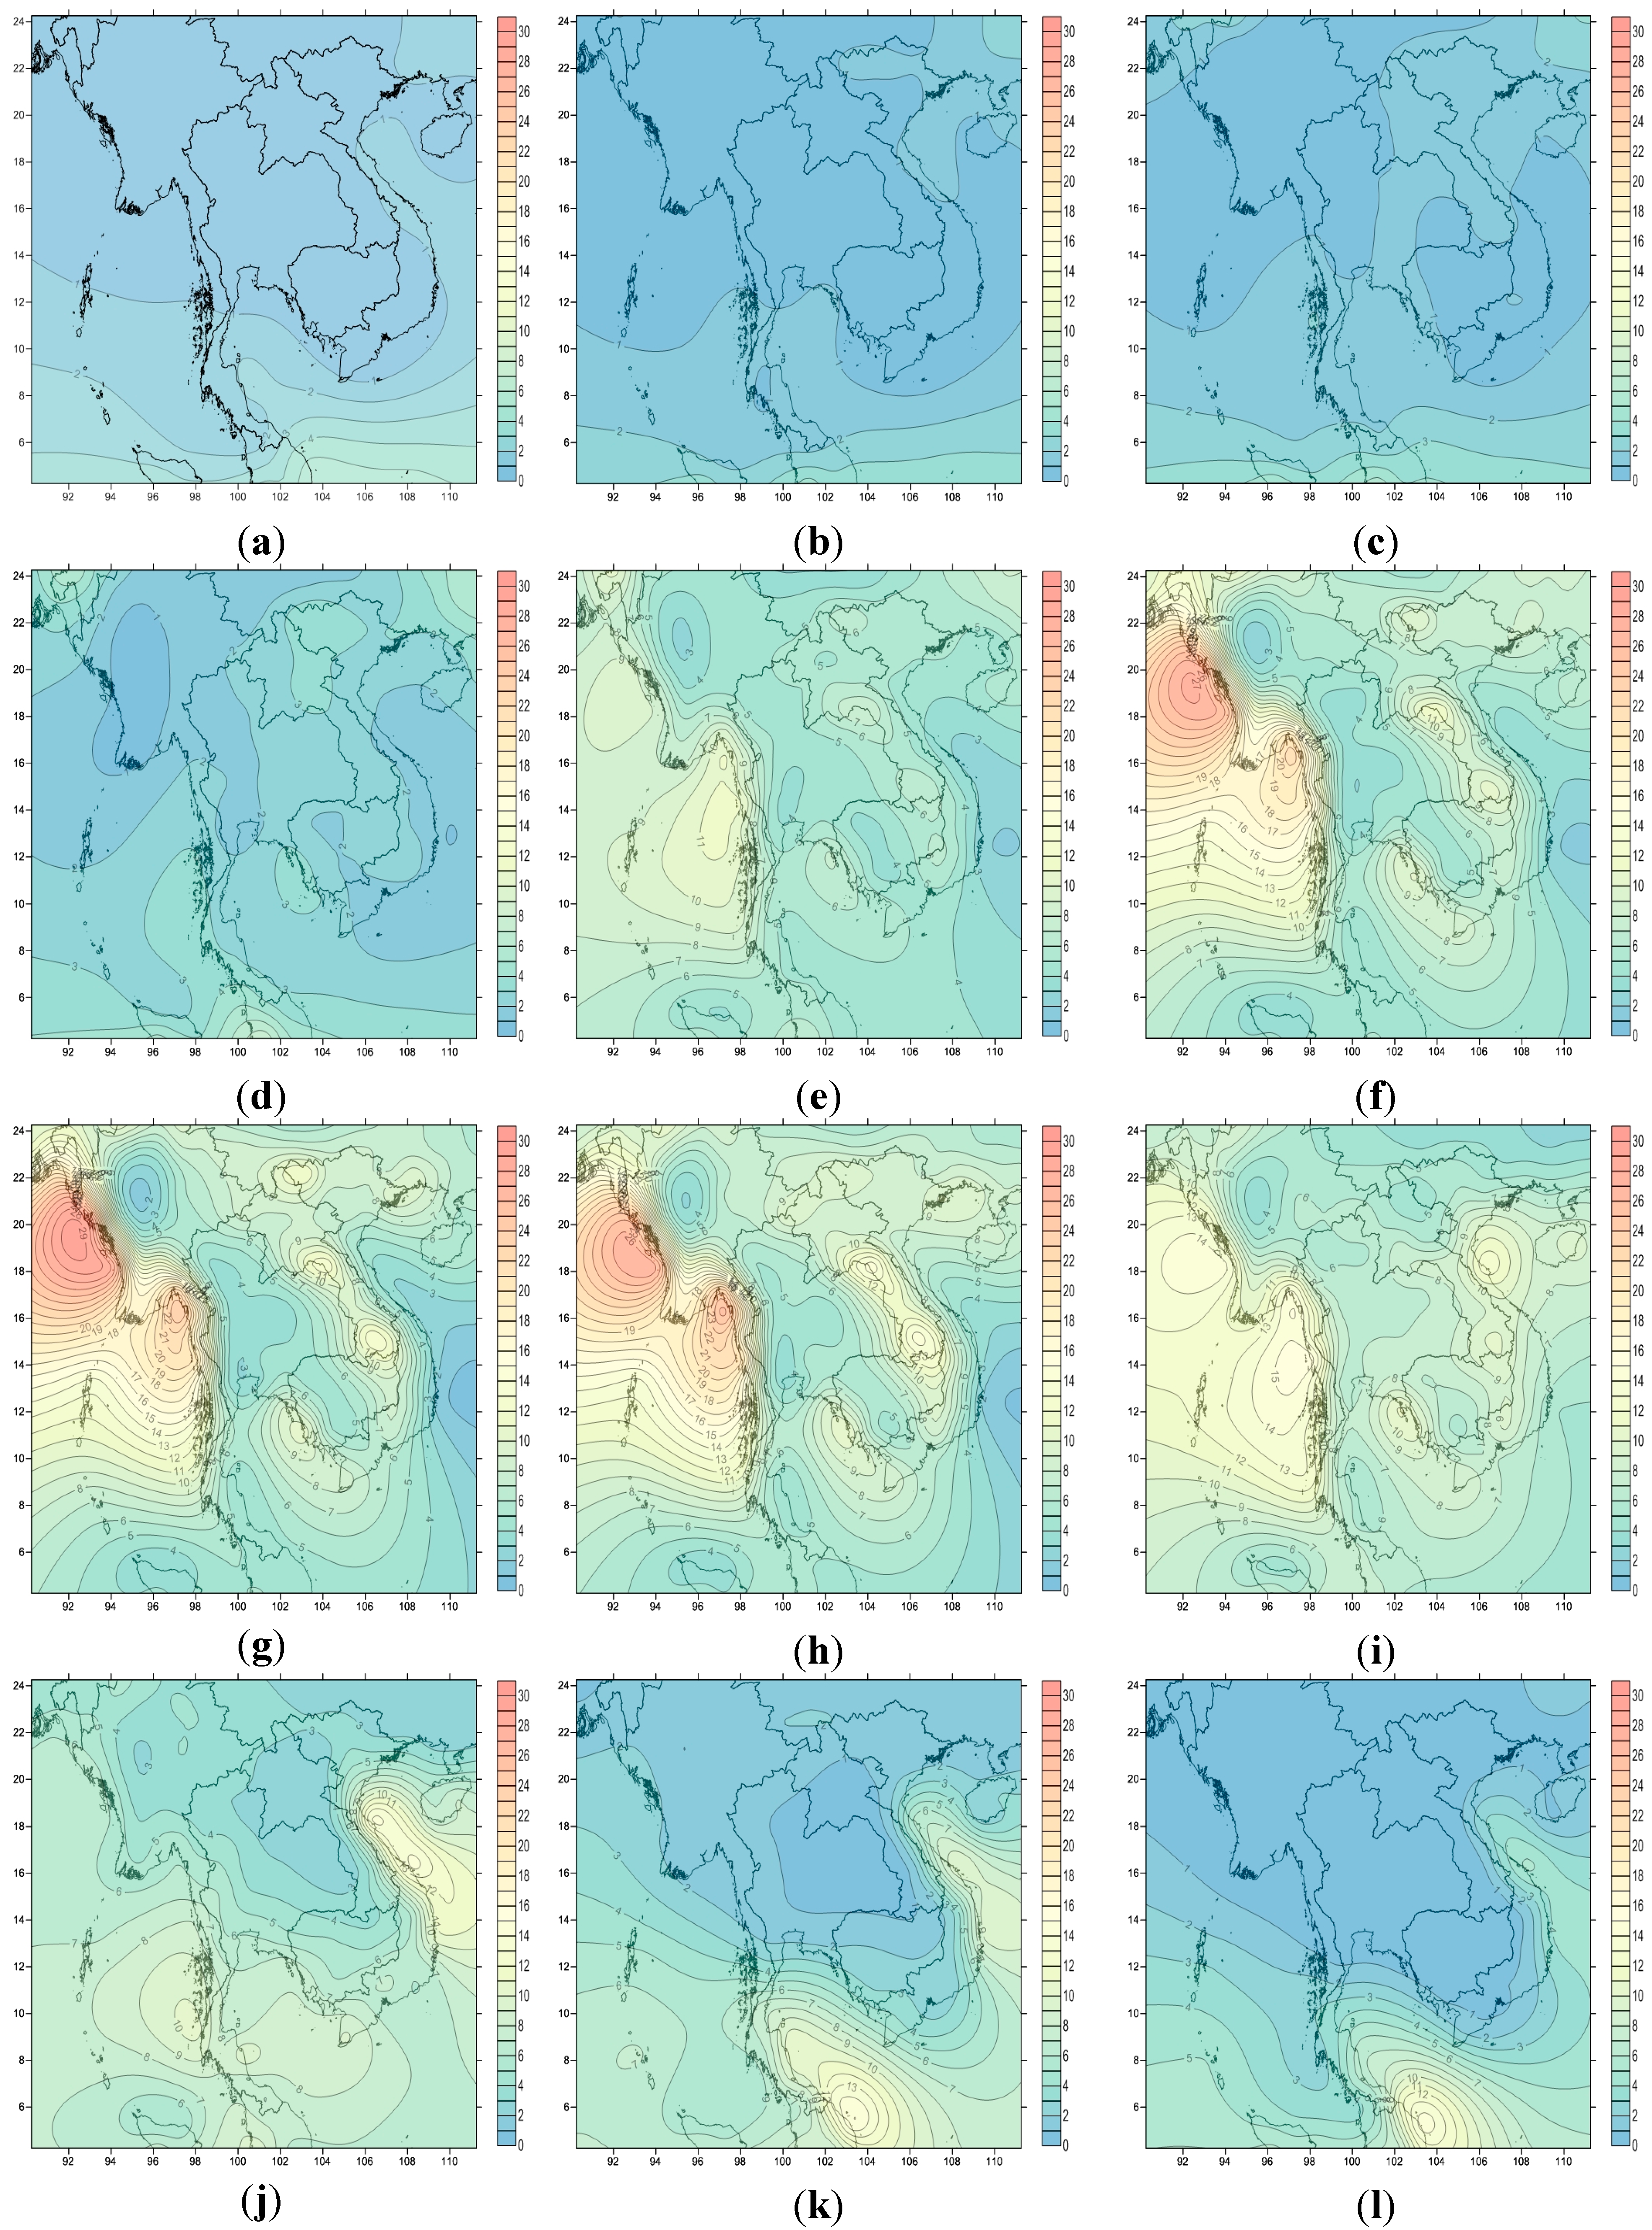
3.1.1. Frequency Indices
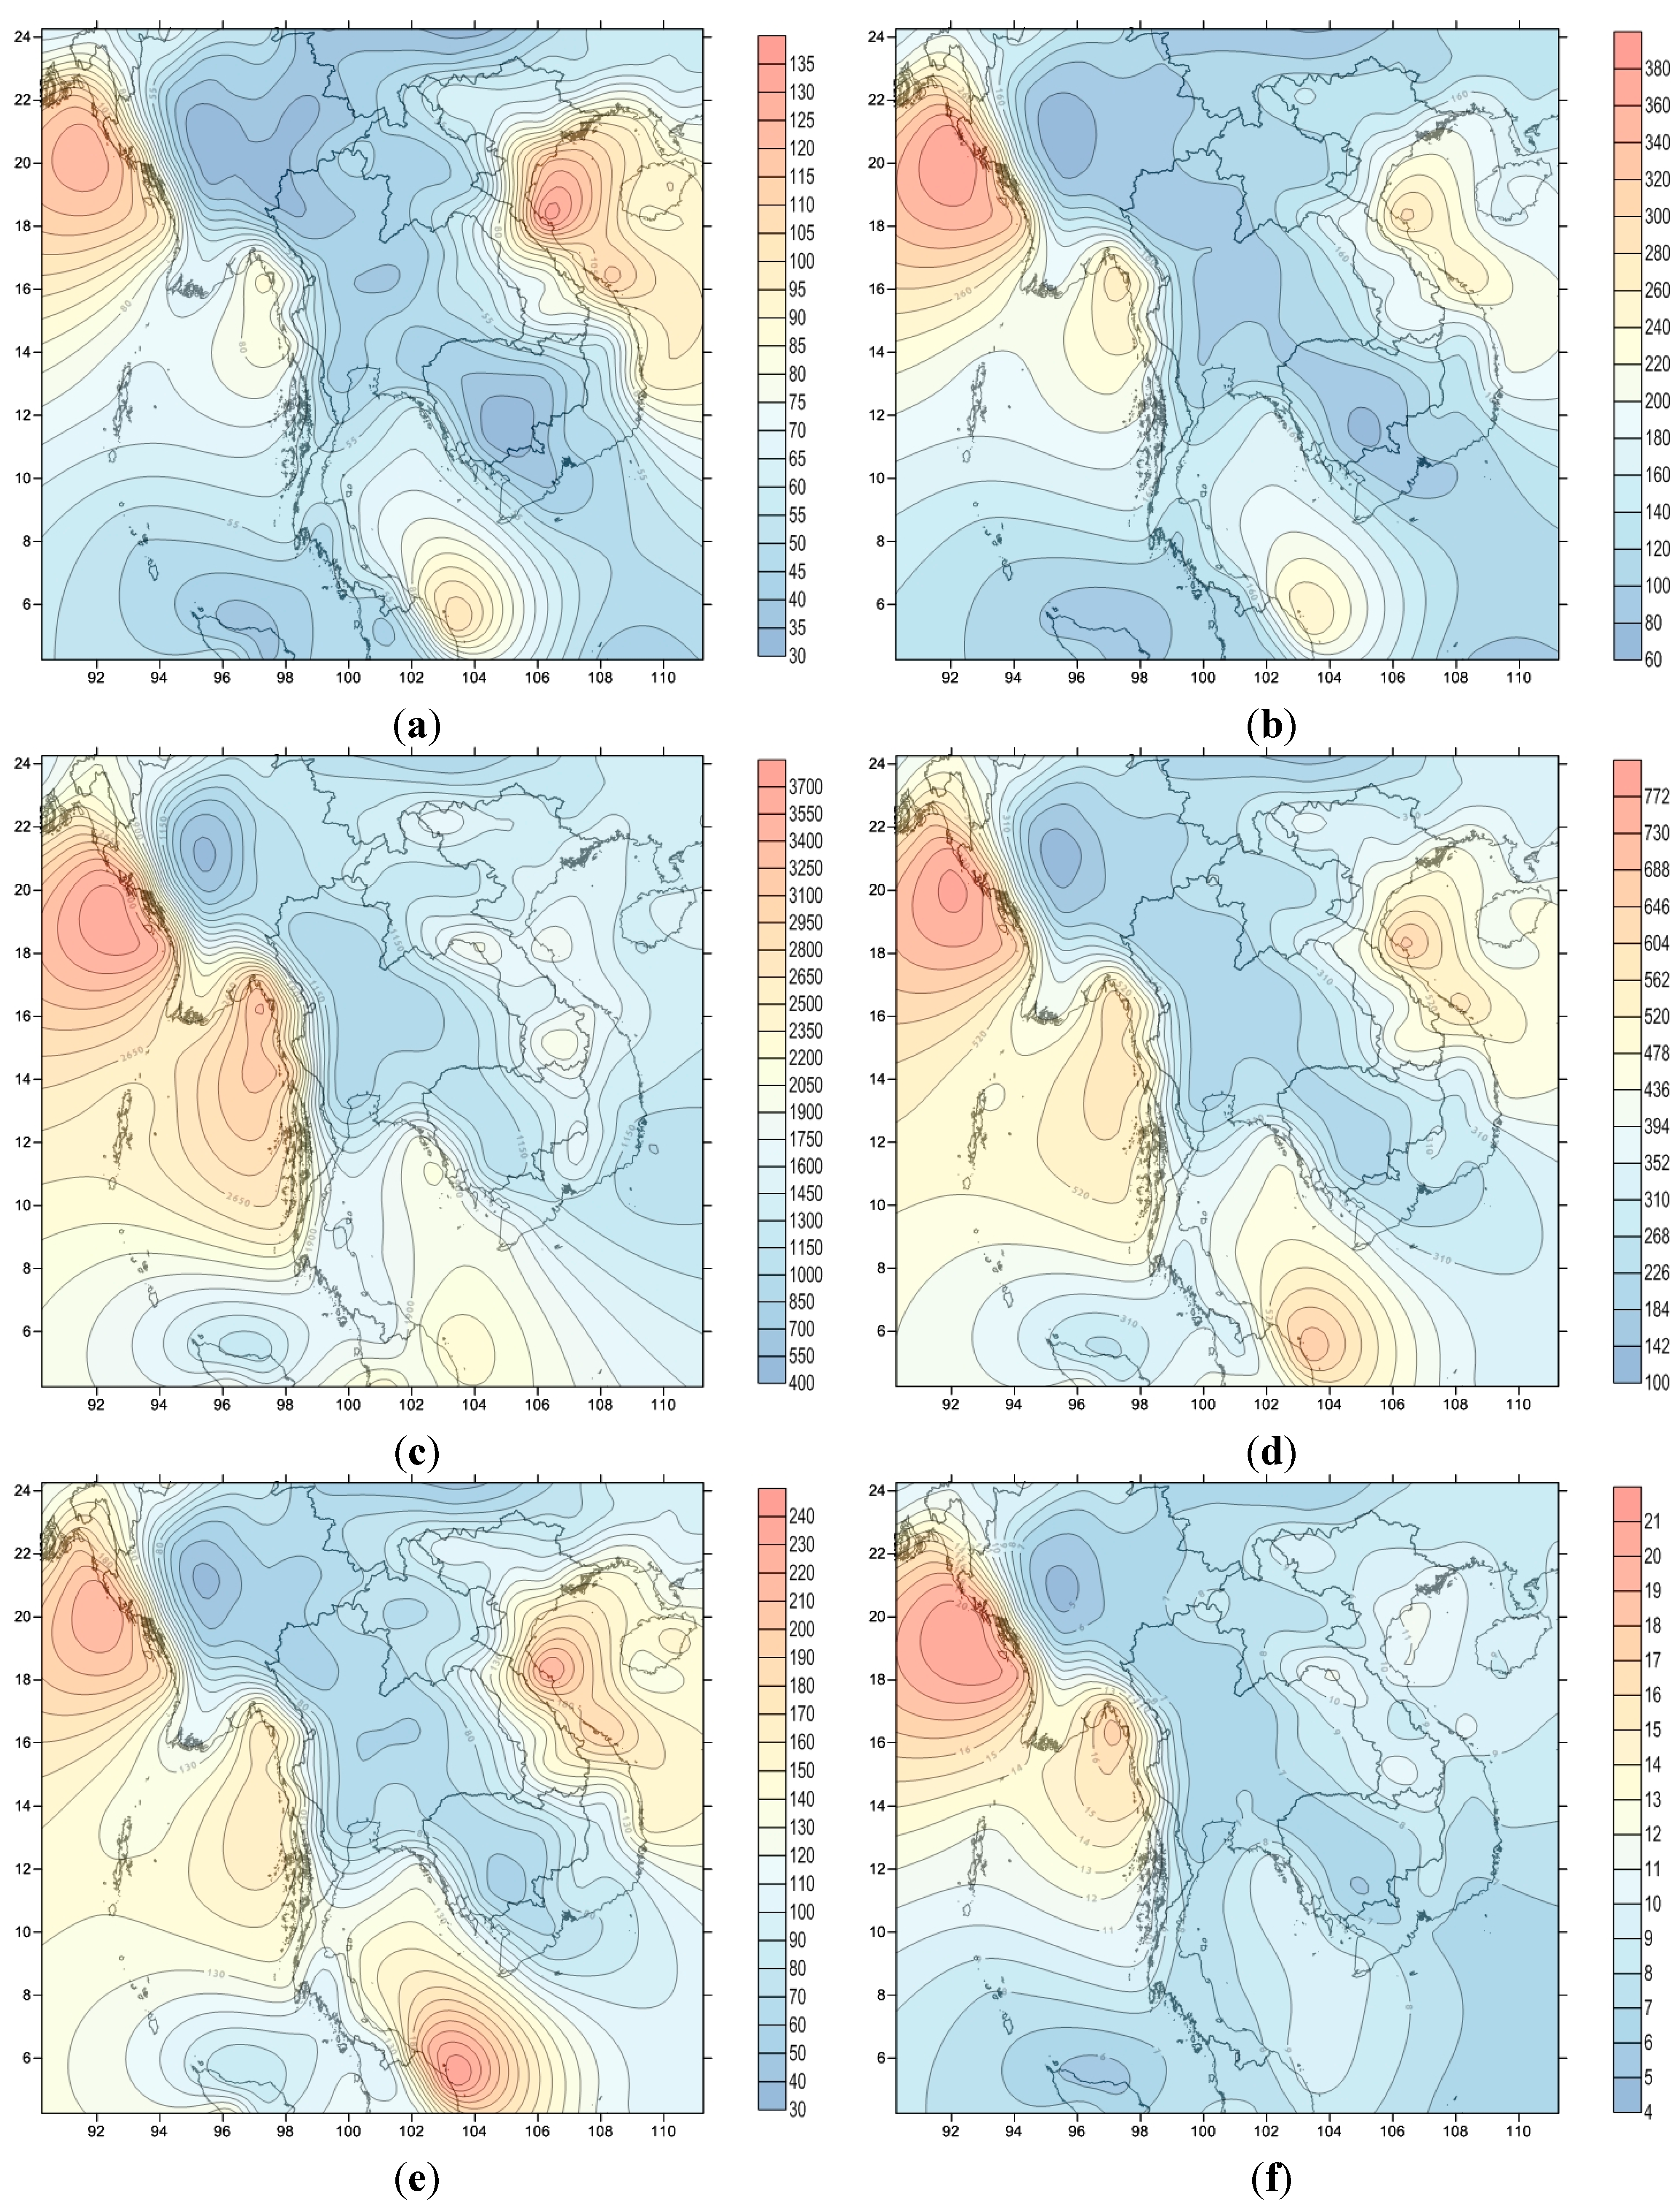
3.1.2. Intensity Indices

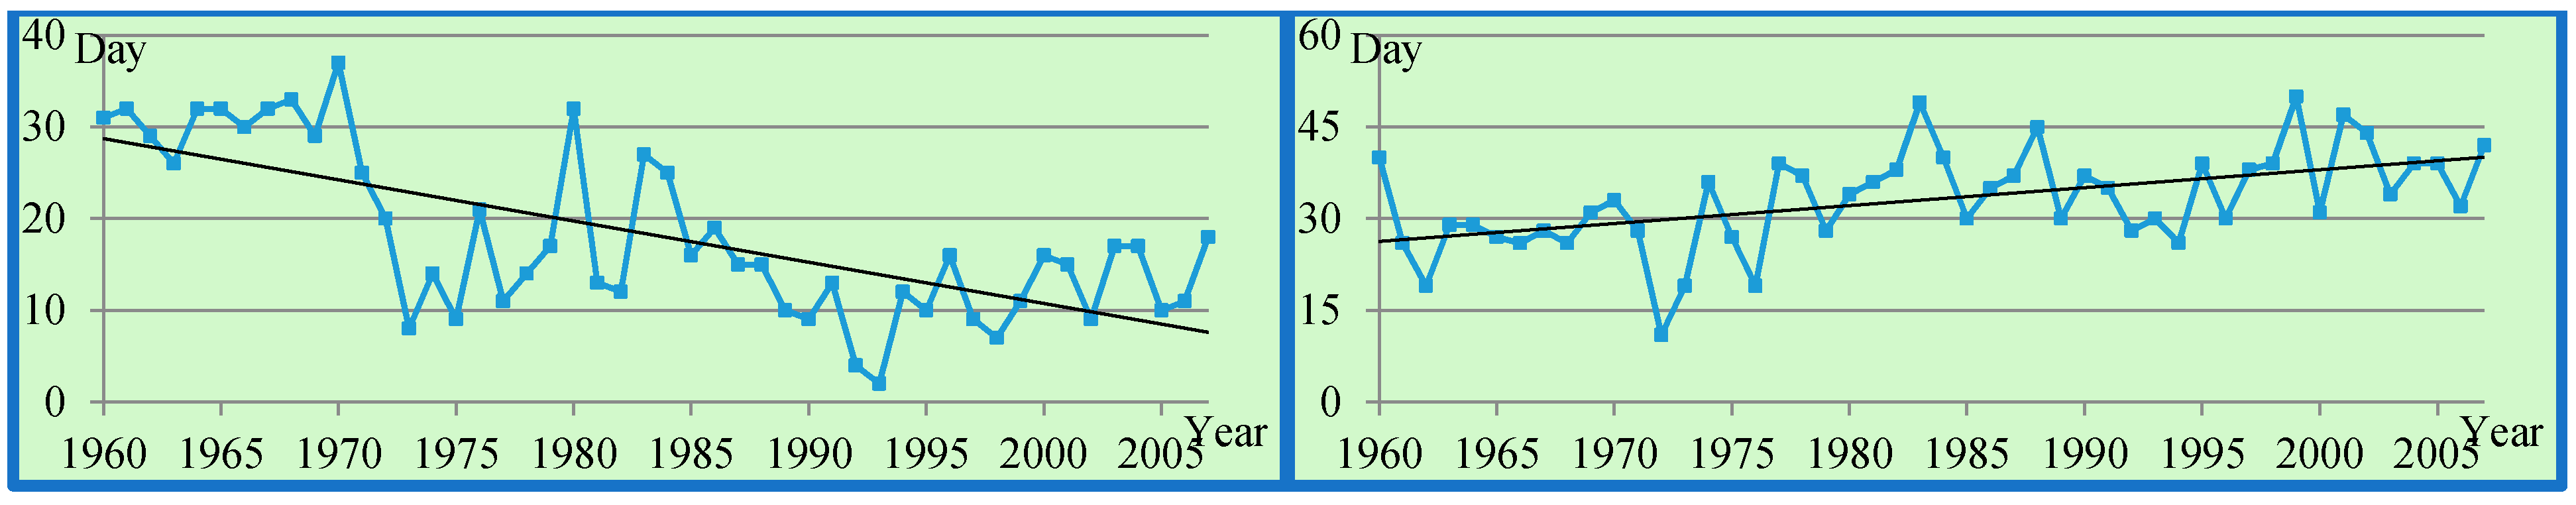
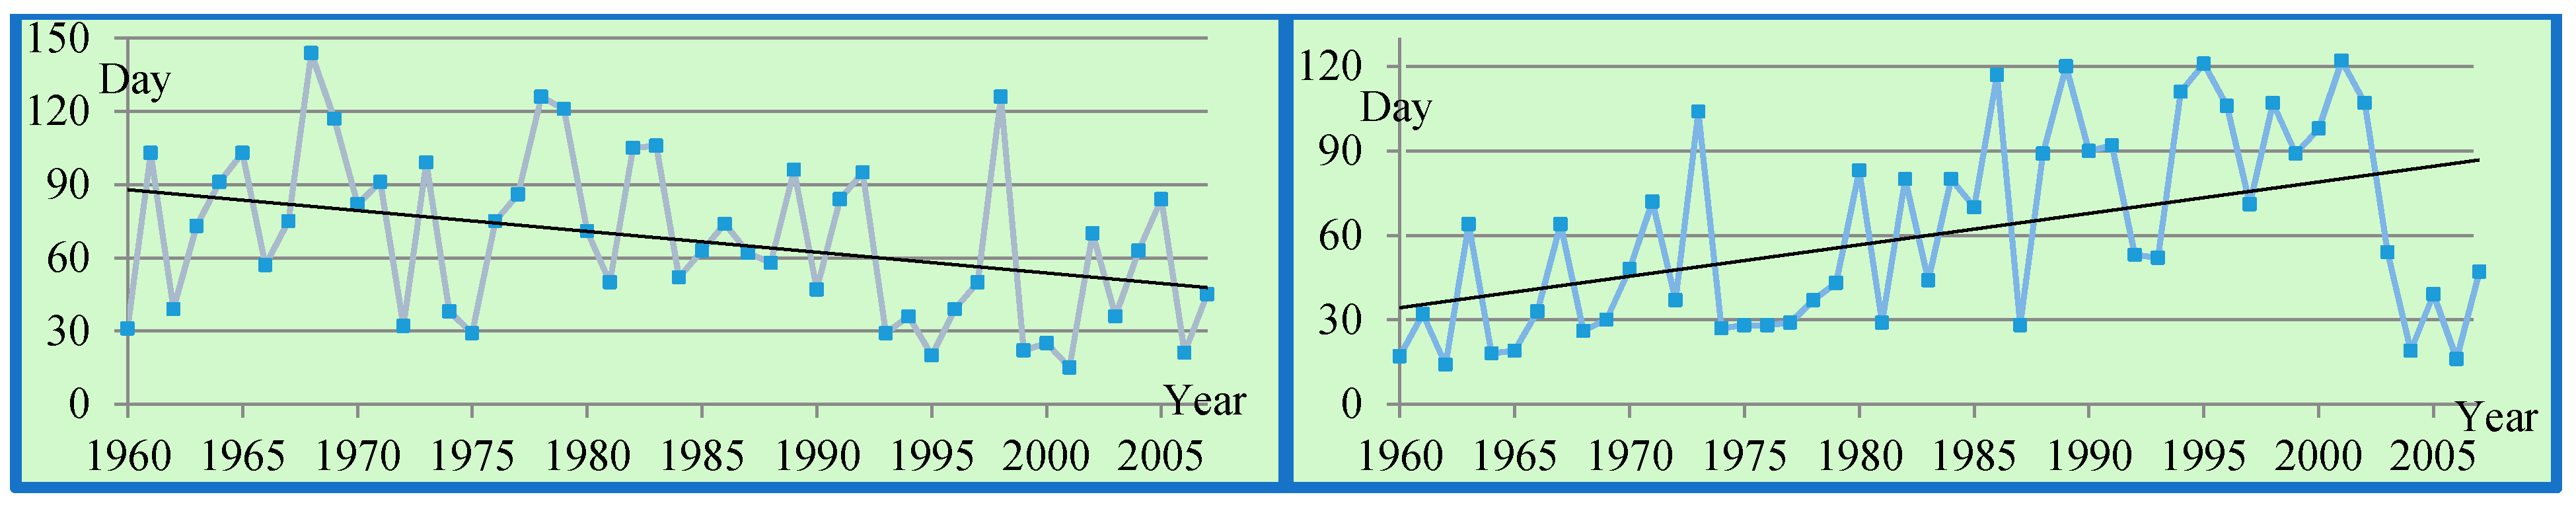
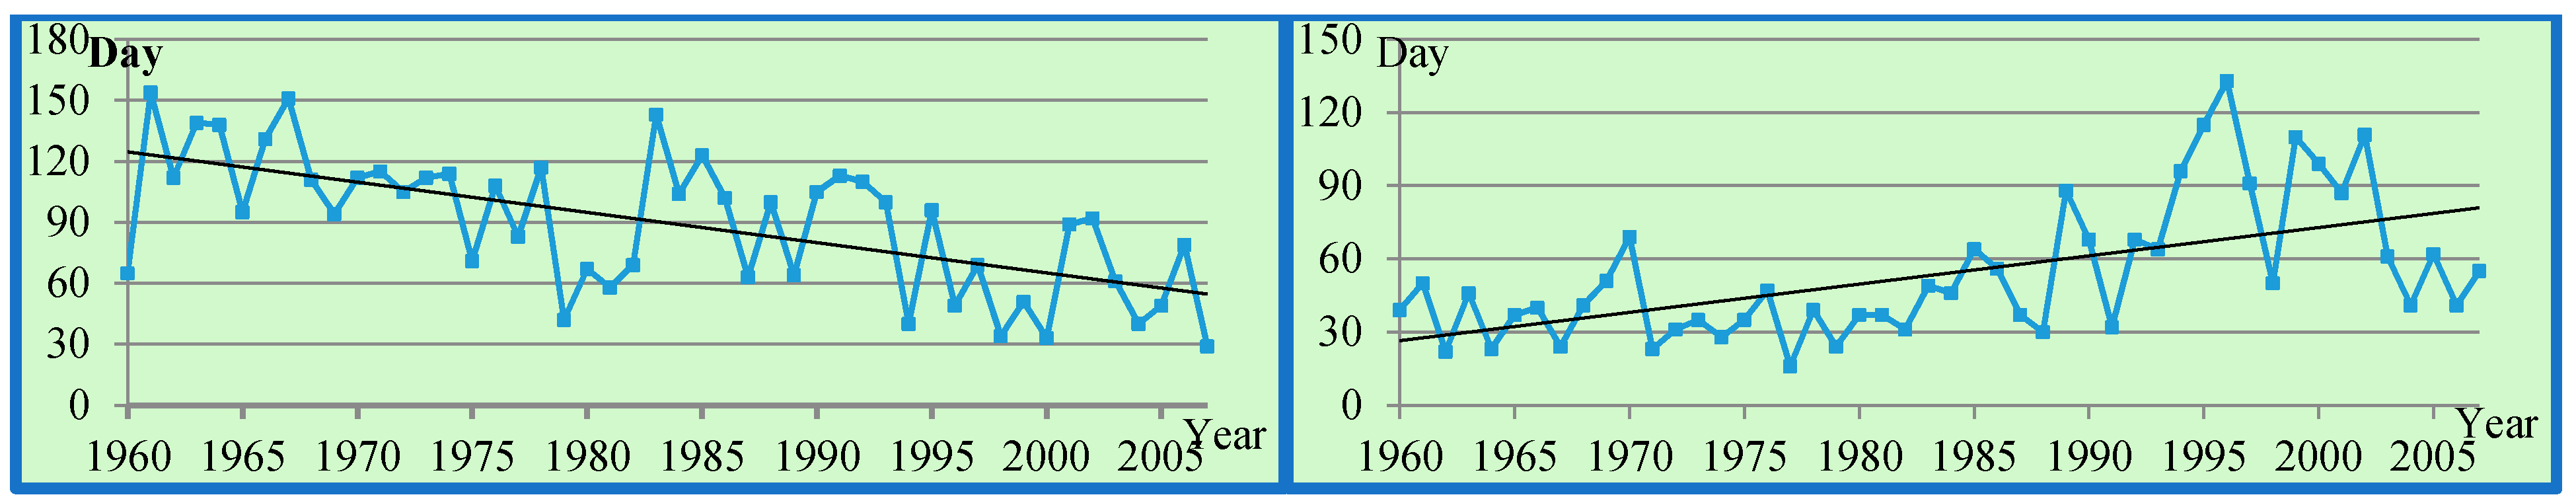
3.2. Temporal Trend of Extreme Rainfall Indices
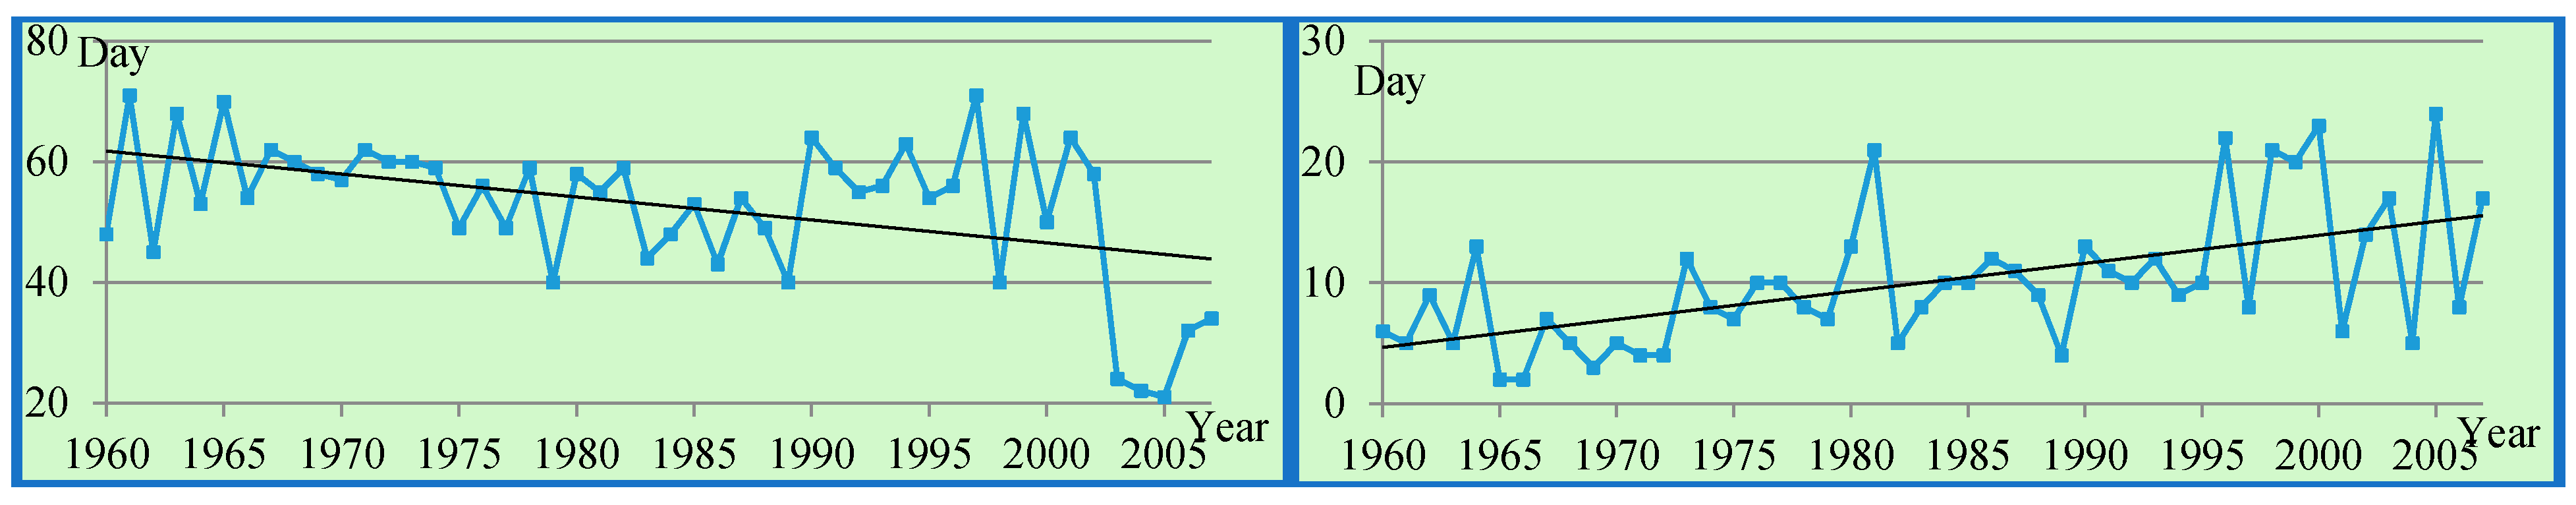
3.2.1. Frequency Indices


| Indices | Positive Significant Trend (%) | Positive Non-Significant Trend (%) | Negative Significant Trend (%) | Negative Non-Significant Trend (%) |
|---|---|---|---|---|
| CDD | 10.88 | 65.72 | 2.41 | 20.96 |
| CWD | 6.85 | 36.29 | 14.51 | 41.93 |
| R10mm | 11.69 | 39.11 | 12.5 | 36.29 |
| R20mm | 17.33 | 37.5 | 8.46 | 36.29 |
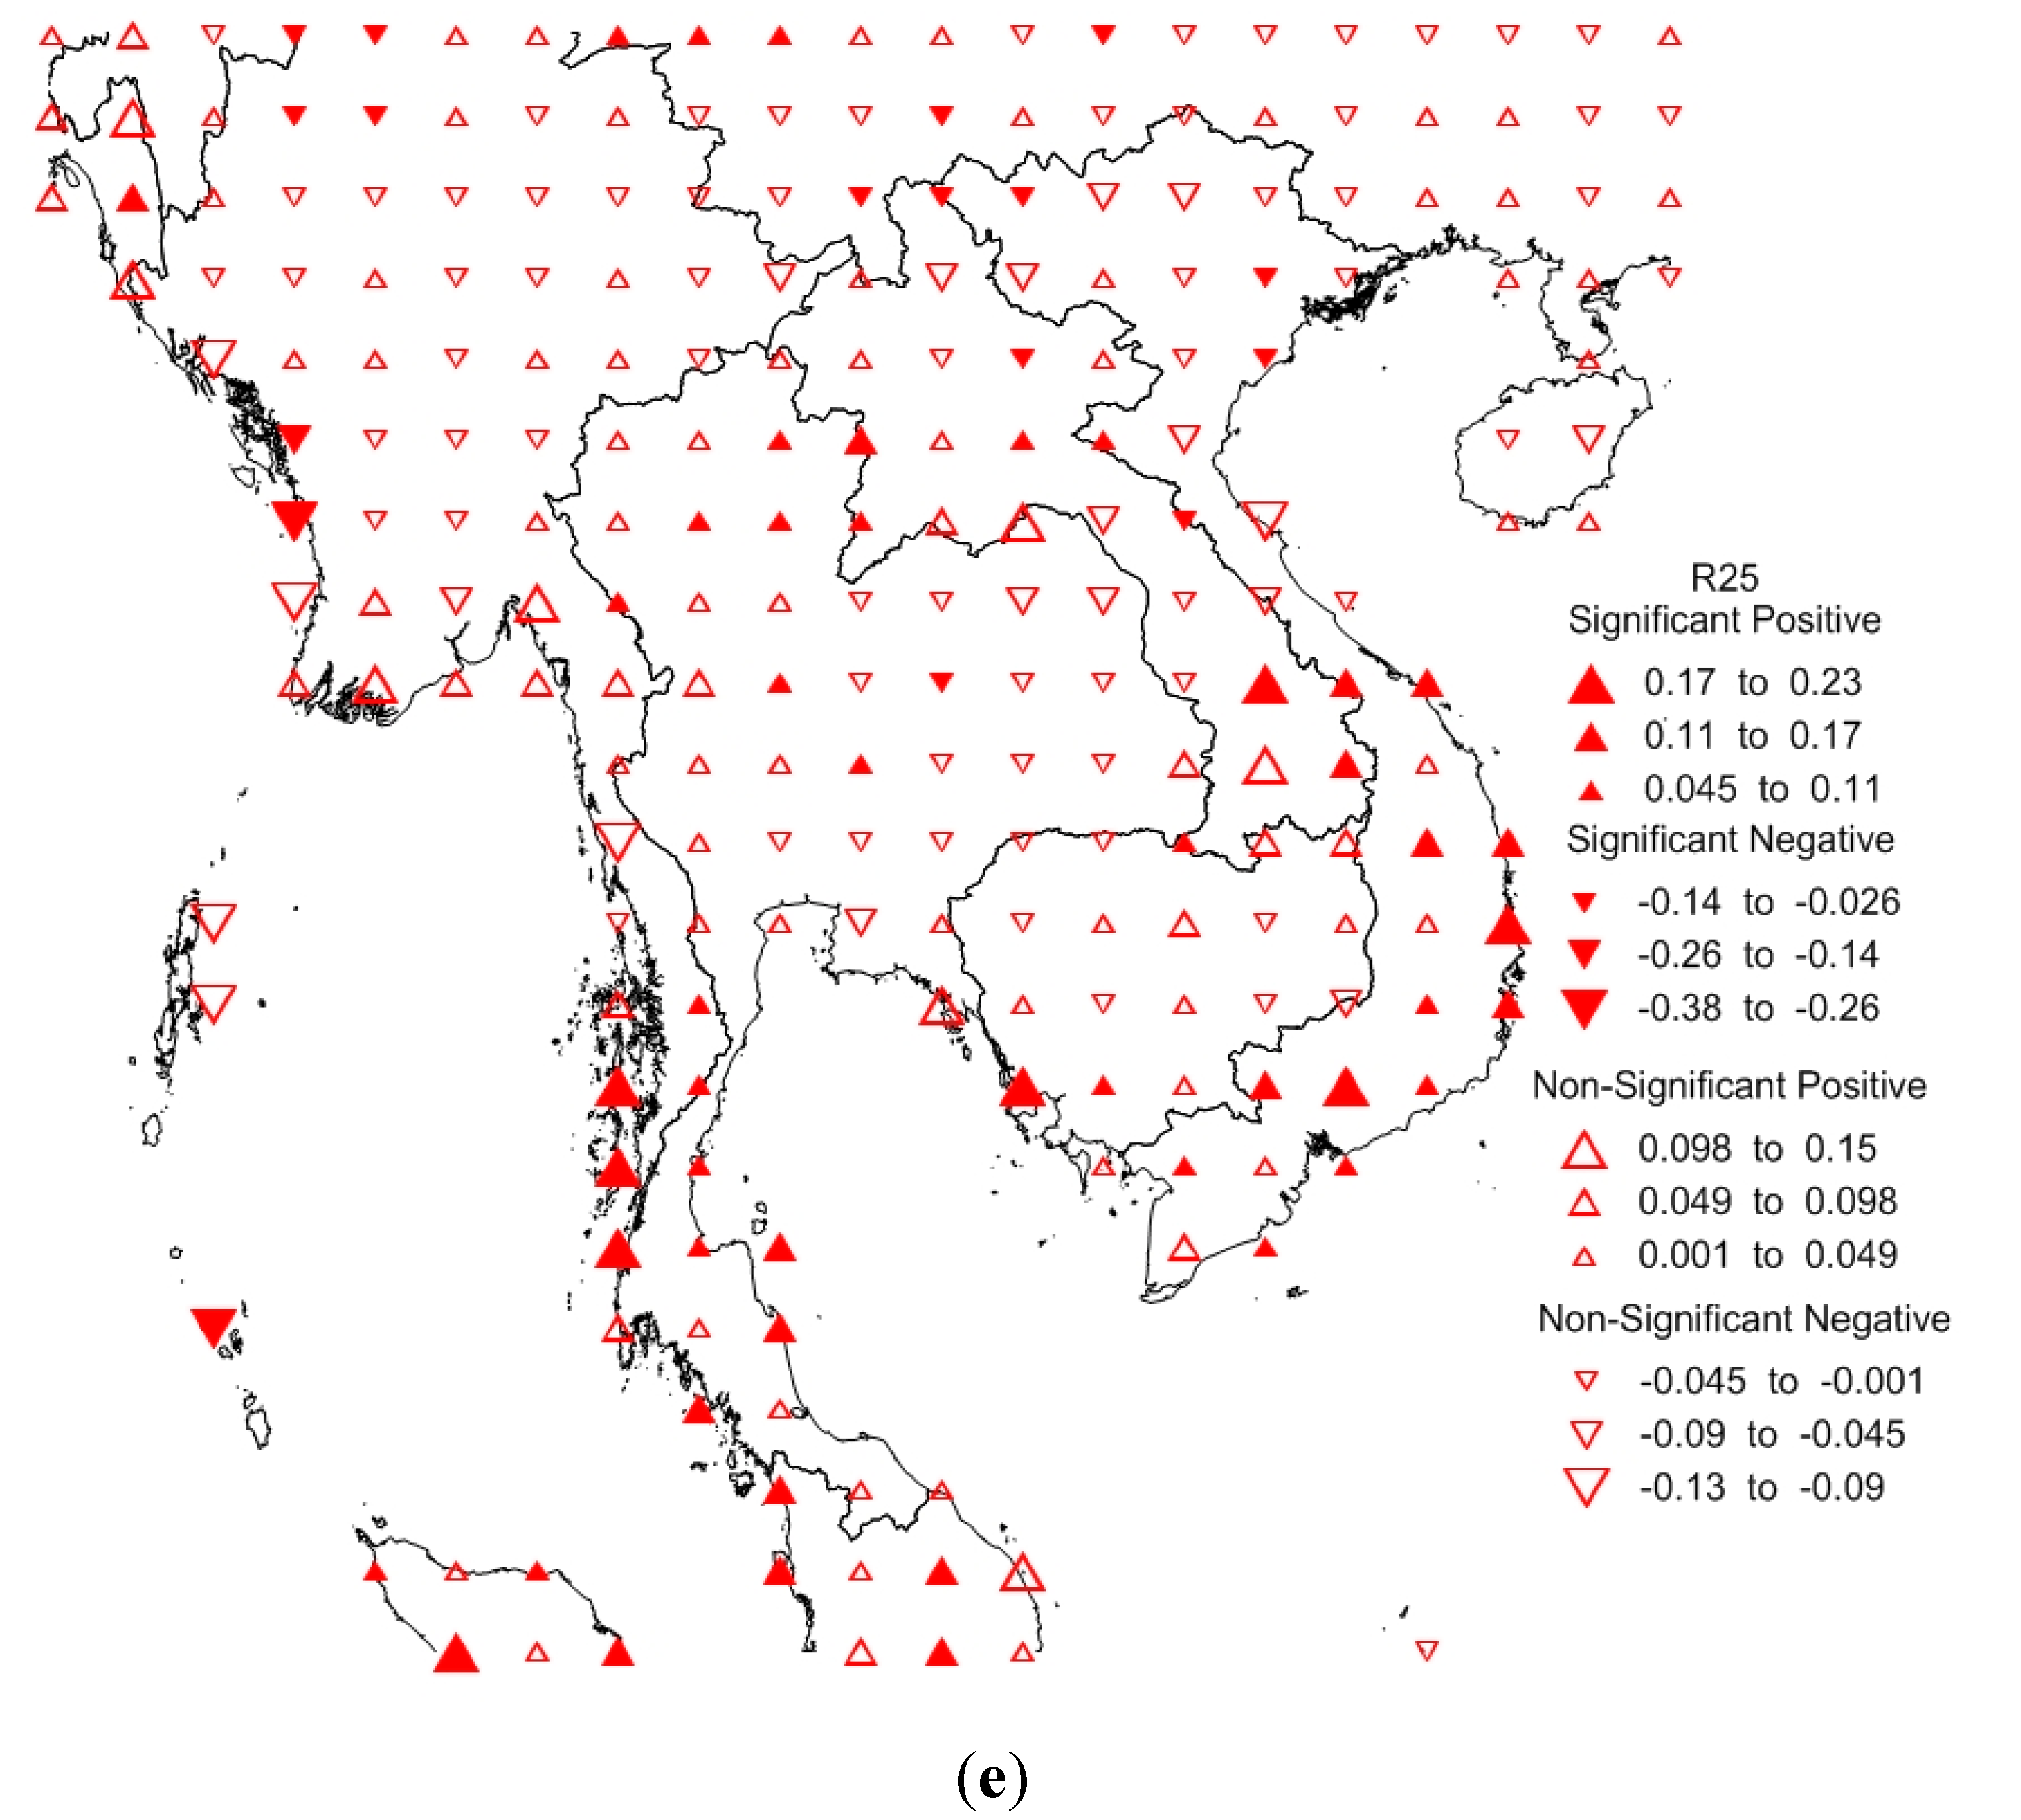
| R25mm | 20.96 | 36.29 | 6.85 | 35.08 |
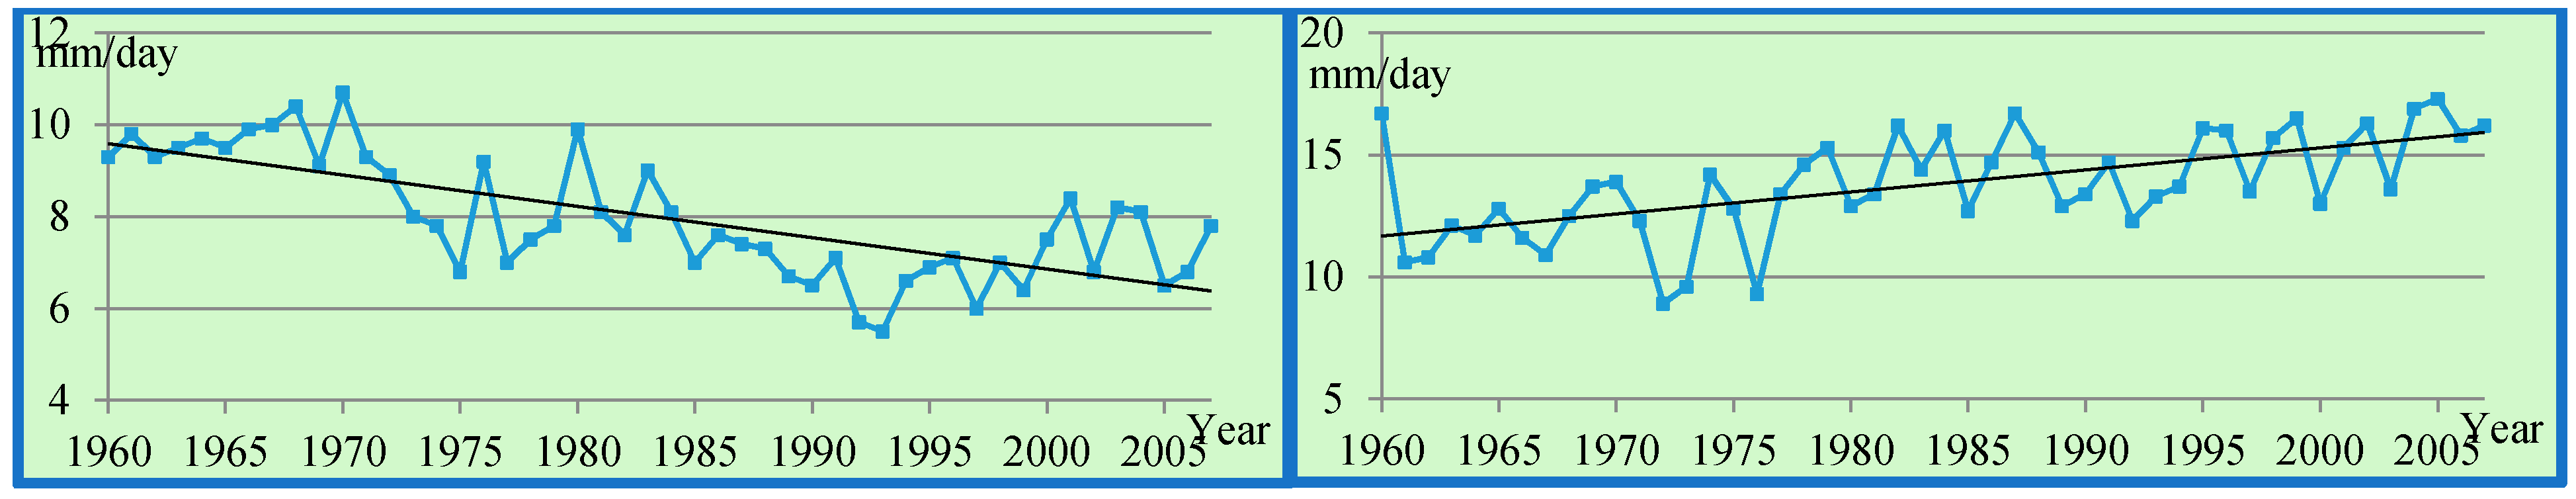
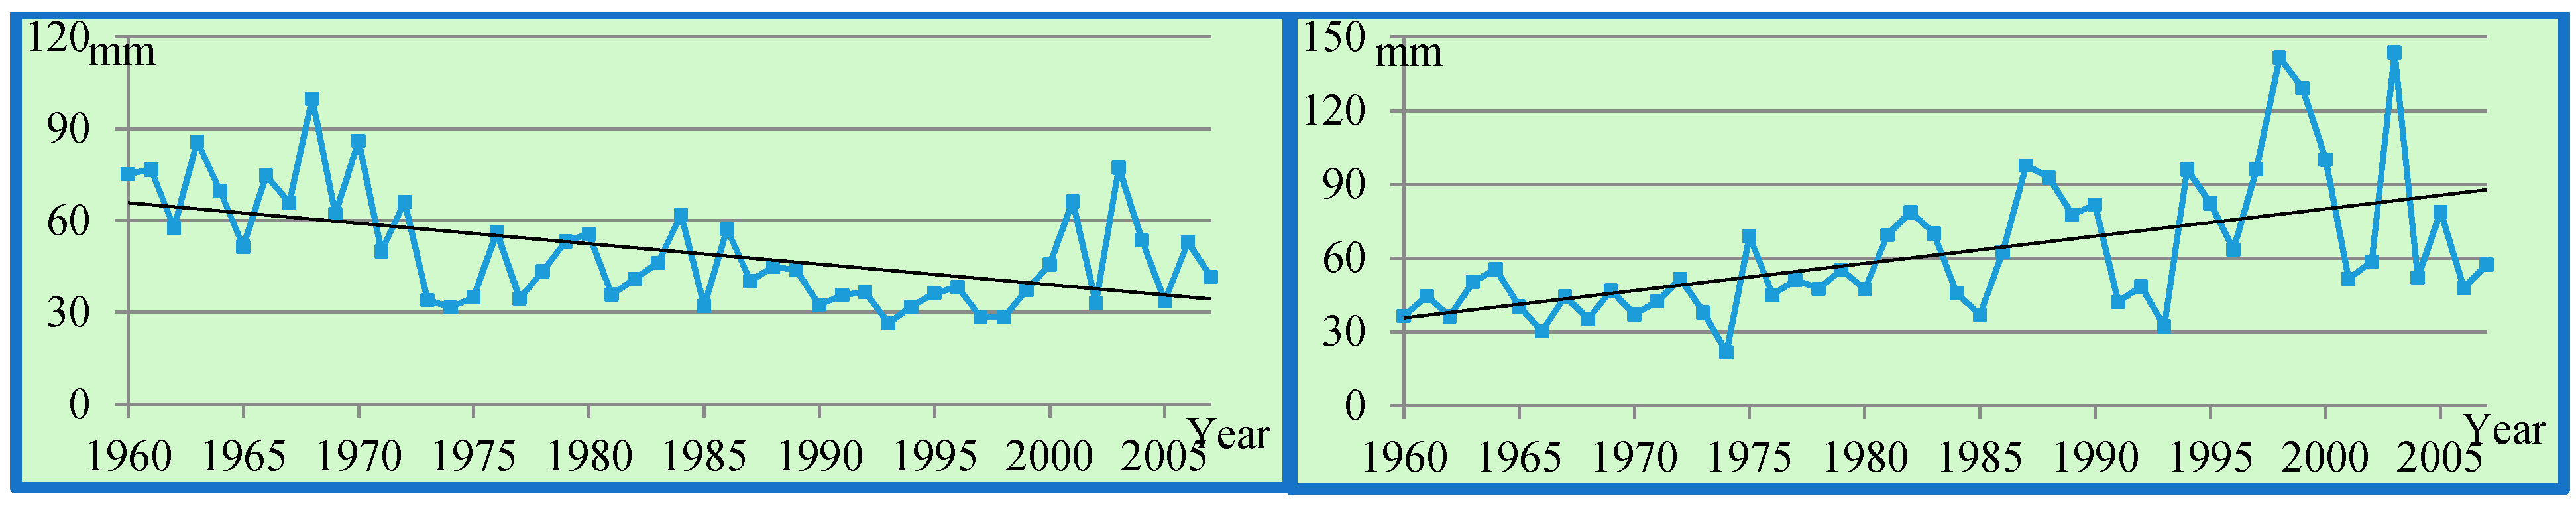
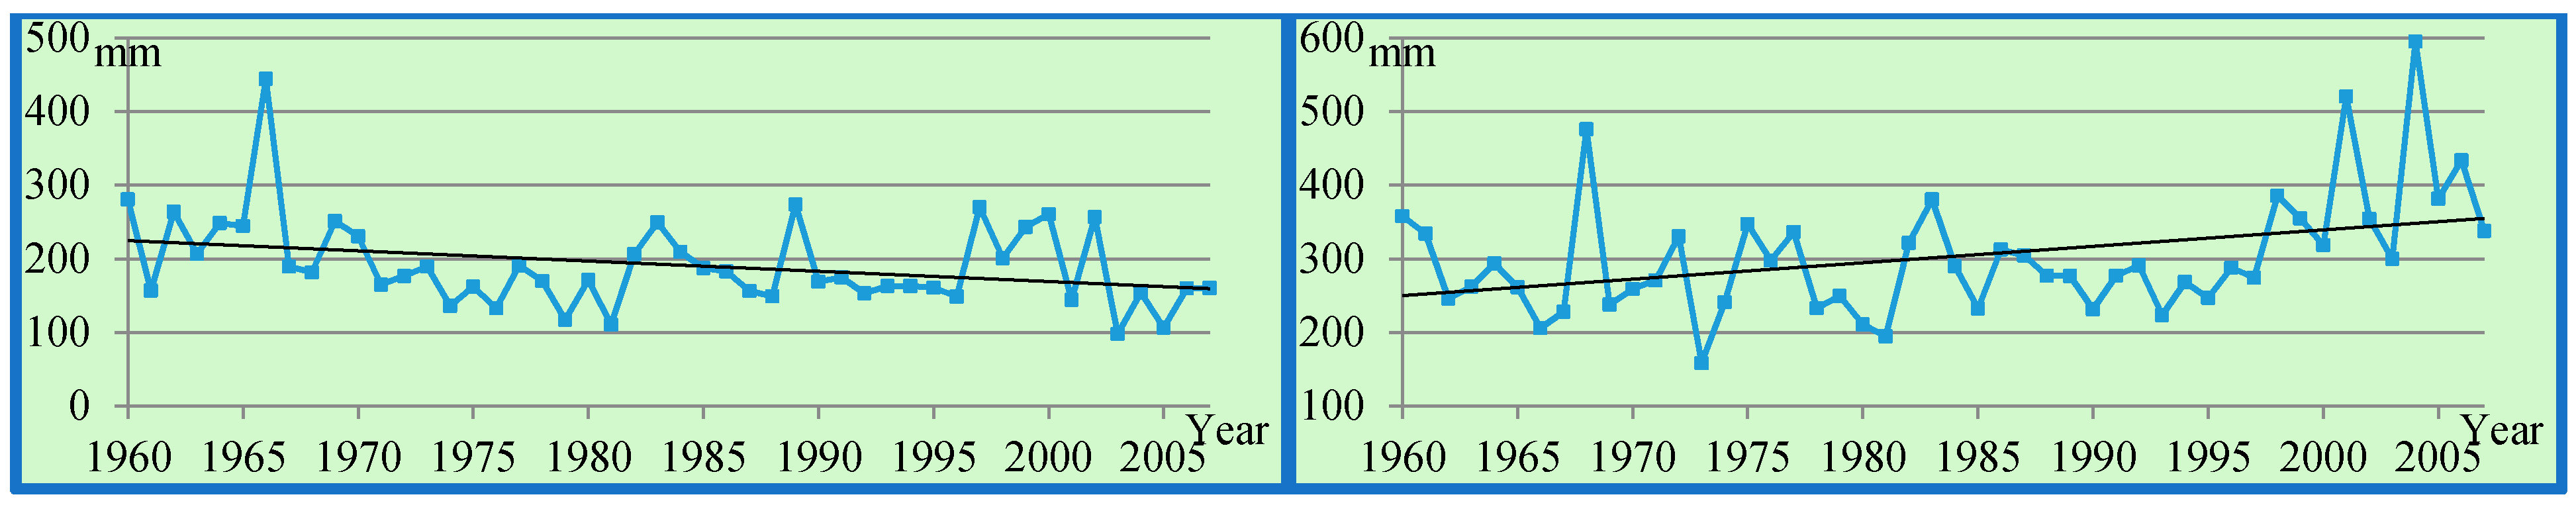
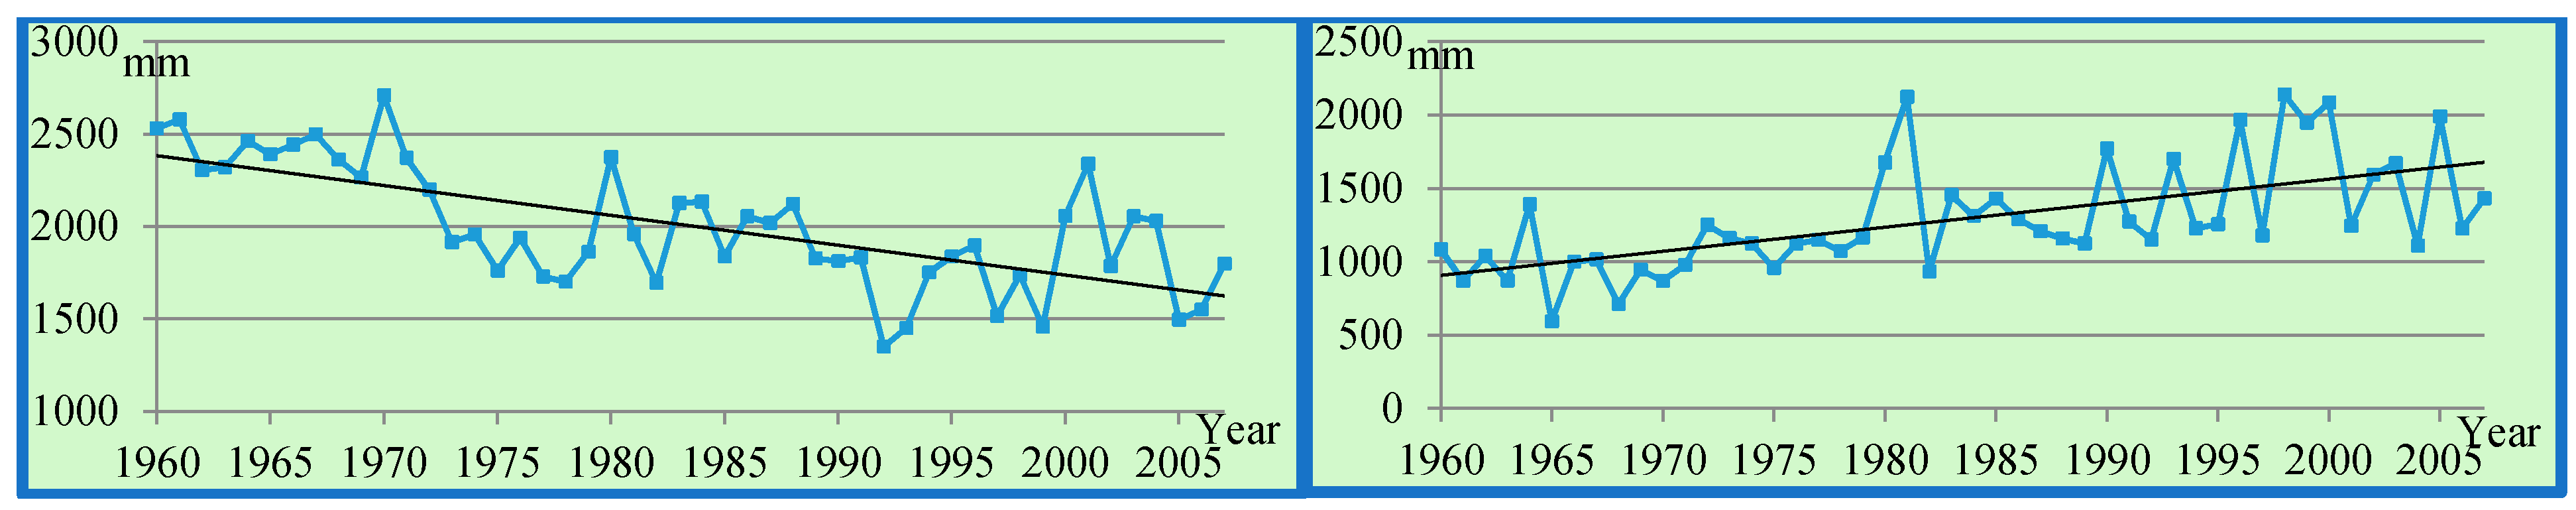
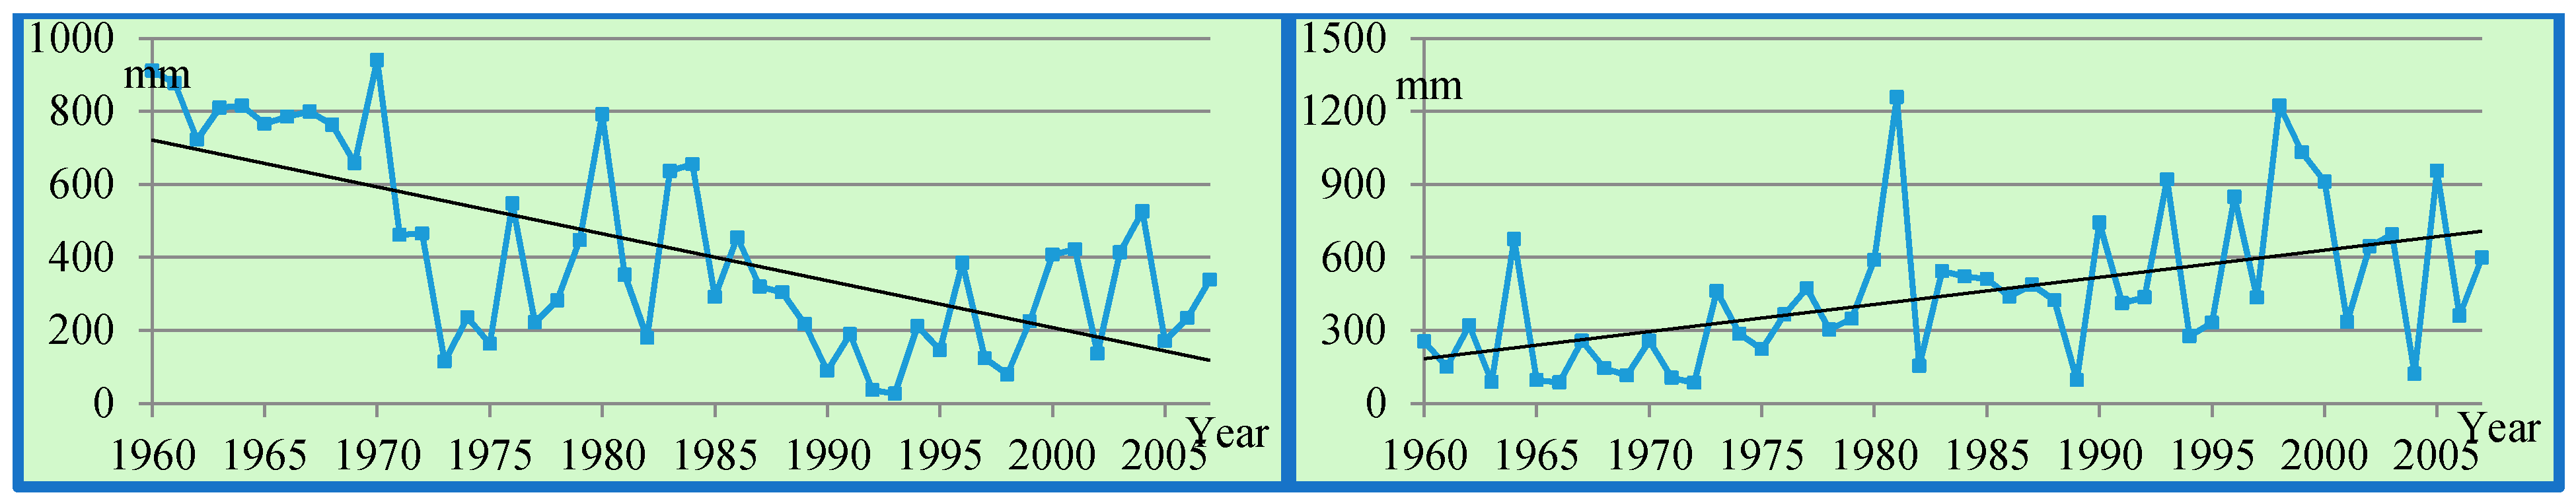
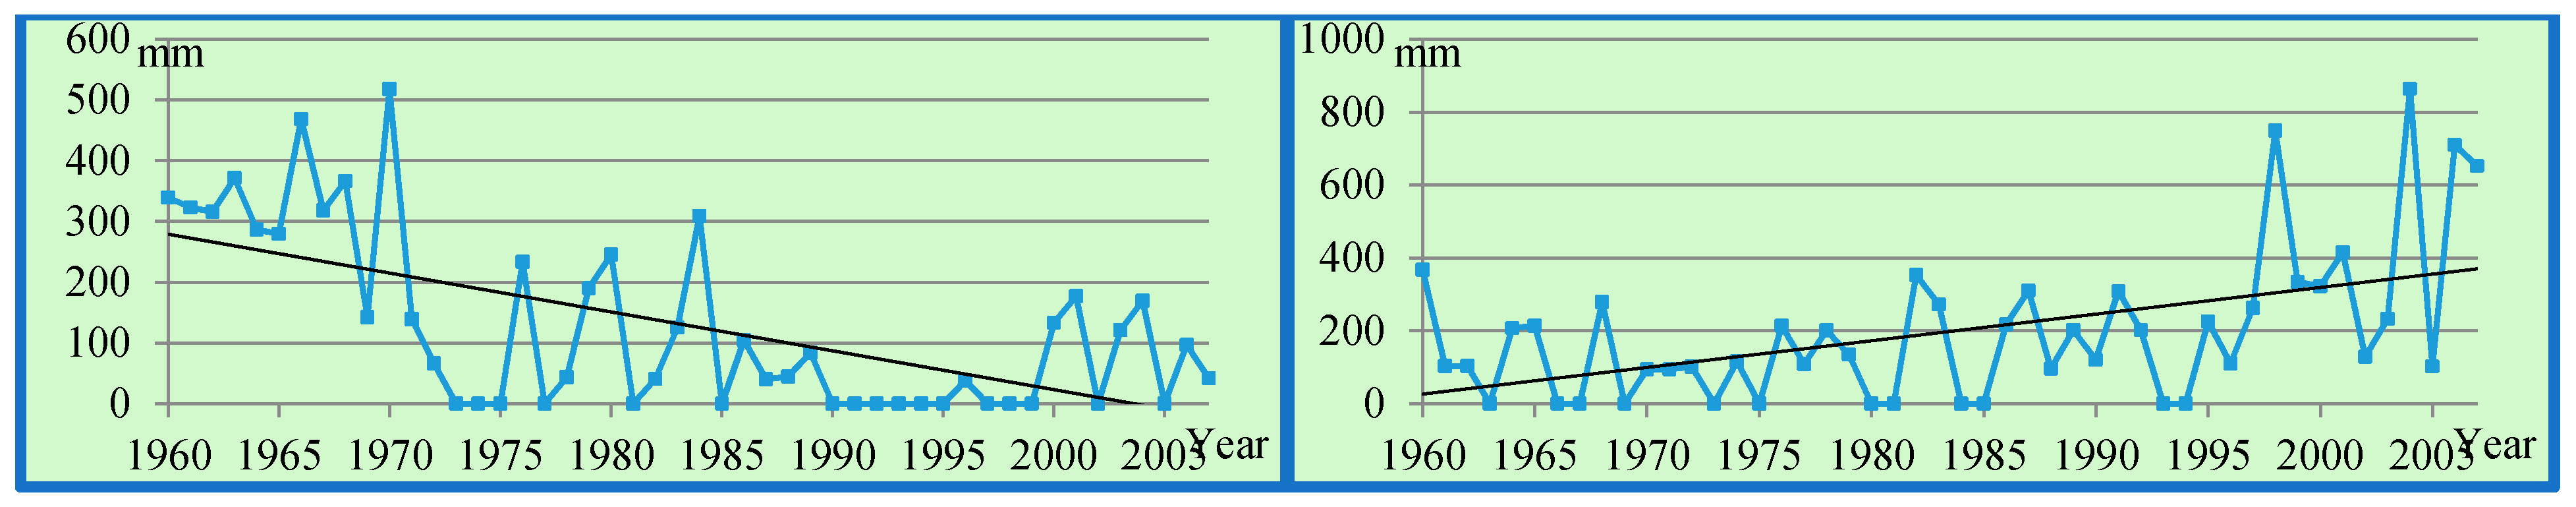
3.2.2. Intensity Indices

| Indices | Positive Significant Trend (%) | Positive Non Significant Trend (%) | Negative Significant Trend (%) | Negative Non Significant Trend (%) |
|---|---|---|---|---|
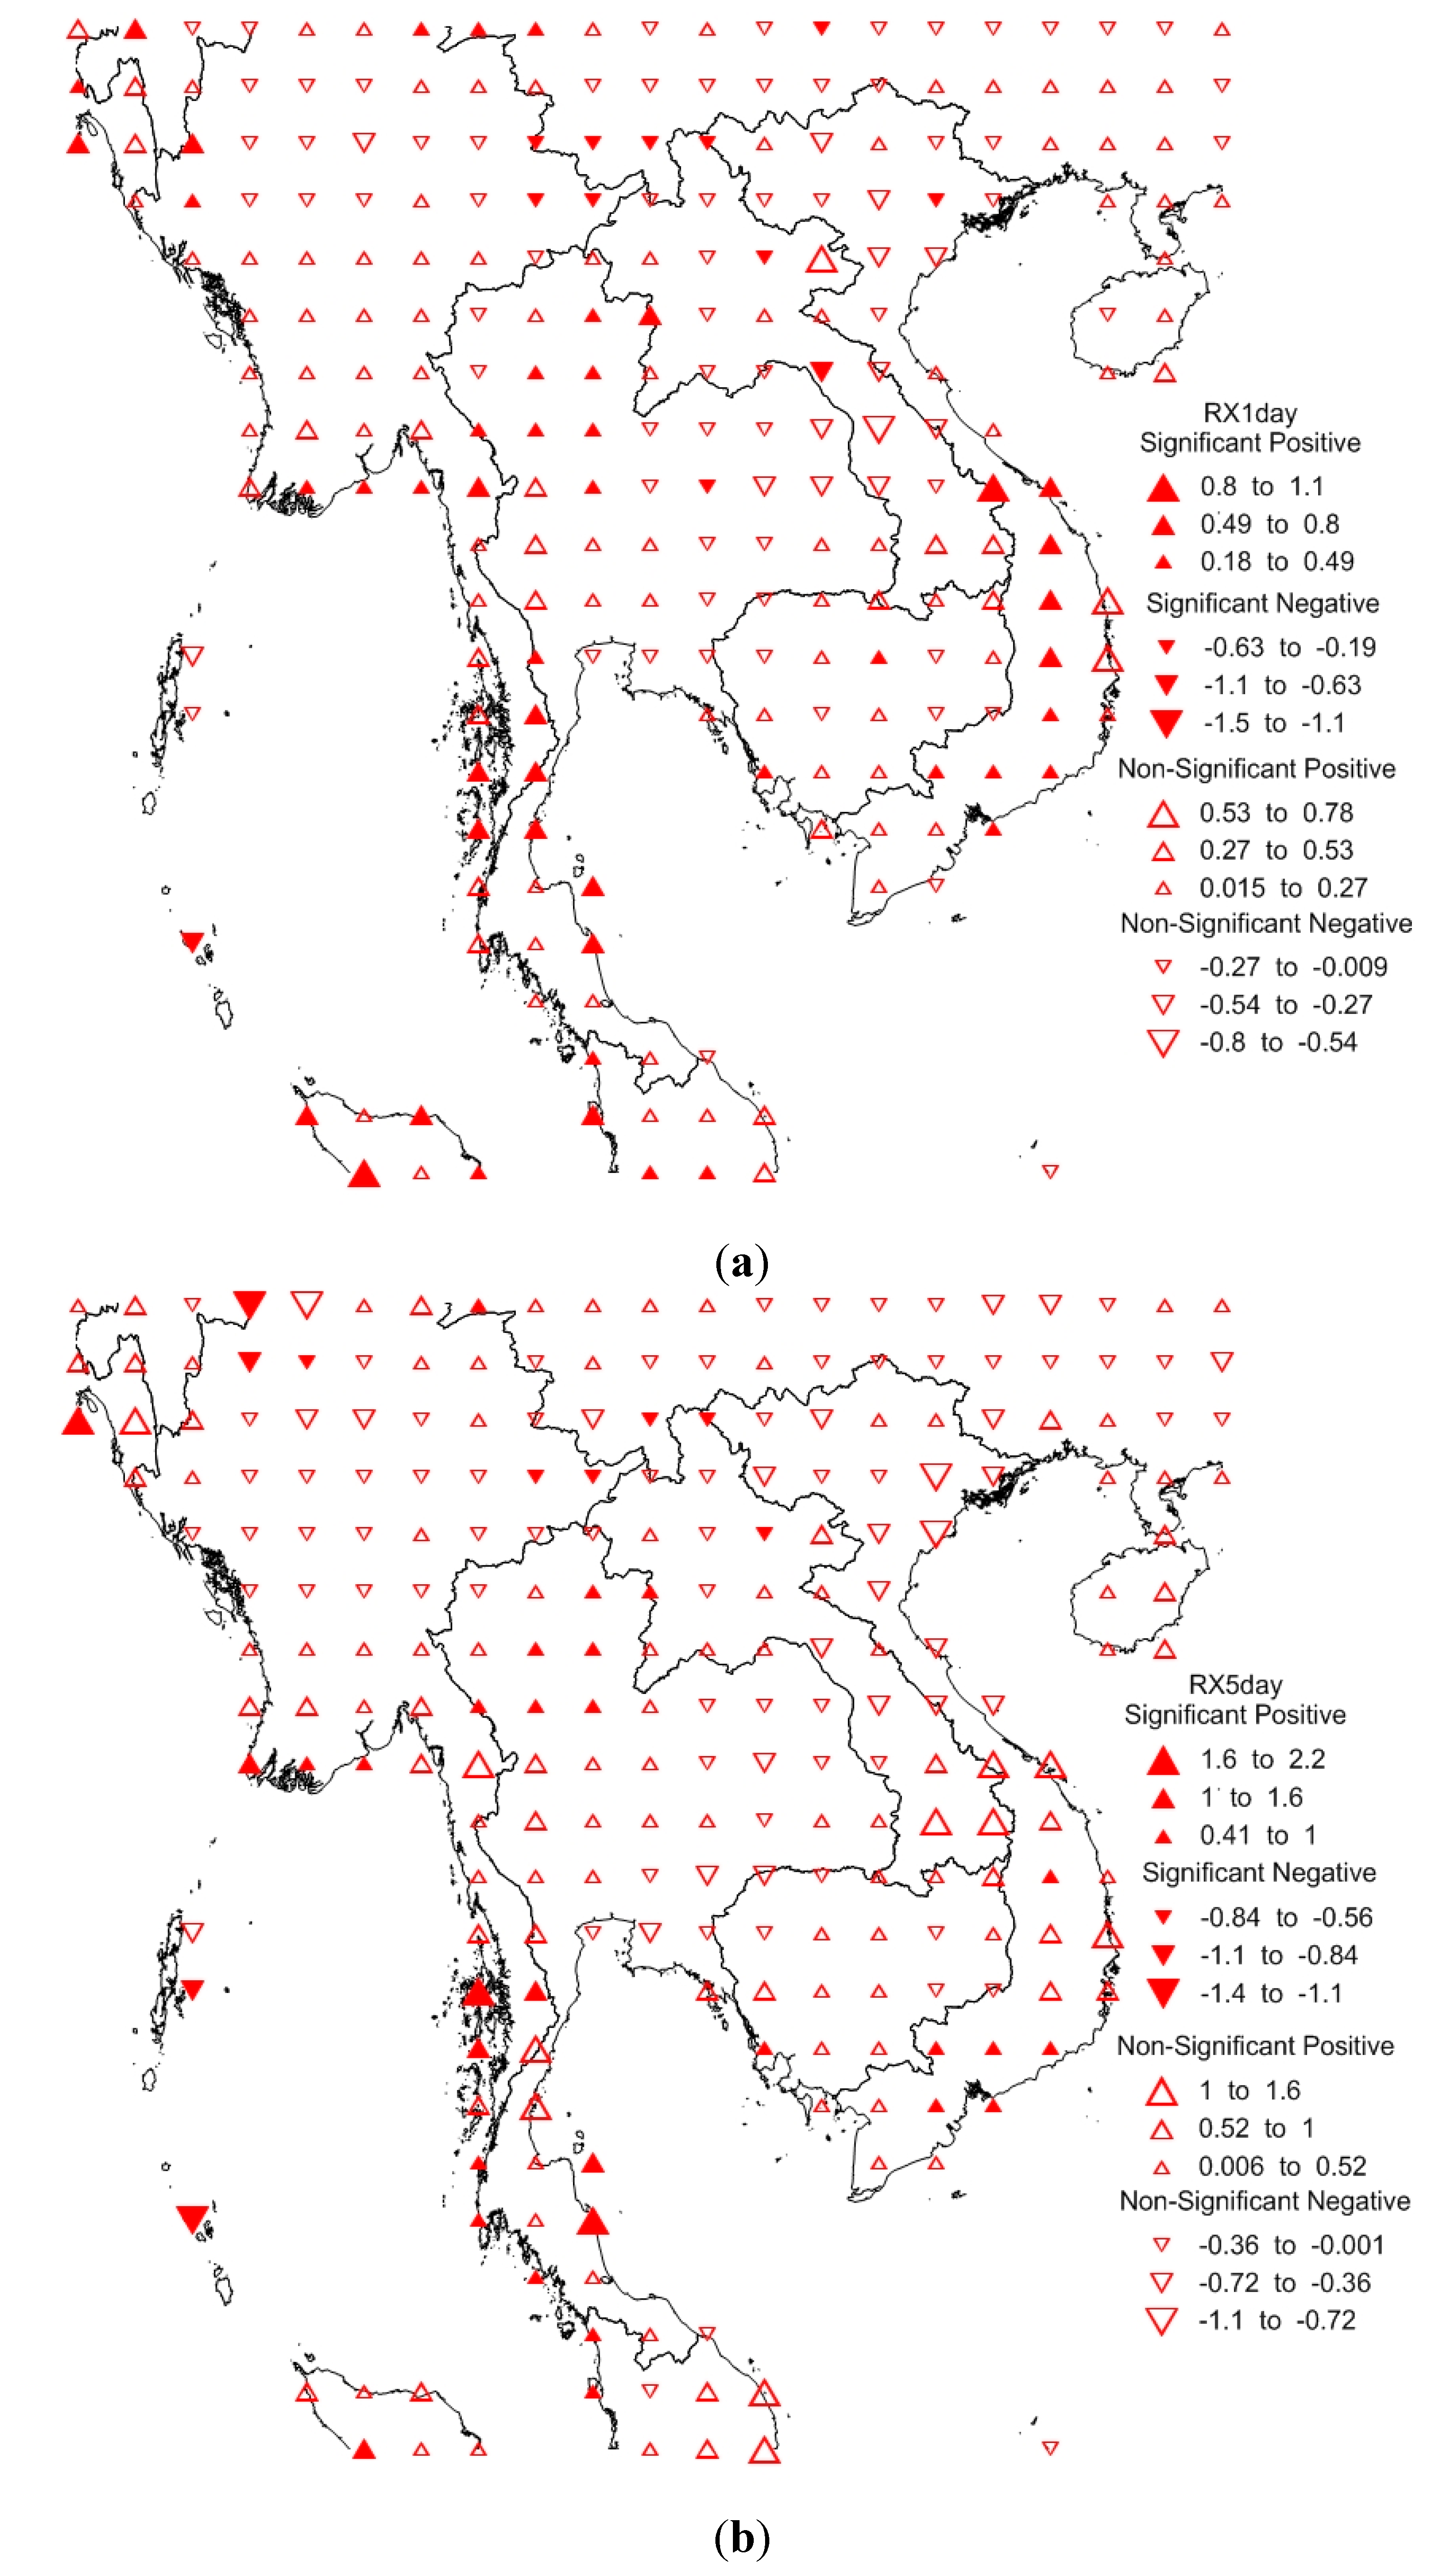
| RX1day | 20.16 | 42.74 | 4.83 | 31.85 |
| RX5day | 24.19 | 37.9 | 5.64 | 31.85 |
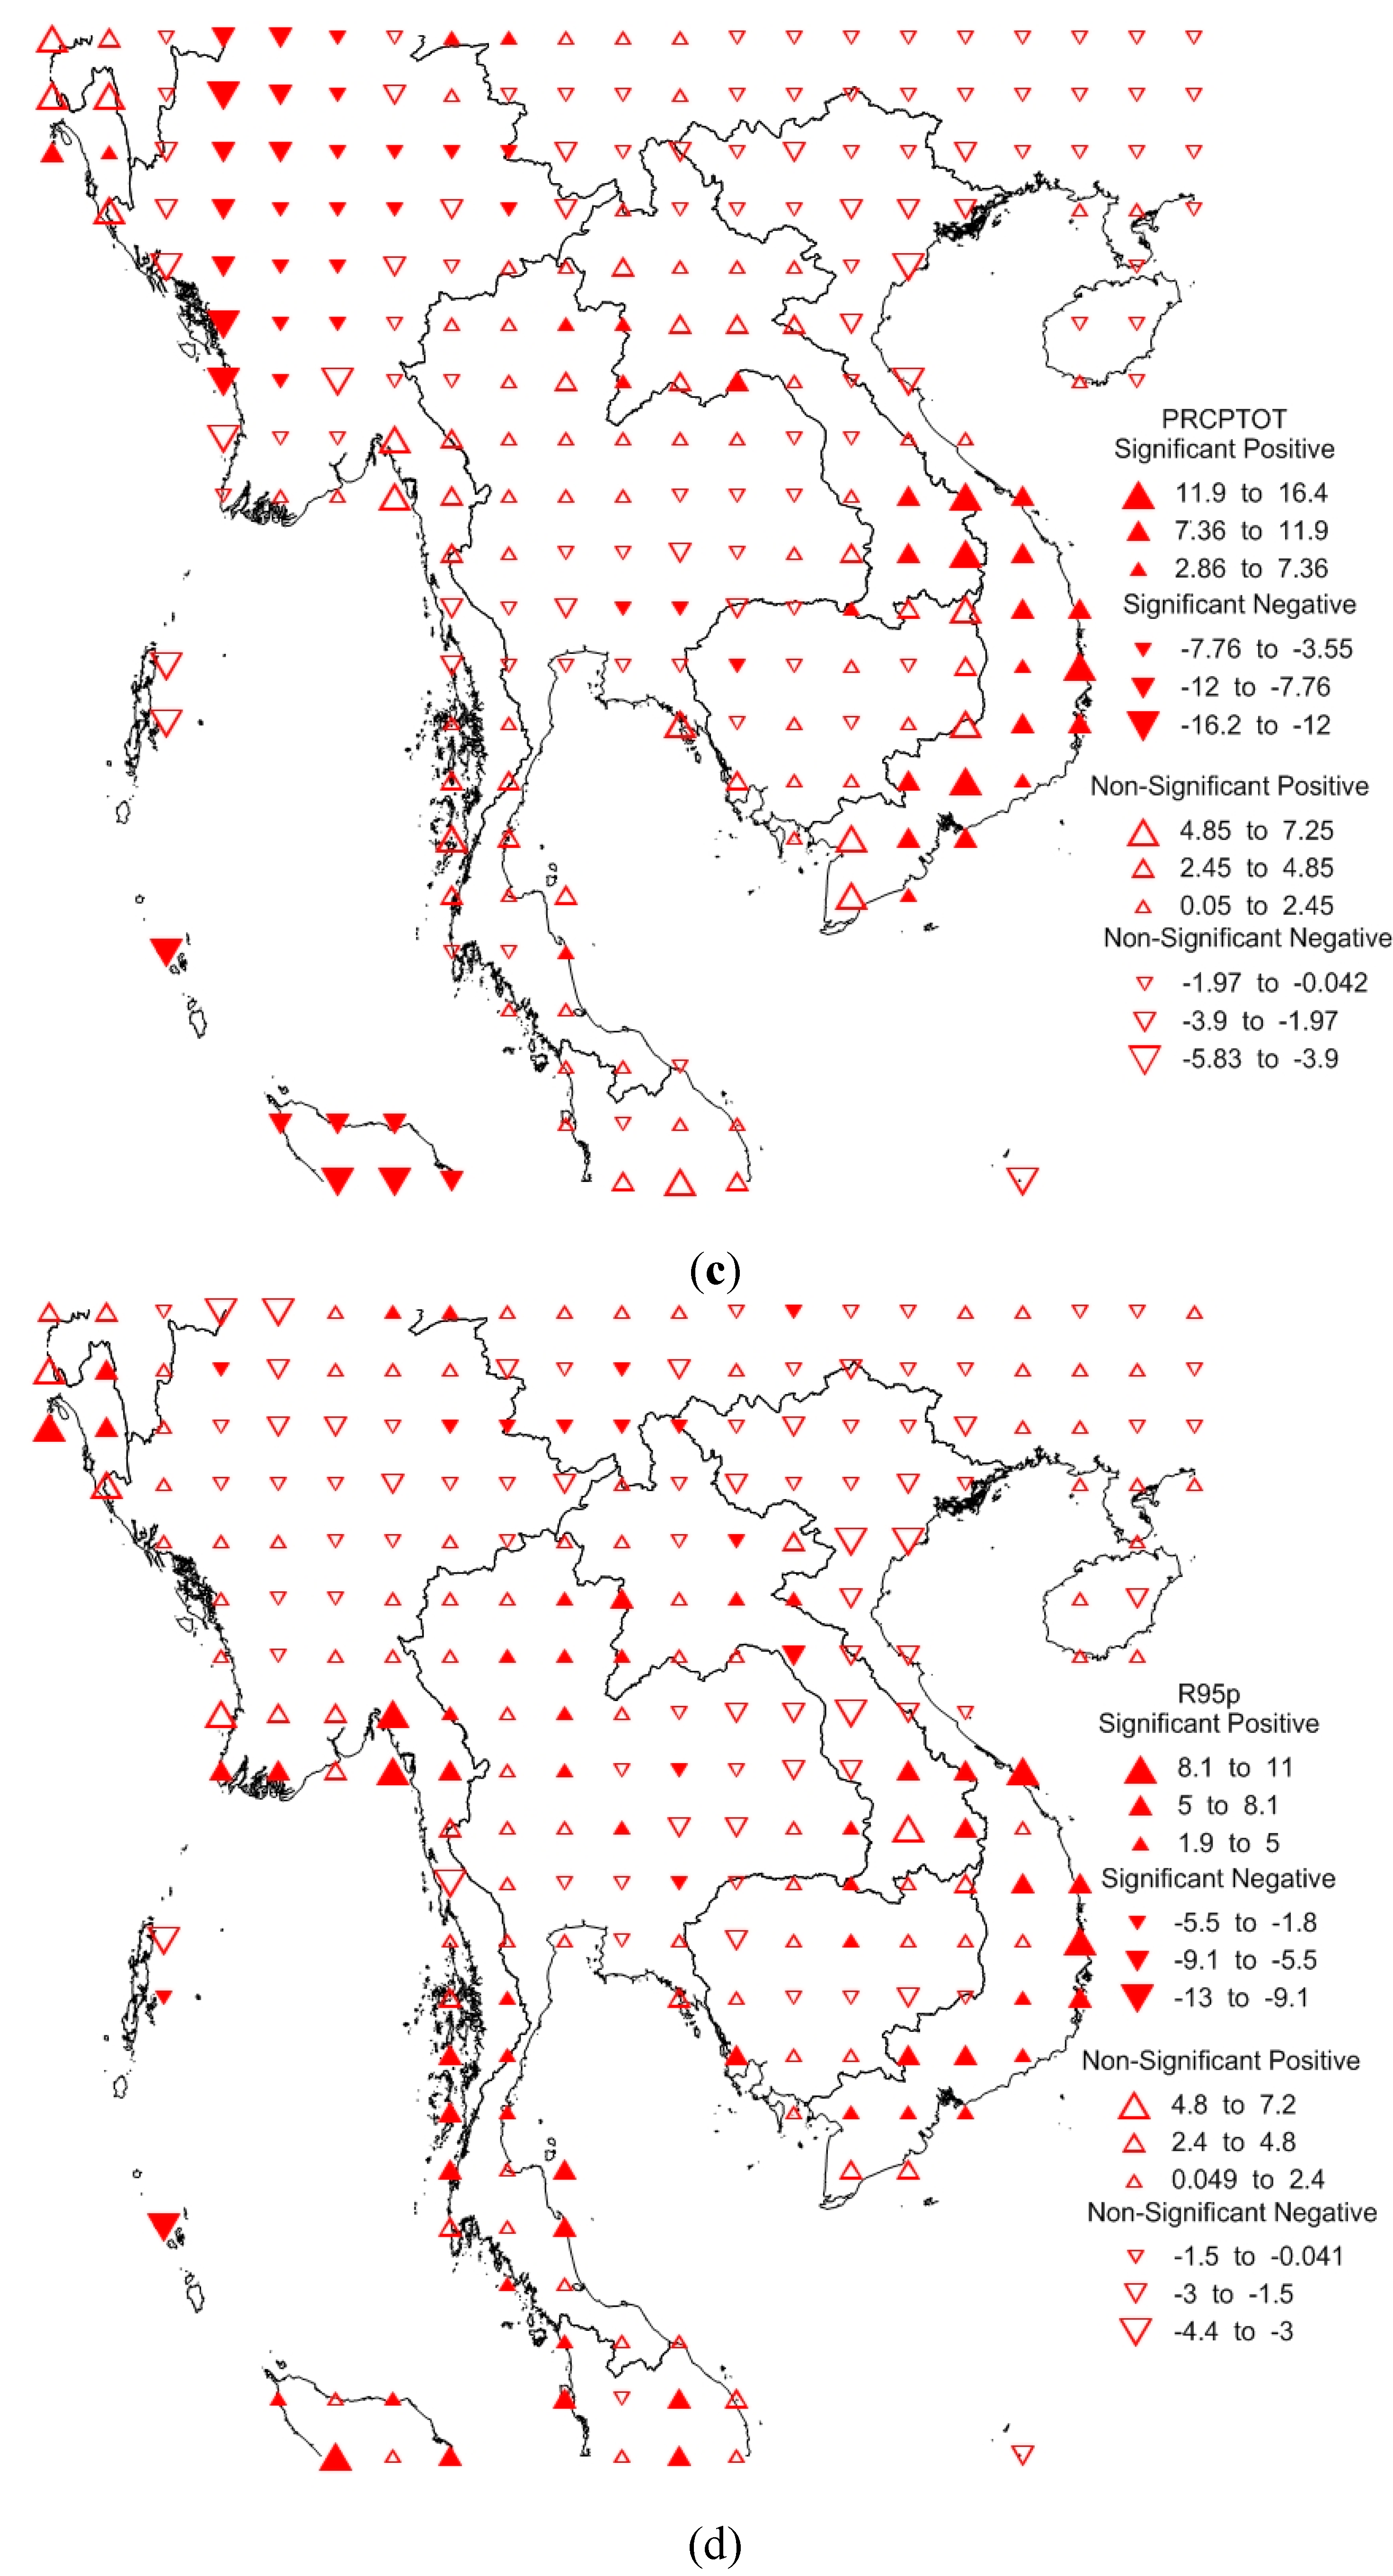
| PRCPTOT | 12.5 | 33.46 | 14.11 | 39.51 |
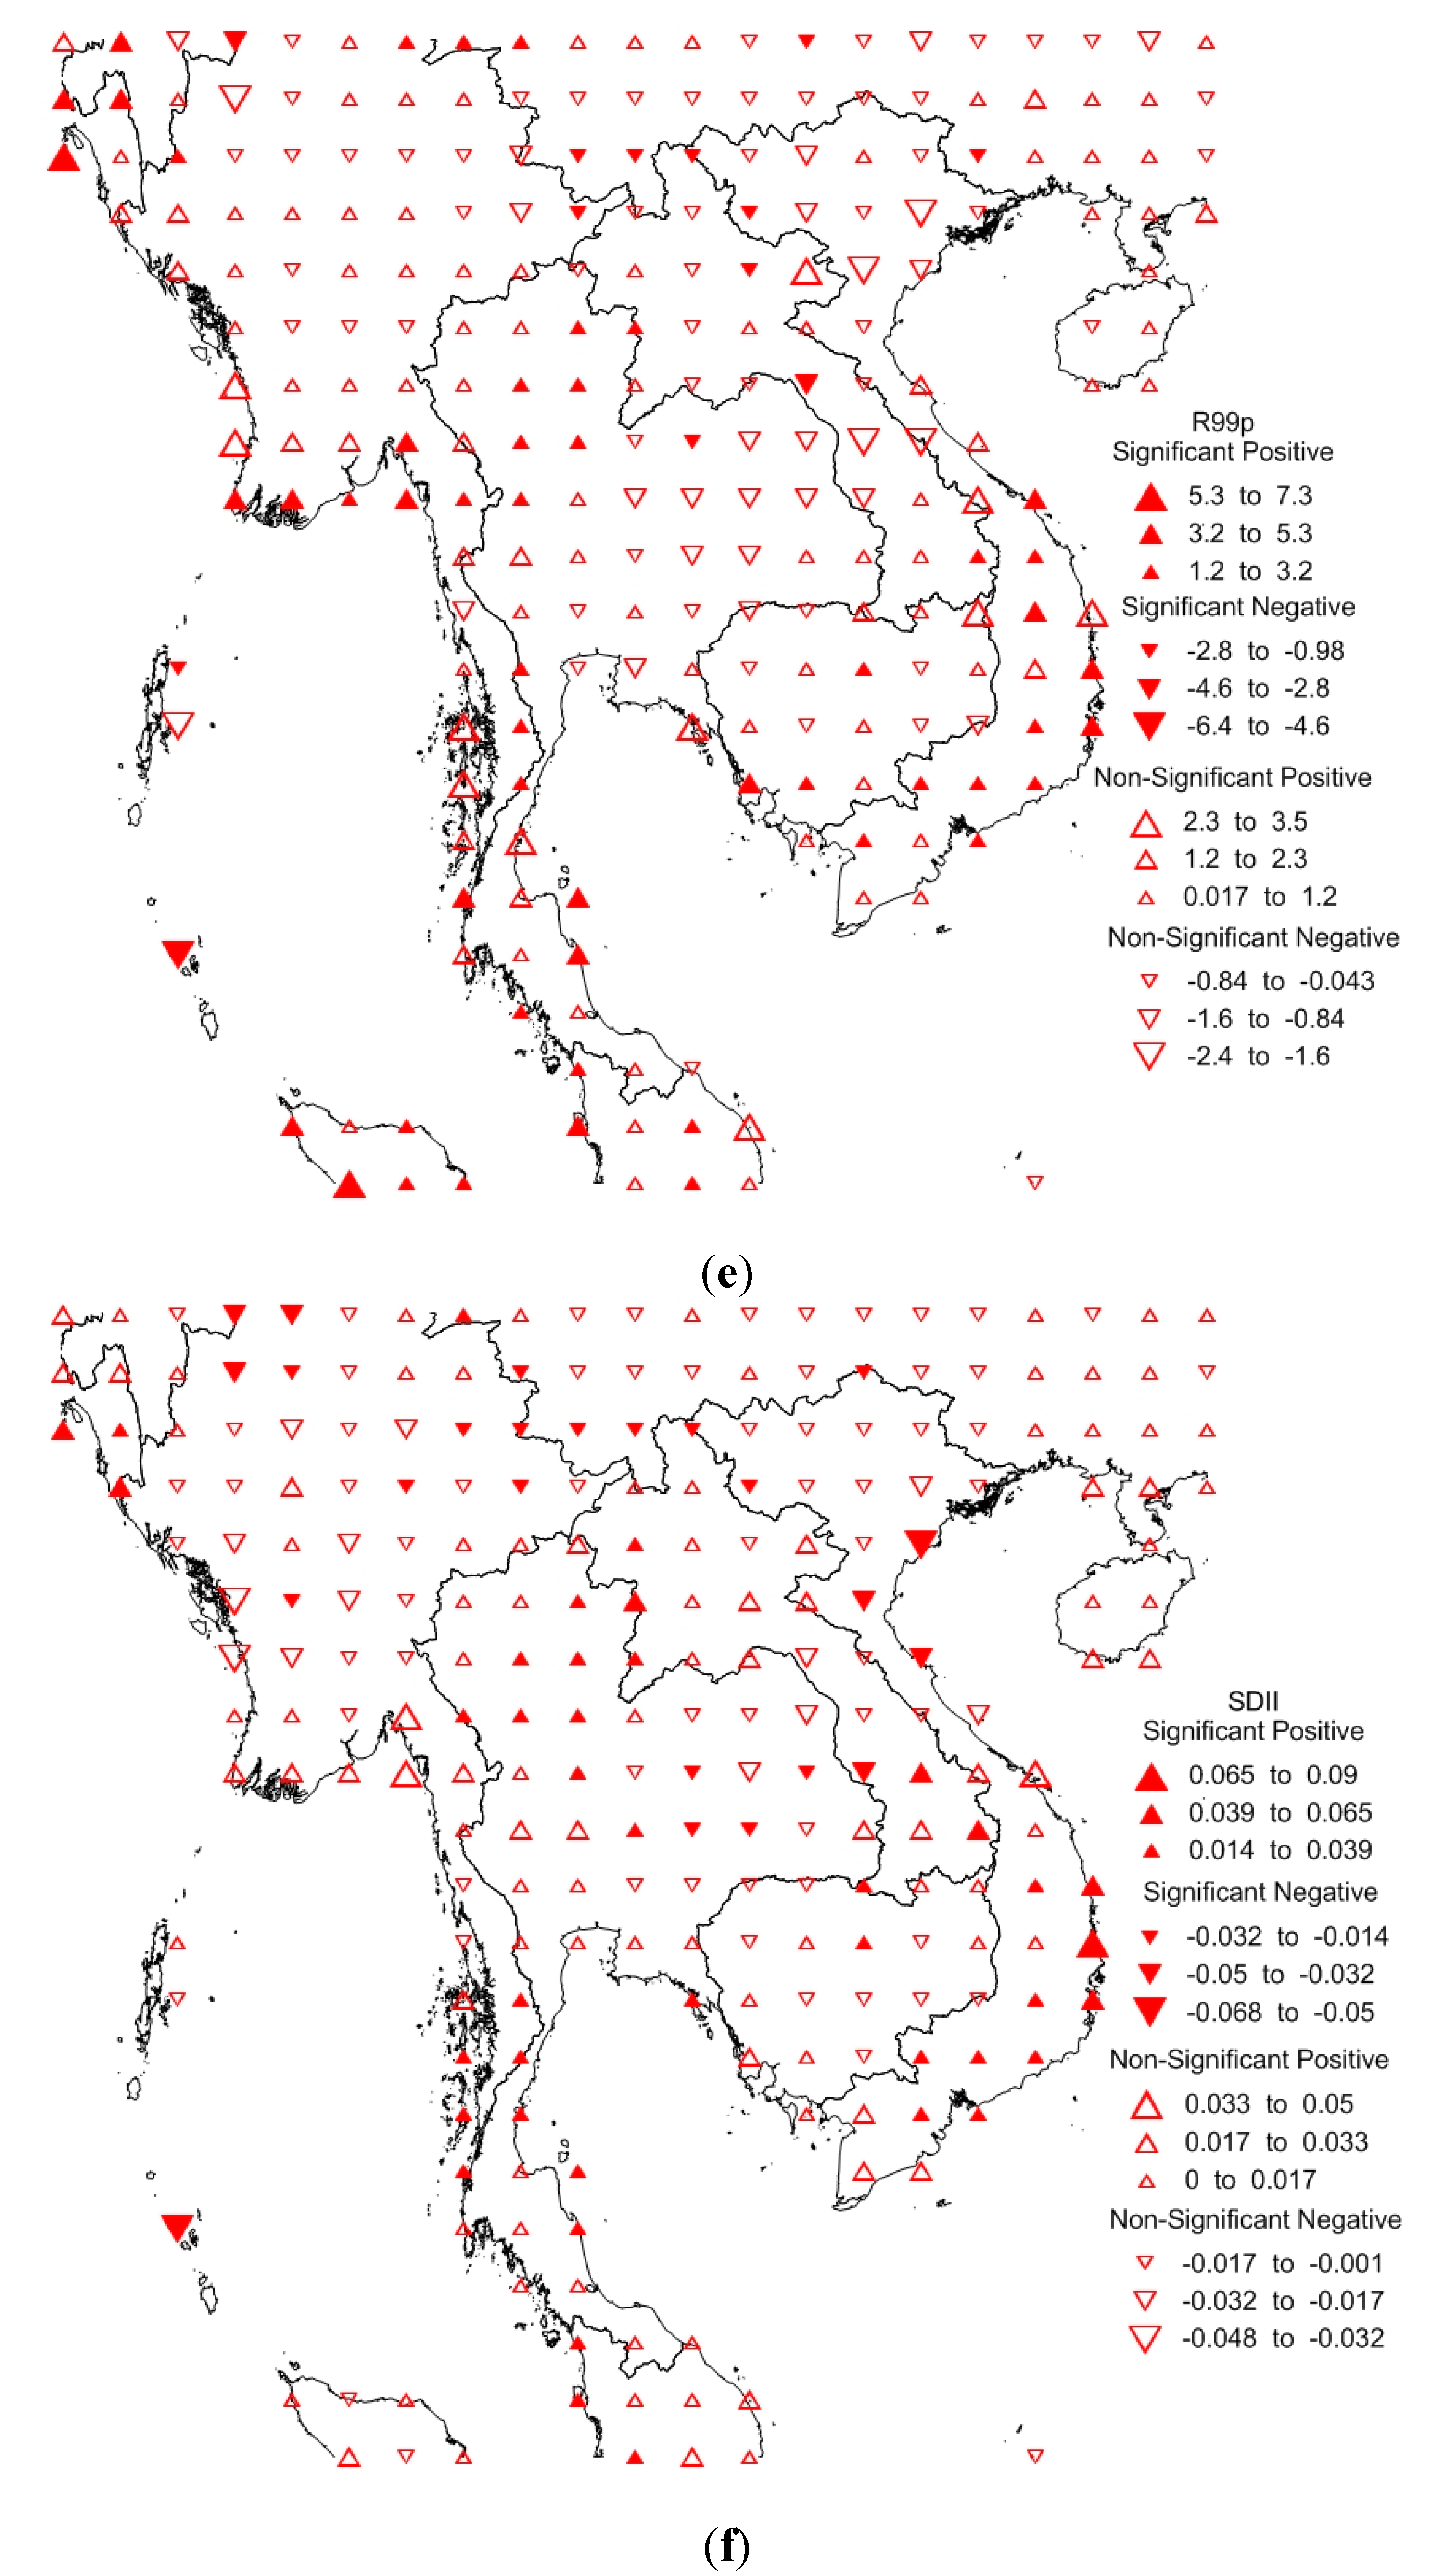
| SDII | 17.74 | 40.72 | 9.67 | 31.45 |
| R95p | 24.19 | 37.90 | 5.64 | 31.85 |
| R99p | 22.17 | 39.91 | 5.24 | 32.25 |
| No | Lat | Lon | Near City | R10mm | R20mm | R25mm | CDD | CWD |
|---|---|---|---|---|---|---|---|---|
| Days | Days | Days | Days | Days | ||||
| 1 | 100.25 | 14.25 | Bangkok | −0.103 | −0.003 | −0.009 | 0.599 | −0.096 |
| 2 | 104.25 | 11.25 | Phnom Penh | 0.041 | 0.058 | 0.05 | 0.404 | 0.291 |
| 3 | 105.25 | 21.25 | Hanoi | −0.091 | −0.051 | −0.005 | −0.062 | 0.054 |
| 4 | 106.25 | 10.25 | Saigon | 0.277 | 0.084 | 0.029 | −0.578 | 0.36 |
| 5 | 102.25 | 17.25 | Vientiane | 0.012 | −0.021 | −0.013 | 0.184 | 0.204 |
| 6 | 96.25 | 16.25 | Yangon | −0.059 | −0.056 | 0.067 | 0.363 | −0.897 |
| No | Lat | Lon | Near City | RX1 Day | RX5 Day | PRCPTOT |
|---|---|---|---|---|---|---|
| mm | mm | Mm | ||||
| 1 | 100.25 | 13.25 | Bangkok | 0.181 | 0.074 | −2.353 |
| 2 | 104.25 | 11.25 | Phnom Penh | 0.135 | 0.4 | 0.475 |
| 3 | 105.25 | 21.25 | Hanoi | −0.363 | −0.357 | −2.154 |
| 4 | 106.25 | 10.25 | Saigon | 0.133 | 0.413 | 7.602 |
| 5 | 102.25 | 17.25 | Vientiane | −0.208 | −0.021 | 0.505 |
| 6 | 96.25 | 16.25 | Yangon | 0.4 | 0.802 | 1.587 |
| No | Lat | Lon | Near City | SDII | R95p | R99p |
|---|---|---|---|---|---|---|
| mm/day | mm | Mm | ||||
| 1 | 100.25 | 13.25 | Bangkok | 0.003 | 0.411 | −0.587 |
| 2 | 104.25 | 11.25 | Phnom Penh | 0.011 | 1.819 | 1.453 |
| 3 | 105.25 | 21.25 | Hanoi | −0.015 | −1.176 | −0.663 |
| 4 | 106.25 | 10.25 | Saigon | 0.017 | 2.517 | 1.096 |
| 5 | 102.25 | 17.25 | Vientiane | −0.01 | −1.209 | −1.314 |
| 6 | 96.25 | 16.25 | Yangon | 0.017 | 4.269 | 2.841 |
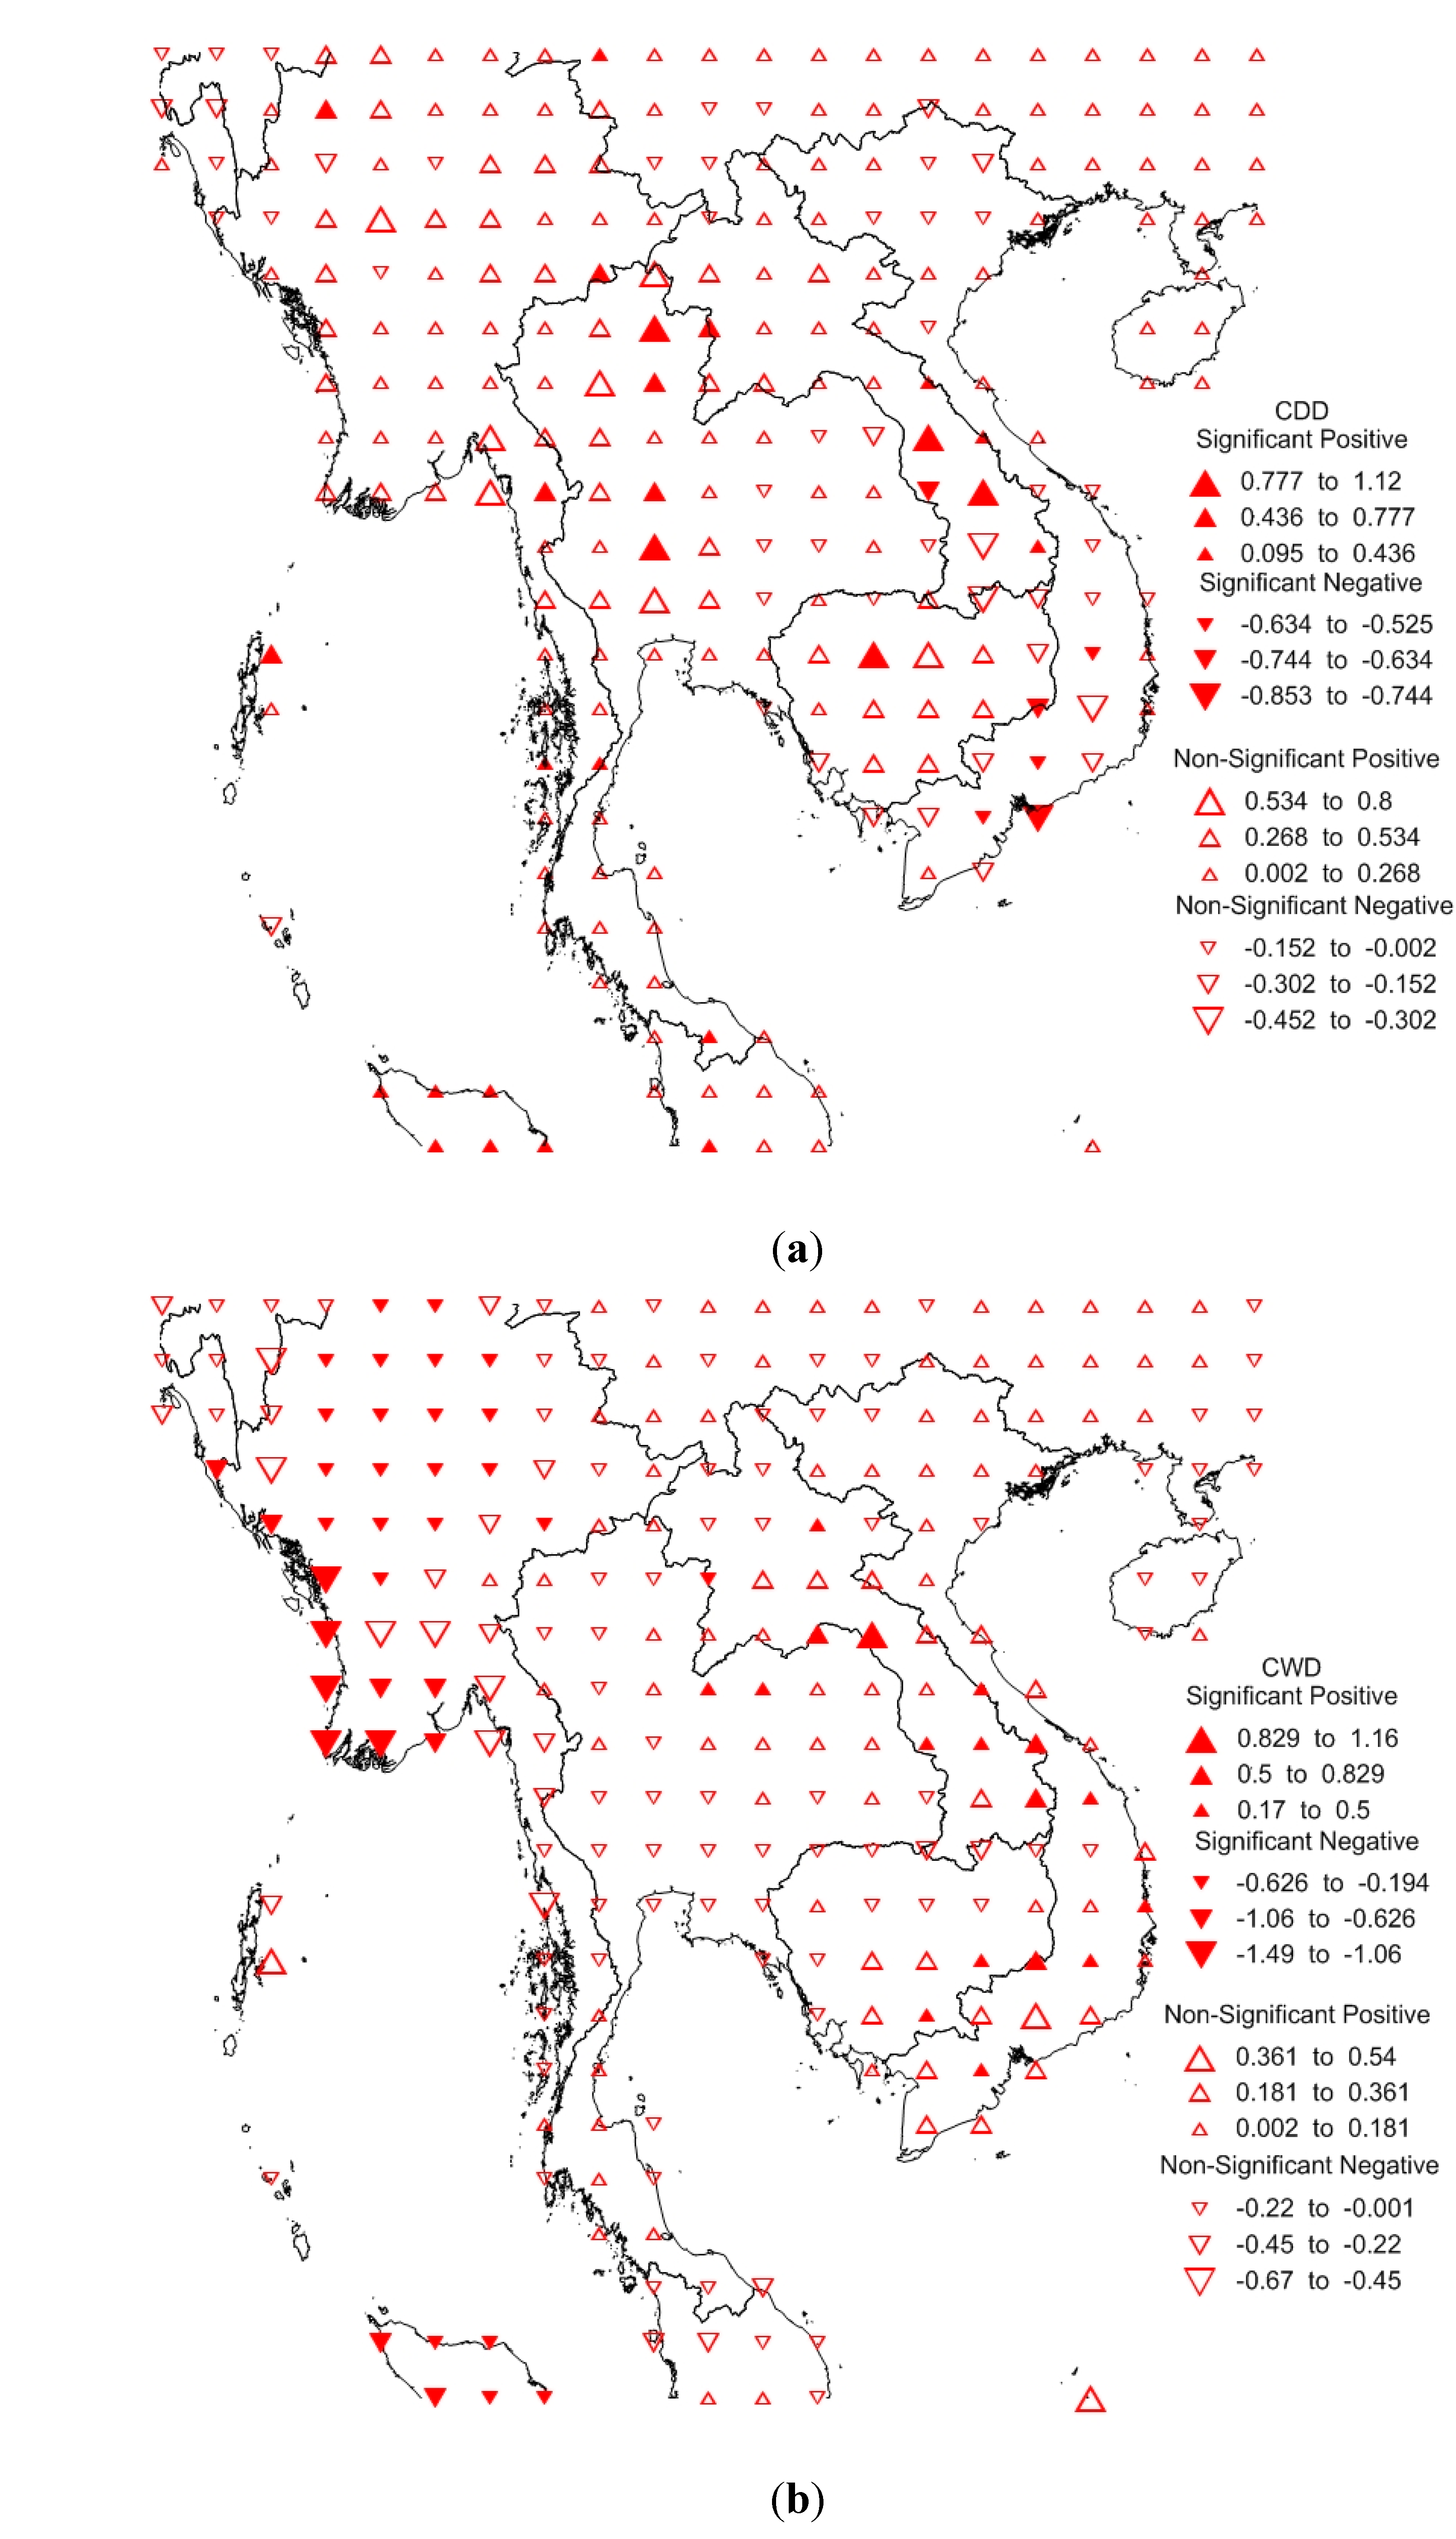
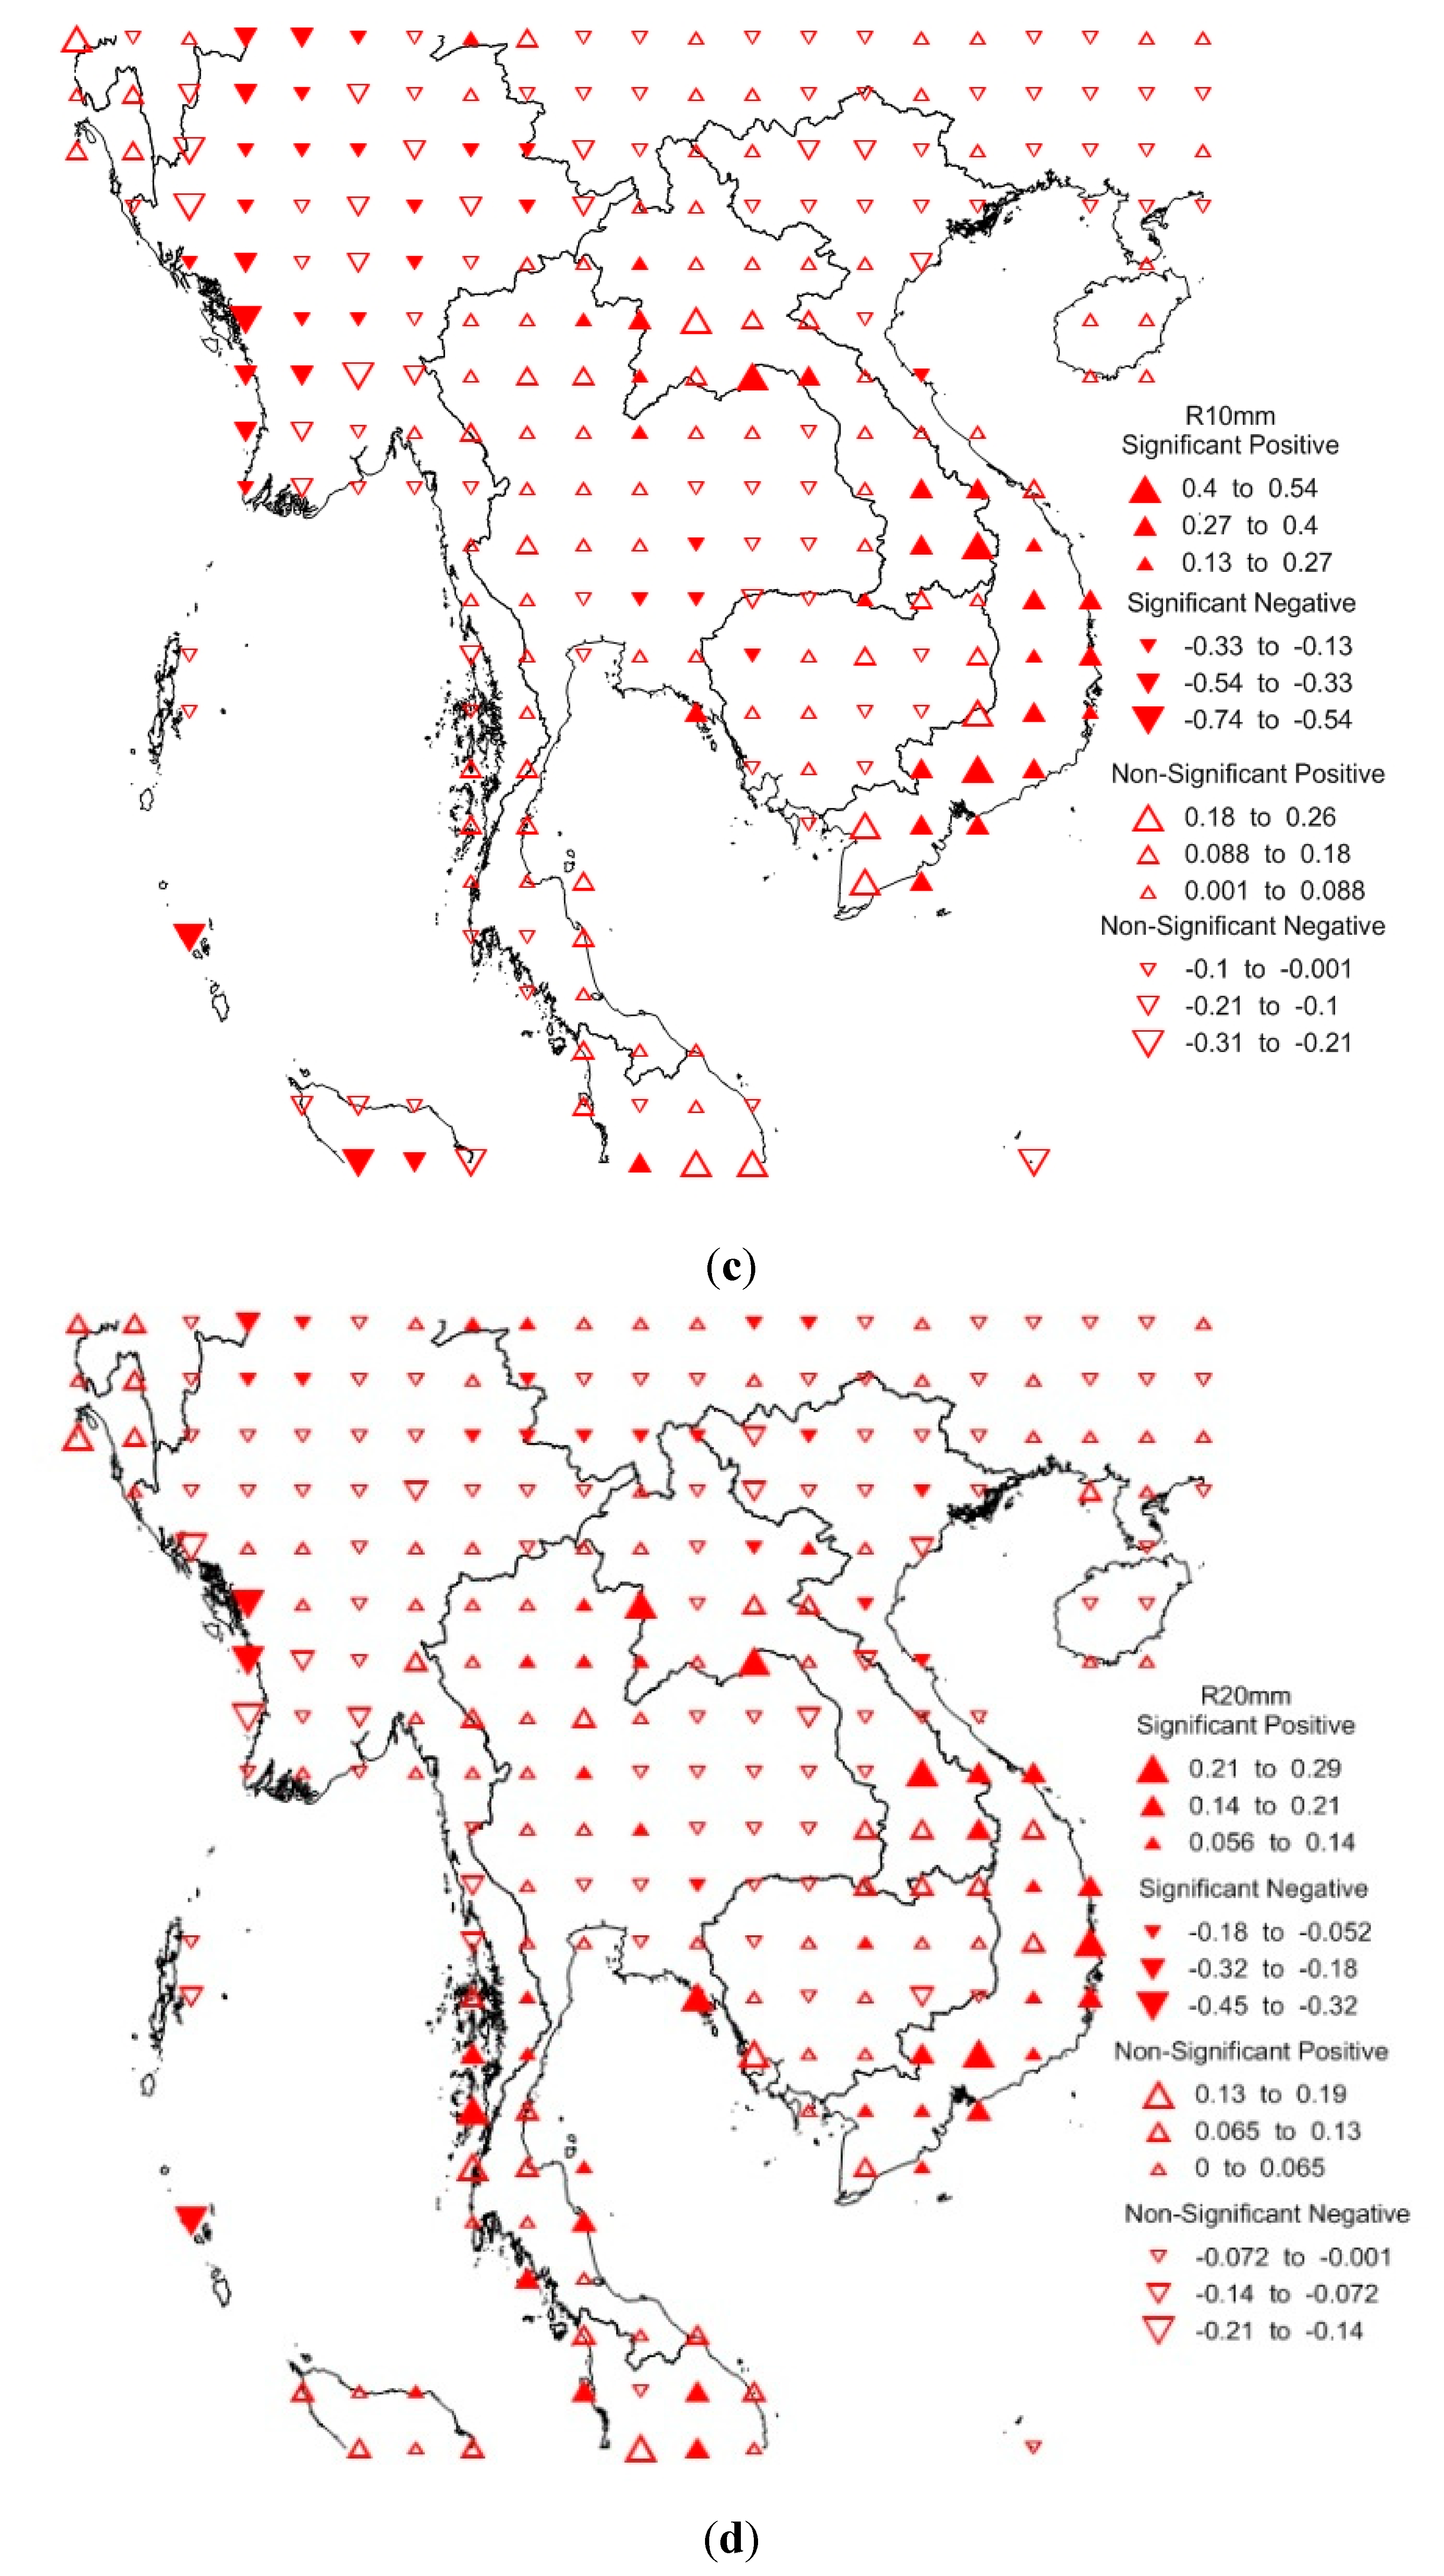
3.3. Spatial Pattern of Detected Trend
3.3.1. Frequency Indices


3.3.2. Intensity Indices


4. Conclusions
Acknowledgments
Author Contributions
Conflicts of Interest
References
- Yazid, M.; Humphries, U.; Sudarmadji, T. Spatiotemporal of extreme rainfall events in the Indochina peninsula. In Proceedings of the 2014 International Conference on Applied Statistics, Khon Kaen, Thailand, 21–24 May 2014; pp. 238–245.
- Abbas, F.; Ahmad, A.; Safeeq, M.; Ali, S.; Saleem, F.; Hammad, H.M.; Farhad, W. Changes in precipitation extremes over arid to semiarid and subhumid punjab, Pakistan. J. Theor. Appl. Climatol. 2013. [Google Scholar] [CrossRef]
- Atsamon, L.; Sangchan, L.; Thavivongse, S. Assessment of extreme weather events along the coastal areas of Thailand. In Proceedings of the 2009 Conference on Climate Variability and Change, Washington, DC, USA, 2–6 February 2009.
- Klein Tank, A.M.G.; Konnen, G.P. Trends in indices of daily temperature and precipitation extremes in Europe, 1946–1999. J. Clim. 2003, 16, 3665–3680. [Google Scholar] [CrossRef]
- Santos, C.A.C.; Brito, J.I.B.; Junior, C.H.F.S.; Dantas, L.G. Trends in precipitation extremes over the northern part of Brazil from Era40 dataset. Rev. Bras. Geogr. Fis. 2012, 4, 836–851. [Google Scholar]
- Kunkel, K.E.; Andsager, K.; Easterling, D.R. Long-term trends in extreme precipitation events over the conterminous United States and Canada. J. Clim. 1999, 12, 2515–2527. [Google Scholar] [CrossRef]
- Mason, S.J.; Waylen, P.R.; Mimmack, G.M.; Rajaratnam, B.; Harrison, J.M. Changes in extreme rainfall events in South Africa. Clim. Chang. 1999, 41, 249–257. [Google Scholar] [CrossRef]
- Haylock, M.; Nicholls, N. Trends in extreme rainfall indices for an updated high quality data set for Australia, 1910–1998. Int. J. Climatol. 2000, 20, 1533–1541. [Google Scholar] [CrossRef]
- Suppiah, R.; Hennessy, K.J. Trend in total rainfall, heavy rain events and number of dry days in Australia, 1910–1990. Int. J. Climatol. 1998, 10, 1141–1164. [Google Scholar] [CrossRef]
- Fu, G.; Viney, N.R.; Charles, S.P.; Liu, J. Long-term temporal variation of extreme rainfall events in Australia: 1910–2006. J. Clim. 2010, 11, 950–965. [Google Scholar]
- Choi, G.; Collins, D.; Ren, G.; Trewin, B.; Baldi, M.; Fukuda, Y.; Afzaal, M.; Pianmana, T.; Gomboluudev, P.; Huong, P.T. Changes in means and extreme events of temperature and precipitation in the Asia-Pacific Network region, 1955–2007. Int. J. Climatol. 2009, 29, 1906–1925. [Google Scholar] [CrossRef]
- Yin, H.; Donat, M.G.; Alexander, L.V.; Sun, Ying. Multi-dataset comparison of gridded observed temperature and precipitation extremes over China. Int. J. Climatol. 2014. [Google Scholar] [CrossRef]
- Tank, A.M.G.K.; Zwiers, F.W.; Zhang, X. Guidelines on analysis of extremes in a changing climate in support of informed decisions for adaptation. In Climate Data and Monitoring; World Meteorological Organization: Geneva, Switzerland, 2009; pp. 50–52. [Google Scholar]
- Jones, C.; Waliser, D.E.; Lau, K.M.; Stern, W. Global occurrences of extreme precipitation and the Madden—Julian Oscillation: Observations and predictability. J. Clim. 2004, 17, 4575–4589. [Google Scholar] [CrossRef]
- Salomon, S.; Qin, D.; Manning, M.; Chen, Z.; Marquis, M.; Averyt, K.B.; Tignor, M.; Miller, H.L. Contribution of Working Group 1 to the Fourth Assessment Report of the Intergovernmental Panel on Climate Change (IPCC); Cambridge University Press: Cambridge, UK, 2007. [Google Scholar]
- Carvalho, L.M.V.; Jones, C.; Liebmann, B. Extreme precipitation events in southeastern south America and large-scale convective patterns in the south Atlantic convergence zone. J. Clim. 2002, 15, 2377–2394. [Google Scholar] [CrossRef]
- Testik, F.Y.; Gebrenichael, M. Rainfall: State of the Science; American Geophysical Union: Washington, DC, USA, 2013. [Google Scholar]
- Frei, C.; Schar, C. Detection probability of trends in rare event: Theory and application to heavy precipitation in the alpine region. J. Clim. 2000, 14, 1568–1584. [Google Scholar] [CrossRef]
- Yatagai, A.; Kamighuci, K.; Arakawa, O.; Hamada, A.; Yasutomi, N.; Kitoh, A. Aphrodite constructing a long-term daily gridded precipitation dataset for asia based on a dense network of rain gauges. Am. Meteorol. Soc. 2012, 1401–1415. [Google Scholar] [CrossRef]
- Hamada, A.; Arakawa, O.; Yatagai, A. An automated quality control method for daily rain-gauge data. Global Environ. Res. 2011, 15, 183–192. [Google Scholar]
- Zhang, X.; Alexander, L.; Hegerl, G.C.; Jones, P.; Klein, T.A.; Peterson, T.C.; Trewin, B.; Zwier, F.W. Indices for monitoring changes in extremes based on daily temperature and precipitation data. Clim. Chang. 2011. [Google Scholar] [CrossRef]
- Zhang, X.; Hogg, W.D.; Mekis, E. Spatial and temporal characteristics of heavy precipitation events over Canada. Am. Meteorol. Soc. 2001, 14, 1923–1936. [Google Scholar]
- Subyani, A.M. Geostatistical study of annual and seasonal mean rainfall pattern in southwest Saudi Arabia. J. Meteorol. Sci. 2004, 49, 803–817. [Google Scholar]
© 2015 by the authors; licensee MDPI, Basel, Switzerland. This article is an open access article distributed under the terms and conditions of the Creative Commons Attribution license (http://creativecommons.org/licenses/by/4.0/).
Share and Cite
Yazid, M.; Humphries, U. Regional Observed Trends in Daily Rainfall Indices of Extremes over the Indochina Peninsula from 1960 to 2007. Climate 2015, 3, 168-192. https://doi.org/10.3390/cli3010168
Yazid M, Humphries U. Regional Observed Trends in Daily Rainfall Indices of Extremes over the Indochina Peninsula from 1960 to 2007. Climate. 2015; 3(1):168-192. https://doi.org/10.3390/cli3010168
Chicago/Turabian StyleYazid, Muhammad, and Usa Humphries. 2015. "Regional Observed Trends in Daily Rainfall Indices of Extremes over the Indochina Peninsula from 1960 to 2007" Climate 3, no. 1: 168-192. https://doi.org/10.3390/cli3010168
APA StyleYazid, M., & Humphries, U. (2015). Regional Observed Trends in Daily Rainfall Indices of Extremes over the Indochina Peninsula from 1960 to 2007. Climate, 3(1), 168-192. https://doi.org/10.3390/cli3010168