1. Introduction
Volcanic eruptions serve as major natural forcing factors that modulate atmospheric structure and climatic variation throughout the atmosphere, ranging from the troposphere up to the mesosphere. Most earlier studies have primarily concentrated on volcanic episodes rich in sulfate release, among which the 1991 Mount Pinatubo event has become a classic research benchmark [
1]. Events of this kind inject vast amounts of sulfur dioxide into the stratosphere, and subsequent chemical transformations produce widespread aerosol layers at these altitudes [
2]. The resulting aerosols reflect incoming solar radiation and trap upward longwave radiation, inducing regional warming within the stratosphere; such temperature anomalies perturb meridional thermal gradients and reshape the vertical profile of thermal winds, further modulating the upward propagation of gravity waves into the upper atmosphere. Over multiple months, continuous interplay between upward propagating waves and large-scale background circulation slowly remodels the dynamic and thermal state of the mesosphere [
3,
4]. The leading regulatory mechanisms vary with time: radiative effects control the early atmospheric adjustment, whereas dynamic feedback gradually takes a more prominent role in the later stage, and this evolutionary feature provides a clear physical basis for understanding the regional and global climatic effects induced by volcanic eruptions.
The 15 January 2022 HTHH eruption acted differently from common sulfate-driven events. It created a unique set of atmospheric responses. The eruption plume rose fast through the stratosphere. It carried massive amounts of water vapor to near 57 km [
5,
6]. The explosion was strong enough to trigger global tsunamis [
7,
8], strong atmospheric waves [
9], and ionosphere disturbances [
10]. Its longest-lasting climate effect was a nearly 10% jump in stratospheric water vapor. Unlike sulfate aerosols, water vapor emits infrared radiation very efficiently. Many papers have noted ozone loss and chemical changes in the stratosphere [
11,
12,
13]. Recent work also shows fast, strong cooling after the water vapor entered [
14,
15,
16]. This cooling changed temperature gradients. It also altered the polar vortex and wave propagation. These changes left marks on large-scale circulation patterns.
The 2022 HTHH eruption creates complex perturbations that extend into the middle and upper atmosphere. Observational and modeling studies remain scarce for the mesosphere and mesopause region near 80 km. Existing work has documented many thermal, chemical, and dynamical anomalies in the stratosphere. Mesospheric conditions, vertical energy propagation, and long-term hydrological variations still lack systematic quantification. The HTHH water vapor plume was not stationary. Large-scale circulation systems transported it deep into the mesosphere [
17]. We suggest that as the plume spread globally, the dominant thermodynamic mechanism changed nonlinearly. Early radiatively driven local cooling gave way to later dynamically driven warming. These changes relate to circulation adjustments and modified gravity wave filtering [
15,
18]. Direct observations remain rare. Systematic and quantitative tests of this complex radiative–dynamical coupling near the mesopause are still very limited. Understanding these responses is important for revealing vertical coupling across the lithosphere–troposphere–stratosphere–mesosphere system. It also helps interpret multi-sphere interactions within Earth’s climate system [
19].
High-resolution ERA5 reanalysis products are leveraged to characterise post-eruptive modifications in thermal structure and water vapour content at the 0.01 hPa mesopause following the Hunga Tonga–Hunga Ha’apai eruption. Through a comparative protocol underpinned by dynamic coherence metrics, volcanic imprints are distinguished from intrinsic atmospheric variability—notably La Niña fluctuations—thereby facilitating derivation of spatiotemporal anomaly distributions for both temperature and moisture fields. Substantial nonlinear coupling is detected between initial radiative cooling responses and ensuing large-scale dynamical reorganisation, which instigates a fundamental mesopause transformation from an early cold, moisture-rich state toward a subsequently warmer, drier regime. These observational benchmarks furnish hitherto unavailable constraints that should enhance the fidelity of global climate simulations of extreme volcanic perturbations accompanied by massive stratospheric water vapour injection.
2. Experimental Program
2.1. Data Source
In this work, we use high-resolution ERA5 reanalysis (European Centre for Medium-Range Weather Forecasts, ECMWF, Reading, UK) to measure thermal and hydrological changes at the 0.01 hPa mesopause after the HTHH eruption. We separate volcanic signals from background variability such as La Niña with a dynamically constrained comparative framework. We build spatiotemporal anomaly fields for water vapor and temperature. We show how early radiative cooling interacts nonlinearly with dynamical processes. These interactions shift the mesosphere from an initial moist–cold state to a later dry–warm condition. Our results offer new observational support. They can help improve global climate models that simulate extreme water-rich volcanic forcing.
We collect global monthly mean specific humidity (q) and temperature (T) from 2010 to 2023. The data cover 90° S–90° N. We focus our analysis at the 0.01 hPa level. This choice helps isolate upper-atmospheric behavior after the HTHH eruption.
Reanalysis outputs tend to carry certain systematic biases when they are used to describe conditions near the mesopause. These biases arise mainly from two factors: the numerical sponge layer that is placed close to the top of the model, and the lower number of actual observations that can be assimilated into the model at such high altitudes.
Despite these limitations, the volume of water vapor injected during the HTHH eruption was unusually large. The total injection amount reached approximately 146 Tg, lifting the stratospheric water vapor budget by nearly 10%. Such a strong signal stands well outside the range of normal climate fluctuations. For this reason, the dynamically consistent ERA5 dataset remains suitable for investigating large-scale spatial and temporal changes driven by such an intense event. Satellite measurements have already verified that ERA5 can reasonably capture mesospheric temperature and water vapor anomalies during the eruption period [
20,
21]. These comparisons confirm that ERA5 performs adequately for the mesopause-focused analysis in this study. Independent observations from the Microwave Limb Sounder (MLS, NASA Jet Propulsion Laboratory, Pasadena, CA, USA) between January and March 2022 also indicate that the HTHH eruption injected 140–150 Tg of moisture into the stratosphere, raising the global stratospheric water vapor burden by 8–10% [
20].
2.2. Climatology Construction and Anomaly Extraction
We use 2010–2021 as the climatological reference period. This choice helps us isolate perturbations caused by the volcanic eruption. The background field is denoted as , where X stands for T or q. We obtain this field by calculating multi-year monthly means over the reference period.
Our study establishes the climatological baseline using the 2010–2021 period, which allows us to better isolate atmospheric anomalies linked to the volcanic eruption. The background field is expressed as , with X representing either temperature T or specific humidity q, and it is calculated from long-term monthly averages across the entire reference interval.
We compute anomalies using the following expression:
Here,
m and
y represent month and year, respectively. For specific humidity, we use percentage anomalies. This choice reduces the influence of varying background concentrations on the analysis:
We set the period of 2010–2021 as the climatological reference and calculate anomalies in percentage form. This 12-year window can well represent normal atmospheric natural variability while effectively suppressing interference from other major volcanic eruptions before and after the event. Such a reference framework enables us to reliably extract atmospheric responses directly related to the HTHH eruption. For specific humidity analysis, we prefer percentage anomalies, which can greatly mitigate vertical amplitude biases inherent to mesospheric layers. These biases originate from the extremely low background humidity prevailing at mesopause altitudes. Adopting percentage anomalies makes it feasible to compare water vapor deviations more reasonably across different heights. In addition, we employ the ±1σ statistical threshold to objectively separate genuine volcanic-induced anomalies from ordinary seasonal and random atmospheric fluctuations.
Results in
Section 2.2 and
Section 2.3 use monthly mean data. These data cannot fully represent the high temporal resolution of the original ERA5 product. Our method, however, draws on the hourly resolution of ERA5. This allows detailed analysis of sub-daily and weekly variations. These include rapid temperature phase changes and humidity fluctuations. This design addresses limitations of monthly mean data in capturing short-term perturbations. It also supports a full description of temporal evolution driven by volcanic forcing. The reliability of ERA5 reanalysis at the 0.01 hPa mesopause has been widely tested against satellite observations in previous studies [
20,
21]. This ensures that our anomaly identification and quantitative analysis are credible.
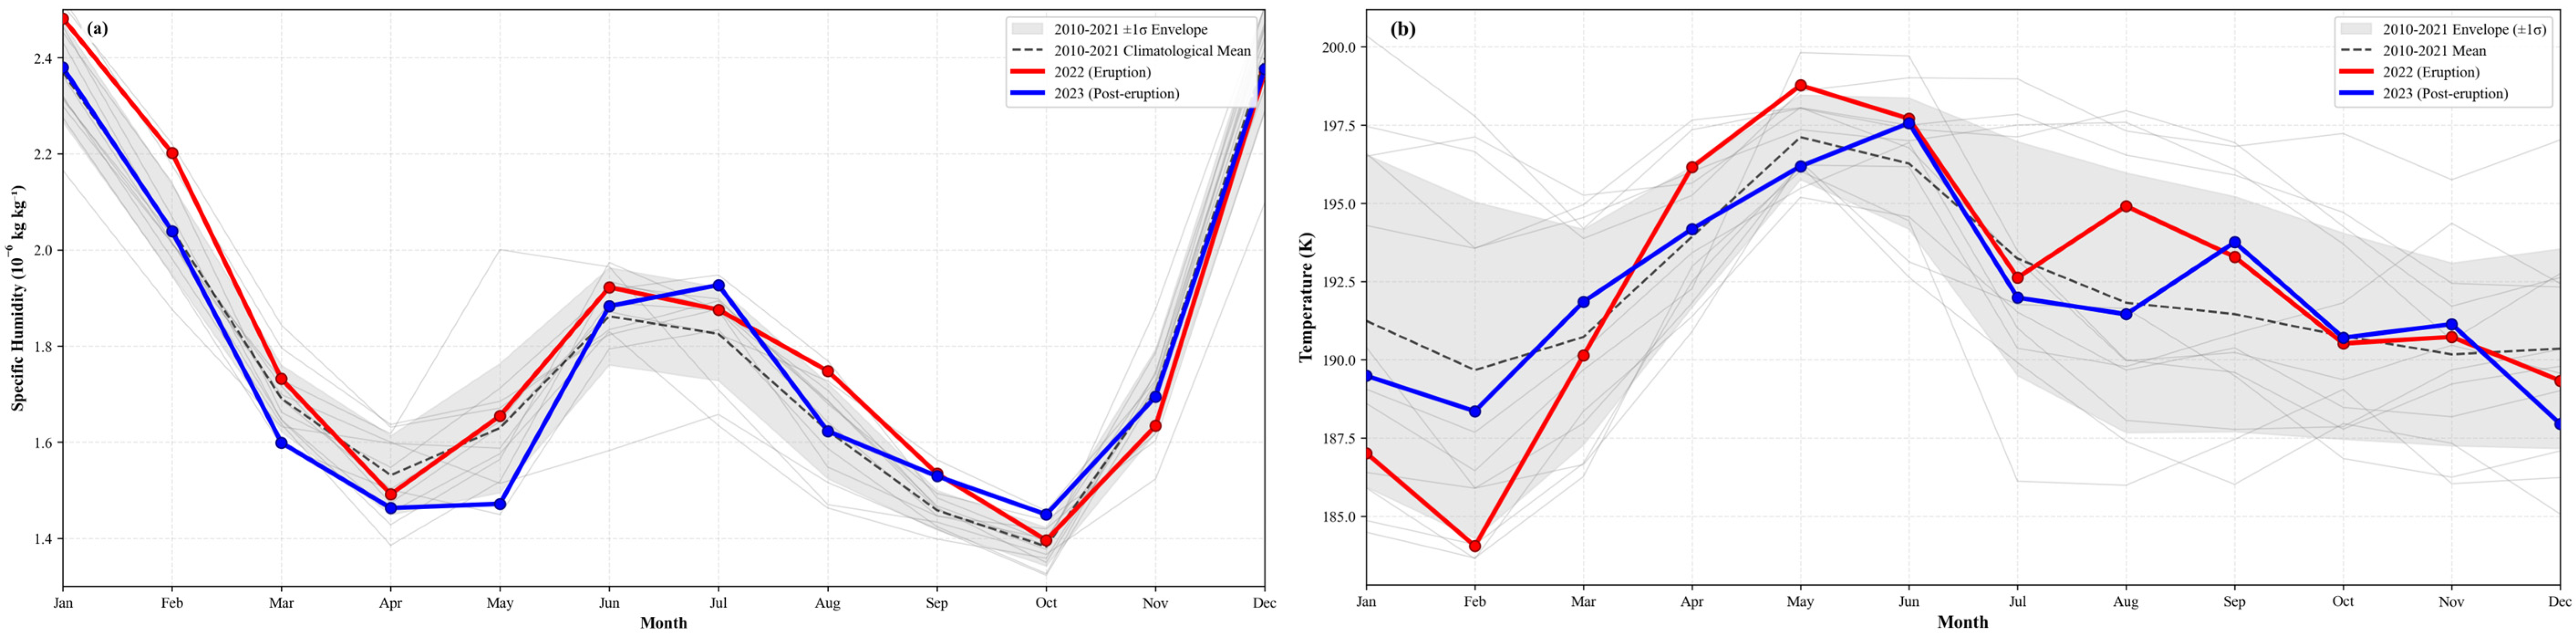
Figure 1 shows that the 2022 HTHH eruption caused strong atmospheric changes. These changes can be clearly distinguished from the long-term climate background. A large amount of water vapor entered the atmosphere during the eruption. The global stratospheric water vapor increased by nearly 10% within a short time.
At the 0.01 hPa level near 80 km, specific humidity rose well above normal levels during January–February and September–October. These anomaly amplitudes exceeded the ±1σ range defined by the 2010–2021 climatology. During March–August, the anomalies weakened and returned to within the ±1σ interval. Despite this decline, specific humidity remained elevated relative to the long-term mean. The positive moisture anomaly persisted through nearly all of 2023, which suggests that the volcanic water vapor signal in the upper atmosphere dissipated quite slowly. Meanwhile, variations in mesospheric temperature exhibited a more complicated structure.
Changes in temperature and humidity were regulated by a combination of radiative and dynamical processes. As illustrated in
Figure 1b, temperatures decreased sharply immediately after the eruption on 15 January. By February, monthly mean temperatures had dropped below 185 K, falling far below the long-term climatological average and moving outside the range of typical year-to-year variability. A rapid warming trend began in March, and temperatures climbed to nearly 199 K by May. This warming event was unusually intense, with peak values exceeding those observed in any year within the 2010–2021 baseline. Temperatures declined after June and formed a secondary peak in August, before returning to within the ±1σ range of natural variability after October.
2.3. Signal Isolation and Comparative Analysis
Volcanic forcing coupled strongly with the concurrent La Niña background during the 2022 HTHH eruption. This study uses a dynamical control isolation method to handle this complexity. The core assumption of this approach is dynamical background consistency. We select 2011 as the control case. It is a canonical strong La Niña year. It shows high similarity to 2022 in ENSO phase, intensity, and background upward-propagating wave activity. We calculate the difference between these two years to filter out ENSO-related signals:
We use to represent the net volcanic signal isolated in this work. The field shows monthly anomalies in 2022. The HTHH eruption occurred alongside La Niña in that year. The field shows anomalies in 2011. That year had La Niña conditions but no major volcanic activity. Here m, i, and j refer to month, latitude, and longitude. By taking the difference between these two anomaly fields, we suppress signals tied to SST-driven circulation and wave variations. We can then extract the net radiative–dynamical signal linked to the roughly 146 Tg of water vapor released by the HTHH eruption.
This study uses a single representative strong La Niña year (2011) as the control period. We do not use a multi-year composite average. Two main considerations support this choice. First, the 2011 La Niña event matches 2022 well in ENSO phase locking, peak intensity, and spectral characteristics of vertically propagating waves. Both are fully developed strong La Niña events with highly synchronized seasonal evolution. This direct one-to-one year matching reduces background inconsistencies that often appear when averaging across multiple years. It also helps reduce systematic biases in the dynamical background between our study case and the control. Using a single control year also makes signal attribution simpler. Differences between individual La Niña events—such as small variations in SST anomaly spatial patterns—are largely avoided. The volcanic signal thus emerges more clearly. The reliability of our attribution also improves.
We have tested the robustness of this single-year control approach with multiple checks. These include comparisons with ERA5 reanalysis and supplementary sensitivity experiments. Future work could include stronger La Niña years. Years such as 2000, 2007, and 2020–2023 could form a composite control. This would allow better quantification of how natural variability across different La Niña events influences the volcanic signal identified in our analysis.
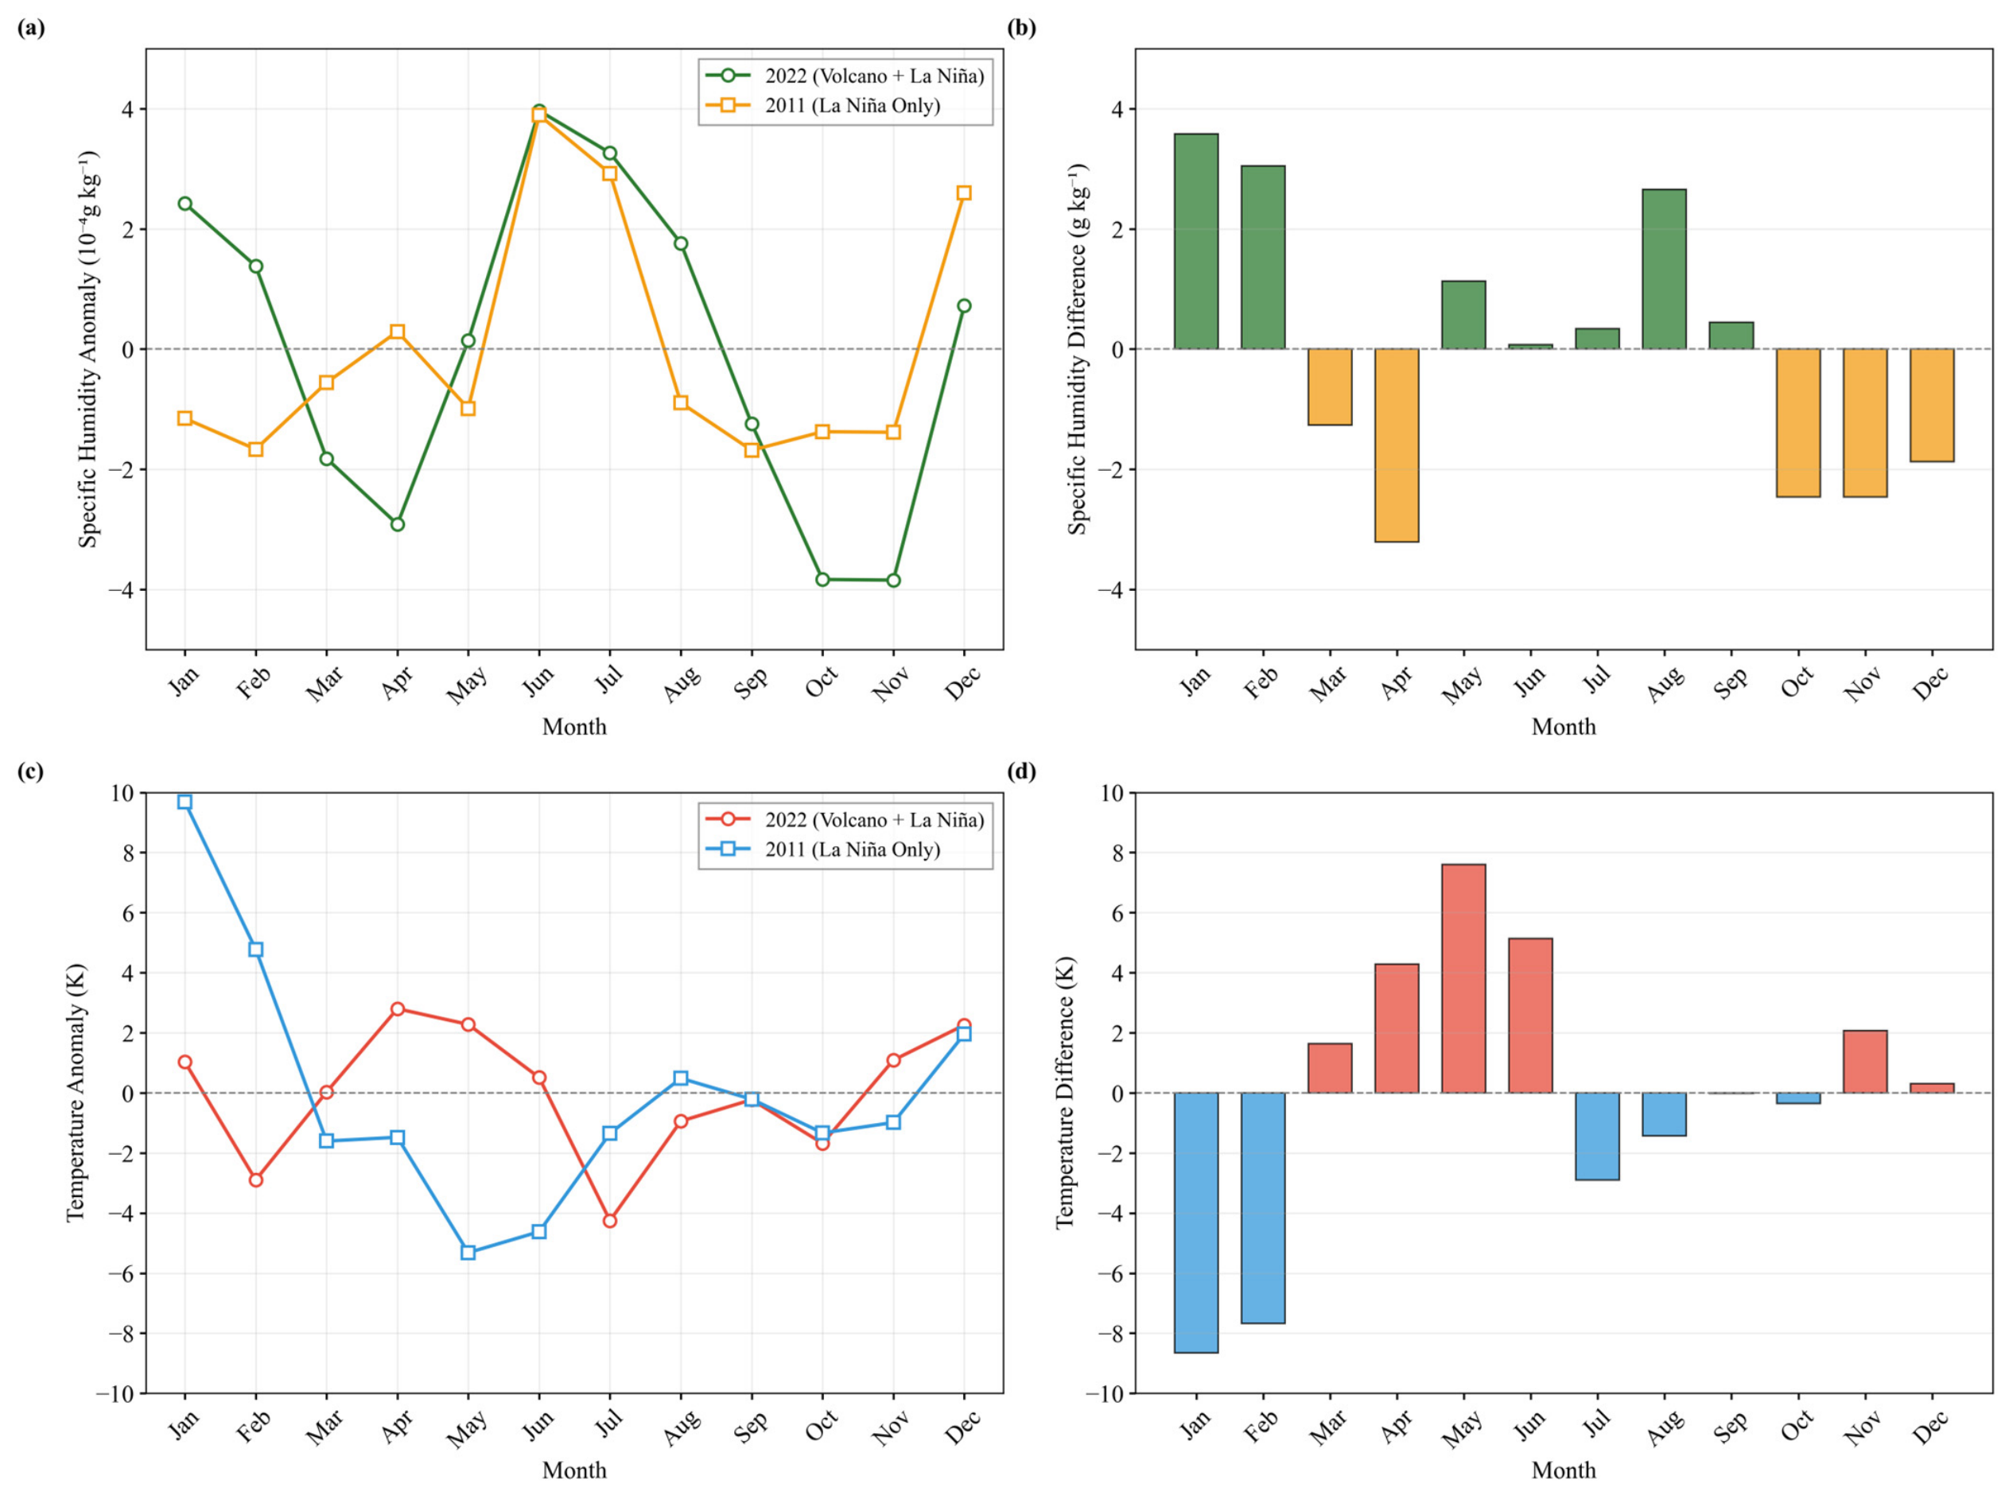
Using the dynamical control approach outlined in
Section 2.3, we present in
Figure 2 the extracted volcanic signals along with time series of temperature and specific humidity at 0.01 hPa within the tropical region from 10° S to 10° N. Our results confirm that the 2022 HTHH submarine eruption introduced strong nonlinear perturbations to the global mesospheric system. We also find that water vapor and temperature fields show distinctly different evolution patterns over the post-eruption period.
The filtered water vapor signal exhibits complicated evolution across multiple phases, with no simple monotonic tendency. In January and February 2022, the tropical mesopause shows a prominent positive specific humidity anomaly in the wake of the eruption. This feature directly reflects the fast and substantial input of water vapor into the lower mesosphere by the volcanic event. The positive anomaly does not persist and is briefly interrupted by negative departures from March to April. A second period of sustained positive anomalies then emerges between May and August, leading to a clear double-peak structure in the time series. This behavior indicates that water vapor supply to the upper atmosphere is not a one-time injection. It is continuously modulated by the upward branch of the Brewer–Dobson residual circulation and other large-scale dynamical transport processes. After September, the tropical mesopause shifts toward pronounced dry conditions and maintains persistent negative specific humidity anomalies. Two mechanisms may account for this strong moisture reduction. Upper mesospheric photochemical breakdown consumes water vapor more rapidly than it can be replenished from lower layers [
21], including photolysis reactions that produce
radicals. Large-scale meridional circulation also carries excess volcanic water vapor toward polar regions, which reduces moisture abundance in the tropics [
22].
The isolated temperature signal evolves in a clearer sequential way. This pattern appears after we remove the confusing influence of the 2022 La Niña background. It differs noticeably from the multi-stage oscillatory pattern of water vapor. In the initial post-eruption stage (January–February), the 0.01 hPa mesopause layer experiences strong anomalous cooling. Temperature deficits exceed 6 K below the 2010–2021 multi-year climatological average. We mainly attribute this sharp cooling to intense local longwave radiative cooling. It is caused by the massive initial input of volcanic water vapor. The thermal state of the tropical mesosphere reverses sharply starting in March. It enters a sustained period of strong warming that lasts until June. We observe a maximum warming amplitude of nearly 8 K in May. This clear delayed warming shows that the dominant driving mechanism of volcanic forcing changed fundamentally. The injected water vapor and accompanying aerosols dispersed globally. The dynamical adjustment of the stratosphere–mesosphere coupled circulation also ended. Dynamical heating or enhanced solar radiative absorption gradually replaced the initial radiative cooling as the main process. After a short secondary cooling period in July and August, the mesospheric temperature field returned gradually to near-climatological levels by the end of 2022.
2.4. Visualization and Statistical Analysis
We apply spatial distribution mapping and regional time-series analysis to track the horizontal propagation and global impacts of volcanic forcing from the HTHH event at the 0.01 hPa mesopause level, and our analysis focuses on the complete atmospheric anomaly fields rather than only the signals extracted after strict isolation.
This part of the analysis uses a method different from the dynamical control framework in
Section 2.3. The earlier procedure used the 2011 La Niña state as a baseline to separate pure volcanic signals. Here we use raw anomalies relative to the 2010–2021 climatology. We keep the 2022 La Niña signal in the analysis.
We choose this setup based on realistic physical considerations. Some studies suggest that major volcanic eruptions in the Southern Hemisphere can influence ocean–atmosphere coupling. They may induce or strengthen La Niña-like conditions. This means that the 2022 La Niña may not be fully independent of the volcanic eruption itself. Removing it as background noise could therefore remove part of the full climate response to the HTHH event.
In addition, raw anomaly fields show the real atmospheric state directly after the eruption. They do not use artificial filtering. We compare these unprocessed spatial patterns (
Figure 3) with the isolated volcanic signals from
Section 2.3. This allows us to evaluate how ENSO-related variability modulates the observed structures. We can also confirm that the cooling-to-warming transition we identify is consistent across different processing methods.
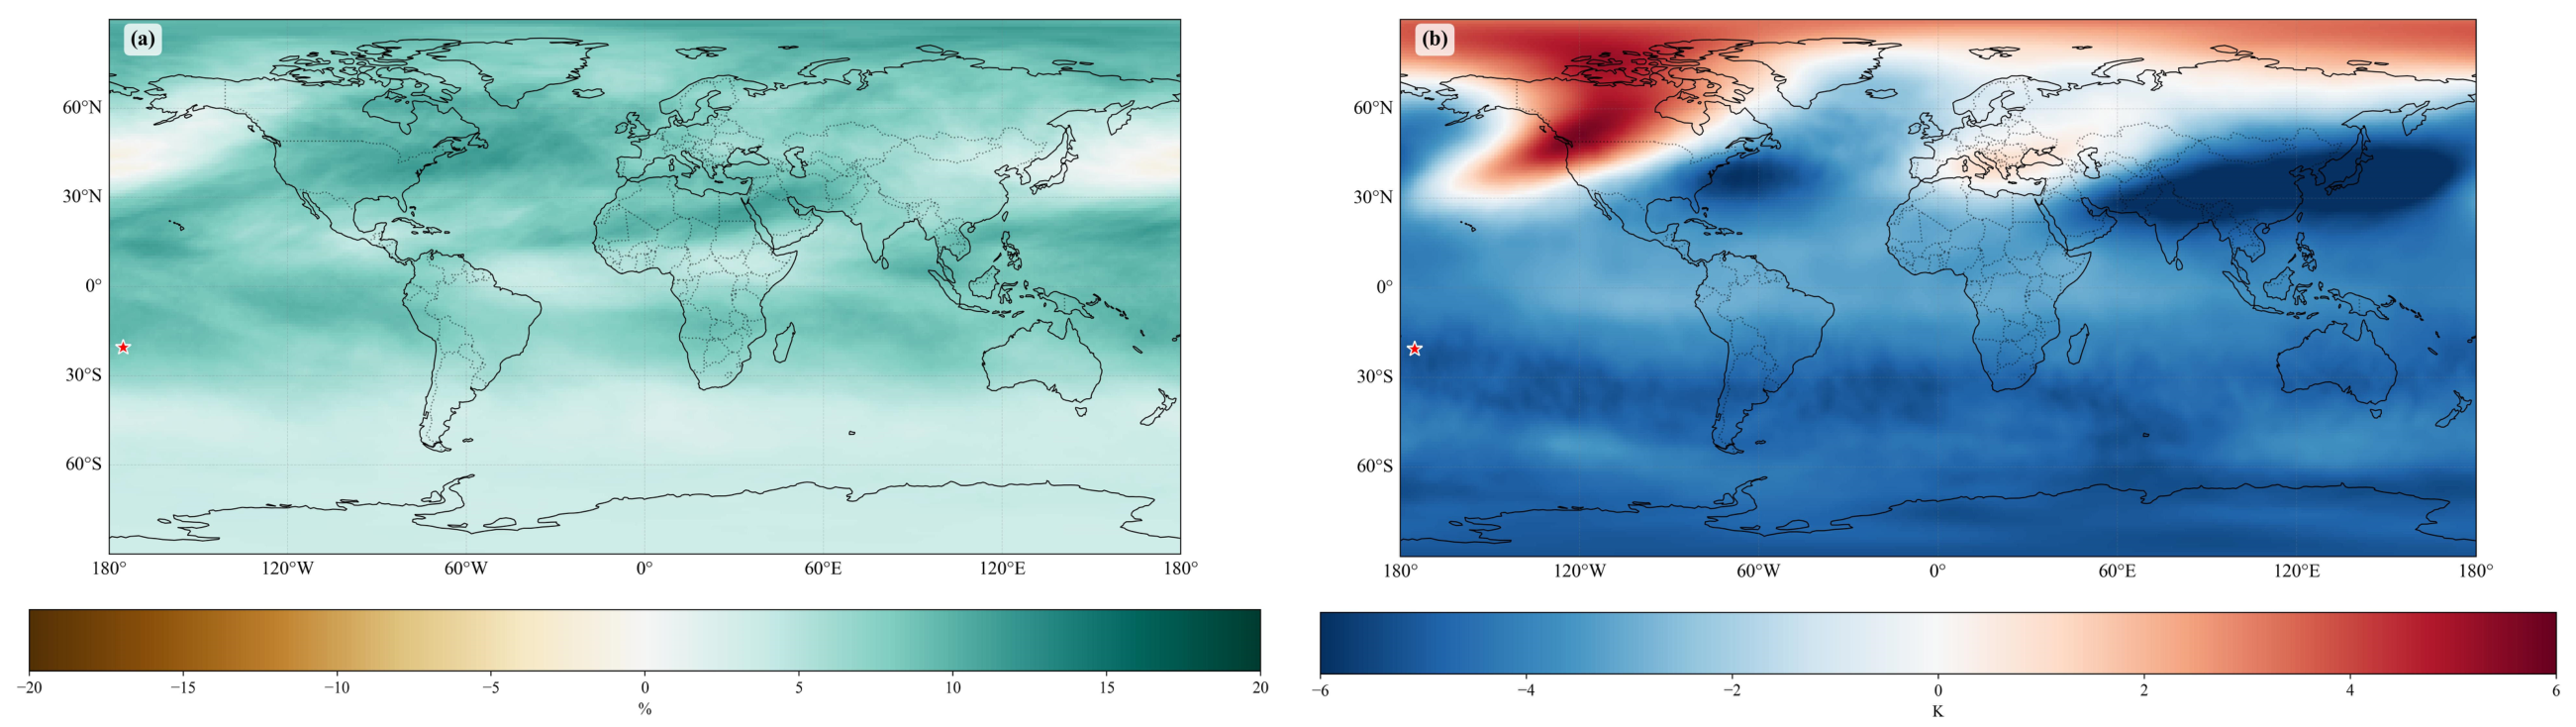
Figure 3 thus shows the full observed anomalies. They include combined effects from volcanic forcing and La Niña. They reflect the actual evolution of the mesosphere after this intense eruption.
2.4.1. Global Horizontal Distribution and Phase Identification
We present global anomaly distributions of specific humidity and temperature using two-dimensional filled contour plots. These figures are used to trace the horizontal spreading of the volcanic plume and to characterize the associated thermodynamic phase shifts within the upper atmosphere. By comparing anomaly patterns across different intervals after the eruption, we divide the entire evolution into two separate phases.
Early “Wet-Cold” Phase: This phase covers the immediate post-eruption period (January–February). It focuses on localized cooling signals triggered directly by the fast, massive injection of volcanic water vapor into the mesosphere. It captures the earliest and most direct thermodynamic response before large-scale dynamical adjustments fully began.
“Dry-Hot” Inversion Phase: This stage corresponds to the delayed adjustment of the atmospheric system, and features notable positive temperature anomalies as well as coherent variations in water vapor distribution. April is chosen as a representative month to investigate the delayed effects of coupled radiative–dynamical feedback, which are responsible for the inversion of thermal and hydrological anomalies following the initial perturbations caused by the volcanic eruption.
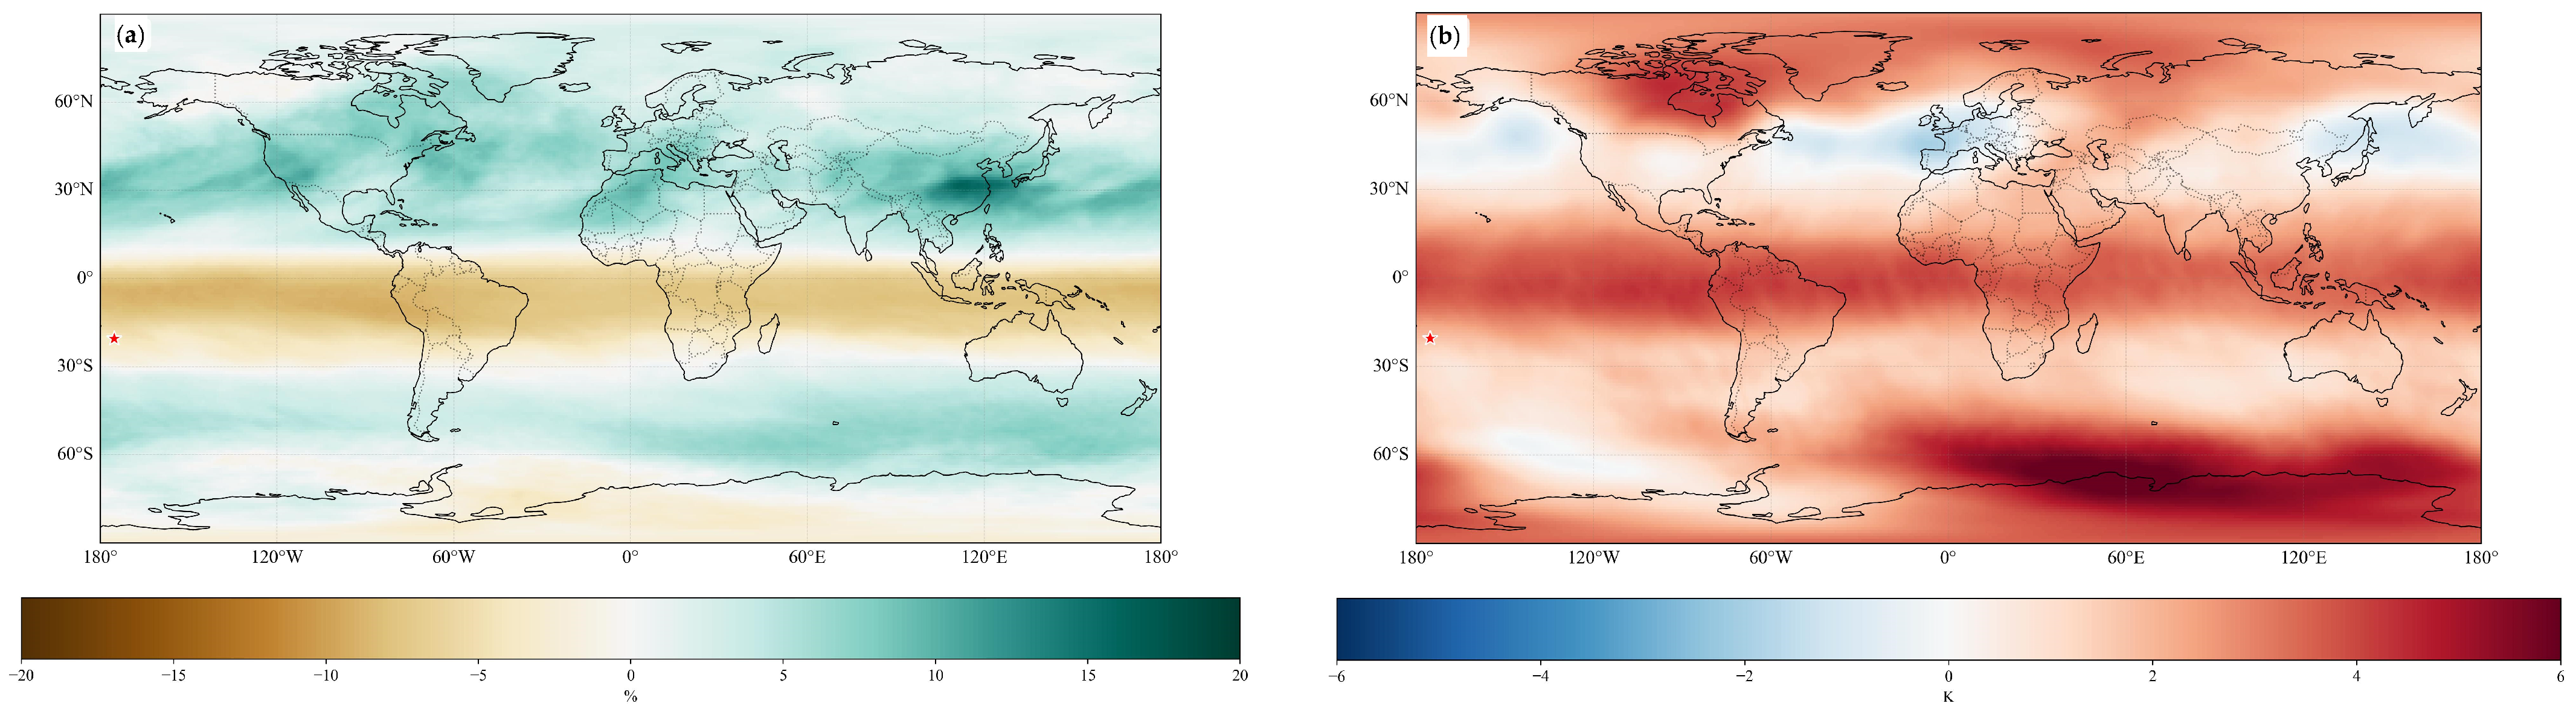
From the spatial patterns depicted in
Figure 3 and
Figure 4, it can be observed that thermal and moisture conditions at the 0.01 hPa mesopause layer (80–85 km altitude) evolved in two well-defined stages after the January 2022 HTHH volcanic eruption.
In the initial “Wet-Cold” phase (January–February), direct volcanic water vapor injection produced widespread positive specific humidity anomalies of 10–20%. These anomalies expanded rapidly from the Southern Hemisphere subtropical source region. Along with this large-scale moistening, we observed a clear temperature decrease of 1–4 K across most low- and mid-latitude areas. This cooling matches the strong longwave radiative energy deficit caused by excess atmospheric water vapor. Notably, high-latitude regions in the Northern Hemisphere showed positive temperature anomalies during this period. This pattern indicates that early mesospheric responses were not controlled only by radiative processes. They were also modulated by stronger planetary wave activity that affects the polar vortex [
11].
By April 2022 (
Figure 4), the atmospheric structure at the mesopause had fully shifted into the “Dry-Warm” stage. Regions from 30° N to 30° S showed a complete reversal in both humidity and temperature. Specific humidity fell to negative anomalies near 10–20%. Temperatures changed from net cooling to clear warming. Local anomalies reached more than 3 K. This sharp shift from wet and cold to dry and warm conditions indicates a change in the key physical mechanism driving the mesospheric response. Radiative cooling likely gave way to adiabatic subsidence warming. This warming was driven by an anomalously strengthened Brewer-Dobson circulation (BDC) [
15].
Comparison between these two consecutive periods shows a clear trend toward zonal symmetry. The initially asymmetric water vapor plume seen in January evolved into a more uniform zonal band by April. Meridional transport via the BDC likely helped this homogenization. The descent of the westerly quasi-biennial oscillation (QBO) phase into the lower stratosphere (30–50 hPa) also played a role. It produced strong equatorial westerly anomalies [
23]. The lagged correlation between water vapor depletion and temperature warming highlights a complex dynamical–radiative feedback loop. This transition still challenges the accuracy of current climate models. They struggle to simulate stratospheric dynamical responses to extreme volcanic injections.
2.4.2. Multi-Regional Statistical Evolution and Hemispheric Asymmetries
We want to quantitatively describe how volcanic anomaly signals change over time. We also want to characterize their inter-hemispheric transport pathways. This study compiles monthly atmospheric anomaly time series for 2022–2023. We perform regional averaging over three dynamically distinct latitudinal bands. We select each band to target specific aspects of post-eruption atmospheric adjustments.
The equatorial zone (10° S–10° N) serves as the main monitoring region for direct atmospheric responses to volcanic forcing. It captures early signal development and gradual decay within the volcanic plume source area. This narrow tropical band isolates the most direct impacts of water vapor and energy injections from the HTHH eruption. It reduces confusing influences from high-latitude dynamical processes.
We also conduct analyses over mid-latitude bands of both hemispheres (40–60° S/N). We compare the magnitude and timing of anomalies between these two hemispheric bands. This allows direct assessment of hemispheric asymmetry in poleward propagation of volcanic signals. The strength and structure of the Brewer–Dobson circulation mainly modulate this asymmetry.
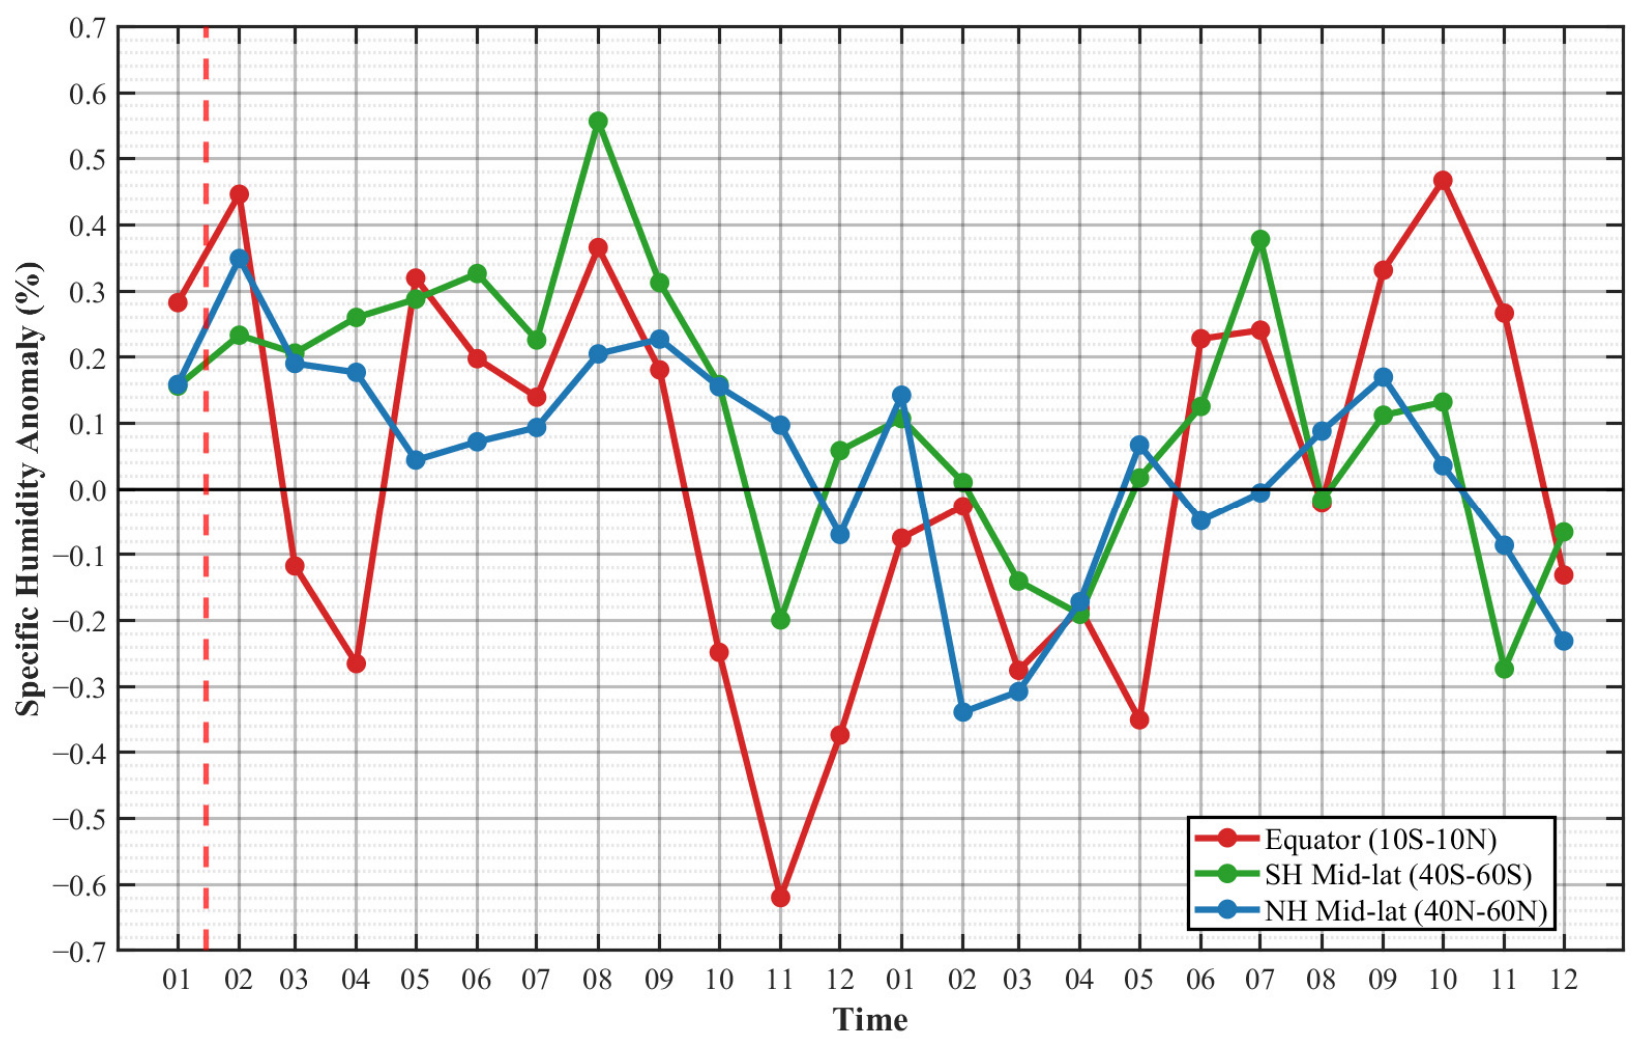
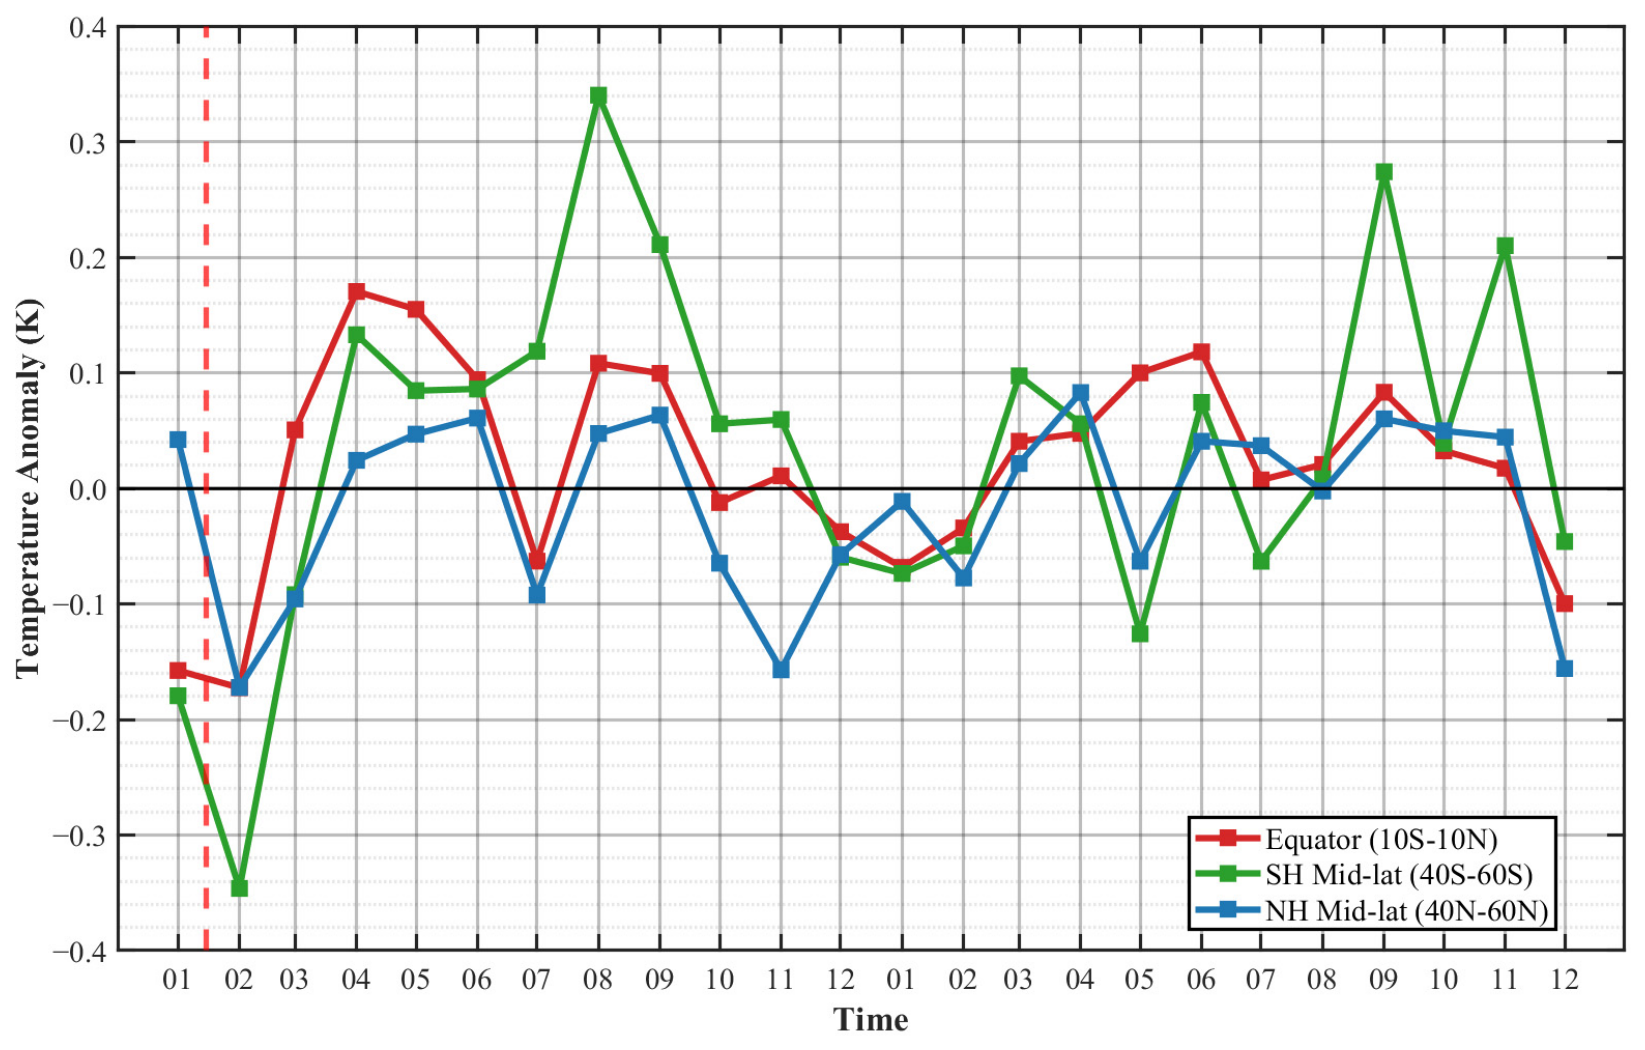
Figure 5 and
Figure 6 show that positive specific humidity anomalies spread quickly across the globe at the 0.01 hPa mesospheric level. This occurred within days after the January 2022 HTHH eruption. The largest early signals appear over the equatorial zone (10°S–10°N) and Northern Hemisphere mid-latitudes. Humidity anomalies exceeded 0.3–0.4% there within a short period. This spatial pattern matches well with the region affected by water vapor injected during the volcanic event. Cooling appeared rapidly across most latitudes in the early days after the eruption. Temperatures decreased by nearly 0.35 K in Southern Hemisphere mid-latitudes and roughly 0.2 K near the equator. Opposing variations in humidity and temperature reflect stronger radiative cooling in the upper mesosphere driven by volcanic volatiles. This pattern indicates that the early upper-atmospheric response was largely direct. Large-scale dynamical processes modulated it only weakly.
By July 2022, roughly six months after the eruption, the monthly time series underwent major zonal reorganization. They also showed complete sign reversal relative to the initial post-eruption state. Specific humidity anomalies in Southern Hemisphere mid-latitudes peaked near 0.6%. A prominent positive temperature anomaly of about 0.35 K appeared at the same time. This structure differs clearly from the persistent lower-stratospheric cooling usually seen after major volcanic eruptions. This pattern implies that the mesospheric response at 0.01 hPa is controlled by a mix of dynamical feedbacks and photochemical processes. It is not controlled by radiative cooling alone. Equatorial specific humidity decreased strongly through late 2022. It eventually fell to negative anomalies near −0.6%. Irregular temperature variations accompanied this change. Such a clear meridional contrast may reflect uneven poleward advection of volcanic tracers. The Brewer-Dobson circulation and the mesospheric residual circulation drive this advection. It changes the local energy budget across different latitudinal bands.
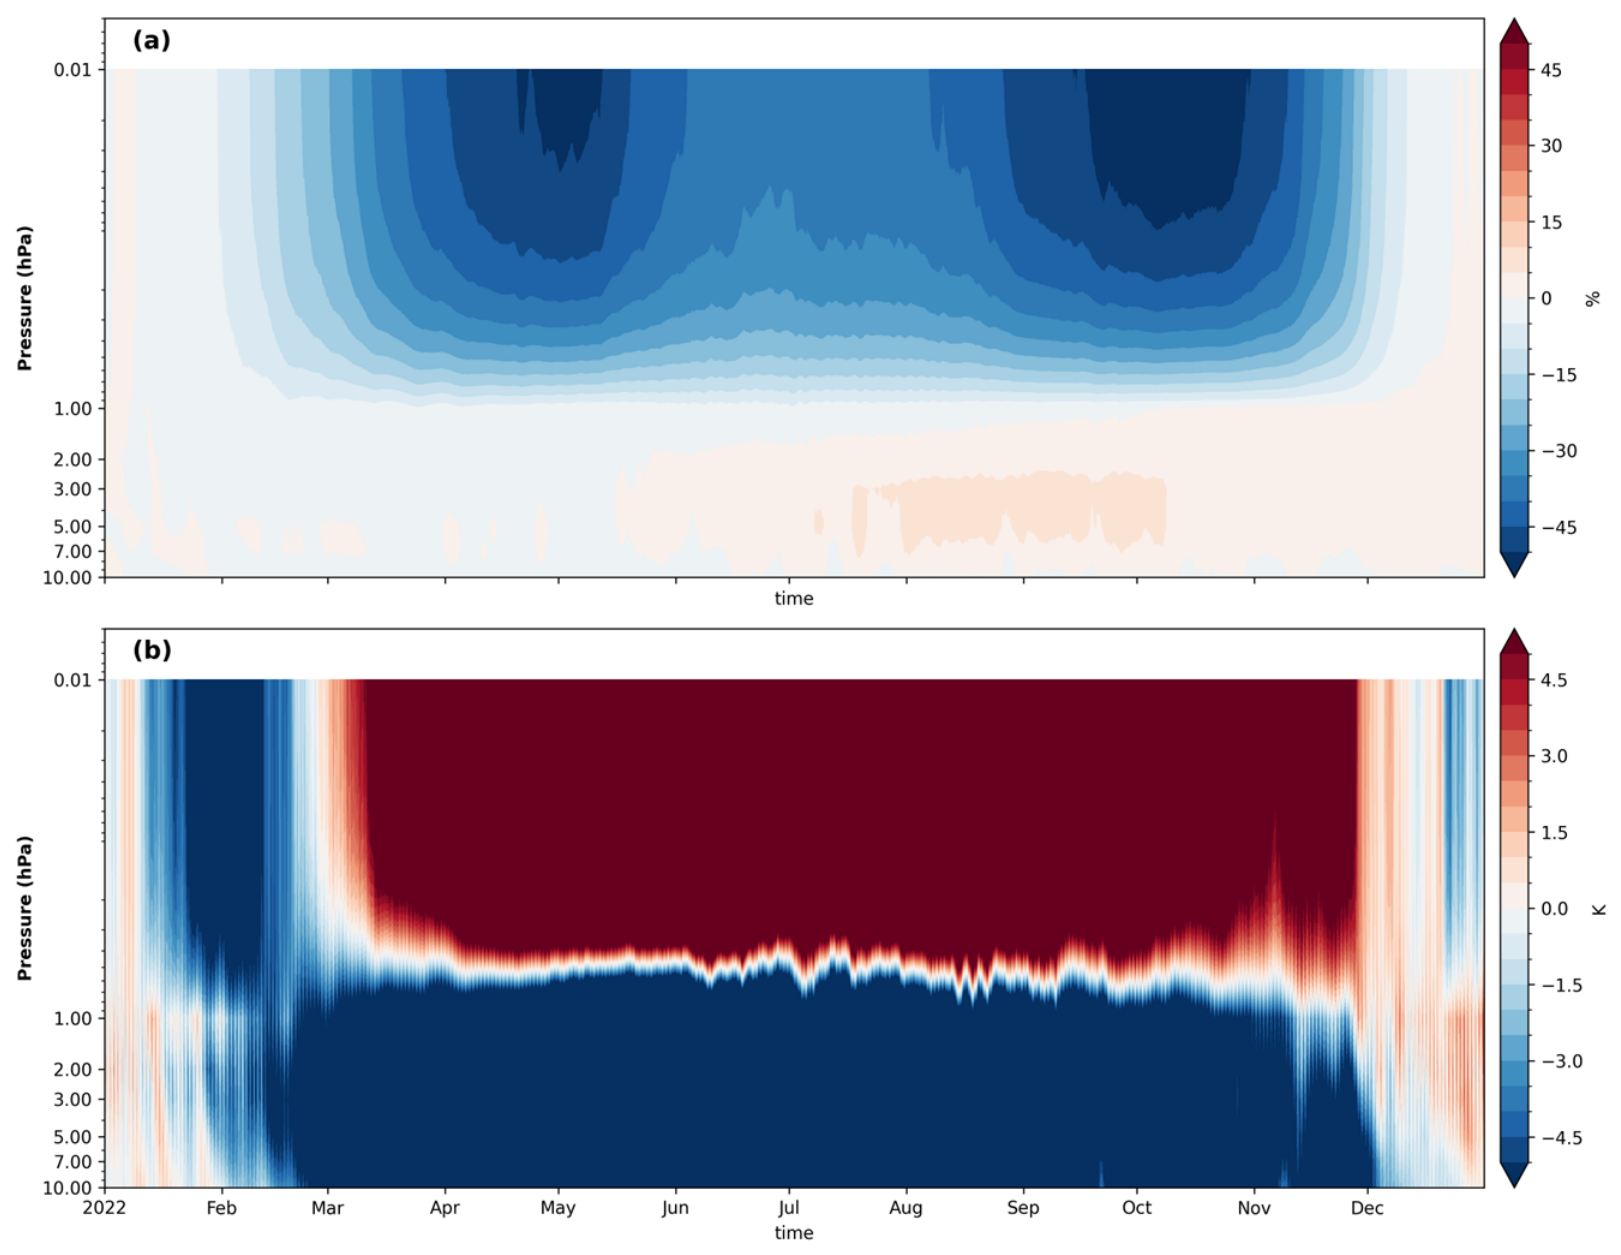
We focus on the 40° S–60° S mid-latitude band for more detailed vertical analysis. This region shows the clearest and most persistent anomalies throughout the study period. We build a height–time cross-section (
Figure 7). We use 1–10 January 2022 as the pre-eruption baseline. This setup separates rapid eruption-driven perturbations from gradual natural mesospheric variability. It allows us to track signal evolution as a function of both height and time.
Figure 7a records the January 2022 HTHH eruption. It released large amounts of volcanic material directly into the stratosphere. It changed atmospheric composition in the 10–1 hPa layer. We tracked this anomaly signal as large-scale circulation gradually lifted it upward. The signal crossed the stratopause and entered the mesosphere by austral autumn 2022. This upward progression triggered clear fluctuations in physical fields above 0.1 hPa.
Figure 7b reveals a distinct vertical dipole pattern in the atmospheric thermal structure. Temperatures in the 10–1 hPa layer dropped sharply right after the eruption. Core negative anomalies fell below −4.5 K. We attribute this cooling to intense longwave radiative effects from excess volcanic water vapor. Near 1–0.01 hPa, the upper atmosphere showed strong warming. These anomalies remained more stable over time than variations in the lower stratosphere.
From 2022 to 2023, physical fields at the 0.01 hPa mesopause kept clear oscillatory features. They also retained sustained perturbation signals. By mid-2023, both specific humidity and temperature anomalies over the equator and Southern Hemisphere mid-latitudes moved back toward background levels. Volcanic signals did not decay quickly. Instead, they remained as quasi-periodic fluctuations. Atmospheric waves and changes in seasonal circulation modulated these fluctuations. Our two-year cross-latitudinal observations trace the full pathway of volcanic materials. They cover initial injection, global dispersion, and delayed upper-atmosphere responses. They also clarify how stratosphere–mesosphere coupling reshapes the global thermal structure of the middle and upper atmosphere.
Drawing on reanalysis data, this work distinguishes two key physical pathways that account for observed changes in the upper atmosphere. Volcanic water vapor anomalies travel upward following the ascending flow of the Brewer–Dobson Circulation (BDC). At the 0.01 hPa level, such moisture signals show an evident time delay, which serves as direct observational evidence that volcanic materials can spread across atmospheric layers through large-scale dynamical transport.
Distinct from perturbations in water vapour transport, the thermal state of the upper atmosphere undergoes substantial evolution between the immediate post-eruptive interval and the protracted adjustment phase. Throughout the initial aftermath of the eruption, the mesosphere was characterised by pronounced radiative cooling, coexistent with elevated humidity and depressed background temperatures. This cooled regime, rather than attaining permanence, was progressively supplanted by dynamical warming engendered through adiabatic compression of local air masses. The fact that the mesosphere transitions from radiative cooling to dynamical warming bespeaks a pronounced nonlinearity in its response to intense external volcanic forcing, together with considerable sensitivity thereto. The persistence of quasi-periodic atmospheric oscillations further implies that anomalous signals emanating from lower atmospheric layers are subject to substantial feedback modulation within the upper atmosphere. In aggregate, the observational findings reported herein constitute robust physical evidence that should inform subsequent inquiry into vertical coupling processes throughout the global atmospheric system.
3. Discussion
Near the 0.01 hPa mesopause, temperature signals after the 2022 HTHH eruption went through two successive stages. Soon after the eruption, localized cooling appeared over limited regions. Starting in April 2022, this pattern changed into extended and strong warming at the same height. This evolution cannot be explained by a single process. Instead, it comes from complicated interactions between radiative changes linked to higher water vapor and dynamical feedback modified by atmospheric wave activity.
The HTHH eruption’s effect on the middle and upper atmosphere differs fundamentally from well-documented sulfate-dominated eruptions like Mount Pinatubo. As noted by Millán et al. [
24], the eruption caldera lay roughly 150 m below sea level. This led to violent phreatomagmatic interactions between superheated magma and seawater. These interactions produced high-pressure steam explosions. This explosive energy drove an unusually penetrating plume. It far exceeded the typical height limits of stratospheric volcanic injections. Microwave Limb Sounder (MLS) satellite profile analysis confirms that a dense, localized water vapor layer was injected directly to 53–57 km. It bypassed the slow, stepwise vertical transport through the tropopause. This direct, high-altitude injection explains the near-instantaneous spike in specific humidity measured at 0.01 hPa within days of the eruption.
Persistent water vapor anomalies throughout 2023 show a long-term memory effect in the upper atmosphere. Overlapping chemical and dynamical constraints together drive this behavior. The total injected water vapor mass—146 Tg—far exceeded the background chemical sink capacity at mesospheric and lower mesopause altitudes. Photolysis is the main removal pathway for water vapor near the mesopause [
25]. It became nearly ineffective under such extreme excess concentrations. The injected vapor thus behaved as a quasi-inert tracer. In addition, a large reservoir of trapped water vapor in the middle and upper stratosphere provided a steady upward supply to the 0.01 hPa layer. It moved along the ascending branch of the Brewer–Dobson Circulation. At the same time, the Southern Hemisphere winter polar vortex acted as a dynamical barrier. It limited zonal mixing and dilution. These combined effects extended the anomaly lifetime.
In the initial “Wet-Cold” phase, diabatic radiative processes dominated the thermal response at 0.01 hPa. Water vapor is a highly efficient infrared emitter in the middle and upper atmosphere. Its sudden, large increase immediately disrupted the local radiative energy balance. Excess mesospheric water vapor strengthens longwave emission to space. It creates a clear energy deficit that drives strong localized radiative cooling. This matches established radiative forcing theory [
26]. The substantial temperature drops observed throughout January and February 2022 fit closely with this mechanism. They confirm its dominant role during the early, high-humidity stage. This injection-driven cooling represents the most immediate thermodynamic response of the upper atmosphere to the eruption.
By April 2022, significant warming had developed at 0.01 hPa. Peak anomalies reached near +8 K. This pattern matches the dynamical framework proposed by Yu et al. [
4]. The dominant forcing mechanism reversed completely during this period. Radiative processes, which controlled the early post-eruption stage, were replaced by wave-driven dynamical feedback. This feedback altered the mesospheric thermal structure. Planetary-scale wave–mean flow interactions caused this phase change. The large volume of injected water vapor triggered these interactions. In the stratosphere, strong diabatic cooling from trapped vapor steepens the meridional temperature gradient. This intensifies the Southern Hemisphere stratospheric westerly jet through the thermal wind relation. This opens a dynamical window for vertical wave propagation that meets the Charney–Drazin criterion [
27,
28].
Changes to the background wind field alter atmospheric wave filtering. More westward-propagating gravity waves can cross the stratopause and penetrate into the mesosphere [
29]. Atmospheric density decreases exponentially with altitude. These waves thus amplify rapidly as they approach the 0.01 hPa mesopause. Following Lindzen’s gravity wave parameterization and the downward control principle [
30,
31], this wave breaking deposits momentum directly into the mesosphere. It strengthens the residual circulation that transports air from the summer hemisphere to the winter hemisphere. This momentum forcing is not spatially uniform. It leads to uneven circulation adjustments.
The HTHH eruption excited strong gravity waves in the mesosphere. Amplitudes exceeded 30 K, roughly twice that of typical background gravity waves. These waves showed vertical wavelengths of 13.9–25.5 km. Horizontal phase speeds reached 44–81 m s
−1. Momentum flux per unit mass ranged from 4 to 320 m
2 s
−2 [
20]. Such intense gravity wave activity significantly strengthens wave breaking and momentum deposition near the mesopause. It further modulates the meridional circulation structure and promotes adiabatic subsidence. At the same time, the HTHH eruption directly injected 139 ± 8 Tg of water vapor into the stratosphere. It increased the global stratospheric water vapor burden by 8.9 ± 0.5% [
20].
Previous satellite observations further confirm that gravity waves induced by the HTHH eruption show much larger amplitudes than Lamb waves [
20]. Such intense wave activity changes gravity wave drag near the mesopause. It dominates the dynamic adjustment of the mesospheric meridional circulation. This circulation strengthened by about 20% [
4]. As a result, dynamical warming induced by adiabatic subsidence became the dominant process. It offset radiative cooling in the middle-to-upper mesosphere [
4]. Meanwhile, the HTHH eruption significantly weakened the stratospheric Brewer–Dobson circulation (BDC). It also reduced meridional transport after water vapor injection [
2].
The stronger, wave-modulated circulation triggers anomalous compensatory subsidence across tropical and subtropical regions. As air parcels descend, ambient pressure increases steadily. This produces substantial adiabatic compression and measurable heating. Quantitative analysis shows that this dynamical warming was significantly stronger than water-vapor-induced infrared radiative cooling from April to June 2022. It became the primary control on mesospheric thermal structure. Warming peaked in May. It reversed temperature anomalies from negative to strongly positive across the targeted latitudinal bands. We suggest that this dynamical warming also indirectly helps sustain elevated humidity levels. It suppresses the phase transition of water vapor to ice crystals. This reduces sedimentation losses that would otherwise weaken the anomaly. The complete evolutionary sequence shows a highly nonlinear, vertically coupled response. It starts with rapid radiative instability and ends with large-scale dynamical restructuring. The mesopause is highly sensitive to extreme geological forcing.
4. Conclusions and Future Perspectives
We used high-resolution ERA5 reanalysis data. We systematically investigated the evolutionary patterns and physical mechanisms of thermal and hydrological characteristics at the 0.01 hPa mesopause after the HTHH eruption. As a rare “water-rich” geological event in the satellite era, the HTHH eruption exerts strong and long-lasting effects on the upper atmosphere and the broader Earth climate system. Key findings are summarized as follows:
- (1)
The unique submarine character of the HTHH eruption drove intense mass injection. About 146 Tg of water vapor passed directly through the stratopause into the mesosphere. This bypassed height limits of transport in traditional volcanic forcing theories. This large amount of water vapor formed a long-lived anomalous water vapor reservoir at the mesopause. Its influence lasted for multiple years, not just briefly. This reveals the high sensitivity and low-dissipation nature of the upper-atmosphere climate system to extreme moisture perturbations.
- (2)
The thermal response at the mesopause showed clear staged and nonlinear features. In the early post-eruption phase, the sharp rise in water vapor concentration strengthened infrared radiative cooling. It caused a strong localized cooling phase. As volcanic forcing reshaped stratospheric wind fields, it changed gravity wave filtering. It also accelerated the mesospheric residual circulation. The resulting adiabatic subsidence warming became dominant after April. It led to a sharp shift in temperature anomalies from negative to positive. Warming reached a peak near +8 K. These findings validate the radiative forcing–dynamical feedback coupling mechanism in the mesosphere. They also confirm its role in vertical connectivity of the climate system.
- (3)
The HTHH eruption offers real-world implications for evaluating geoengineering schemes such as stratospheric aerosol injection. Water vapor inputs bring physical effects beyond radiative changes. These effects must be considered in related studies. The nonlinear response observed at the mesopause also provides observational data. These data can improve global climate models. They help better represent extreme water vapor injections, gravity wave dynamics, and upper-atmospheric radiative processes. This supports more reliable climate simulations.
Although this study reveals short-term and mid-term disturbances of the HTHH eruption on the mesosphere, several scientific issues still need further research:
- (1)
Whole-atmosphere coupling: Future work can explore how mesospheric dynamical anomalies feed back downward to affect the stratospheric polar vortex. They can also examine upward propagation to influence ionospheric electron density. The goal is to build a more complete coupled climate model.
- (2)
Long-term climate monitoring: As volcanic tracers spread globally, long-term changes in mesospheric water vapor and sulfate aerosols need continuous observation. Their potential effects on the frequency and optical properties of Polar Mesospheric Clouds (PMCs) also matter for upper-atmosphere climate research.
- (3)
Model improvement: The HTHH event provides a real-world test. We can judge how well global climate models handle strong water vapor inputs and nonlinear dynamical feedbacks in the upper atmosphere. Further refined numerical simulations can improve parameterization of gravity wave dynamics and radiative transfer in the mesosphere. They help models better estimate volcanic climate impacts.
Overall, the HTHH eruption is more than an extreme natural event. It provides a unique window into the complex feedback mechanisms of Earth’s atmospheric climate system. The results of this study provide key observational evidence and theoretical support. They help us understand the evolution of the near-space environment under extreme external forcing. They also improve projections of volcanic impacts on global climate.