Article

Seasonal Regime Shifts and Warming Trends in the Universal Thermal Climate Index over the Italian and Iberian Peninsulas (1940–2024)

by
Gabriel I. Cotlier
and
Juan Carlos Jimenez
*
Global Change Unit (CGU), Image Processing Laboratory (IPL), University of Valencia, 46980 Paterna, Valencia, Spain
*
Author to whom correspondence should be addressed.
Climate 2025, 13(9), 184; https://doi.org/10.3390/cli13090184
Submission received: 1 August 2025 / Revised: 3 September 2025 / Accepted: 5 September 2025 / Published: 6 September 2025
(This article belongs to the Special Issue The Importance of Long Climate Records (Second Edition))

Abstract

This study investigates long-term changes in thermal comfort across the Italian and Iberian Peninsulas from 1940 to 2024, using the Universal Thermal Climate Index (UTCI) derived from ERA5-HEAT reanalysis. We apply a dual analytical framework combining structural break detection to identify regime shifts and Sen’s slope estimation with confidence intervals to quantify monotonic trends. Results reveal pronounced seasonal asymmetries. Summer exhibits abrupt regime shifts in both regions: in 1980 for Italy (slope shifting from −0.039 °C/year before 1980 to +0.06 °C/year after) and 1978 for Iberia (from −0.054 °C/year to +0.050 °C/year). Winter, by contrast, shows no structural breaks but a persistent, spatially uniform warming trend of ~0.030–0.033 °C/year across the 1940–2024 period, consistent with a gradual erosion of cold stress. Transitional seasons display more nuanced responses. Spring reveals detectable breakpoints in 1987 for Italy (shifting from −0.028 °C/year to +0.027 °C/year) and 1986 for Iberia (from −0.047 °C/year to +0.024 °C/year), indicating the early acceleration of warming. Autumn shows a breakpoint in 1970 for Italy, with trends intensifying from +0.011 °C/year before to +0.052 °C/year after, while Iberia exhibits no clear breakpoint but a consistent positive slope. These findings highlight spring as an early-warning season, where warming acceleration first emerges, and autumn as a consolidating phase that extends summer-like heat into later months. Overall, the results demonstrate that Mediterranean thermal regimes evolve through both abrupt and gradual processes, with summer defined by non-linear regime shifts, winter by steady accumulation of warming, and spring and autumn by transitional dynamics that bridge these extremes. The methodological integration of breakpoint detection with Sen’s slope estimation provides a transferable framework for detecting climate regime transitions in other vulnerable regions under accelerated global warming.

1. Introduction

As climate change intensifies, Southern Europe faces increasing exposure to thermal extremes with potentially severe effects on public health, ecological systems, and infrastructure. In recent decades, the intensification of climate change has manifested through increasing frequencies of extreme thermal conditions, with significant implications for human health, urban infrastructure, and ecosystem functioning—particularly in vulnerable regions such as the Mediterranean Basin [1,2,3]. Research indicates that human thermal sensation is increasing more rapidly than ambient air temperature due to the combined effects of warming, humidity, and reduced wind—human-perceived temperatures have risen approximately 0.04 °C per decade globally, with the fastest increases during summer in low-latitude regions [4]. A study has shown that thermal perception indicators such as Physiologically Equivalent Temperature (PET) often increase more rapidly than air temperature itself, particularly in Mediterranean regions—highlighting that air temperature alone underestimates the climate-driven shifts in human thermal comfort [5].
Among the many thermal comfort indices developed to assess the physiological impacts of thermal environments on humans, the Universal Thermal Climate Index (UTCI) has emerged as a robust and comprehensive indicator. Unlike traditional air temperature measures, UTCI—since it is based upon the Fiala multi-node model of human heat balance and clothing model—accounts for the combined effect of multiple biometeorological parameters—including wind speed, relative humidity, solar and thermal radiation, clothing level, and physical activity—thus offering a more physiologically meaningful representation of thermal stress and comfort [6,7,8,9]. Compared with other thermal comfort indices, the UTCI has shown higher sensitivity to slight changes in biometeorological stimuli such as temperature, solar radiation, humidity and wind speed, in addition to its capacity to accurately characterize diverse climate conditions [10]. One of the key strengths of UTCI lies in its broad applicability across diverse research fields, climatic zones, spatial scales—from global to local—and throughout all seasons, making it a versatile tool for outdoor thermal stress assessment under varied environmental conditions and populations [11,12,13,14].
UTCI data have shown that urban areas of the Arabian Peninsula have experienced a marked increase in thermal discomfort—ranging from 0.4 to 0.8 °C—in recent decades, with intensified frequency and duration of heat stress, especially since the late 1990s [15]. Observed significant increases in summer UTCI (0.25–0.75 °C per decade), leading to a transition of ~28% of the region from thermally comfortable to moderate thermal stress, and ~19% from “moderate” to “strong stress” [16]. It was shown that regional UTCI values have increased by approximately 0.1 to 0.7 °C per decade, with certain hotspots—particularly eastern Saudi Arabia and Iraq—also experiencing up to 16 additional days of strong thermal stress per decade [17]. Future climate forcing will substantially intensify heat stress along European coastlines: regional climate model ensembles (EURO CORDEX, RCP 8.5) project a robust UTCI rise across beach regions, lengthening the tourist “beach season” and, by late century, adding ≈ 4 extra days of “very strong” and ≈ 1 extra day of “extreme” heat stress each July–August in the Mediterranean sector [18]. Under mid- to end-century warming scenarios in Iran, the spectrum of human bioclimatic conditions will shift notably—hot and very hot categories will expand in spring and summer, while zones with favorable thermal comfort contract markedly [19]. It was found that in China from 1961 to 2014, effective temperature—a combined measure of air temperature, humidity, and wind speed—rose significantly, with cold days declining by ~3.5 days per decade while hot days increased by ~0.7 days per decade, indicating a substantial shift in human thermal comfort [20]. Projected increases in human-perceived temperature extremes depend strongly on the metrics used—indices considering both humidity and temperature forecast heightened heat stress, while those including wind speed suggest more nuanced or even reduced perceived warming—highlighting the complexity and uncertainty inherent in assessing human thermal comfort under climate change [21]. Future warming scenarios will substantially alter urban thermal comfort landscapes—projecting up to a 5 °C rise in peak temperatures and a near 10% drop in relative humidity by 2100 under high-emissions scenarios—dramatically reducing comfort zones across urban environments [22]. Greece has experienced a significant upward trend in UTCI over 1991–2020, while recent heatwaves in 2021 and 2023 reached unprecedented severity, exposing the population to moderate to extreme heat stress [23]. By mid-century, Greece is projected to experience a UTCI rise of about 1.2–1.6 °C, with a marked increase in strong to extreme summer heat stress [24]. UTCI analysis for the Czech Republic (1941–2018) shows a gradual rise in thermal stress across all seasons except winter, where cold stress has diminished [25]. In Kyiv, Ukraine, thermal comfort is most likely from late April to June and late August to September, while heat stress peaks in July, with recent trends (1991–2015) indicating an increasing frequency and intensity of summer heat stress days and heatwave events [26]. Thermal bioclimate in Kyiv during heat waves from 1961 to 2020 has shown that heat stress ranged from slight to extreme, with most events classified as strong stress, and highlights the exceptional intensity of the 2010 heat wave, which reached daily PET values of 37–47 °C [27].
While many studies have documented predominantly linear warming trends in mean and derived thermal indices [28,29,30], growing evidence suggests that regional climate trajectories frequently exhibit non-linear behavior—marked by abrupt ‘regime shifts’ stemming from tipping points in atmospheric circulation, land–atmosphere feedbacks, or anthropogenic pressures such as urbanization and land use change [31,32,33]. Regime shifts are characterized as large, persistent, and often unexpected transitions between stable system states, typically triggered when resilience thresholds are exceeded. In this regard, climatic systems with large spatial extent and ecological complexity, such as those of the Italian and Iberian Peninsulas, are particularly susceptible to regime shifts when subjected to persistent anthropogenic and environmental stressors [34,35]. Capturing these structural changes is essential for understanding the temporal dynamics of thermal comfort and its evolution under climate change scenarios. Yet, most regional climate studies still rely on linear trend estimation, potentially overlooking key inflection points that signal major shifts in thermal regimes.
This study addresses this gap by systematically analyzing long-term seasonal UTCI data over two climatically and socioeconomically important Mediterranean regions: the Italian Peninsula and the Iberian Peninsula.
The primary objectives of this work are as follows: (1) to detect structural changes in seasonal UTCI time series across the two regions; (2) to assess the spatial magnitude and significance of warming trends at high spatial resolution. By doing so, we aim to uncover critical temporal inflection points and spatial disparities in UTCI evolution that may inform climate adaptation strategies, public health planning, and thermal risk mitigation efforts in Mediterranean Europe.

2. Materials and Methods

We employed high-resolution ERA5-HEAT reanalysis data spanning 1940 to 2024 [36] and applied a multi-method framework combining breakpoint detection and trend estimation to investigate both abrupt and gradual shifts in seasonal UTCI dynamics. In this study, we utilized the UTCI from the ERA5-HEAT reanalysis [36] dataset available through the Google Earth Engine (GEE) platform [37]. The choice of the ERA5-HEAT reanalysis dataset for UTCI was guided by its unique suitability for capturing long-term, spatially consistent information on human thermal stress. Unlike observational station records, which are often sparse and unevenly distributed across the Italian and Iberian Peninsulas, ERA5-HEAT provides continuous coverage at high temporal (hourly to daily) resolution. This is particularly critical in detecting regime shifts, since localized gaps or irregularities in observational datasets could obscure coherent regional patterns. Moreover, ERA5-HEAT explicitly integrates the meteorological variables required to compute UTCI (air temperature, humidity, wind speed, and radiation), ensuring methodological consistency across both space and time. Alternative thermal comfort indices or datasets are either less comprehensive in their input requirements, available for shorter time spans, or lack the same degree of harmonized reanalysis processing, which may limit comparability across regions and decades. Nonetheless, it is important to acknowledge the limitations inherent in using ERA5-HEAT. As with all reanalysis products, biases may arise from the assimilation system, particularly in regions with sparse ground-based observations or complex topography, potentially introducing uncertainty in absolute UTCI levels. These biases could affect the precise timing or magnitude of detected regime shifts, although the robustness of the breakpoint and Sen’s slope approaches helps mitigate the risk of spurious detections. Furthermore, reanalysis data may underestimate local extremes (e.g., urban heat island effects) that are relevant for human exposure. Therefore, the detected shifts should be interpreted as representative of regional-scale thermal transitions rather than microclimatic conditions. Another disadvantage is its low spatial resolution at 27.75 km (0.25°).
Mean UTCI values were classified according to ten thermal stress categories defined by the International Society of Biometeorology (ISB), following this scheme: UTCI values below −40 °C indicate Extreme Cold Stress, −40 °C to −27 °C indicate Very Strong Cold Stress, −27 °C to −13 °C indicate Strong Cold Stress, −13 °C to 0 °C indicate Moderate Cold Stress, 0 °C to 9 °C indicate Slight Cold Stress, 9 °C to 26 °C indicate No Thermal Stress, 26 °C to 32 °C indicate Moderate Heat Stress, 32 °C to 38 °C indicate Strong Heat Stress, 38 °C to 46 °C indicate Very Strong Heat Stress, and values above 46 °C indicate Extreme Heat Stress. The established scheme is summarized in Table 1.
The UTCI variable (utci_mean) represents daily estimates of thermal stress and is derived from an advanced multi-parameter thermal comfort model, incorporating air temperature, wind speed, humidity, and radiation. The data spans the period from 1940 to 2024 and is provided at a spatial resolution of 27,750 m (27.75 km). To investigate seasonal thermal patterns, we generated four independent time series of raster stacks representing the annual seasonal mean UTCI values for the summer (June-July-August, JJA), winter (December-January-February, DJF), spring (March-April-May, MAM), and autumn (September-October-November. SON) seasons. For each seasonal period, a temporal filter was applied to the daily images, aggregating them by computing the pixel-wise seasonal mean. This process resulted in four multi-band seasonal raster stacks, where each band represents a specific year’s seasonal average of UTCI. The raster stacks were clipped using high-resolution polygon shapefiles representing national land boundaries, reprojected to the EPSG:3857 (Pseudo-Mercator) coordinate reference system, and converted from Kelvin to Celsius. This preprocessing pipeline yielded four clean, seasonally aggregated, and spatially masked datasets for each region of interest (ROI), forming the basis for all subsequent spatial-temporal analyses conducted in the study (Figure 1).
To identify structural changes (regime shifts) in long-term UTCI trends across the Italian and Iberian Peninsulas, we applied breakpoint estimation using the breakpoints function from the R software Version 4.3.0 [39] package strucchange [40]. This method allows detection of abrupt or gradual changes in the trend or mean of UTCI time series at regional or pixel levels. In this way, periods of statistically significant changes in thermal behavior—potentially corresponding to climate regime shifts (e.g., onset of warming), large-scale atmospheric circulation influences, or anthropogenic effects (e.g., urbanization, emissions)—can be identified. The results provide robust and interpretable breakpoints, indicating when the most substantial changes in climate-related thermal comfort occurred. To robustly detect and quantify the magnitude of monotonic trends (°C/year) in long-term UTCI time series, we applied Sen’s slope [41] estimator at the pixel level across raster stacks of annual seasonal UTCI averages from 1940 to 2024. To statistically assess the uncertainty of the Sen’s slope estimates, we applied the Mann–Kendall test [42] using the R package Kendall 2.2.1 [43]. The function was applied to the time series of each pixel, and the resulting p-values indicated the significance of the detected trends (with p < 0.05 considered statistically significant). We quantified the percentage of pixels exhibiting significant trends (p ≤ 0.05) to provide an overall measure of the spatial robustness of the Sen’s slope results. In addition, the 95% confidence intervals (CIs) of the overall mean Sen’s slope were computed across the raster layers, providing spatially distributed estimates of uncertainty at the 95% confidence level.

3. Results

3.1. Detection of Regime Shifts

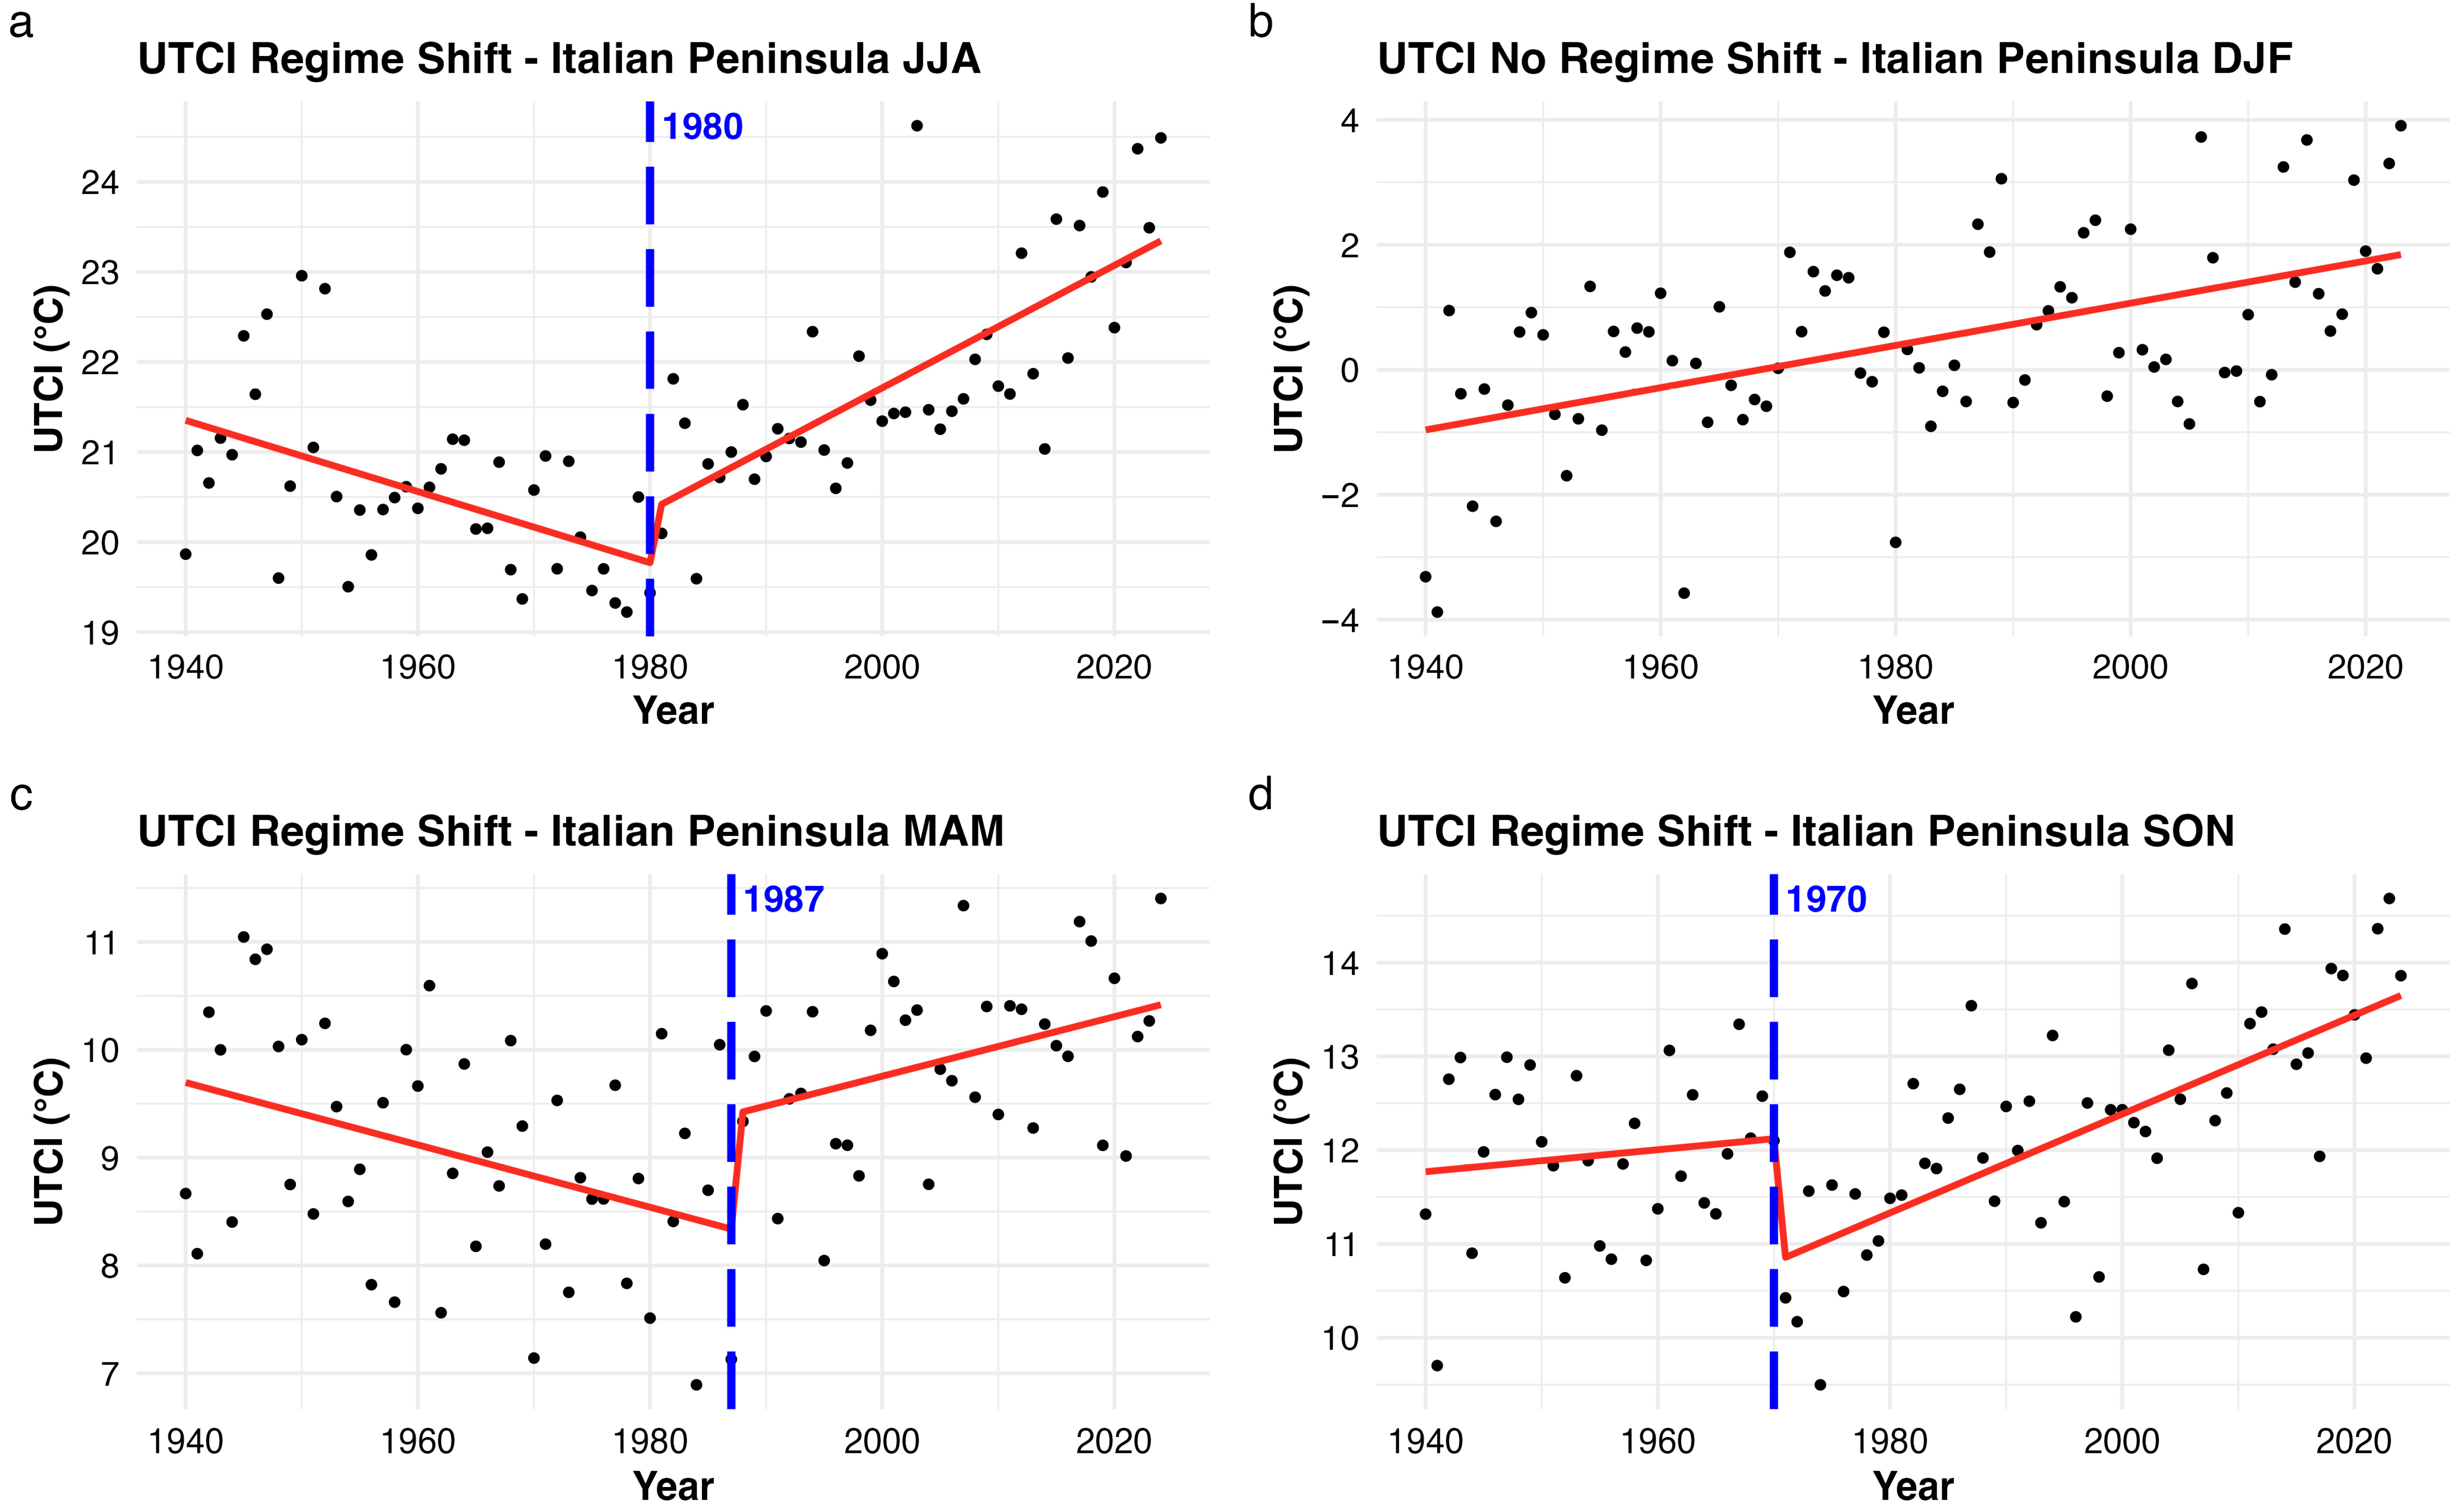
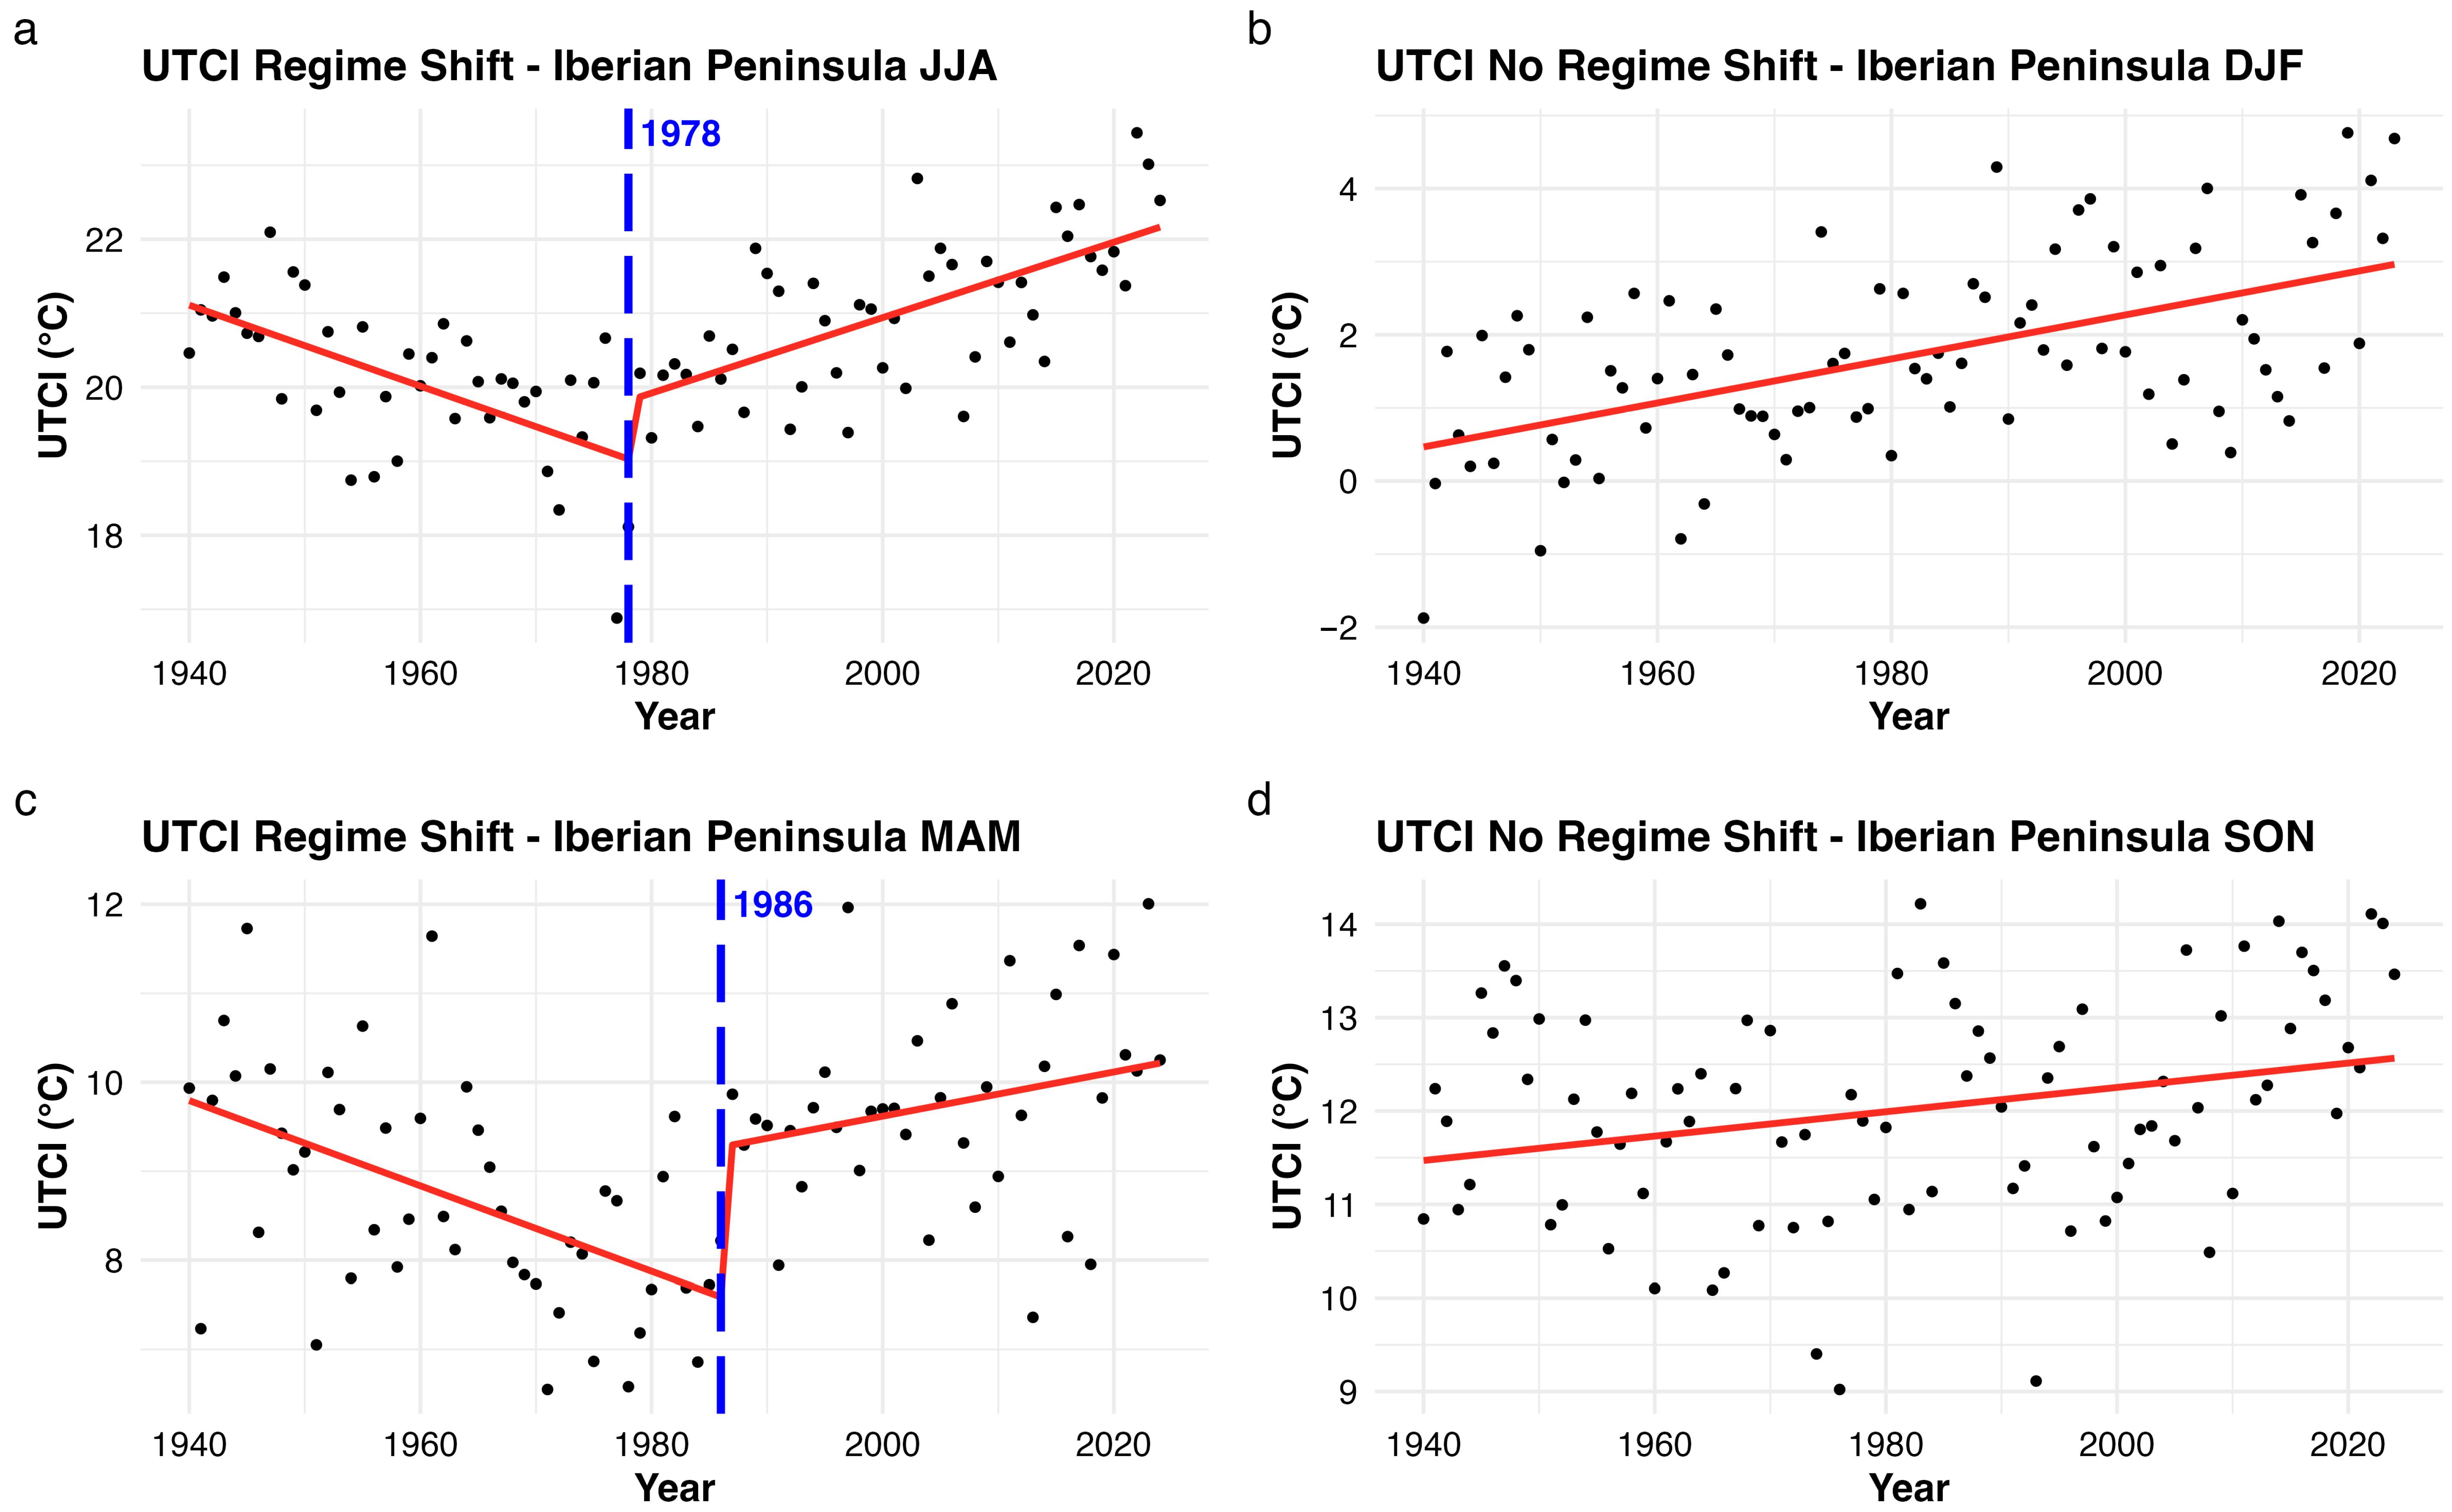
The temporal evolution of seasonal mean UTCI values for the period 1940–2024 across two Mediterranean regions—the Italian Peninsula and the Iberian Peninsula—during the JJA, DJF, MAM, and SON seasons is presented in Figure 2 and Figure 3. The structural change analysis, performed using a breakpoint detection algorithm, reveals significant spatial and seasonal differences in thermal regime dynamics.
In both the Italian Peninsula (Figure 2a) and the Iberian Peninsula (Figure 3a), the JJA time series exhibited statistically significant regime shifts, indicating distinct structural changes in summer thermal conditions. For the Italian peninsula, a single breakpoint was identified in the year 1980, dividing the time series into two contrasting thermal regimes. The first detected regime (1940–1980; n = 41) had a mean UTCI of 20.56 °C, with a decreasing trend (slope = −0.039; 95% CI: −0.06 to −0.01; p < 0.001). The second regime (1981–2024; n = 44) exhibited a higher mean UTCI of 21.88 °C and an increasing trend (slope = 0.068; 95% CI: 0.04 to 0.08; p < 0.0001). The total number of unique observations remains 85, as the year 1980 is included in both segments. Prior to 1980, there was a declining trend in summer UTCI values, reflecting a cooling tendency over the mid-20th century. However, post-1980, a marked increase in UTCI is evident, indicating a pronounced warming regime that has continued until 2024. This shift aligns temporally with major atmospheric circulation and anthropogenic forcing transitions observed in the Mediterranean basin during the late 20th century.
For the Iberian Peninsula, similarly, one breakpoint was detected in 1978, suggesting a comparable shift in summer thermal dynamics. The first regime (1940–1978; n = 39) exhibited a mean UTCI of 20.06 °C, with a statistically significant decreasing trend (slope = −0.054; 95% CI: −0.07 to −0.03; p < 0.0001). The second regime (1979–2024; n = 46) showed a higher mean UTCI of 21.01 °C and a significant increasing trend (slope = 0.050; 95% CI: 0.03 to 0.06; p < 0.0001). Note that the year 1978 marks the breakpoint and is included in both segments, resulting in a one-year overlap and a total of 85 unique observations across the full time series. As in the Italian case, the pre-1978 period shows a negative trend, followed by a positive warming trend post-shift. The breakpoints in both regions are closely aligned, emphasizing a regionally consistent regime shift in summer UTCI, likely linked to hemispheric-scale climate reorganizations and the acceleration of global warming effects during this period. The identification of breakpoints from the mid-20th century to the 1980s underscores the non-linear nature of climate evolution in southern Europe and highlights the utility of regime shift detection methods in capturing abrupt transitions that might be obscured by linear trend analysis alone.
In contrast to summer, the winter season for the Italian Peninsula and for the Iberian Peninsula exhibits no statistically significant regime shifts, suggesting a more gradual, persistent warming trend over the entire period of analysis. The Italian Peninsula (Figure 2b) and the Iberian Peninsula (Figure 3b) both show a monotonically increasing trend in winter UTCI values, without any abrupt changes in slope or level. For the period 1940–2024, both the Italian and Iberian Peninsulas exhibited statistically significant upward trends in winter UTCI. The Italian Peninsula (n = 85) showed a mean UTCI of 0.43 °C, with a slope of 0.033 °C per year (95% CI: 0.02 to 0.04; p ≤ 0.0001), while the Iberian Peninsula (n = 85) presented a higher mean UTCI of 1.71 °C, with a slope of 0.030 °C per year (95% CI: 0.02 to 0.03; p < 0.0001). These results reflect a consistent increase in winter thermal stress conditions across both regions. Although interannual variability is evident, the absence of structural breaks indicates that winter warming has occurred more smoothly and progressively, consistent with expectations under gradual greenhouse gas accumulation scenarios. These findings suggest a seasonally asymmetric climate response, where summer thermal conditions are more prone to sudden shifts or tipping behavior, while winter warming appears more linear and continuous. This could reflect the amplified sensitivity of summer UTCI to radiative forcing and land-atmosphere feedbacks, particularly in Mediterranean climates characterized by summer drought and heatwave dynamics.
The combination of breakpoint and trend analyses provides a nuanced understanding of UTCI evolution across Mediterranean regions. The synchronized regime shifts in summer UTCI suggest region-wide changes in the thermal comfort regime that may have implications for public health, agriculture, and energy demand. Conversely, the linear winter warming trend, though less abrupt, still poses significant cumulative risks, particularly in terms of shifting thermal baselines and altered seasonality. From a methodological perspective, this study demonstrates the effectiveness of structural breakpoint detection in uncovering critical non-linear changes in climate time series. These findings emphasize the need to incorporate such approaches in climate adaptation planning, particularly in regions like southern Europe where abrupt climatic shifts are increasingly likely under future warming scenarios.
The structural change analysis applied to the MAM series reveals clear evidence of a regime shift in both the Italian and Iberian peninsulas (Figure 2c and Figure 3c). For Italy (Figure 2c), the breakpoint was detected in 1987, coinciding with a sharp inflection in the time series. The first detected regime (1940–1987; n = 48) had a mean UTCI of 9.01 °C, with a decreasing trend (slope = −0.028; 95% CI: −0.04 to −0.008; p < 0.01). The second regime (1988–2024; n = 37) exhibited a higher mean UTCI of 9.92 °C and an increasing trend (slope = 0.027; 95% CI: 0.003 to 0.05; p < 0.05). Prior to the shift, the trend was characterized by a progressive decline in spring UTCI values from the 1940s through the mid-1980s, suggesting a long period of relatively cooler spring conditions. After 1987, however, the trajectory reversed abruptly, giving way to a persistent warming trend extending into the present.
A similar pattern was observed in the Iberian Peninsula (Figure 3c), where the breakpoint was identified in 1986. The first detected regime (1940–1986; n = 47) had a mean UTCI of 8.69 °C, with a decreasing trend (slope = −0.047; 95% CI: −0.07 to −0.02; p = 0.0001). The second regime (1987–2024; n = 38) exhibited a higher mean UTCI of 9.75 °C and an increasing trend (slope = 0.024; 95% CI: −0.007 to 0.05; p > 0.05). The pre-shift phase was marked by a steady decline in spring UTCI, followed by a modest but sustained warming trend thereafter. This regime shift suggests that, as in Italy, the Iberian Peninsula experienced a mid-1980s transition in spring climate conditions, although with somewhat lower intensity compared to Italy.
Taken together, these results indicate that both regions experienced a clear regime shift in spring climate conditions during the mid-1980s, reflecting a synchronized and robust change in southern European springtime climate.
The analysis SON shows a more complex picture, with mixed evidence of structural change between the two regions (Figure 2d and Figure 3d). For Italy (Figure 2d), the breakpoint was detected earlier, in 1970. The first detected regime (1940–1970; n = 31) had a mean UTCI of 11.94 °C, with a slightly increasing trend (slope = 0.011; 95% CI: −0.02 to 0.04; p > 0.05). The second regime (1971–2024; n = 54) exhibited a higher mean UTCI of 12.25 °C and an increasing trend (slope = 0.052; 95% CI: 0.03 to 0.06; p < 0.0001). The pre-shift phase was relatively stable with only a weak positive trend, but the structural break marked the onset of a pronounced warming trajectory. Post-1970, the trend steepened significantly, reflecting a substantial intensification of autumn warming across the region.
In contrast, the Iberian Peninsula (Figure 3d) exhibited no significant breakpoint. The trend (n = 85) showed a mean UTCI of 12.01 °C, with a slope of 0.013 °C per year (95% CI: 0.003 to 0.02; p < 0.05). The time series is instead characterized by a consistent, long-term warming trend without abrupt transitions. This continuous rise in autumn UTCI values from the 1940s to the present suggests that autumn warming in the Iberian Peninsula has been gradual and progressive, rather than regime-shift driven.
Overall, while the spring season shows convergent evidence of regime shifts in the mid-1980s, the autumn season highlights regional differences: an early shift-driven trajectory in Italy versus a gradual, linear warming in the Iberian Peninsula. These findings underscore the seasonal and spatial heterogeneity of climate dynamics across southern Europe.
To further support and spatially contextualize the temporal regime shifts identified in the JJA time series for both the Italian and Iberian Peninsulas, a pixel-level breakpoint detection analysis was conducted using the strucchange package in R software environment. The analysis forced a single breakpoint per pixel, identifying the year in which a structural change in the UTCI trend occurred at the local scale. The resulting binary maps (Figures S1 and S2 in Supplementary Material) classify each pixel based on whether the detected regime shift occurred before or after a reference breakpoint year (1980 for Italy, 1978 for Spain), which were determined based on the statistically optimal breakpoints from the regionally averaged JJA time series in each case. The spatial patterns highlight regional differences in the timing of climate transitions, with earlier regime shifts more concentrated in central and southern Italy and along the northern Iberian coast, and later shifts dominant in northern Italy and across much of interior and eastern Iberia. The Italian Peninsula displays the majority of regime shifts that occurred prior to 1980, particularly across central and southern Italy, including Sicily and parts of Sardinia, as indicated by the orange areas. However, northern Italy, especially the Po Valley and Alpine foothills, displays a considerable number of pixels with regime shifts occurring after 1980 (steel blue). This spatial partitioning suggests a north–south differentiation in climate dynamics, where earlier transitions in UTCI trends may reflect more immediate responses to mid-20th century warming or urbanization, while the later shifts in the north might correspond with delayed but more accelerated warming phases observed since the 1980s (Figure S1 left panel Supplementary Material). In contrast, the Iberian Peninsula shows the regime shifts predominantly occurred after 1978, with steel blue pixels occupying most of the interior and eastern coastal areas. Earlier regime shifts (orange) are more prevalent along northern coastal regions, especially in parts of Galicia, the Basque Country, and some areas of Portugal’s northwest. The spatial dominance of later shifts across Iberia aligns with the regional time series breakpoint around 1978, reinforcing the notion that substantial structural changes in summer UTCI occurred more synchronously and recently across most of the territory (Figure S1 right panel Supplementary Material). These spatial results reinforce the temporal regime shift findings, offering further insight into the heterogeneity and regional variability of climate transitions. While both regions exhibit structural breaks, the timing and spatial coherence differ, possibly reflecting variations in climate forcing mechanisms, land surface processes, or local microclimatic modulations. Importantly, these maps highlight that although a single regional breakpoint is useful for summarizing large-scale patterns, local variations exist and must be considered when developing adaptation strategies or interpreting thermal comfort dynamics.
The pixel-level detection of regime shifts highlights distinct spatial heterogeneity across the Italian and Iberian peninsulas during the transition seasons (Figure S2 Supplementary Material).
For the Italian Peninsula in spring (MAM, 1987), the majority of the territory, particularly the northern and central interior regions along the Apennines, experienced regime shifts in 1987 or later. In contrast, earlier shifts (pre-1987) were concentrated in southern coastal zones and the islands of Sardinia and Sicily, as well as some smaller coastal pockets in central Italy. This pattern indicates that the spring transition to warmer UTCI conditions was generally delayed in northern and central continental regions, whereas earlier shifts occurred in the south and insular areas (Figure S2 upper left panel Supplementary Material). In the Italian Peninsula during autumn (SON, 1970), the spatial pattern is dominated by regime shifts occurring in 1970 or later, which cover nearly the entire peninsula and the islands. Pixels with pre-1970 shifts are limited to localized clusters along the central-eastern and southern coasts, as well as a few isolated points in the north. This suggests a largely coherent autumn shift across Italy, with only marginal areas undergoing earlier transitions (Figure S2 upper right panel Supplementary Material).
For the Iberian Peninsula in spring (MAM, 1986), the spatial structure is characterized by a marked contrast between pre-1986 and post-1986 transitions. Earlier shifts dominate the south, east, and central interior, including the Mediterranean flank and the Balearic Islands. Conversely, 1986 or later shifts are concentrated in the northwest (Galicia, northern Portugal, and adjacent Atlantic-influenced areas), with some extension toward the interior and a few coastal or insular pockets. This indicates that spring warming transitions occurred earlier across the Mediterranean and southern Iberia, while the Atlantic-influenced northwest shifted later (Figure S2 lower panel Supplementary Material).
Overall, these spatial patterns emphasize that regime shifts in UTCI during the transition seasons are not spatially uniform but reflect strong regional contrasts. Italy exhibits later, widespread regime shifts in both spring and autumn, with earlier transitions confined to southern and insular sectors. By contrast, Iberia demonstrates a sharp springtime dichotomy between early shifts over the Mediterranean and continental south/east, and later transitions in the Atlantic northwest. These findings highlight the role of regional climatic regimes and maritime influences in shaping the timing and distribution of thermal regime shifts across southern Europe.

3.2. Analysis of Trends

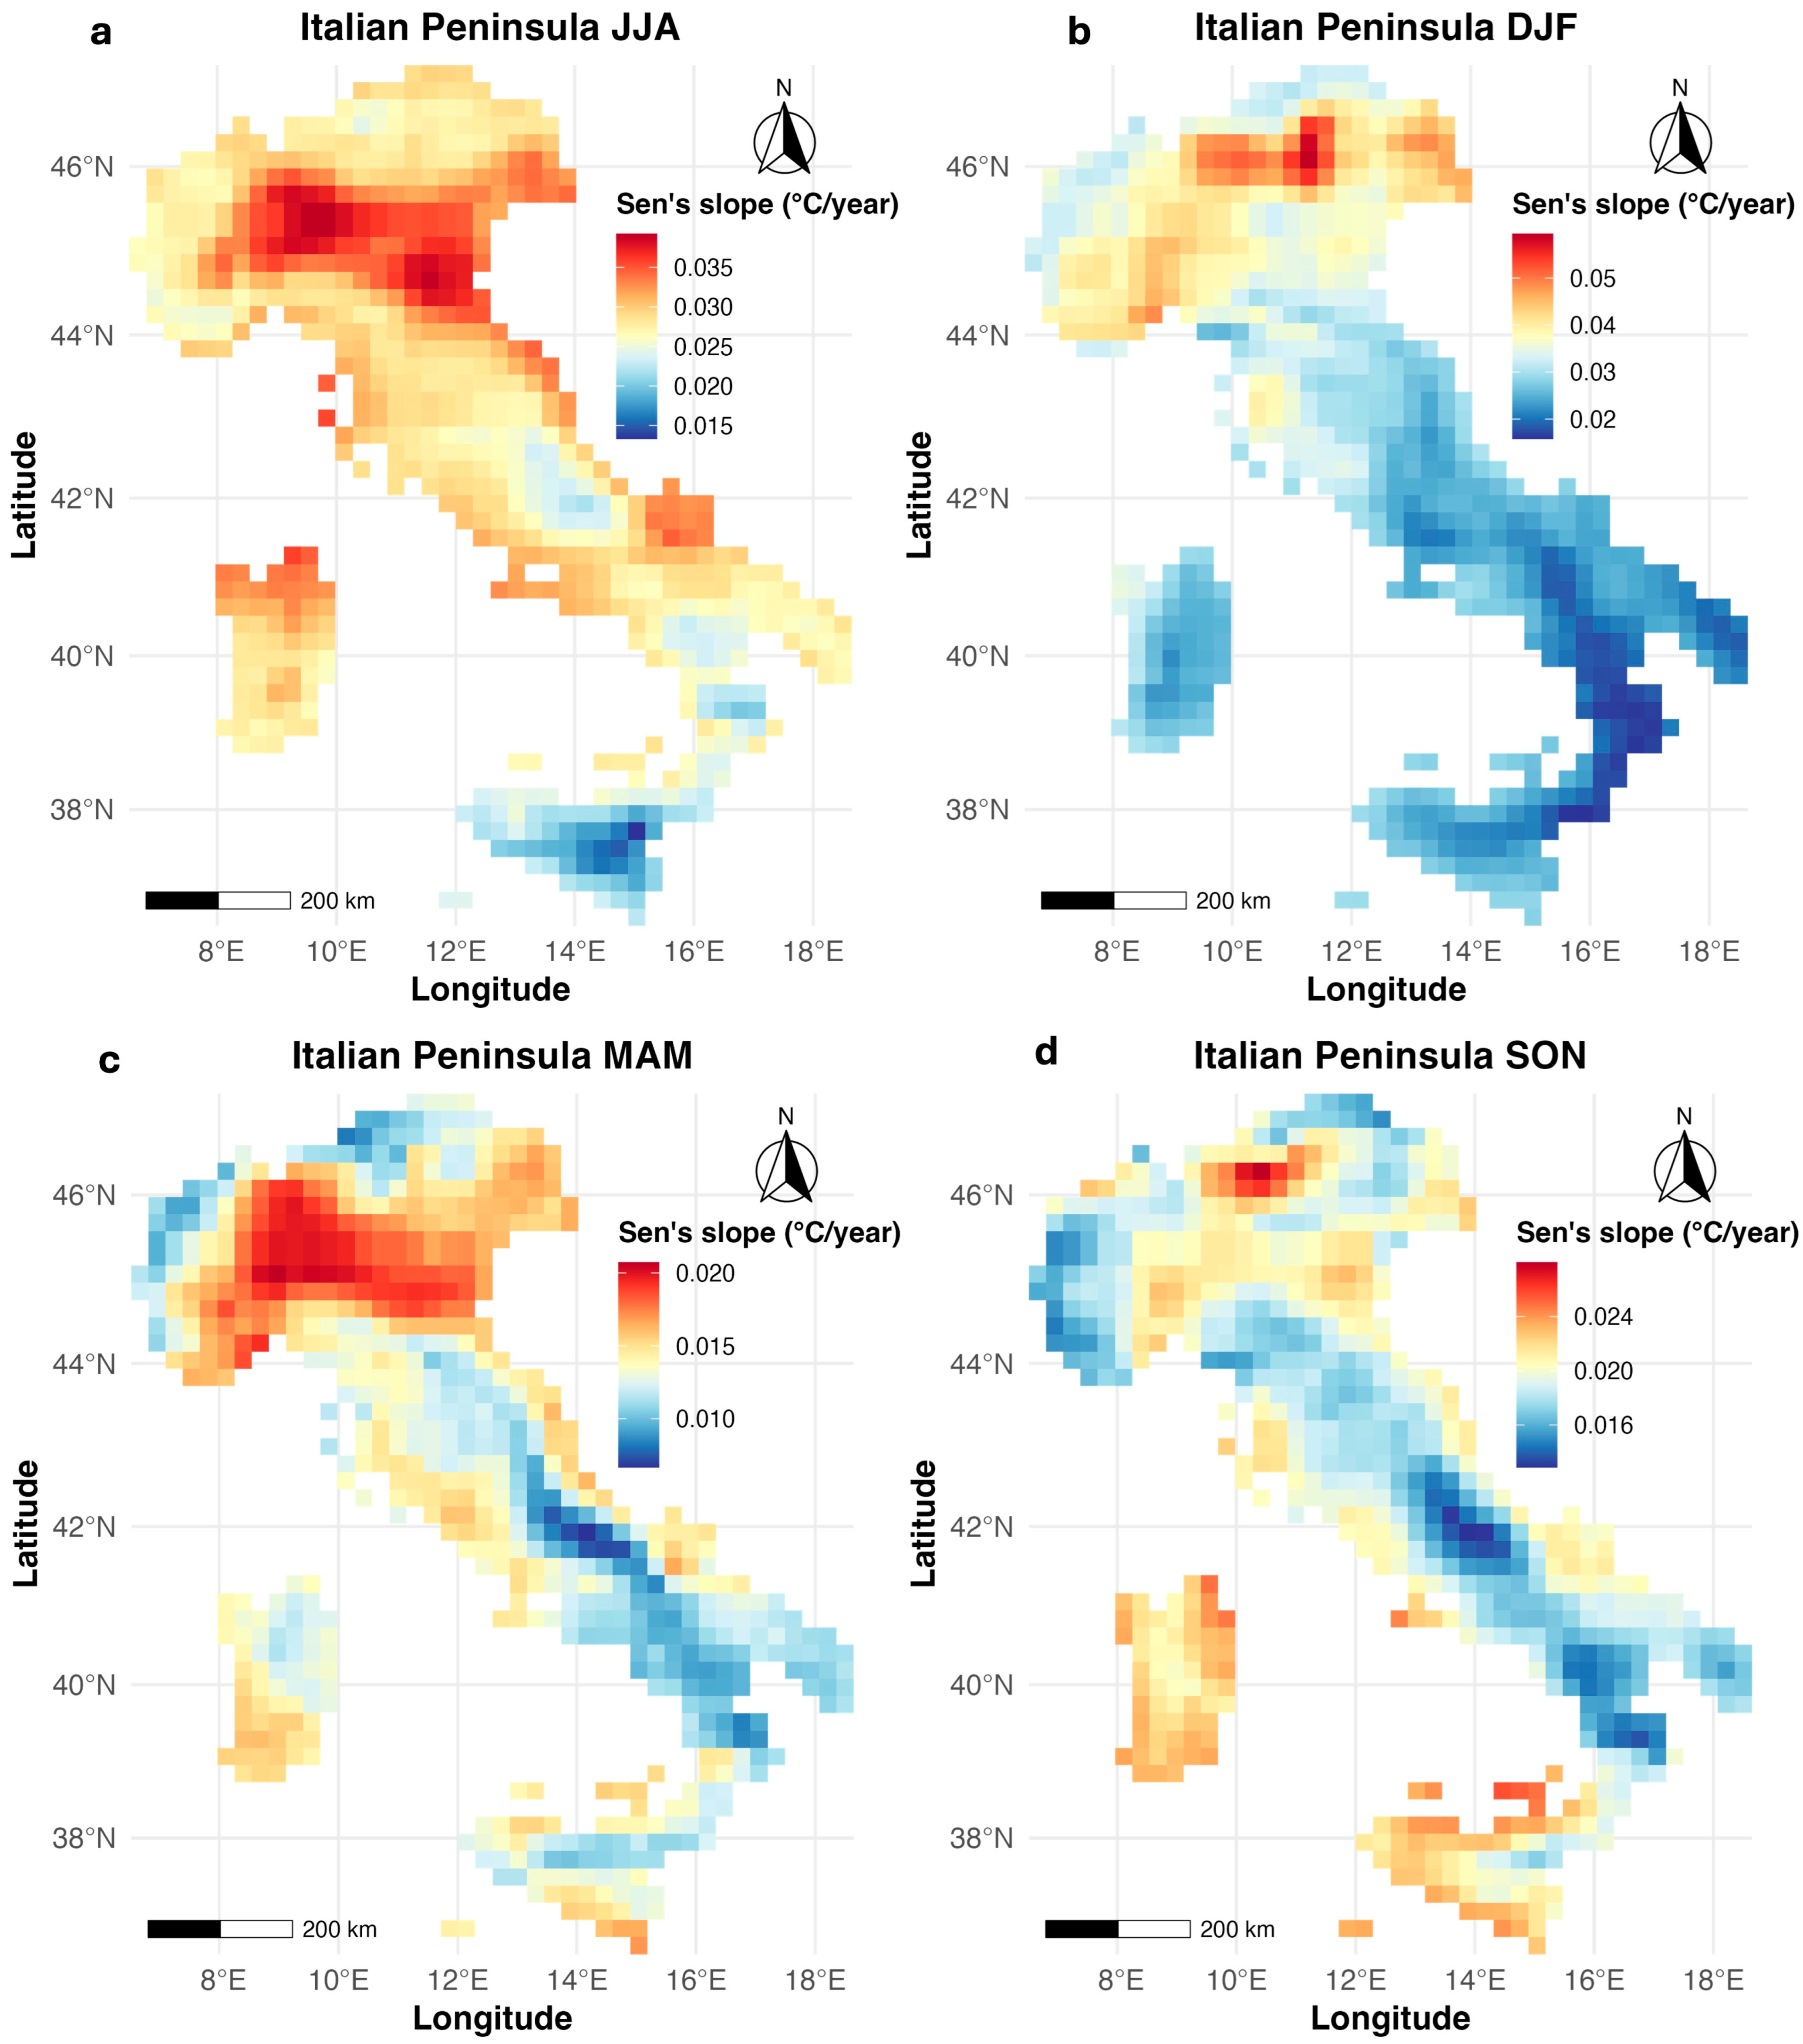
The spatial distribution of pixel-wise Sen’s slope for the Italian Peninsula reveals marked seasonal differences in the magnitude and spatial extent of UTCI trends (Figure 4). During summer (Figure 4a), the Italian Peninsula exhibits the strongest and most spatially extensive warming trends. The northern and central regions, particularly the Po Valley and surrounding highland areas, show Sen’s slope values exceeding 0.035 °C/year, highlighting a robust and persistent warming pattern. Southern regions and coastal areas display comparatively weaker but still positive slopes. The Mann–Kendall test confirms the robustness of these findings, with 100% of the pixels showing significant trends at p ≤ 0.05 (95% CI: 0.01 to 0.03), underlining that the warming signal during summer is statistically consistent across the peninsula. Winter (Figure 4b) also reveals widespread warming trends, though with a somewhat different spatial configuration compared to summer. Northern Italy again emerges as a hotspot, with Sen’s slopes exceeding 0.05 °C/year in localized clusters. However, southern Italy, particularly the Calabria and Apulia regions, exhibits weaker slopes, in some cases close to 0.02 °C/year. Despite these regional differences in intensity, the statistical analysis demonstrates that 100% of the pixels reach significance (p ≤ 0.05; 95% CI: 0.01 to 0.04), indicating that the observed warming in winter is not only strong but also spatially robust. In spring (Figure 4c), the warming trends are more spatially heterogeneous compared to summer and winter. Northern Italy shows consistent warming with Sen’s slopes in the range of 0.015–0.020 °C/year, while central and southern regions reveal patchier patterns, with alternating zones of moderate warming and areas of negligible or near-zero trends, particularly along southern coasts and islands. Statistical support for these trends is somewhat weaker than in summer and winter: 87.81% of pixels exhibit significant trends at p ≤ 0.05 (95% CI: 0.004 to 0.02). This indicates that while spring is generally warming, the signal is less spatially uniform, and some areas remain less affected. Autumn (Figure 4d) demonstrates a clear and widespread warming signal across most of the Italian Peninsula. Stronger slopes are concentrated in the northern regions, with localized areas exceeding 0.024 °C/year, while central and southern regions also exhibit consistent warming, albeit at lower magnitudes (closer to 0.016 °C/year). Importantly, the Mann–Kendall test shows that 100% of the pixels are statistically significant (p ≤ 0.05; 95% CI: 0.01 to 0.02), underscoring the spatial coherence of autumn warming trends across the entire region.
Across the Italian Peninsula, all four seasons exhibit significant warming trends in UTCI, albeit with varying intensity and spatial heterogeneity. JJA and DJF emerge as the seasons with the strongest and most spatially coherent warming signals, while MAM shows more fragmented trends, with statistical significance reduced to ~88% of the pixels. SON presents a uniformly significant warming signal, though with slightly lower magnitudes compared to summer. Together, these results provide robust evidence of year-round intensification of thermal stress conditions across the peninsula, with particularly critical implications for summer and winter extremes.
Figure 5 presents the spatial distribution of pixel-wise Sen’s slope estimates for UTCI trends across the Iberian Peninsula during the four seasons. Overall, the analysis reveals marked spatial heterogeneity, with distinct regional and seasonal contrasts in the magnitude and direction of trends. During JJA, the Iberian Peninsula exhibits a pronounced northwest–southeast contrast in UTCI trends. Negative or weak slopes dominate large portions of the western and northwestern regions, while positive trends are concentrated in the northeast and along the Mediterranean coast, with maximum intensities exceeding 0.035 °C/year. The MK p-value test indicates that 85.77% of the pixels exhibit statistically significant trends (p ≤ 0.05; 95% CI: 0.009 to 0.02), confirming that most of the spatial patterns represent robust climatic shifts. The significant warming signal in the Mediterranean and northeastern Iberia aligns with known regional summer warming hotspots. In DJF, the spatial signal strengthens markedly, with extensive warming trends across the eastern and southeastern Iberian Peninsula and adjacent islands. Sen’s slope values exceed 0.045 °C/year in parts of the Mediterranean coastal zone, while negative trends are confined primarily to the northwest and Atlantic-influenced areas. Importantly, 100% of the pixels meet the MK p-value significance threshold (p ≤ 0.05; 95% CI: 0.01 to 0.03), indicating that winter UTCI changes are statistically robust across the entire domain. This widespread significance highlights winter as the season with the most coherent and spatially consistent warming signal in the Iberian Peninsula. Spring presents a more spatially heterogeneous pattern compared to winter and summer. Positive slopes dominate central and eastern regions, with magnitudes up to 0.02 °C/year, while negative trends are visible in the northwest and parts of the western Iberian Peninsula. The MK p-value test shows that 67.73% of the pixels are statistically significant (p ≤ 0.05; 95% CI: 0.002 to 0.02), suggesting that while a large fraction of the region experiences robust springtime changes, weaker or nonsignificant trends reduce the overall coherence. This moderate significance level indicates transitional behavior in spring trends, consistent with the season’s climatic variability. Autumn trends are characterized by widespread warming across the Iberian Peninsula, particularly concentrated in the eastern half and Mediterranean regions, where slopes exceed 0.02 °C/year. Western areas display weaker and more mixed patterns, but overall warming dominates the seasonal signal. The MK p-value test indicates that 78.54% of the pixels exhibit significant trends (p ≤ 0.05; 95% CI: 0.003 to 0.02), suggesting that autumnal warming is statistically robust in most of the region, though with slightly less spatial coherence compared to winter.
The seasonal analysis highlights DJF as the season with the strongest and most spatially consistent warming signal, followed by JJA and SON, whereas MAM shows more heterogeneous trends and the lowest proportion of significant pixels. These results emphasize the pronounced seasonal dependency of UTCI changes in the Iberian Peninsula, with Mediterranean and eastern regions emerging as hotspots of significant warming.

4. Discussion

The results of this study provide compelling evidence that thermal conditions in the Italian and Iberian Peninsulas have undergone both abrupt and gradual changes over the past eight decades, with notable seasonal asymmetries in the pace and nature of these transitions. By combining breakpoint detection and trend analysis of UTCI values, we uncover a dual character in the evolution of regional thermal climates: a regime shift-driven intensification of summer heat stress and a progressive, statistically robust reduction in winter cold stress. In contrast, the transitional seasons exhibit more complex responses, with spring showing early signals of warming acceleration linked to the identified breakpoint, while autumn reveals comparatively smoother but significant Sen’s slope increases, underscoring their intermediate role in the seasonal redistribution of thermal stress.

4.1. Regime Shifts Reflect Threshold Dynamics

The identification of structural breakpoints in the summer UTCI time series (1980 for Italy and 1978 for Iberia) suggests that the climate system in southern Europe may have crossed critical thresholds, resulting in a transition from a mid-century cooling or stabilization phase to a sustained warming trend. These transitions may correspond to larger-scale atmospheric circulation reorganizations, such as shifts in the North Atlantic Oscillation (NAO) [44,45] or the expansion of the Hadley Cell [46], both linked to changing heatwave patterns in the Mediterranean. Additionally, soil moisture–atmosphere coupling likely amplifies summer warming in transitional Mediterranean climates [47,48], reinforcing stepwise regime shifts that bypass linear climate responses [49]. Furthermore, this stepwise change is consistent with the concept of regime shifts [34,35], wherein climate systems do not respond to forcing in a linear manner but exhibit non-linear transitions once specific resilience thresholds are surpassed. These results align with broader literature documenting an intensification of heat extremes and the shortening of cool seasons since the late 20th century in southern Europe—a pattern characterized by epochal shifts instead of gradual warming [50]. The co-occurrence of breakpoints across both regions highlights the regional coherence of these changes, suggesting that external climate drivers and anthropogenic warming have overwhelmed local modulating effects [51,52,53]. While prior studies have generally described summer warming as a gradual linear trend [54,55,56,57], our analysis suggests that a significant portion of this change may instead reflect abrupt, structural shifts in thermal dynamics, in line with observed step-changes in other climate systems such as lake temperatures [58] and consistent with theories of oscillation-induced abrupt climate responses [59]. Additionally, Mediterranean summer warming has increasingly deviated from linear trajectories due to disrupted teleconnections and enhanced land–atmosphere feedbacks [60].

4.2. Gradual Winter Warming

In contrast to summer, the winter UTCI time series reveal no breakpoints but rather exhibit persistent warming trends, with slopes of ~0.03–0.033 °C/year over the entire 1940–2024 period. Despite the absence of regime shifts, this consistent trend is statistically significant across most of both peninsulas and spatially more uniform than the summer patterns. The results indicate that winter warming is gradual but widespread, likely driven by cumulative greenhouse gas forcing and reductions in cold air advection from polar latitudes [61]. This slow but steady shift in winter conditions may have significant implications. A warming winter climate leads to the erosion of cold stress zones, potentially impacting agriculture (e.g., chilling requirements for perennial crops [62,63,64]), public health (e.g., persistent mortality from cold spells [65]), and energy systems (e.g., decreased heating demand but increased unpredictability of heating and cooling seasons [66]). Moreover, warming winters may alter the seasonal distribution of thermal comfort, potentially extending the outdoor activity window but also challenging local biodiversity and ecosystem resilience.

4.3. Asymmetric Seasonal Dynamics

One of the key contributions of this study is the documentation of asymmetric seasonal responses to climate change in Mediterranean Europe. While summer warming follows a non-linear, threshold-based dynamic, winter warming unfolds more linearly and continuously. This asymmetry likely reflects differences in land–atmosphere feedback strength, soil moisture constraints, and solar radiation forcing between the seasons [48,67]. Summer is more vulnerable to amplified feedback loops, such as drier soils leading to reduced evapotranspiration and further warming [68]. In winter, such feedbacks are less pronounced, and the system responds more directly to broader atmospheric warming trends. These distinct seasonal trajectories underscore the necessity of season-specific adaptation policies, with summer requiring strategies to manage heatwaves and thermal discomfort, while winter calls for attention to shifting cold risk baselines and changing energy demands.

4.4. Spring: Early Warming Signals and Spatial Heterogeneity

Spring UTCI trends reveal that warming signals are emerging earlier than in other seasons, with detectable breakpoints in 1987 for Italy and 1988 for Iberia. These shifts mark the onset of accelerated warming, with Sen’s slopes increasing from near-neutral values (−0.005 to −0.006 °C/year) to moderate positive rates (~+0.02 °C/year). However, statistical significance remains spatially heterogeneous, with stronger signals in central and eastern regions, while western and northwestern zones show weaker or nonsignificant changes. This variability highlights spring’s transitional role, where climatic influences from both winter persistence and summer onset overlap. The uneven distribution of significance (e.g., only 67.7% of Iberian pixels meeting p ≤ 0.05) underscores the uncertainty in springtime dynamics. For the Italian Peninsula, the spring warming pattern is concentrated in northern and central sectors, particularly around the Po Valley and northeastern regions, while southern and coastal areas show weaker or even nonsignificant slopes, consistent with the spatial heterogeneity (87.81% of Italian pixels present p ≤ 0.05). Societally, earlier warming tends to shorten the effective cool season, potentially advancing agricultural phenological cycles and likely intensifying early-season water demand.

4.5. Autumn: Consolidation of Summer Heat

In autumn, UTCI trends display smoother but more spatially coherent warming compared to spring. For Italy, a breakpoint was identified in 1970, with Sen’s slopes intensifying from ~+0.016 °C/year to +0.024 °C/year, while Iberia exhibits no abrupt structural change but consistent positive trends. Statistical significance is high, with over 78% of Iberian pixels showing p ≤ 0.05. These results suggest that autumn functions as a consolidating phase, extending summer-like heat into later months and stabilizing the seasonal redistribution of thermal stress. The prolongation of warm conditions amplifies thermal discomfort, potentially delaying vegetation dormancy and altering harvest timing. In public health and energy terms, extended warmth prolongs exposure to heat-related risks and increases cooling demand, reshaping the seasonal balance between heating and cooling needs.

4.6. Relevance for Policy and Adaptation

Finally, the observed trends and shifts have direct relevance for public health, urban planning, and climate policy in southern Europe. The growing spatial extent of Moderate Heat Stress in summer underscores the need for heat mitigation strategies, such as increasing urban green cover, promoting thermal-aware building designs, and issuing early warning systems. In contrast, the declining cold stress in winter suggests a need to reassess infrastructure resilience and biodiversity management strategies in regions historically dependent on cold-season dynamics. Furthermore, the sharp regime shifts detected in summer UTCI may signal non-reversible thresholds that, once crossed, can significantly alter local climate and health outcomes. These findings call for timely climate adaptation frameworks that incorporate non-linear responses and spatial heterogeneity.
The observed shifts in UTCI patterns across the Italian and Iberian Peninsulas carry significant societal implications, particularly in sectors directly influenced by thermal stress. The intensification of summer heat stress, as evidenced by the Sen’s slope trends and breakpoint analysis, is likely to exacerbate public health risks, including heat-related illnesses and mortality, especially among vulnerable populations such as the elderly and those with pre-existing health conditions. This increased thermal burden also implies rising energy demand due to greater reliance on cooling systems, further straining electricity networks during peak summer months. Conversely, the reduction in winter cold stress may lessen heating requirements, potentially easing household energy costs but also altering traditional energy demand patterns. In agriculture, hotter summers coupled with milder winters could disrupt crop cycles and reduce yields for temperature-sensitive crops, such as olives, grapes, and cereals, which are cornerstones of Mediterranean economies. These combined effects underscore the pressing need for adaptive strategies in urban planning, health preparedness, and agricultural practices to mitigate the risks posed by the ongoing shifts in regional thermal climates.

5. Conclusions

This study provides a detailed and multi-dimensional assessment of long-term thermal comfort dynamics over the Italian and Iberian Peninsulas between 1940 and 2024, using the UTCI as an integrative measure of human thermal stress. By applying a combination of regime shift detection and non-parametric trend estimators, we identified both abrupt and progressive changes in seasonal thermal regimes, offering critical insights into the evolving climate of southern Europe. A key finding is the identification of statistically significant summer regime shifts in both regions. In the Italian Peninsula, the breakpoint year was detected as 1980, dividing the series into two distinct regimes: a cooling trend from 1940 to 1980, followed by a strong warming trend from 1981 to 2024. The Iberian Peninsula exhibited a similar structural change in 1978, transitioning from a negative trend to a positive trend thereafter. These breakpoints align with broader climatic shifts and anthropogenic forcing intensifications in the late 20th century, suggesting a regional-scale thermal regime transition in summer conditions. In contrast, the winter (DJF) UTCI series revealed no abrupt breakpoints, but instead showed persistent warming trends throughout the entire 1940–2024 period. These results highlight the asymmetry in seasonal climate change, with summer warming characterized by abrupt transitions and winter warming unfolding more gradually yet steadily.
Spatial trend analyses using Sen’s slope further reinforced these dynamics. In northern Italy and northeastern Iberia, summer warming reached up to 0.035 °C/year and 0.04 °C/year, respectively, while winter warming was spatially more uniform, with widespread significant trends across southern and eastern regions of both peninsulas. The Mann–Kendall p-value test confirmed the robustness of these results, which is particularly important for interpreting long climate records with high persistence. The spatial analyses of Sen’s slopes emphasize the importance of local heterogeneity in thermal responses. Even within areas with statistically significant trends, intra-regional variability is evident—particularly in mountainous, coastal, and urban fringe zones. These variations are likely shaped by microclimatic factors such as topography, land cover, albedo, and urbanization patterns [69]. These findings reinforce the need to analyze climate data at high spatial resolution when designing local adaptation interventions.
The transitional role of spring is evident in the breakpoint and Sen’s slope analyses, which reveal early signals of accelerated warming but with pronounced spatial variability. This heterogeneity reflects the interplay between lingering winter influences and the onset of summer dynamics. As a result, spring emerges as an early-warning indicator of changing thermal regimes, pointing toward shifts in phenology, agriculture, and water demand that precede the full intensification of summer heat stress.
Autumn, in contrast, displays smoother and more spatially consistent warming, with highly significant Sen’s slopes across most of both peninsulas. These results suggest that autumn functions as a consolidating phase that prolongs summer-like thermal conditions, effectively lengthening the warm season. This has important societal implications, including extended periods of cooling demand in urban environments, changes in crop harvesting windows, and potential shifts in ecosystem resilience as the duration of heat exposure increases.
Together, the results illustrate a complex but coherent picture of seasonally asymmetric thermal change: a stepwise intensification of summer heat and a smoother erosion of winter cold, consistent with expected Mediterranean climate responses under global warming. This dual dynamic poses growing challenges for thermal comfort, public health, urban heat stress resilience, and energy demands. The demonstrated effectiveness of regime shift detection and spatially explicit trend analysis underscores the value of combining statistical rigor with advanced visualization to capture climate change patterns precisely and clearly.
In addition to these clear summer and winter signals, the transitional seasons—spring and autumn—offer valuable insight into intermediate climate dynamics. Spring (MAM) trends show early signals of warming acceleration linked to the detected breakpoints, with positive but spatially heterogeneous Sen’s slopes. The proportion of significant trends (67.7% in Iberia and 87.8% in Italy) indicates that while spring warming is underway, its manifestation is less uniform, reflecting the transitional character of this season. By contrast, autumn (SON) demonstrates more coherent spatial patterns of positive Sen’s slopes, with significance levels exceeding 78% in Iberia and 100% in Italy, underscoring its role as a robust but smoother contributor to long-term warming trajectories.
These findings highlight that spring and autumn act as transitional seasons in which the interplay between abrupt shifts and gradual warming is less pronounced than in summer and winter but nonetheless significant. Spring emerges as an early indicator of shifting thermal baselines, while autumn consolidates the seasonal redistribution of warming, bridging the abrupt summer intensification and the gradual winter response. Together, these transitional dynamics underscore the importance of considering all four seasons when assessing climate impacts, as the intermediate periods play a critical role in shaping annual and regional patterns of thermal comfort.
Future work should aim to integrate socio-ecological vulnerability layers, urban heat island data, or bioclimatic risk indicators to better contextualize these findings and guide regional adaptation strategies in southern Europe. Overall, the methodological framework established here offers a transferable approach for other regions undergoing rapid climate transitions.

Supplementary Materials

The following supporting information can be downloaded at: https://www.mdpi.com/article/10.3390/cli13090184/s1, Figures S1 and S2: Binary classification of pixel-level regime shift timing in UTCI.

Author Contributions

Conceptualization, methodology, and formal analysis, G.I.C. and J.C.J.; software, resources, and data curation, G.I.C.; writing—original draft preparation, G.I.C.; writing—review and editing, G.I.C. and J.C.J. All authors have read and agreed to the published version of the manuscript.

Funding

This research received no external funding.

Data Availability Statement

Data used in this research are available upon reasonable request from the authors.

Conflicts of Interest

The authors declare no conflicts of interest.

References

  1. Paz, S. Impacts of climate change on Public Health of the Mediterranean population. Eur. J. Public Health 2020, 30 (Suppl. 5), ckaa165.512. [Google Scholar] [CrossRef]
  2. Tong, S.; Prior, J.; McGregor, G.; Shi, X.; Kinney, P. Urban heat: An increasing threat to global health. BMJ 2021, 375, n2467. [Google Scholar] [CrossRef]
  3. Hochman, A.; Marra, F.; Messori, G.; Pinto, J.G.; Raveh-Rubin, S.; Yosef, Y.; Zittis, G. Extreme weather and societal impacts in the eastern Mediterranean. Earth Syst. Dyn. 2022, 13, 749–777. [Google Scholar] [CrossRef]
  4. Li, J.; Chen, Y.D.; Gan, T.Y.; Lau, N.-C. Elevated increases in human-perceived temperature under climate warming. Nat. Clim. Change 2018, 8, 43–47. [Google Scholar] [CrossRef]
  5. Matzarakis, A.; Amelung, B. Physiological Equivalent Temperature as Indicator for Impacts of Climate Change on Thermal Comfort of Humans. In Seasonal Forecasts, Climatic Change and Human Health; Springer: Dordrecht, The Netherlands, 2008; pp. 161–172. [Google Scholar] [CrossRef]
  6. Fiala, D.; Lomas, K.J.; Stohrer, M. A computer model of human thermoregulation for a wide range of environmental conditions: The passive system. J. Appl. Physiol. 1999, 87, 1957–1972. [Google Scholar] [CrossRef] [PubMed]
  7. Fiala, D.; Havenith, G.; Bröde, P.; Kampmann, B.; Jendritzky, G. UTCI-Fiala multi-node model of human heat transfer and temperature regulation. Int. J. Biometeorol. 2011, 56, 429–441. [Google Scholar] [CrossRef] [PubMed]
  8. Bröde, P.; Fiala, D.; Błażejczyk, K.; Holmér, I.; Jendritzky, G.; Kampmann, B.; Tinz, B.; Havenith, G. Deriving the operational procedure for the Universal Thermal Climate Index (UTCI). Int. J. Biometeorol. 2011, 56, 481–494. [Google Scholar] [CrossRef]
  9. Błażejczyk, K.; Jendritzky, G.; Bröde, P.; Fiala, D.; Havenith, G.; Epstein, Y.; Psikuta, A.; Kampmann, B.; Tinz, B. An introduction to the Universal Thermal Climate Index (UTCI). Geogr. Pol. 2013, 86, 5–10. [Google Scholar] [CrossRef]
  10. Blazejczyk, K.; Epstein, Y.; Jendritzky, G.; Staiger, H.; Tinz, B. Comparison of UTCI to selected thermal indices. Int. J. Biometeorol. 2011, 56, 515–535. [Google Scholar] [CrossRef]
  11. Jendritzky, G.; de Dear, R.; Havenith, G. UTCI—Why another thermal index? Int. J. Biometeorol. 2011, 56, 421–428. [Google Scholar] [CrossRef]
  12. Błażejczyk, K.; Błażejczyk, A. Mapping the Universal Thermal Climate Index (In Different Scales). In Applications of the Universal Thermal Climate Index UTCI in Biometeorology; Springer: Cham, Germany, 2021; pp. 155–176. [Google Scholar] [CrossRef]
  13. Geletič, J.; Lehnert, M.; Resler, J.; Krč, P. Application of the UTCI in High-Resolution Urban Climate Modeling Techniques. In Applications of the Universal Thermal Climate Index UTCI in Biometeorology; Springer: Cham, Germany, 2021; pp. 177–191. [Google Scholar] [CrossRef]
  14. Krüger, E.L. Literature Review on UTCI Applications. In Applications of the Universal Thermal Climate Index UTCI in Biometeorology; Springer: Cham, Germany, 2021; pp. 23–65. [Google Scholar] [CrossRef]
  15. Ullah, S.; Aldossary, A.; Ullah, W.; Al-Ghamdi, S.G. Augmented human thermal discomfort in urban centers of the Arabian Peninsula. Sci. Rep. 2024, 14, 3974. [Google Scholar] [CrossRef]
  16. Kyaw, A.K.; Hamed, M.M.; Shahid, S. Spatiotemporal Changes in Universal Thermal Climate Index Over South Asia. Atmos. Res. 2023, 292, 106838. [Google Scholar] [CrossRef]
  17. Hamed, M.M.; Kyaw, A.K.; Nashwan, M.S.; Shahid, S. Spatiotemporal changes in Universal Thermal Climate Index in the Middle East and North Africa. Atmos. Res. 2023, 295, 107008. [Google Scholar] [CrossRef]
  18. Nam, C.; Lierhammer, L.; Buntemeyer, L.; Evadzi, P.; Cabana, D.; Celliers, L. Changes in universal thermal climate index from regional climate model projections over European beaches. Clim. Serv. 2024, 34, 100447. [Google Scholar] [CrossRef]
  19. Ahmadi, H.; Baaghideh, M. Investigating the potential effects of climate change on deviation of thermal and human bioclimatic conditions in Iran. Model. Earth Syst. Environ. 2019, 6, 439–453. [Google Scholar] [CrossRef]
  20. Wu, J.; Gao, X.; Giorgi, F.; Chen, D. Changes of effective temperature and cold/hot days in late decades over China based on a high resolution gridded observation dataset. Int. J. Climatol. 2017, 37, 788–800. [Google Scholar] [CrossRef]
  21. Zhu, J.; Wang, S.; Huang, G. Assessing Climate Change Impacts on Human-Perceived Temperature Extremes and Underlying Uncertainties. J. Geophys. Res. Atmos. 2019, 124, 3800–3821. [Google Scholar] [CrossRef]
  22. Isinkaralar, O.; Isinkaralar, K.; Sevik, H.; Küçük, Ö. Thermal comfort modeling, aspects of land use in urban planning and spatial exposition under future climate parameters. Int. J. Environ. Sci. Technol. 2025, 22, 11977–11990. [Google Scholar] [CrossRef]
  23. Pantavou, K.; Kotroni, V.; Kyros, G.; Lagouvardos, K. Thermal bioclimate in Greece based on the Universal Thermal Climate Index (UTCI) and insights into 2021 and 2023 heatwaves. Theor. Appl. Climatol. 2024, 155, 6661–6675. [Google Scholar] [CrossRef]
  24. Pantavou, K.; Kotroni, V.; Lagouvardos, K.; Kyriakou, P. Future changes of bioclimate in Greece: Variations in thermal stress according to the Universal Thermal Climate Index (UTCI). Sci. Total Environ. 2025, 980, 179514. [Google Scholar] [CrossRef]
  25. Hynčica, M.; Novák, M.; Procházková, S. Trends and Climatology of UTCI in the Czech Republic. Environ. Sci. Proc. 2023, 26, 31. [Google Scholar] [CrossRef]
  26. Shevchenko, O.; Snizhko, S.; Matzarakis, A. Recent trends on human thermal bioclimate conditions in Kyiv, Ukraine. Geogr. Pol. 2020, 93, 89–106. [Google Scholar] [CrossRef]
  27. Shevchenko, O. Human Thermal Comfort Conditions during Heat Wave Events in Kyiv, Ukraine. Environ. Res. Eng. Manag. 2021, 77, 99–109. [Google Scholar] [CrossRef]
  28. Alexander, L.V.; Zhang, X.; Peterson, T.C.; Caesar, J.; Gleason, B.; Klein Tank, A.; Haylock, M.; Collins, D.; Trewin, B.; Rahimzadeh, F.; et al. Global observed changes in daily climate extremes of temperature and precipitation. J. Geophys. Res. 2006, 111, D05109. [Google Scholar] [CrossRef]
  29. Donat, M.G.; Alexander, L.V.; Yang, H.; Durre, I.; Vose, R.; Dunn, R.J.H.; Willett, K.M.; Aguilar, E.; Brunet, M.; Caesar, J.; et al. Updated analyses of temperature and precipitation extreme indices since the beginning of the twentieth century: The HadEX2 dataset. J. Geophys. Res. Atmos. 2013, 118, 2098–2118. [Google Scholar] [CrossRef]
  30. Twardosz, R.; Walanus, A.; Guzik, I. Warming in Europe: Recent Trends in Annual and Seasonal temperatures. Pure Appl. Geophys. 2021, 178, 4021–4032. [Google Scholar] [CrossRef]
  31. Lenton, T.M.; Held, H.; Kriegler, E.; Hall, J.W.; Lucht, W.; Rahmstorf, S.; Schellnhuber, H.J. Tipping elements in the Earth’s climate system. Proc. Natl. Acad. Sci. USA 2008, 105, 1786–1793. [Google Scholar] [CrossRef]
  32. Lohmann, J.; Castellana, D.; Ditlevsen, P.D.; Dijkstra, H.A. Abrupt climate change as a rate-dependent cascading tipping point. Earth Syst. Dyn. 2021, 12, 819–835. [Google Scholar] [CrossRef]
  33. Armstrong McKay, D.I.; Staal, A.; Abrams, J.F.; Winkelmann, R.; Sakschewski, B.; Loriani, S.; Fetzer, I.; Cornell, S.E.; Rockström, J.; Lenton, T.M. Exceeding 1.5 °C global warming could trigger multiple climate tipping points. Science 2022, 377, eabn7950. [Google Scholar] [CrossRef] [PubMed]
  34. Cooper, G.S.; Willcock, S.; Dearing, J.A. Regime shifts occur disproportionately faster in larger ecosystems. Nat. Commun. 2020, 11, 1175. [Google Scholar] [CrossRef]
  35. Sardanyés, J.; Ivančić, F.; Vidiella, B. Identifying regime shifts, transients and late warning signals for proactive ecosystem management. Biol. Conserv. 2024, 290, 110433. [Google Scholar] [CrossRef]
  36. Di Napoli, C.; Barnard, C.; Prudhomme, C.; Cloke, H.L.; Pappenberger, F. ERA5-HEAT: A global gridded historical dataset of human thermal comfort indices from climate reanalysis. Geosci. Data J. 2020, 8, 2–10. [Google Scholar] [CrossRef]
  37. Gorelick, N.; Hancher, M.; Dixon, M.; Ilyushchenko, S.; Thau, D.; Moore, R. Google Earth Engine: Planetary-scale geospatial analysis for everyone. Remote Sens. Environ. 2017, 202, 18–27. [Google Scholar] [CrossRef]
  38. QGIS Development Team. QGIS Version 3.34. Geographic Information System. Open-Source Geospatial Foundation Project. 2024. Available online: https://www.qgis.org/en/site/ (accessed on 10 June 2025).
  39. R Core Team. R: A Language and Environment for Statistical Computing; R Foundation for Statistical Computing: Vienna, Austria, 2023; Available online: https://www.R-project.org/ (accessed on 10 June 2025).
  40. Zeileis, A.; Kleiber, C.; Krämer, W.; Hornik, K. Testing and dating of structural changes in practice. Comput. Stat. Data Anal. 2003, 44, 109–123. [Google Scholar] [CrossRef]
  41. Sen, P.K. Estimates of the Regression Coefficient Based on Kendall’s Tau. J. Am. Stat. Assoc. 1968, 63, 1379. [Google Scholar] [CrossRef]
  42. Mann, H.B. Nonparametric Tests Against Trend. Econometrica 1945, 13, 245–259. [Google Scholar] [CrossRef]
  43. McLeod, A. Kendall: Kendall Rank Correlation and Mann-Kendall Trend Test. R Package Version 2.2.1. 2022. Available online: https://CRAN.R-project.org/package=Kendall (accessed on 13 June 2025).
  44. Stefanon, M.; D’Andrea, F.; Drobinski, P. Heatwave classification over Europe and the Mediterranean region. Environ. Res. Lett. 2012, 7, 014023. [Google Scholar] [CrossRef]
  45. Qasmi, S.; Sanchez-Gomez, E.; Ruprich-Robert, Y.; Boé, J.; Cassou, C. Modulation of the Occurrence of Heatwaves over the Euro-Mediterranean Region by the Intensity of the Atlantic Multidecadal Variability. J. Clim. 2021, 34, 1099–1114. [Google Scholar] [CrossRef]
  46. Lu, J.; Vecchi, G.A.; Reichler, T. Expansion of the Hadley cell under global warming. Geophys. Res. Lett. 2007, 34. [Google Scholar] [CrossRef] [PubMed]
  47. Hirschi, M.; Seneviratne, S.I.; Alexandrov, V.; Boberg, F.; Boroneant, C.; Christensen, O.B.; Formayer, H.; Orlowsky, B.; Stepanek, P. Observational evidence for soil-moisture impact on hot extremes in southeastern Europe. Nat. Geosci. 2010, 4, 17–21. [Google Scholar] [CrossRef]
  48. Materia, S.; Ardilouze, C.; Prodhomme, C.; Donat, M.G.; Benassi, M.; Doblas-Reyes, F.J.; Peano, D.; Caron, L.-P.; Ruggieri, P.; Gualdi, S. Summer temperature response to extreme soil water conditions in the Mediterranean transitional climate regime. Clim. Dyn. 2021, 58, 1943–1963. [Google Scholar] [CrossRef]
  49. Collie, J.S.; Richardson, K.; Steele, J.H. Regime shifts: Can ecological theory illuminate the mechanisms? Prog. Oceanogr. 2004, 60, 281–302. [Google Scholar] [CrossRef]
  50. Conversi, A.; Fonda Umani, S.; Peluso, T.; Molinero, J.C.; Santojanni, A.; Edwards, M. The Mediterranean Sea Regime Shift at the End of the 1980s, and Intriguing Parallelisms with Other European Basins. PLoS ONE 2010, 5, e10633. [Google Scholar] [CrossRef]
  51. Christidis, N.; Stott, P.A.; Zwiers, F.W.; Shiogama, H.; Nozawa, T. The contribution of anthropogenic forcings to regional changes in temperature during the last decade. Clim. Dyn. 2011, 39, 1259–1274. [Google Scholar] [CrossRef]
  52. Estrada, F.; Kim, D.; Perron, P. Anthropogenic influence in observed regional warming trends and the implied social time of emergence. Commun. Earth Environ. 2021, 2, 31. [Google Scholar] [CrossRef]
  53. Deser, C.; Phillips, A.S. A range of outcomes: The combined effects of internal variability and anthropogenic forcing on regional climate trends over Europe. Nonlinear Process. Geophys. 2023, 30, 63–84. [Google Scholar] [CrossRef]
  54. Zhang, P.; Ren, G.; Xu, Y.; Wang, X.L.; Qin, Y.; Sun, X.; Ren, Y. Observed Changes in Extreme Temperature over the Global Land Based on a Newly Developed Station Daily Dataset. Am. Meteorol. Soc. 2019, 32, 8489–8509. [Google Scholar] [CrossRef]
  55. Pastor, F.; Valiente, J.A.; Palau, J.L. Sea Surface Temperature in the Mediterranean: Trends and Spatial Patterns (1982–2016). In Meteorology and Climatology of the Mediterranean and Black Seas; Birkhäuser: Cham, Germany, 2019; pp. 297–309. [Google Scholar] [CrossRef]
  56. Bednorz, E.; Tomczyk, A.M.; Czernecki, B.; Piękny, M. Impact of regional-scale atmospheric circulation patterns on winter air temperature variability in the Svalbard area. Pol. Polar Res. 2023, 45, 21–42. [Google Scholar] [CrossRef]
  57. Hadjinicolaou, P.; Tzyrkalli, A.; Zittis, G.; Lelieveld, J. Urbanisation and Geographical Signatures in Observed Air Temperature Station Trends Over the Mediterranean and the Middle East–North Africa. Earth Syst. Environ. 2023, 7, 649–659. [Google Scholar] [CrossRef]
  58. Woolway, R.I.; Dokulil, M.T.; Marszelewski, W.; Schmid, M.; Bouffard, D.; Merchant, C.J. Warming of Central European lakes and their response to the 1980s climate regime shift. Clim. Change 2017, 142, 505–520. [Google Scholar] [CrossRef]
  59. Bathiany, S.; Scheffer, M.; van Nes, E.H.; Williamson, M.S.; Lenton, T.M. Abrupt Climate Change in an Oscillating World. Sci. Rep. 2018, 8, 5040. [Google Scholar] [CrossRef]
  60. Barcikowska, M.J.; Kapnick, S.B.; Krishnamurty, L.; Russo, S.; Cherchi, A.; Folland, C.K. Changes in the future summer Mediterranean climate: Contribution of teleconnections and local factors. Earth Syst. Dyn. 2020, 11, 161–181. [Google Scholar] [CrossRef]
  61. Francis, J.A.; Vavrus, S.J. Evidence linking Arctic amplification to extreme weather in mid-latitudes. Geophys. Res. Lett. 2012, 39. [Google Scholar] [CrossRef]
  62. Luedeling, E. Climate change impacts on winter chill for temperate fruit and nut production: A review. Sci. Hortic. 2012, 144, 218–229. [Google Scholar] [CrossRef]
  63. Fernandez, E.; Mojahid, H.; Fadón, E.; Rodrigo, J.; Ruiz, D.; Egea, J.A.; Ben Mimoun, M.; Kodad, O.; El Yaacoubi, A.; Ghrab, M.; et al. Climate change impacts on winter chill in Mediterranean temperate fruit orchards. Reg. Environ. Change 2022, 23. [Google Scholar] [CrossRef]
  64. Škvareninová, J.; Lukasová, V.; Borsányi, P.; Kvas, A.; Vido, J.; Štefková, J.; Škvarenina, J. The effect of climate change on spring frosts and flowering of Crataegus laevigata—The indicator of the validity of the weather lore about “The Ice Saints”. Ecol. Indic. 2022, 145, 109688. [Google Scholar] [CrossRef]
  65. Yuan, G.; Huang, W.; Zhao, Q.; Ryti, N.; Armstrong, B.; Gasparrini, A.; Tong, S.; Pascal, M.; Urban, A.; Zeka, A.; et al. Global, regional, and national burden of mortality associated with cold spells during 2000–19: A three-stage modelling study. Lancet Planet. Health 2024, 8, e108–e116. [Google Scholar] [CrossRef]
  66. Isaac, M.; van Vuuren, D.P. Modeling global residential sector energy demand for heating and air conditioning in the context of climate change. Energy Policy 2009, 37, 507–521. [Google Scholar] [CrossRef]
  67. Dirmeyer, P.A.; Cash, B.A.; Kinter, J.L.; Stan, C.; Jung, T.; Marx, L.; Towers, P.; Wedi, N.; Adams, J.M.; Altshuler, E.L.; et al. Evidence for Enhanced Land–Atmosphere Feedback in a Warming Climate. J. Hydrometeorol. 2012, 13, 981–995. [Google Scholar] [CrossRef]
  68. Zittis, G.; Hadjinicolaou, P.; Lelieveld, J. Land-Atmosphere Coupling: The Feedback of Soil Moisture into Surface Temperature in Eastern Mediterranean and Middle East. In Advances in Meteorology, Climatology and Atmospheric Physics; Springer: Berlin/Heidelberg, Germany, 2012; pp. 833–839. [Google Scholar] [CrossRef]
  69. Findell, K.L.; Yin, Z.; Seo, E.; Dirmeyer, P.A.; Arnold, N.P.; Chaney, N.; Fowler, M.D.; Huang, M.; Lawrence, D.M.; Ma, P.-L.; et al. Accurate assessment of land–atmosphere coupling in climate models requires high-frequency data output. Geosci. Model Dev. 2024, 17, 1869–1883. [Google Scholar] [CrossRef]
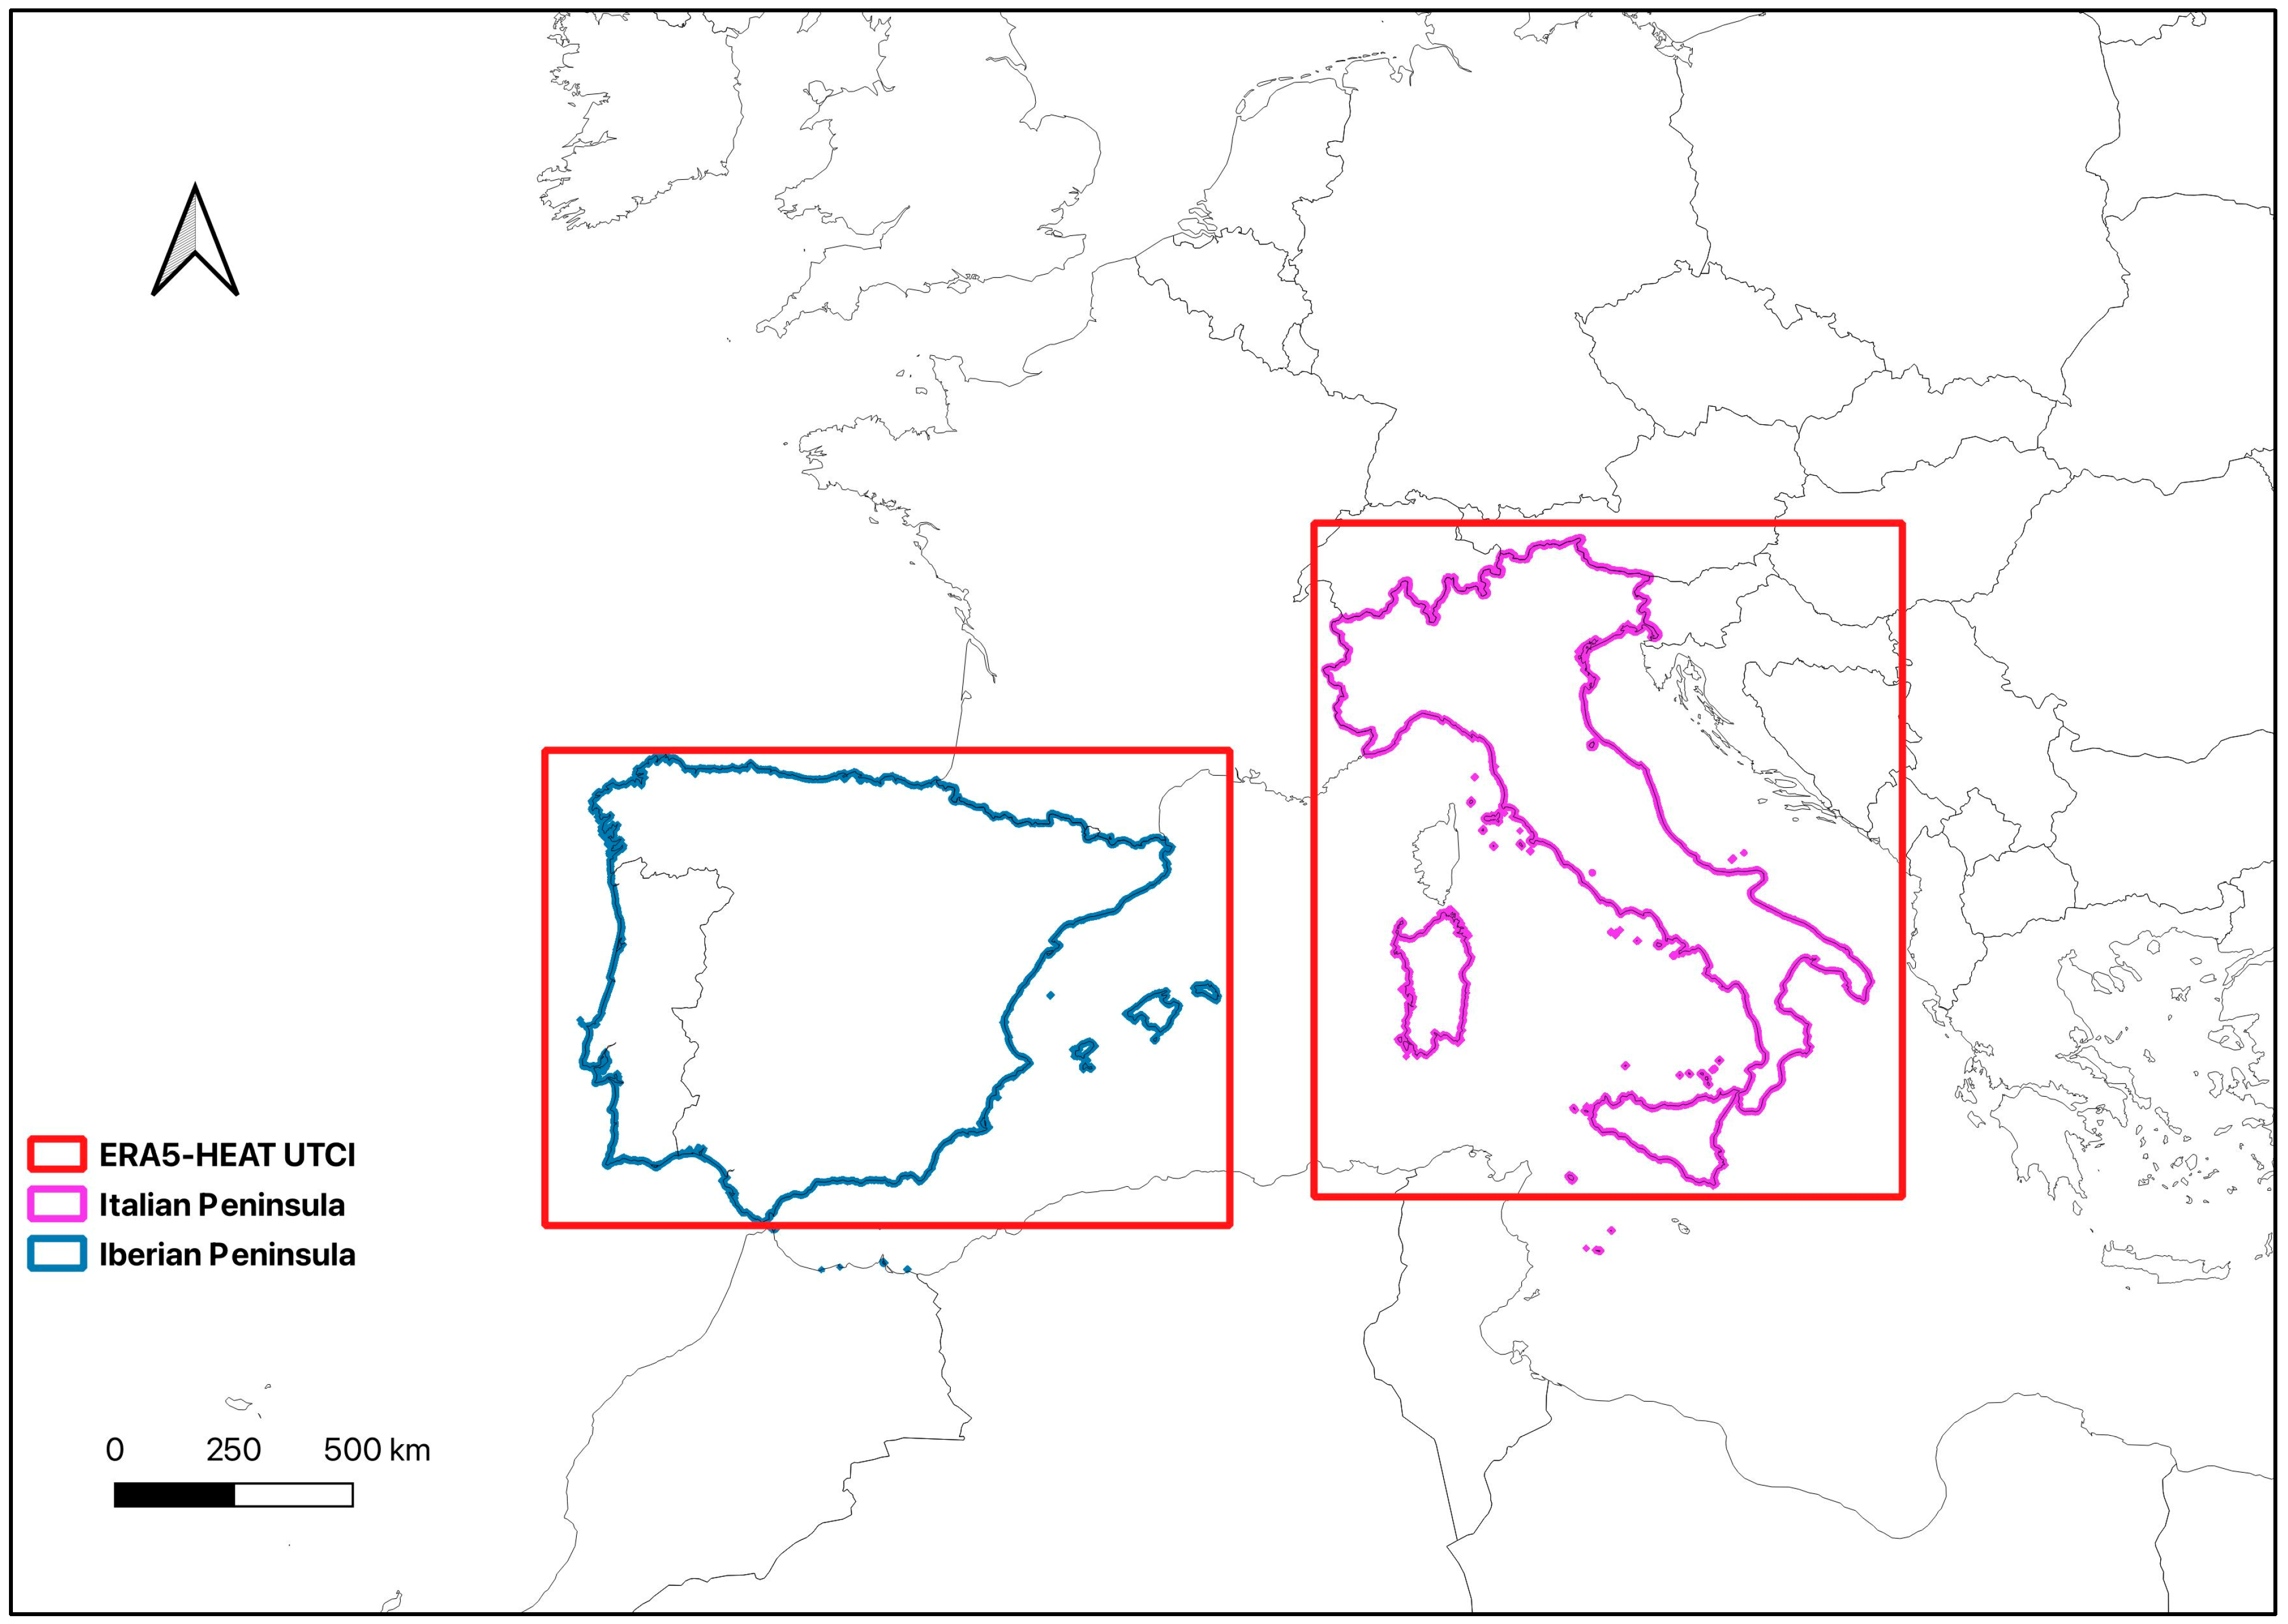
Figure 1. The red rectangles indicate the bounding box of the seasonal mean UTCI (ERA5-Heat data) raster stack time series layer spanning from 1940 to 2024. The borders of the two ROIs, the Italian and the Iberian peninsulas, are highlighted in magenta and blue, respectively. The figure was produced with QGIS software Version 3.34 [38].
Climate 13 00184 g001
Figure 2. Detection of thermal regime shifts in seasonal mean UTCI time series (1940–2024) over the Italian Peninsula. Panels indicate (a) summer (JJA), (b) winter (DJF), (c) spring (MAM), and (d) autumn (SON) time series. Red lines represent linear trends or segmented regressions, and vertical dashed blue lines indicate the detected breakpoints.
Climate 13 00184 g002
Figure 3. Detection of thermal regime shifts in seasonal mean UTCI time series (1940–2024) over the Iberian Peninsula. Panels indicate (a) summer (JJA), (b) winter (DJF), (c) spring (MAM), and (d) autumn (SON) time series. Red lines represent linear trends or segmented regressions, and vertical dashed blue lines indicate the detected breakpoints.
Climate 13 00184 g003
Figure 4. Pixel-wise Sen’s slope estimates of UTCI trends over the Italian Peninsula for 1940–2024 for (a) summer (JJA), (b) winter (DJF), (c) spring (MAM), and (d) autumn (SON). Colors represent the magnitude of the trend in °C per year, with warmer colors (yellow to red) indicating stronger warming and cooler colors (blue to green) indicating weaker warming. Values are all positive, reflecting increasing thermal stress over the period.
Climate 13 00184 g004
Figure 5. Spatial distribution of Sen’s slope trends in UTCI over the Iberian Peninsula for the period 1940–2023 for (a) summer (JJA), (b) winter (DJF), (c) spring (MAM), and (d) autumn (SON). Colors represent the magnitude of the trend in °C per year, with warmer colors (yellow to red) indicating stronger warming and cooler colors (blue to green) indicating weaker warming. Values are all positive, reflecting increasing thermal stress over the period.
Climate 13 00184 g005
Table 1. Classification of UTCI categories and corresponding temperature ranges (°C) used to assess human thermal stress levels. These thresholds are based on established biometeorological standards for evaluating outdoor thermal comfort and physiological impact.
UTCI CategoryUTCI Range (°C)
Extreme Cold Stress<−40 °C
Very Strong Cold Stress−40 °C to −27 °C
Strong Cold Stress−27 °C to −13 °C
Moderate Cold Stress−13 °C to 0 °C
Slight Cold Stress0 °C to 9 °C
No Thermal Stress9 °C to 26 °C
Moderate Heat Stress26 °C to 32 °C
Strong Heat Stress32 °C to 38 °C
Very Strong Heat Stress38 °C to 46 °C
Extreme Heat Stress>46 °C
Disclaimer/Publisher’s Note: The statements, opinions and data contained in all publications are solely those of the individual author(s) and contributor(s) and not of MDPI and/or the editor(s). MDPI and/or the editor(s) disclaim responsibility for any injury to people or property resulting from any ideas, methods, instructions or products referred to in the content.