Abstract
Internally displaced people (IDPs) are individuals forced to leave their homes due to conflicts or disasters without crossing international borders. Since 2008, weather-related extreme events—primarily storms and floods—have displaced more than 20 million people annually. With global temperatures rising and extreme weather intensifying, the number of IDPs is projected to increase in the coming decades. In the Philippines, resettlement has emerged as a key climate adaptation strategy, with IDP camps established to reduce risks in highly vulnerable areas. Yet, it remains unclear whether these camps are actually located in regions of lower climate vulnerability. This study aims to examine the climate vulnerability of 17 IDP camps by considering physical and infrastructural dimensions to assess whether they are located in safer areas, and to suggest the development of urban forms that can improve community resilience and the living conditions of their populations. Results show significant variation in climate vulnerability, with Villa Diana scoring the lowest and Villa Sofia the highest. Using emergency response facilities as a proxy for social capital, we identified drivers of vulnerability: Villa Sofia faces heightened risks due to population density, flood exposure, and limited emergency facilities, while Villa Diana benefits from greater emergency capacity and abundant vegetation that reduces risk. Our findings provide a systematic framework for assessing climate vulnerability among IDPs and highlight the critical role of social capital in mitigating climate impacts for displaced populations in the Global South, where climate risk mapping and reliable data remain limited.
1. Introduction
The Philippines is highly vulnerable to climate change. Many communities depend on coastal ecosystems for their livelihoods, and climate change affects fisheries, aquaculture, and related tourism [1]. Increasing temperatures combined with periods of heavy rainfall and drought will stress crop and fishery production. It is projected that increased typhoons will inflict further damage on crop stocks. Rising sea levels could contaminate freshwater ponds, lead to saltwater intrusion, inundate infrastructure, and affect aquaculture. Storms, sea level rise, and associated storm surges will affect most of the country’s population, as 60 percent of municipalities and 10 of the country’s largest cities are on the coast [2]. Due to this coastal concentration, a significant amount of infrastructure, livelihoods, and other assets are vulnerable to climate change [3].
The impact of climate change increases in severity in urban areas. The combination of urban design choices and increased global temperature variability creates a situation where local communities are facing surface temperatures beyond what the original urban network was designed to handle [4,5,6]. Urban heat island effect is the end result of the relationship between heat patterns becoming more extreme and urban design systems not calibrated to handle the associated temperatures [7,8,9]. There are clear and present issues with urban heat from satellite imagery in the Philippine cities, like Tacloban, with ground temperatures above 100 degrees Fahrenheit. That urban island effect could be the likely by-product of urban design choices rather than natural systems, representing a form of climate risk associated with rising temperatures [10,11,12].
Climate change has also intensified flood risk in the Philippines with frequent typhoons and storm surges [2,13]. Flooding is the most common natural hazard and the third most damaging globally after storms and earthquakes [14]. Climate change tends to worsen flood risk through more frequent heavy precipitation, increased catchment wetness, and sea level rise [15]. In this vein, there is an emerging perspective to understanding flood risk by combining traditional frameworks of predicting flood risks with local, catchment-specific characteristics, such as meteorology, topography, geology, and climate variabilities [16]. Mei and Xei reported that the intensity of typhoons making landfall in the Pacific has risen since 1970, a trend linked to increased sea surface temperatures [17]. The typhoons and other climate-related impacts in Tacloban were also evident [18,19].
Despite scholarly research on climate change and its impacts in the Philippines, urban heat and flooding at finer spatial scales—such as the city or community level—remain understudied. Communities in and around Tacloban, for instance, face limited access to spatial technologies and data systems that enable such analyses in more developed country contexts. As a result, seasonal conditions such as heavy summer rains or extreme heat often go undocumented by both academic researchers and professional practitioners. Against this backdrop, in this research, we aimed to understand climate vulnerability in Tacloban, more specifically, at the IDP (internally displaced people) camps. Due to climate-related disasters, IDPs have been forced to move to new regions in Tacloban, and 17 IDP camps are currently in Tacloban. Internally displaced people (IDPs) are individuals compelled to leave their homes due to conflicts or disasters without crossing international borders [20]. Since 2008, over 20 million people have been displaced annually by weather-related extreme events, primarily storms and floods. With rising global temperatures and increasingly severe extreme weather, IDPs are expected to grow in the coming decades [21,22]. In the Philippines, resettlement has become a more common adaptation strategy for climate adaptation, which resulted in the establishment of IDPs [23]. While these camps are intended to reduce exposure to climate risks in highly vulnerable areas, it remains unclear whether they are actually located in safer regions with lower climate impacts. This gap motivates our study, which investigates climate vulnerability in Tacloban’s IDP camps to assess their relative safety and explore strategies for improving community resilience and living conditions of people in IDP camps.
As to spatial analysis tools for flood risk, we relied on digital elevation models (DEM), Landsat 8 data, and Visible Infrared Imaging Radiometer Suite (VIIRS) data combined to create a view of the urban morphology around each IDP site, illustrating the relative flood risk, how many people are moving toward or away from that area, and what is the approximate emergency response infrastructure around each camp, as measured through a one and one-half mile buffer zone. The analysis of our research underscores the role of social capital that has been proxied via distances to municipal buildings for public services that have been used in climate hazards mitigation and adaptation when natural disasters occur.
2. Social Capital and Climate Vulnerability
Social capital plays a critical role in enhancing community resilience and increasing adaptation capacity to climate change. It refers to trust, relationship, reciprocity of ideas and knowledge, and networks within a community that would foster collective action for public goods such as natural resource management, climate adaptation, and disaster resilience [24,25,26,27]. In the context of climate adaptation, social capital intersects with climate resilience in three ways. First, communities with strong social capital are assumed to better organize collective efforts, such as disaster preparedness, resource sharing, and post-disaster recovery. For instance, during hurricanes or floods, neighbors often assist each other, reducing the need for external intervention [26,28]. Second, networks within a community facilitate the dissemination of critical information about risks, early warnings, and adaptation strategies. For example, a tight-knit community may share updates about evacuation plans or safe shelters more effectively [29]. Lastly, trust and social bonds can offer emotional and psychological support during and after climate-related events, helping individuals and families recover more quickly from mental stresses and emotional disturbances [24].
As the frontier research in social capital and climate adaptation, Adger proposed that social capital is not a single type but is varied in its forms, depending on the density and strength of social ties among actors [24]. Strong ties within a close-knit group, like family or close friends, lead to robust bonding social capital. The bonding social capital can provide local support, but it may limit the broader connections needed for external resources. Conversely, loose ties connecting different groups within a community create networking social capital, which can enhance access to diverse resources and perspectives during crises. These horizontal connections in social capital can be expanded when networks or social capital forms are linked with institutional structures such as governments or NGOs. As much of the disaster relief funds and institutional support create quicker, long-term support for communities with physical climate impacts, vertical connections between the community and institutions (e.g., governments or NGOs) become important [30,31]. The vertical linkages between state and society, with a “well-functioning” society, can secure funding, technical support, and policy assistance.
Prior studies in social capital have focused on high vulnerability in low social capital areas. Communities with weak social ties often struggle with organizing effective responses to climate events, making them more vulnerable. Also, as social capital may be unevenly distributed in marginalized groups (e.g., economically disadvantaged, minorities) having lower access, scholarly attention is given to the mitigating relationship between social capital that can exacerbate their climate vulnerability [32,33]. Urban and rural differences also matter to overcome disasters and buffer climate vulnerability [26,34]. Urban areas may have higher linking and bridging social capital due to institutional access, but may lack the strong bonding capital often found in rural settings.
To understand such relationships, scholars have taken the case study approach. Deressa et al. studied Ethiopian farmers’ vulnerability to climate change and underscored the role of informal networks for community resilience [35]. Bass and Ramasamy emphasized the importance of collective action and social cohesion in mitigating climate vulnerabilities through a community approach to climate change awareness and adaptation planning [36]. Building on those case study approaches, we proposed that if social capital were developed around resource-dependent IDPs, community resilience to climate impacts could be enhanced. Building on these insights, we argue that developing social capital among resource-dependent internally displaced persons (IDPs) could significantly enhance community resilience to climate impacts. Since social capital remains a vital yet underexplored resource in addressing climate vulnerability, it is essential to establish a robust and intuitive metric for assessing it, particularly in climate-vulnerable contexts such as IDP communities. In this vein, we operationalized social capital by employing proximity to community facilities that can serve as critical resources during climate-induced emergencies as a proxy variable [37], thereby offering a pathway to enhance community resilience and reduce climate vulnerability.
3. Methods
3.1. Study Sites: Haiyan Resettlement Sites in Tacloban North
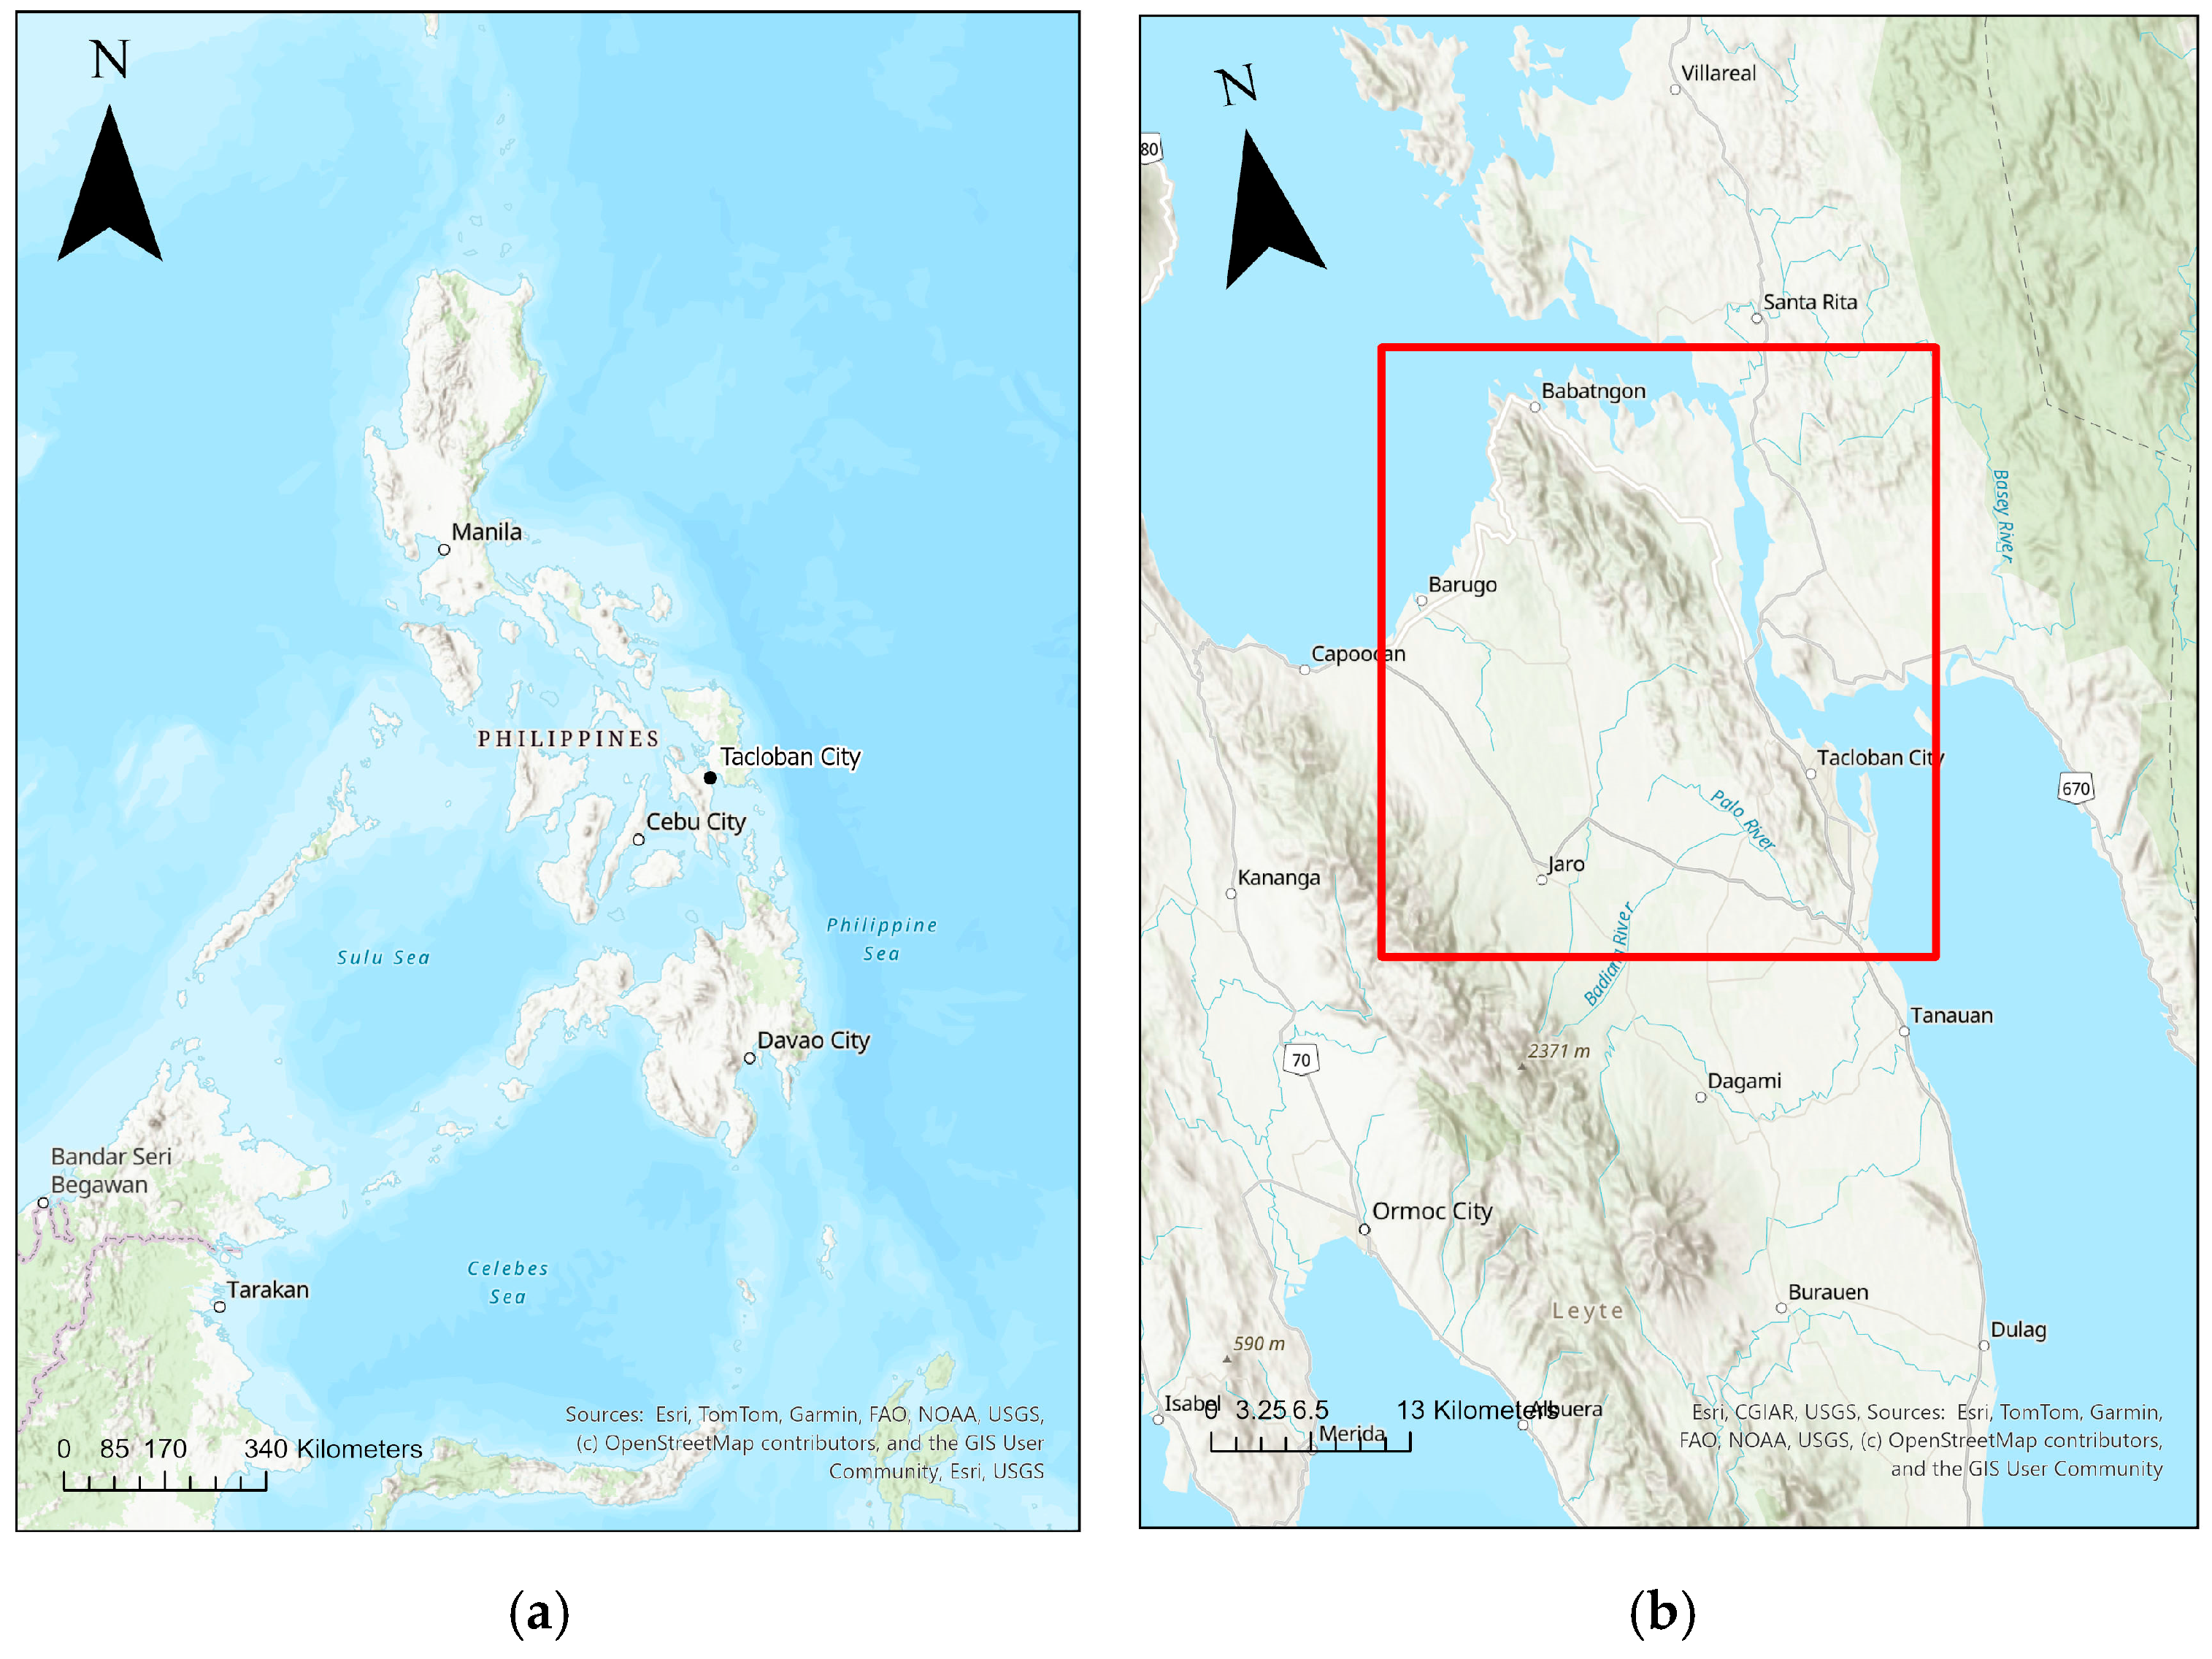
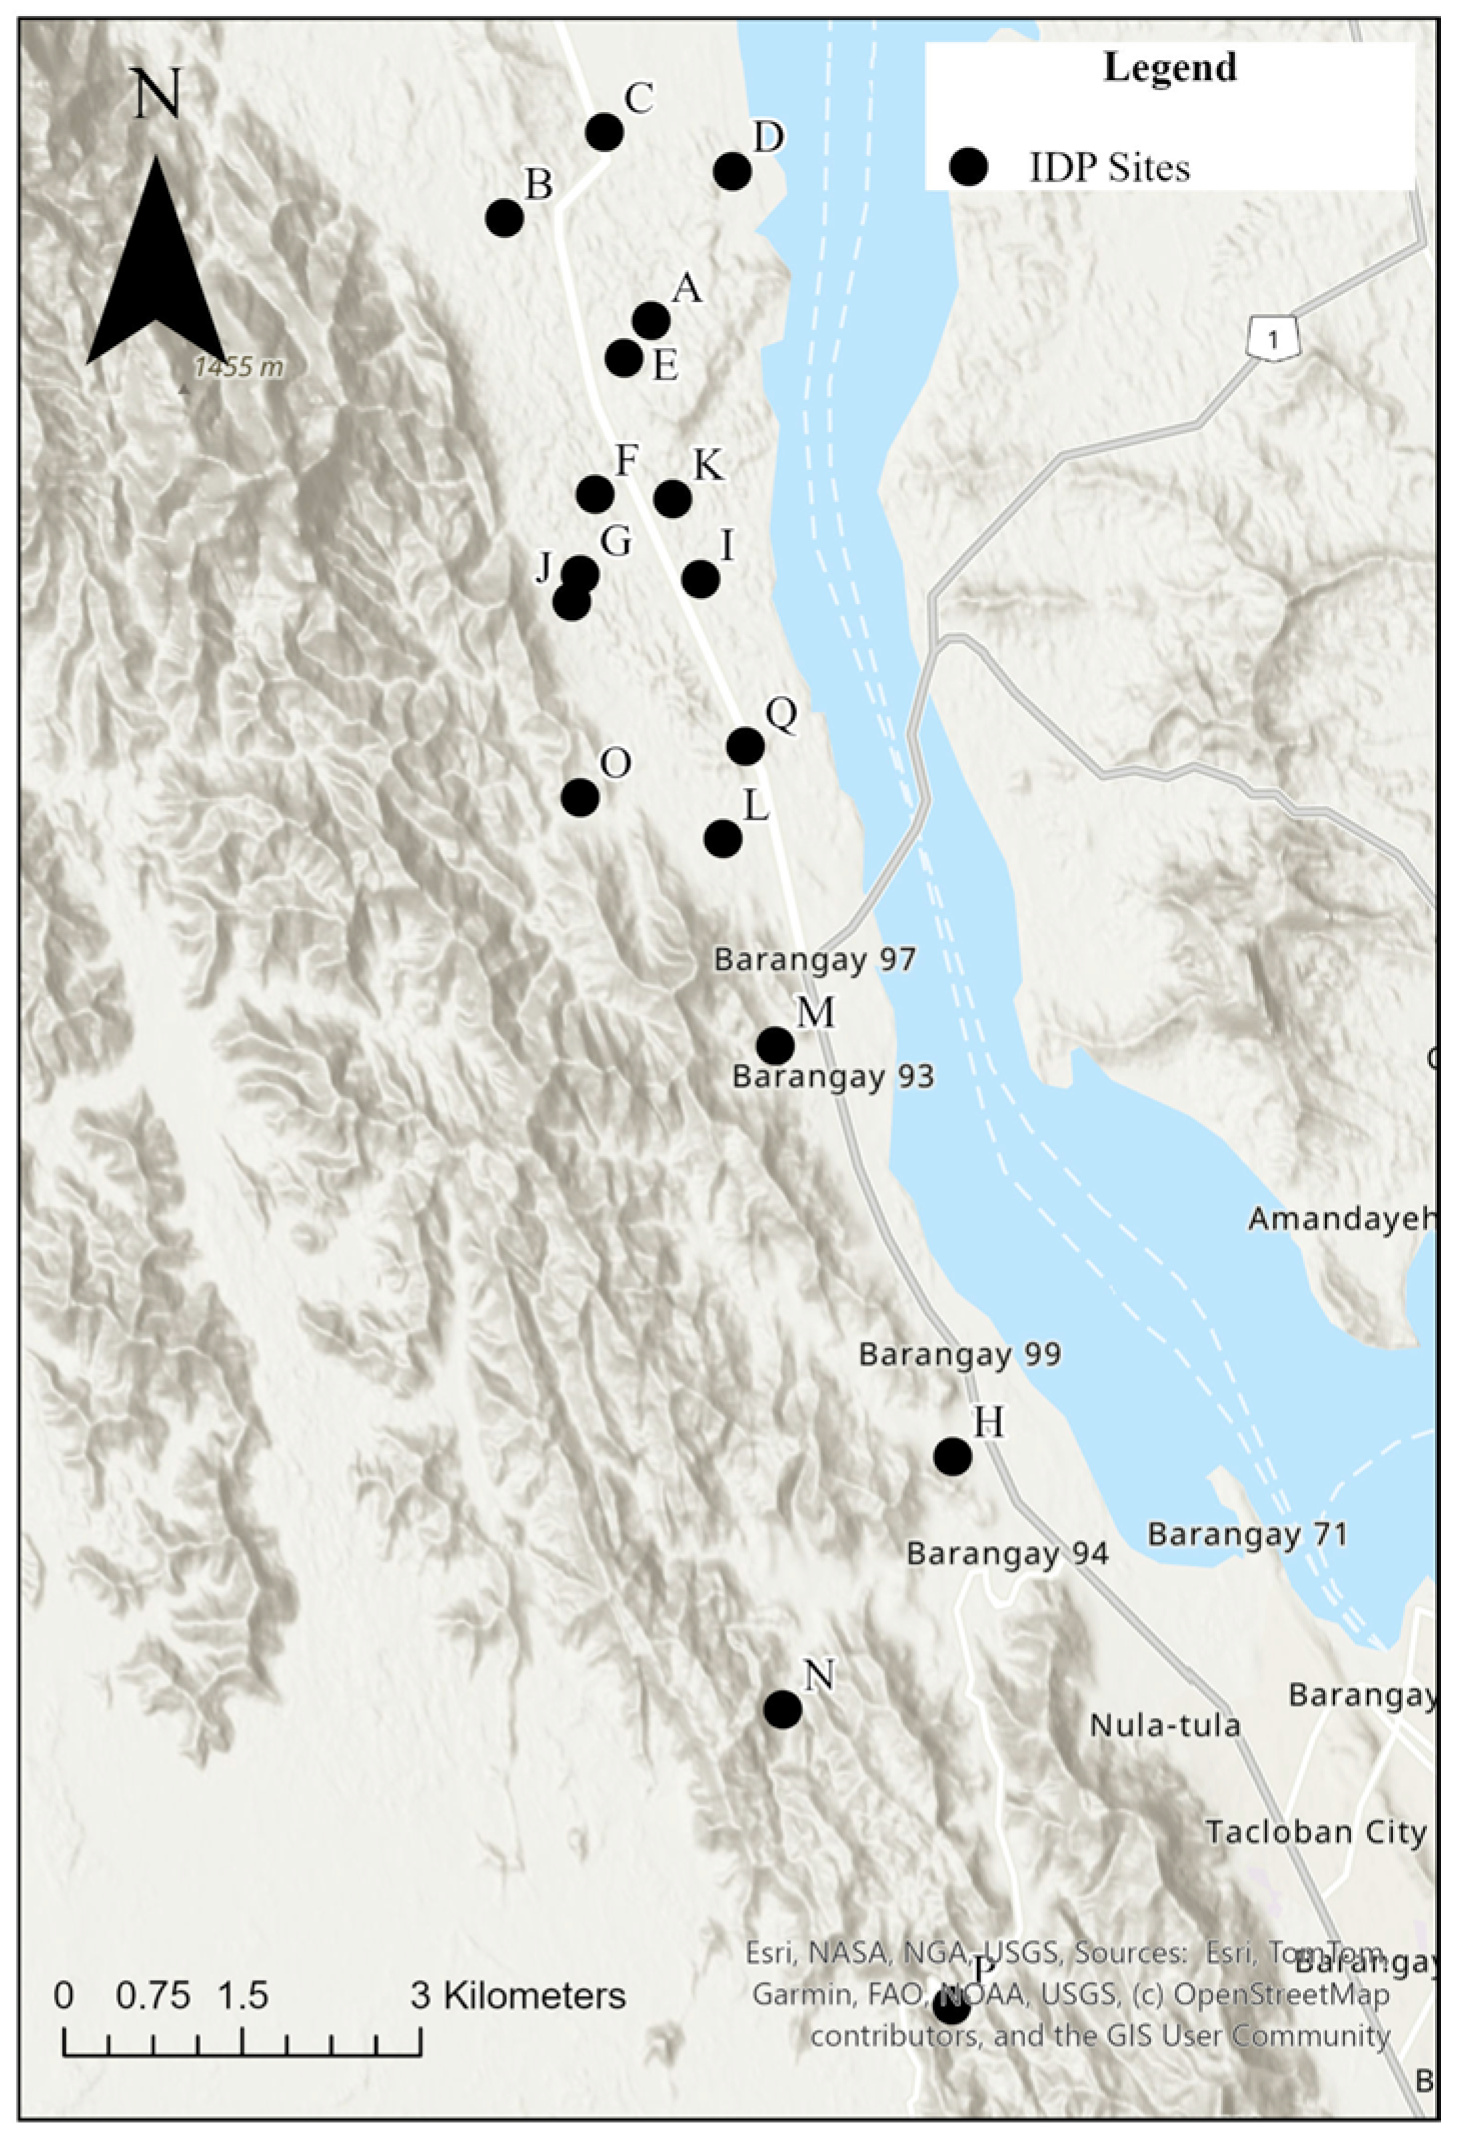
More than 15,000 households have been relocated to Tacloban North in the Philippines following the destruction caused by Typhoon Haiyan in November 2013. Tacloban North now contains at least 31 permanent Pabahay communities spread across eleven barangays. Data from the Tacloban City Housing and Community Development Office reveals that the National Housing Authority (NHA), a state-level government agency, has developed 17 of these Pabahay sites, which comprise a total of 14,479 housing units [38]. Figure 1 shows the maps of study area, Tacloban, Philippines. Figure 2 shows the spread of IDP camp sites, which have been clumped in the northern area of Tacloban, alongside the San Juanico Strait. Earlier studies have examined various aspects of the resettlement in Tacloban North, including the satisfaction [39,40] and resilience of residents [41], and the effects of COVID-19 on resettlement sites [38]. Table 1 presents the names of 17 IDP camps and the camps’ organizational sponsorship either via government or NGOs, including humanitarian organizations. 10 IDP camps were sponsored by governments, 6 IDP camps were sponsored by NGO, and 1IDP camp’s organizational governance has not been revealed.
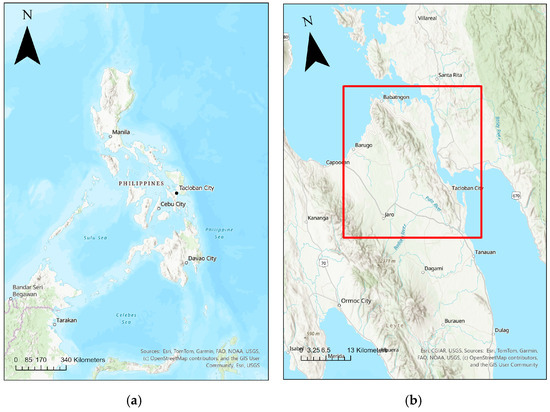
Figure 1.
(a) Tacloban, Philippines, which is located northeast of Cebu city (b) study area within Tacloban and the surrounding geography.
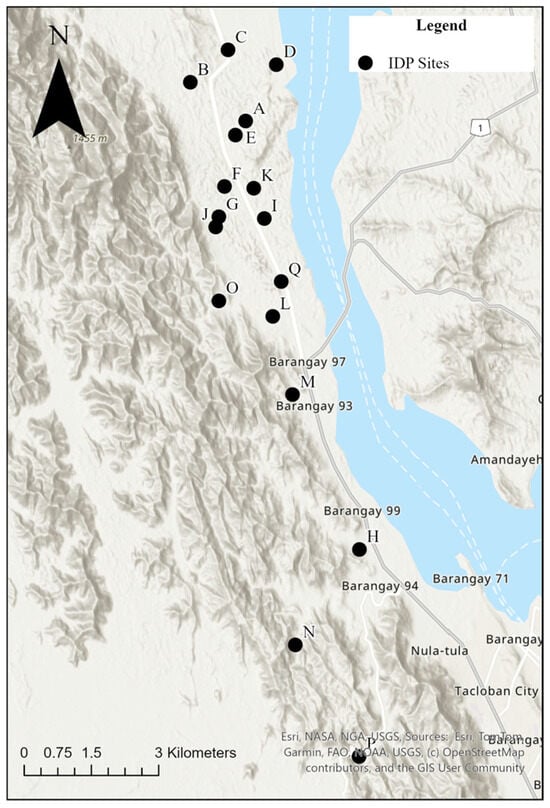
Figure 2.
IDP camp sites in Tacloban.

Table 1.
The Names and operation sponsorships of 17 IDP camps in Tacloban.
3.2. Measuring Urbanization in IDPs, Tacloban
Night-time light data is a well-established tool within remote sensing, and was used in this research to understand urban morphology. This data, obtained either through the DSMP-OLS or VIIRS night-time light data series, has been widely used in remote sensing research [42,43,44,45,46,47,48,49]. It has also been used in mapping internally displaced populations, particularly in response to natural disasters or conflicts [46,50,51]. The use of this data in our research allowed us to gain a comprehensive understanding of urban morphology and the flow of people in Tacloban over a decade.
The method for measuring the change in night-time urbanization is subtracting the pixel value between a more recent year and a past year. A net positive value at that point would show that people, GDP, and urban development flowed toward that pixel. A net negative value would show that people, GDP, and urban development flowed away from that pixel. A zero value would be that the net loss or gain of people is minimal. The method is crude because the pixel size for VIIRS systems is large, making national-level analysis more correct than state or sub-state-level analysis. However, the results can still be used to obtain a sense of the flow of people on the ground.
In this research, the flow of persons around Tacloban was measured through Visible Infrared Imaging Radiometer Suite (VIIRS) night-time light imagery data, which was collected from the Earth Observation Group at the University of Colorado [43,44,45,52,53]. We used the median value of a year’s stable night-time light value, taken each year from 2012 to 2021. Median night-time light values offer a stable digital number value over a year, which has not been influenced by outlier events such as fires. No adjustments were made to the data series to account for snow, petroleum manufacturing, or other events that could increase the reflectiveness of the ground.
3.3. Measuring Urban Heat Island (UHI) Effect
The urban heat island (UHI) effect is a by-product of urban design choices worsened by natural systems, being a form of climate risk associated with rising temperatures [10]. A countrywide study of surface air temperature trends found strong evidence of UHI effects in the Philippines, and this study extends that line of inquiry by examining the potential UHI effect in IDP camps in Tacloban [11,12].
The method for understanding urban heat islands was a standard approach using Band 10 in the Landsat system, which has been known to be useful for thermal mapping and estimating soil moisture [54]. In this study, the land surface temperature was used as a proxy to understand the air temperature at a certain space, noting that the land surface temperature contributes to the air temperature, but the relationship is not linear. At this stage, the land surface temperature was converted to a Z-score to allow each pixel to be compared to the entire geography of each city. The standardized Z-score helps understand how much warmer a point is when compared to the rest of the points within that geography, to argue that people at that point would claim the warmer and highly uncomfortable temperature in their communities. Also, it can be used to claim that urban design choices are made at that point that concentrate heat more than choices made, consciously or unconsciously, at other points.
3.4. Measuring Flood Risks in Tacloban
Our approach to understanding flood risk in IDP camp sites is unique. It was structured into three distinct protocols. The first protocol examined the shift in urban morphology around the cities, utilizing VIIRS night-time light imagery. The second protocol employed a multicriteria flood risk protocol to map the flood-prone areas using Landsat data. Lastly, the third protocol conducted a near analysis to measure the distance between the center point of IDP locations and municipal infrastructure, thereby assessing the accessibility of emergency response facilities during a flood.
Multicriteria flood risk mapping is, like night-time light data, a well-established remote sensing protocol for understanding a community’s topographical constraints [55,56,57,58,59]. Landsat data for multicriteria flood risk mapping, perhaps not the most current satellite system, is also standard [60,61,62,63]. In this instance, the Landsat system has such a historical precedent within the field of remote sensing, and it was seen as an advantage over newer systems because of geographical constraints preventing ground truthing in some of the areas.
Our methodology considered slope, elevation, healthy green vegetation, topographic wetness index (TWI), proximity to impervious surfacing, and proximity to flowing water to determine the area that would be most likely to flood. Each spatial output was measured on a one-to-five scale, combined to form an aggregate value, and then compared to the urban morphology defined by VIIRS and the locations of IDP sites.
The third protocol used the latitude and longitude of IDP cities and emergency response facilities to determine which cities had the best access to emergency response. The cities near emergency response buildings are the best, with a high concentration of different emergency response buildings. The method used for this study is referred to as a near analysis. Near analysis is a standard mapping process that has been carried out globally for different emergency response systems at various scales [64,65,66,67]. Within the Philippines, GIS has been used to map disaster responses in the context of flooding and distance to emergency response [68,69,70,71]. Table 2 describes factors used for flood risk assessment.

Table 2.
Description of categories used for flood risk assessment.
Table 3 presents the categorized risk levels and their characteristics in terms of vegetation and topographical features of IDP camps.

Table 3.
Total Score of Vulnerability (TSV) to flood risk, and the geological and topographical characteristics of five levels of flood risk.
The Total Score of Vulnerability (TSV) to flood risk was computed to measure IDP camp vulnerability. The score takes into consideration the flood risk of the topology, the urban development of the topology, and a number of emergency response facilities within a 1.5-mile buffer of the site location. The goal was to rank on a scale of 1 to 5, for each site, the comparative safety of the location and provide an explanation for why that site may be at risk. For instance, a site may have had a high number of emergency response facilities within a 1.5-mile buffer. However, if the population in that space increased, the amount of vegetation decreased, or the amount of impervious surfacing increased, the risk factor for that site would then go up, even if the number of emergency response facilities within the presented geography remained high.
The formula for the procedure to compute TSV is as follows:
- Reclassified Elevation: RElevation
- Reclassified Sloe: RSlope
- Reclassified NDVI: RNDVI
- Reclassified NDUI: RNDUI
- Reclassified TWI: RTWI
where elevation, slope, NDVI, NDUI, and TWI were reclassified on a scale of 1 to 5 using a Jenkins distribution to draw attention to outliers. Elevation was collected through Landsat’s DEM model. The lowest elevation was given a value of ‘5’, followed by ‘4’, ‘3’, ‘2’, and ‘1’, depending on where the value stood in the distribution. Slope was collected through Landsat’s DEM model. The slope that was the shallowest value was given ‘5’, followed by ‘4’, ‘3’, ‘2’, and ‘1’, depending on where the value stood in the distribution.
NDVI was calculated as follows:
The areas with values less than 0 are water, not landforms. The values between 0 and 0.15 are urban or bare ground. Moreover, 0.15 to 0.30 are shrubland or suburban systems, and 0.30 to 0.60 are forested spaces. This study was looking for spaces prone to flooding, and we grouped the NDVI values using a 1–5 scale. 0 to 0.15 was thought of as ‘1’, 0.15 to 0.30 was ‘2’, 0.30 to 0.60 was ‘3’, 0.60 to 1 was ‘4’, and everything less than 0 was given the value of ‘5’ because that score stands for a body of water.
NDUI was calculated as follows:
Values less than 0 were considered not landforms, which could be a mix of water and land or water. The range of values was divided into five sections using a Jenkins distribution, where higher values were more urbanized and lower values were less urbanized. Higher values were seen as having a higher flood risk, so ‘5’ represented values greater than 0.8, ‘4’ represented values between 0.8 and 0.6, ‘3’ represented values between 0.6 and 0.4, ‘2’ represented values between 0.4 and 0.2, and ‘1’ represented values between 0.2 and 0.0. Areas where pixel-level bleed over accrued ‘1’ of NDUI, and the value was translated into ‘5’ as of flood risk, as can be illustrated in three sites having NDUI values above ‘1’, Villa Diana, Saint Francis Village, and GMA Kapuso Village (Table 4).

Table 4.
Variances of flood risk-based climate vulnerability in IDP camps, Tacloban.
The topographic wetness index (TWI) was calculated using the digital elevation model using the following formula:
Reclassified through the Jenkins distribution to reflect that the lowest values are ‘1’ and the highest values are ‘5’.
After finding the flood risk and mapping the locations of emergency response facilities, the Total Score of Vulnerability (TSV) to flood risk was calculated taking into consideration the flood risk, the number of emergency facilities within the1.5-mile radius of the IDP camp, the average NDVI value within the 1.5-mile radius of that IDP site, average NDUI within the 1.5-mile radius of the IDP site.
4. Results
4.1. Changes in Urban Morphology
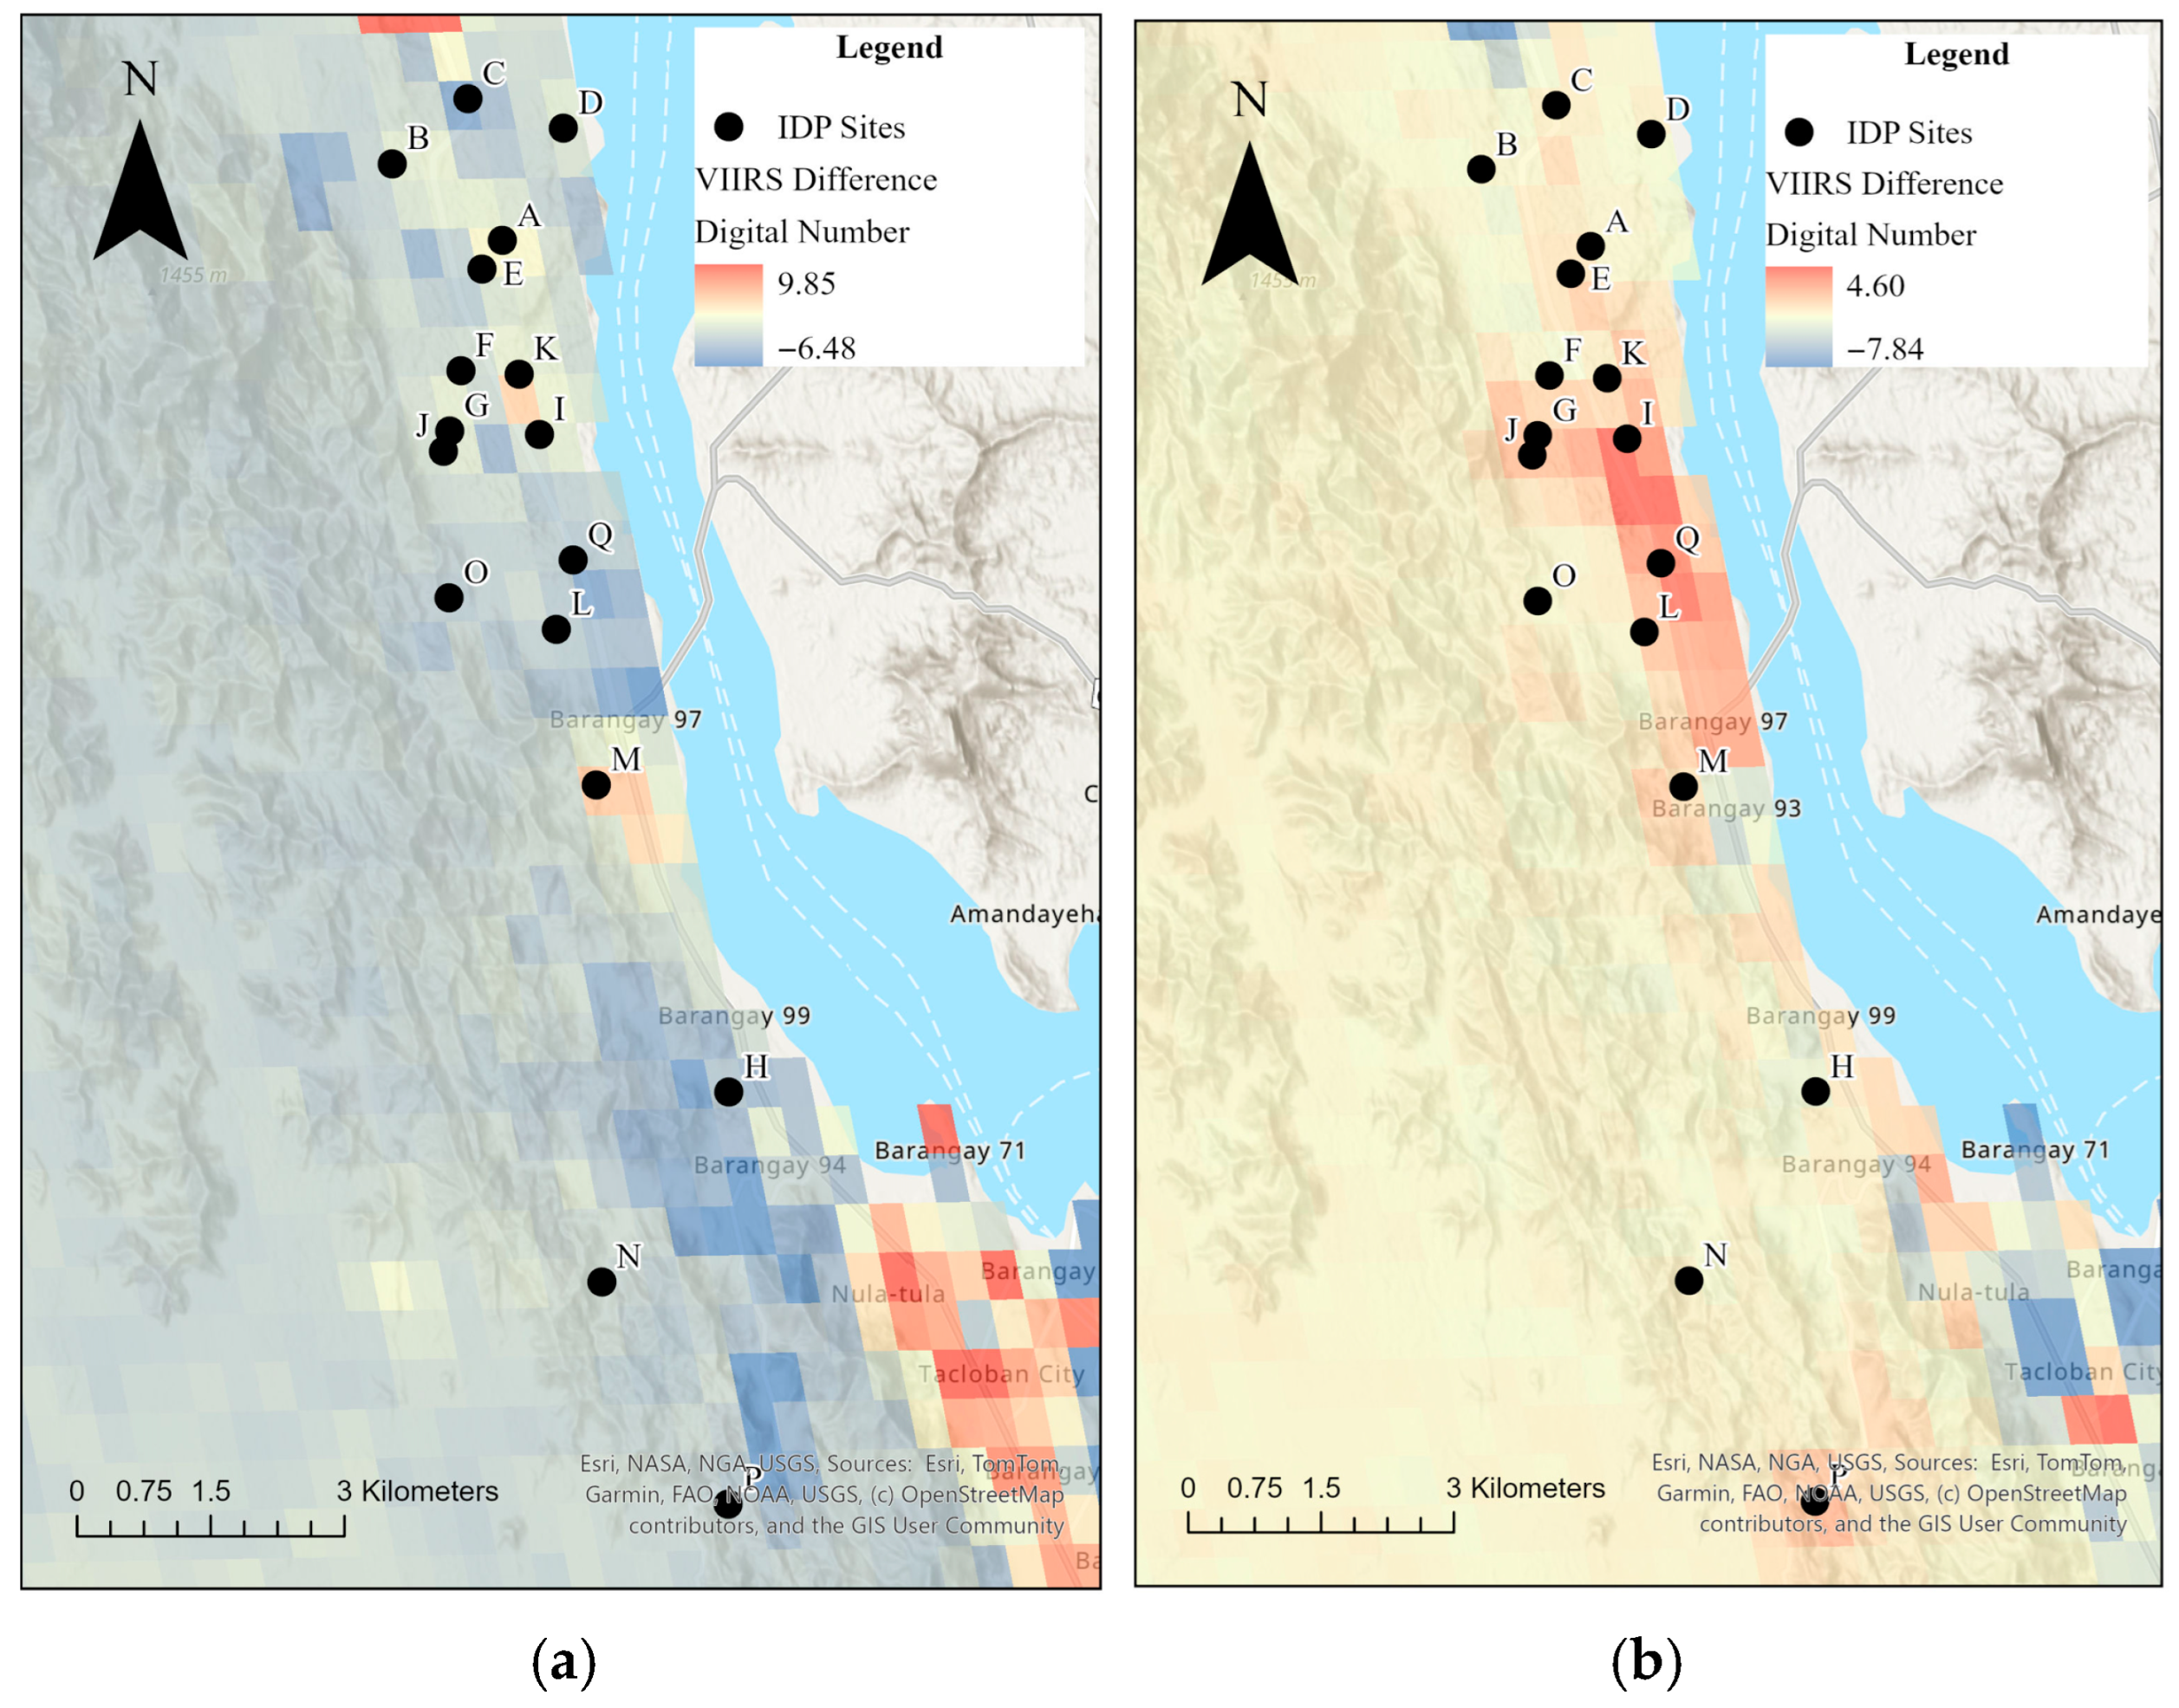
IDP camp sites that were in places with net positive values were colored yellow, orange, and red in Figure 3, suggesting that the urban morphology in terms of people, GDP, and urban development is flowing toward a point around the IDP site. Light green and blue colors around the IDP site suggest urban morphology following away from the sites and were found in very narrow regions. Figure 3a displays VIIRS between 2012 and 2016, and we found a slight population increase in IDP sites K, I, and M, as evidenced by the area of orange colors (VIIRS 0.7–3.11). Figure 3b presents VIIRS between 2017 and 2021, and we found that eight IDPs (A, F, G, H, L, O, P, and Q) were added to the group of positive increases in the VIIRS difference. In particular, three IDP sites, I, L, and Q, had the most intense urbanization progress during 2017–2021.
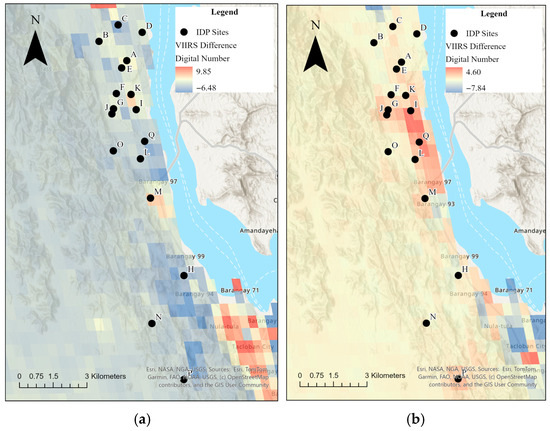
Figure 3.
(a) VIIRS change from 2012 to 2016, and (b) VIIRS change from 2017 to 2021 in Tacloban.
4.2. Urban Heat Island Effect in Tacloban
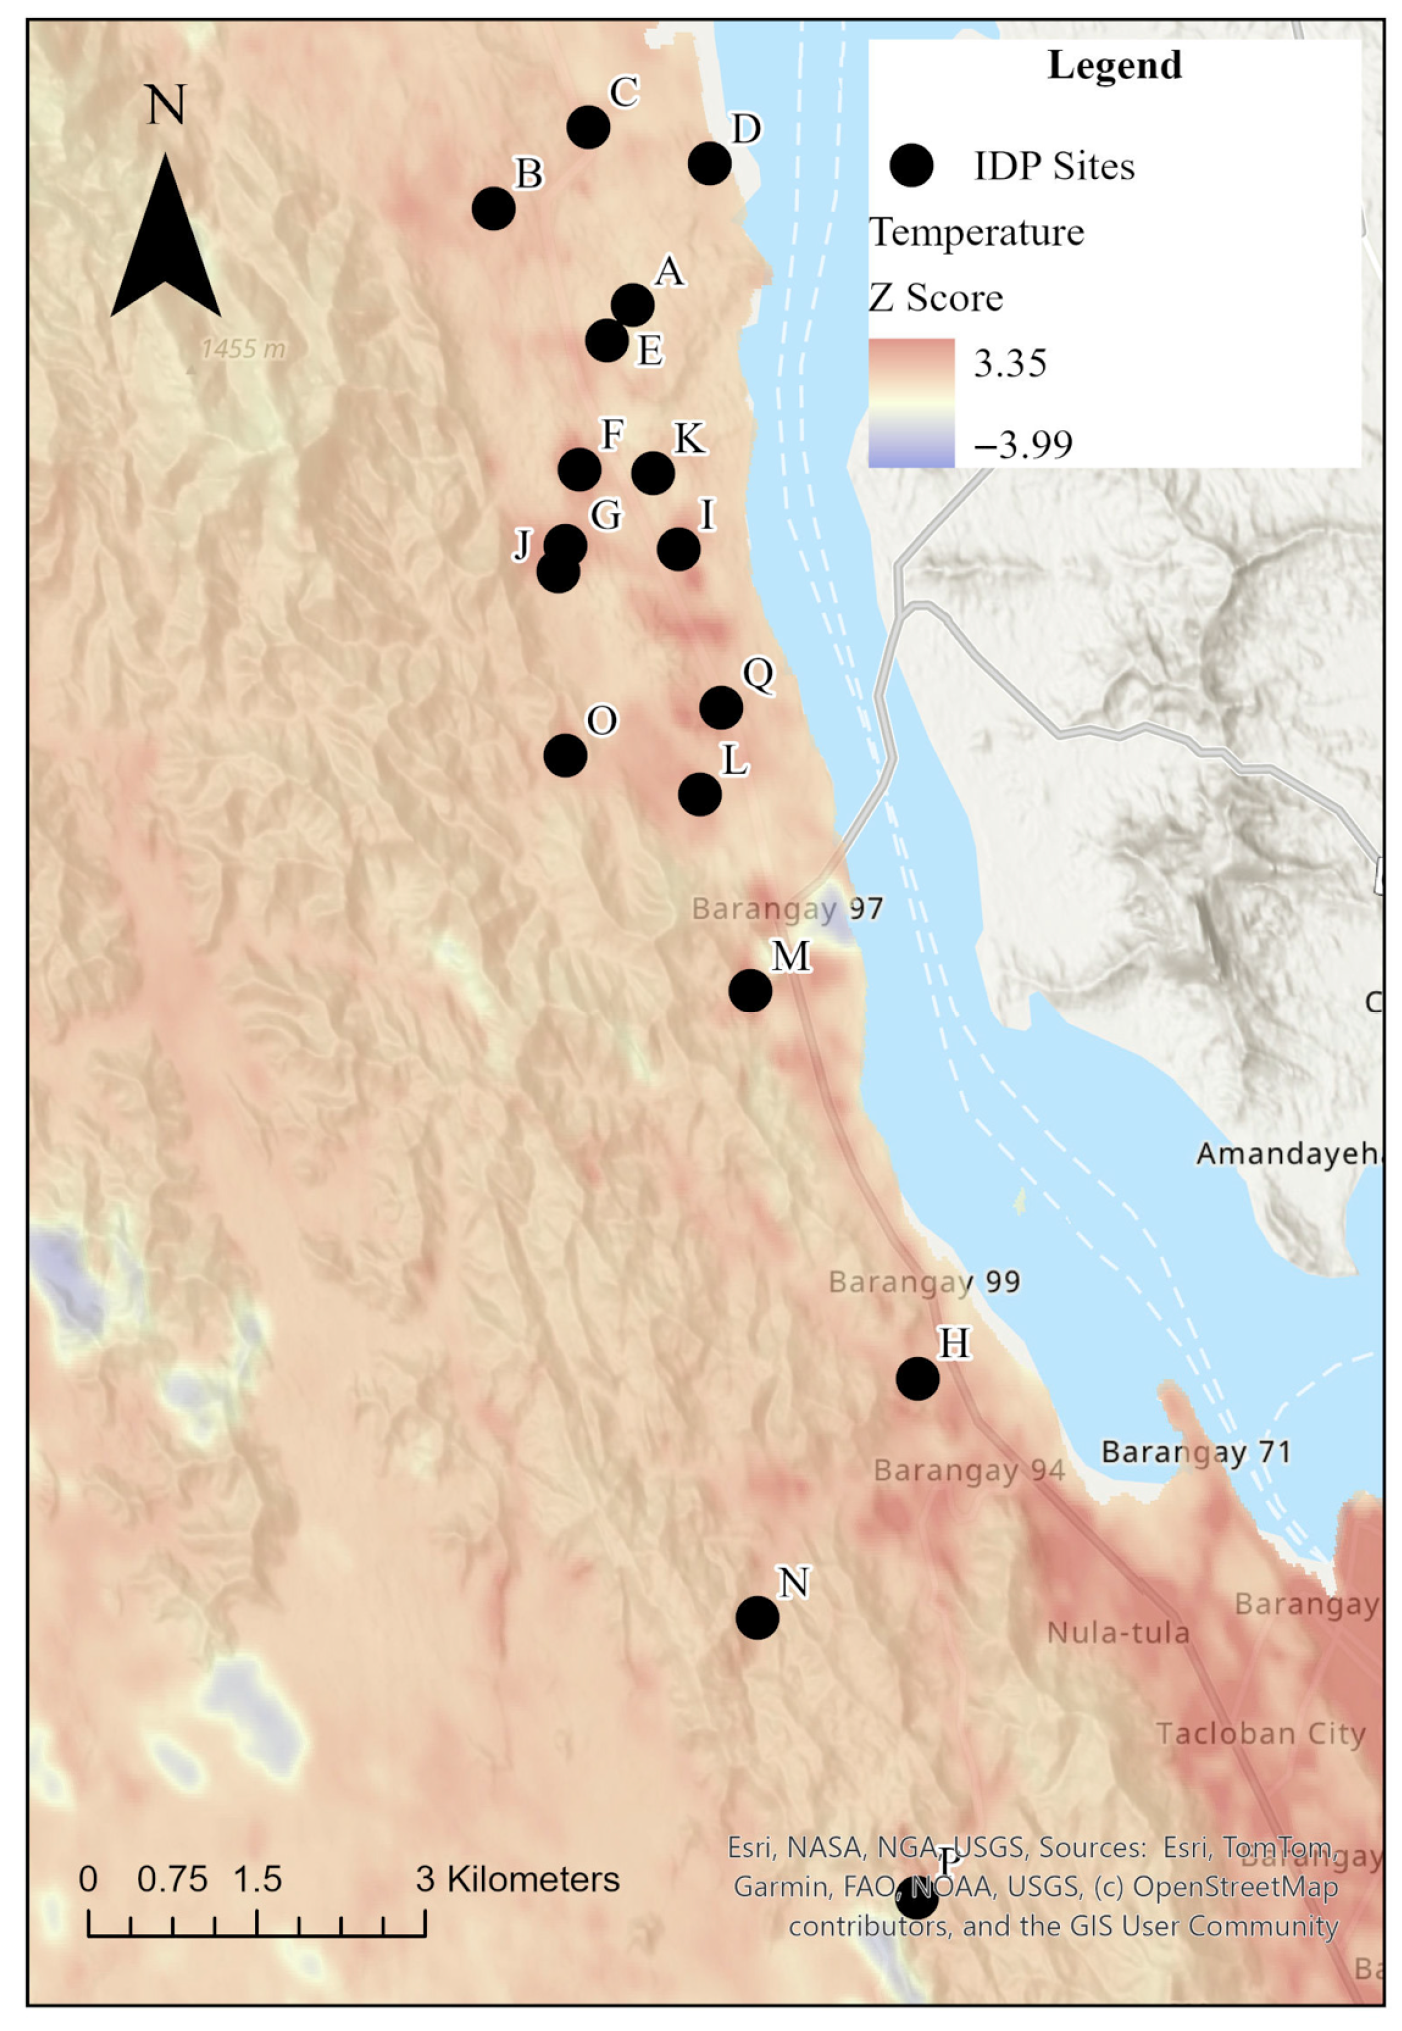
Figure 4 presents the map of Z-scores in IDP camps. The areas colored yellow, orange, and red show Z-scores around or above 0, indicating that the urban heat island effect is observed in those areas. We find that IDP camps in Tacloban are uniformly located at the center of, or near, these urban heat islands, illustrating the need for a change in the urban design of either the camps themselves or the surrounding community to reduce heat exposure.
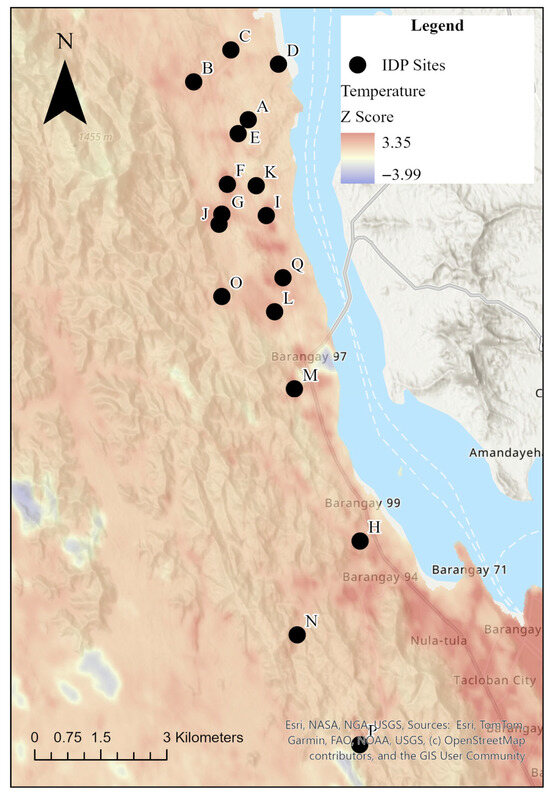
Figure 4.
Urban heat island effect in Tacloban. Note: The image was captured on 14 March 2024.
VIIRS data collected in Tacloban indicated a steady northern migration of people from the node of Tacloban north, indicating suburban growth. Google Earth confirms a multinuclear suburban network forming along a single road when observed on 25 September 2024. Band 10 of the Landsat satellite system shows an urban heat system forming in the spaces that correlate with the suburban network and the VIIRS data. Taken together, the three systems illustrate that between 2012 and current, there was an increased urban density or construction tied to urban heat increase.
4.3. Flood Risk in Tacloban
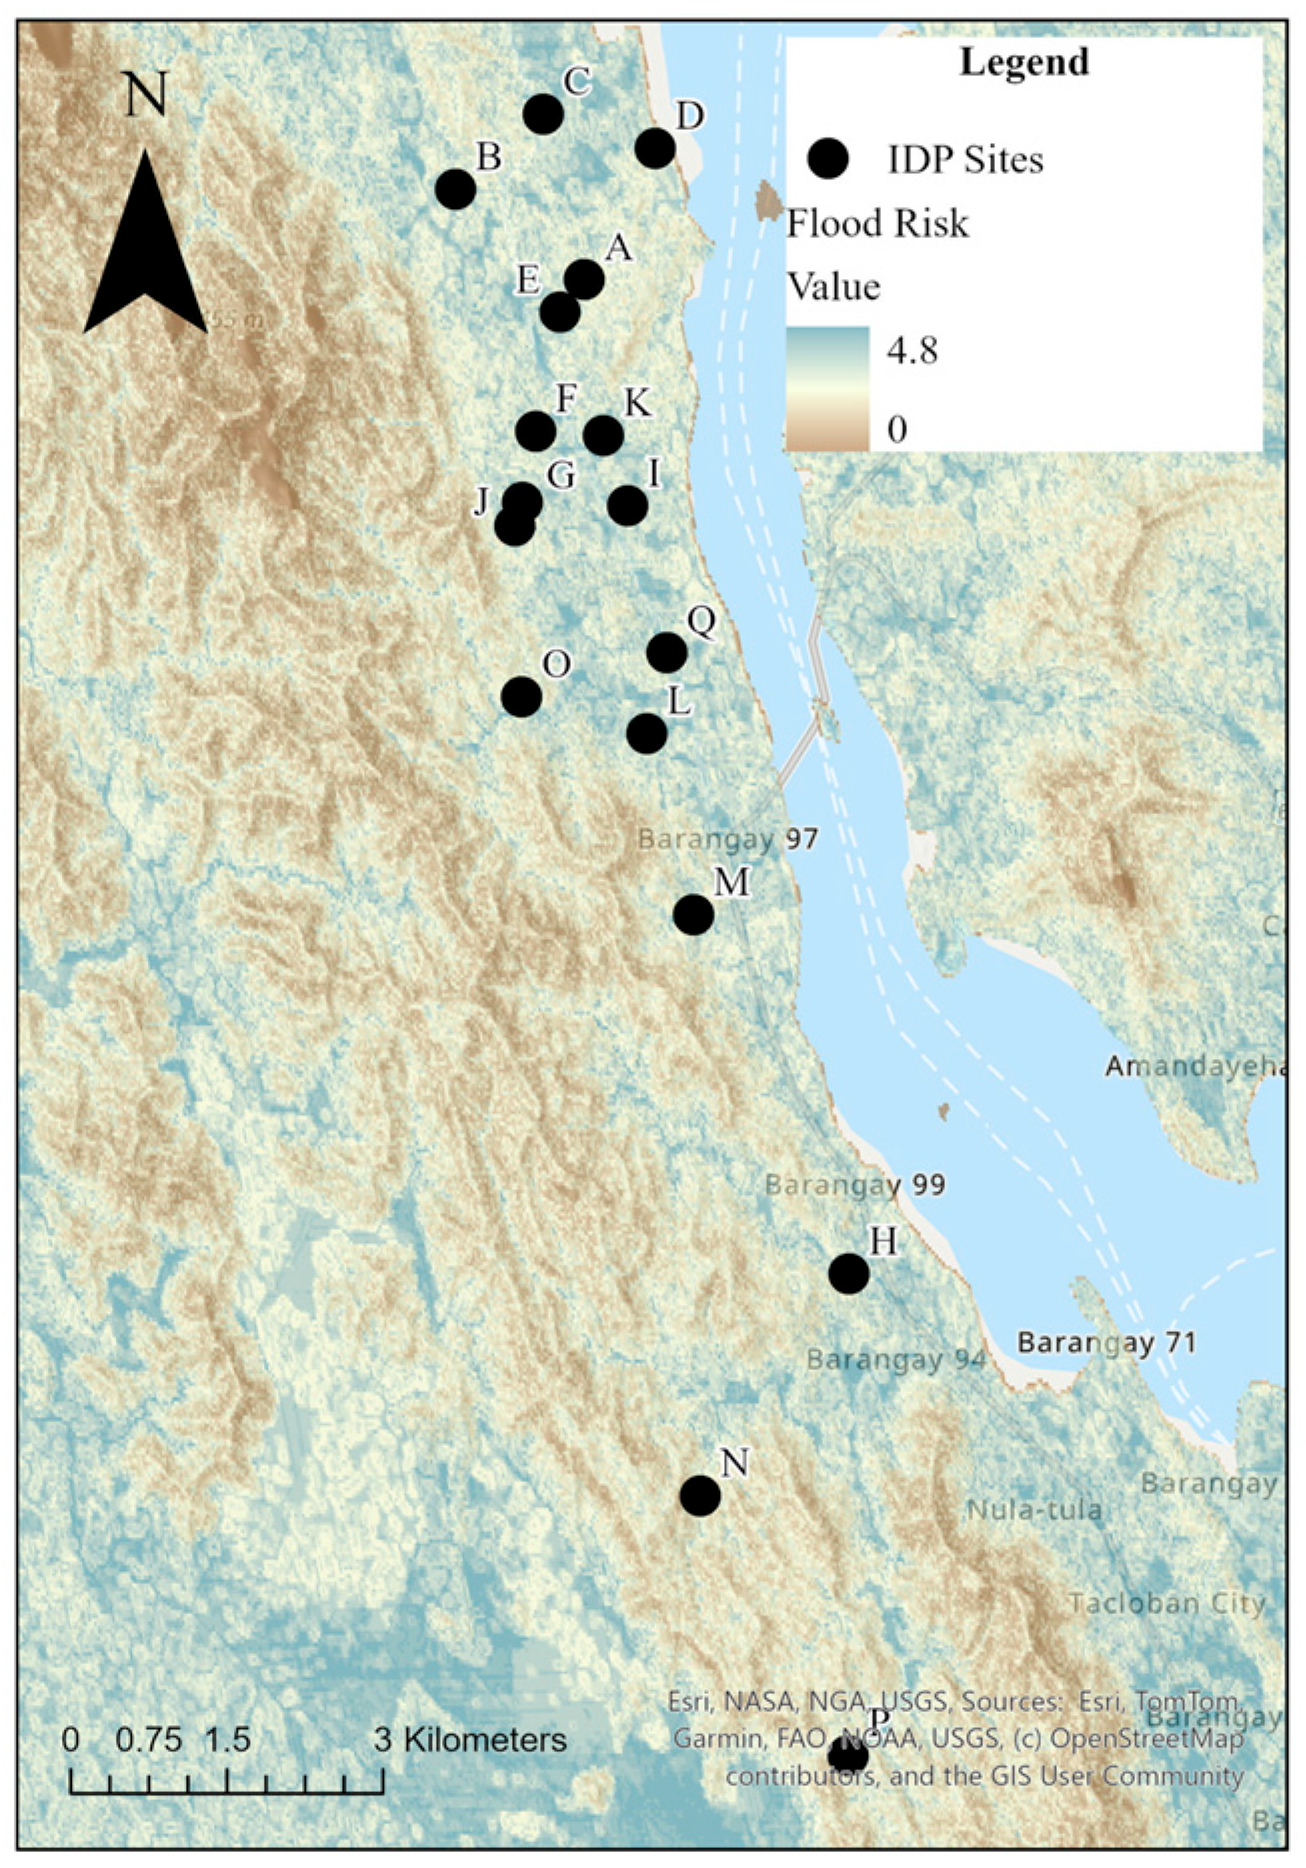
Flooding is simultaneously an extreme and a non-extreme singular weather event, depending on the regional geography. We attempt to use flood risk based on various types of flooding, and note that the event itself can be dangerous, as well as the by-product of flooding, which could oftentimes be more dangerous. Flood risk is defined as flooding from a higher extreme to a lower extreme via the volume and speed of water flow [72]. On the map in Figure 5, the area colored “blue” is considered low risk of flooding, while the area colored “red” is considered a high flood risk. The area of low flood risk was small and clumped near Mount Naga-Naga to the west of the downtown, urban space of Tacloban. However, other areas in Tacloban are highly vulnerable to floods, and IDP camps found in this study are mainly north of Tacloban and west of Tacloban, while some sites are observed within the city of Tacloban itself.
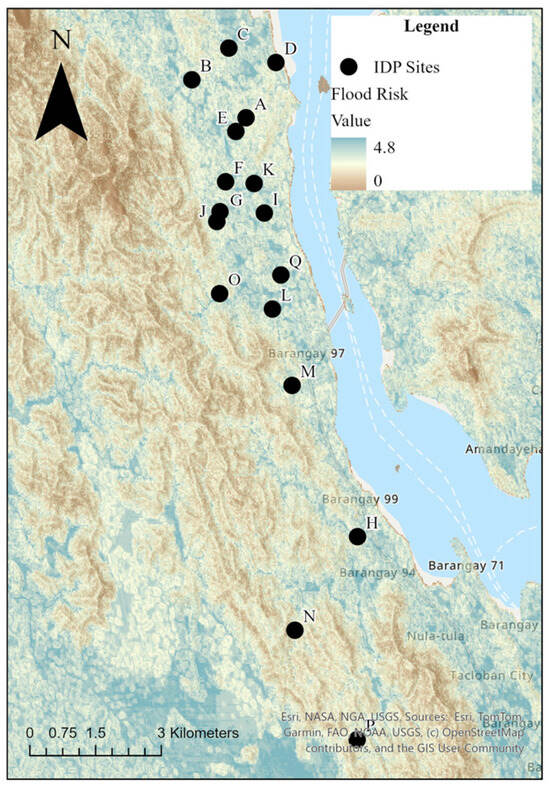
Figure 5.
Flood risk in urban Tacloban. Note: Data output for VIIRS, DEM data, and Landsat data was measured at 30 by 30-meter spatial resolution.
There was a pattern in that the IDP camps were observed at some distance from the concentration of emergency response facilities. Accordingly, if there were a flood in an IDP site, people in IDP camps would need to travel long distances, inducing an increase in cost while also delaying emergency response. The increased cost, as well as the decreased emergency response time, could have consequences for populations already experiencing displacement.
4.4. Total Score of Vulnerability (TSV) of IDP Camp
In Table 4, the number of emergency facilities in IDPs ranged from 1 to 15, with the highest shown in Saint Francis Village. Flood risks were re-coded from 1 to 5 of TSV, and we found a range of 1.75 to 4.5; 1.75 was the lowest risk level in Villa Diana, and 4.5 was the highest flood risk in Villa Sofia. The observed NDVI values in IDP camps indicated that most spaces within the Philippines have healthy vegetation, and the area around Villa Sofia (D in Table 4) and Lions Village (Q in Table 4) are the only spaces under the value of 0.30. The value range suggests a suburban landscape ranging from spaces more to less covered in impervious surfacing. A slight increase or decrease in the NDVI could indicate a change in land development status from a low-density suburban land to either mixed-use development or more mid-density development, where there are still suburban characteristics, but perhaps more apartment buildings or urban landforms emerge. We find other camp sites are more likely to indicate increases in land development and lost vegetation, in part due to urban morphology change.
Villa Sofia was shown to be a site with a high risk of vulnerability. Located in the very northern part of Tacloban, the site has few emergency response facilities within a 1.5-mile radius of the site. Additionally, the site has experienced an increase in population, as shown through the change in the VIIRS night-time light pixel value from 2003 and 2023. The flood risk of the location is not statistically different from other IDP sites, but the increase in population, plus the existence of some flood risk, and a few emergency response facilities, means that Vila Sofia is at a comparative disadvantage to the other IDP camps.
Villa Diana was shown to be a site with a low risk of vulnerability with 1.75 of TSV. Villa Diana shares some characteristics with Villa Sofia. The two characteristics that make Villa Diana safer than Villa Sofia are higher emergency response facilities and richer vegetation. So even as Villa Diana has more people flowing toward the site, more emergency response facilities around the camp, and more green space made people in the site less vulnerable.
This choice of method for vegetation and emergency response facilities illustrated an economic value-oriented approach to building within Tacloban, rather than thinking of the safety of the communities. As observed in Figure 5, large sections of Tacloban would be considered at a high risk of flooding because of elevation and slope. The relative safety of the community would then lie not in its slope or elevation, but rather in the design decisions of the community. For instance, choices to increase vegetation or decrease the amount of paved surfacing in risky spaces, zoning communities away from spaces that are at a lower elevation, or building more emergency response facilities in response to population trends could reduce vulnerability while increasing resilience and safety in IDP camps.
5. Discussion
According to the IPCC, over 20 million people have been displaced annually by weather-related extreme events since 2008, with storms and floods being the primary causes. IPCC also warns that rising global temperatures and related extreme weather events will result in even more displacement in the coming decades [21]. In the Philippines, resettlement is becoming a more frequent strategy for adapting to the impacts of climate change. For instance, adaptation efforts have included relocating households from vulnerable regions, such as in the Iloilo Flood Control Project, which relocated 3500 households [23]. While IDP camps were created to avoid the impacts of climate change in highly vulnerable regions, it is questionable whether IDP camp sites are in less vulnerable regions with modest climate impacts.
As such, this study intended to examine the climate vulnerability of 17 IDP camps by analyzing physical and infrastructural dimensions to assess whether the camps are located in safer areas and to suggest pathways for design interventions that could improve living conditions. We found that the IDP camps in and around the city of Tacloban showed no higher risk of flooding than the rest of the city. Within certain districts or sites, there is risk, as shown through the remote sensing approaches. However, statistical analysis was not able to determine any one location having a significantly higher risk than the rest of the region as it pertains to flooding. Our findings also demonstrate significant variation in vulnerability levels: Villa Diana emerged as the least vulnerable, while Villa Sofia was identified as the most at risk. By using emergency response facilities as a proxy for social capital, the analysis revealed that Villa Sofia’s heightened vulnerability stems from high population density, flood exposure, and limited emergency infrastructure. In contrast, Villa Diana benefits from stronger emergency capacity and abundant vegetation that mitigates risks. These findings provide a systematic framework for assessing climate vulnerability among IDPs and emphasize the importance of social capital in reducing climate-related risks, particularly in developing countries where reliable data and risk mapping remain scarce.
Our analysis also indicated that social capital among IDP camps has varied, implying uneven adaptation capacity. The measure of social capital that could mitigate flood risk was based on the number of emergency facilities located within a 1.5-mile radius of the IDP camp. Our findings indicate that five areas—Salvacion Heights, Villa Sofia, Operation Blessing, New Hope Village, and Sangway Village—have limited disaster relief systems, as fewer than five emergency facilities were identified in these regions. Specifically, Salvacion Heights is only near one facility capable of supporting the camp in reducing climate-related vulnerabilities, representing just 7% of the facility density found around Saint Francis Village. These findings highlight significant disparities in the distribution of emergency response facilities, which play a critical role in disaster response infrastructure and improving resilience.
Villa Sofia is a site that has a clear flood risk, found in the furthest section of the metropolitan suburban of Tacloban. The distance of the site to emergency facilities places the community that uses this site at risk. Both Pope Francis Village and Saint Francis Village, found in the central portion of the map, have clear heat issues associated with a lack of vegetation and urban development, as indicated by the value for the urban heat island, which was compared with the values of NDVI and NDUI. Although both facilities are found near emergency response facilities, the risk of flooding is present. The Z-scores of urban heat (in Figure 4) illustrate that there are site-specific design solutions that can improve heat at those locations, increasing resilience. Our research indicates that with clear signs of urban heat and flood risks, further research could be useful to offer more detailed information and specific recommendations for IDP camps. In addition to urban heat islands and flood risks, Tacloban is evolving shown through the VIIRS imagery. Furthermore, the city faces clear design challenges that are making the impacts of climate change worse, as demonstrated by the NDVI and the NDUI values of the city.
Lastly, our research affirms that social capital is an essential yet often overlooked resource in addressing climate vulnerability. By strengthening and utilizing social networks, communities can significantly improve their resilience to the impacts of climate change. Efforts to build social capital, such as fostering trust, enhancing collective action, and integrating marginalized groups, should be prioritized. Additionally, embedding social capital into climate adaptation and mitigation strategies, supported by robust measurement tools and an understanding of digital social networks’ potential, can further enhance resilience. Leveraging these social connections would offer a powerful way to reduce vulnerabilities and promote equitable and sustainable solutions to climate challenges, particularly in the socio-economically marginalized groups of the Global South, like IDPs.
There are several promising directions for future research. First, our approach can be replicated in contexts where access to reliable data and advanced technology is limited, making it especially useful for regions in the developing country context. Applying this framework to other displacement settings—both within the Philippines and beyond—would help test its adaptability and robustness across diverse socio-ecological environments. Second, future studies could incorporate longitudinal data to track how vulnerability levels shift over time as camps evolve, populations change, and climate impacts intensify. Such temporal analyses would provide insights into the effectiveness of resettlement strategies and inform adaptive planning. Third, future research should also integrate community-based methods to capture the lived experiences and adaptive capacities of displaced populations. Surveys can provide systematic data on household vulnerabilities, while resilience-focused focus groups and ethnographic approaches can uncover nuanced social dynamics, perceptions of risk, and strategies for coping with climate impacts. Combining these methods with geospatial and infrastructural assessments would create a more holistic picture of climate vulnerability.
The findings of this study suggest several important policy directions for improving the resilience of internally displaced people (IDP) camps. First, climate risk mapping should be integrated into resettlement planning to ensure that new IDP camps are established in areas with lower exposure to hazards such as flooding and storms. By institutionalizing vulnerability assessments prior to site selection, policymakers can reduce the likelihood that resettlement inadvertently places displaced populations back into harm’s way.
Second, strengthening social capital and emergency response capacity is critical. Investments in community facilities—such as health centers, emergency shelters, and local disaster response units—not only enhance immediate disaster preparedness but also foster long-term resilience by creating spaces for social interaction and mutual support. Nature-based solutions can further reduce risks [8,73]. Increasing vegetation cover, improving drainage, and restoring local ecosystems provide low-cost ways to mitigate flooding, heat stress, and other climate impacts, while generating co-benefits for health and well-being [9,73].
Equally important is the institutionalization of community participation in resettlement design and management. Engaging IDPs through surveys, focus groups, and participatory mapping ensures that infrastructure, services, and urban layouts reflect the lived realities of displaced populations. Such approaches not only improve the relevance of interventions but also build a sense of ownership that supports resilience [25]. Policymakers should also establish monitoring and evaluation systems that track multiple dimensions of camp well-being, including infrastructure quality, health outcomes, education, and livelihoods. These systems would enable adaptive management as conditions evolve.
Finally, IDP concerns must be mainstreamed into national climate adaptation and disaster risk reduction strategies. Too often, IDPs are treated as temporary exceptions rather than as communities requiring long-term planning and investment. By embedding IDPs into broader national frameworks for adaptation, urban planning, and risk reduction, governments and partners can ensure that displaced populations are not left behind in the face of escalating climate impacts.
In sum, our research offers critical insights into a methodological framework and systematic approach to analyzing climate vulnerability among IDPs. This research challenges the assumption that IDPs could be safe after they are relocated to resettlement areas, raising an urgent need to examine the criteria for determining IDP camp sites and develop a support system where IDPs could normalize their living conditions by overcoming multiple dimensions of climate disaster impacts. Future research could replicate our methodological approach to different IDP camp settings while refining social capital and other confounding factors related to climate vulnerability assessment.
6. Conclusions
The plight of internally displaced people (IDPs) in Tacloban illustrates the complex intersection of climate change, urban design, and infrastructure in the Global South. While displacement is frequently portrayed as a climate adaptive strategy, this study demonstrates that relocation alone does not necessarily translate into reduced exposure to climate hazards. Instead, Instead, the resilience and long-term safety of IDP communities depend on whether resettlement planning meaningfully incorporates considerations of the physical environment, infrastructural capacity, and, critically, the strength of social capital. Climate vulnerability must therefore be understood as a multidimensional condition shaped by governance, planning, and collective capacity, rather than as a narrow measure of hazard exposure. By examining the physical and infrastructural conditions of IDP camps, this study underscores the need for a paradigm shift in adaptation strategies for marginalized populations. Relocation to sites with lower vulnerability, complemented by mitigation measures such as green spaces, can reduce urban heat and flood risks while strengthening community resilience [9,73].
The methodological framework advanced here highlights the utility of combining geospatial data with socio-institutional indicators to generate more holistic assessments of climate vulnerability. Such integrative approaches not only offer analytical rigor but also practical value in settings where displacement is rising. Importantly, they can be replicated across other developing-country contexts, providing transferable insights for adaptation planning at both local and global scales. The Tacloban case further demonstrates the challenges of inadequate spatial technologies and limited data, which could constrain climate disaster management and urban planning, reinforcing the need for innovative methods tailored to data-scarce environments.
Ultimately, IDP camps must not be regarded as temporary solutions, but as evolving communities that require sustained investment, innovative design interventions, and systematic integration into broader national adaptation strategies. Acknowledging their permanence and embedding them within forward-looking climate governance frameworks is essential to prevent displaced populations from being further marginalized by the very adaptation measures intended to safeguard them.
Author Contributions
Y.K. contributed to conceptualization, methodology, validation, formal analysis, investigation, writing and review, supervision, project administration, and funding acquisition. C.C. contributed to methodology, software, formal analysis, data curation and processing, and writing and review of the manuscript. All authors have read and agreed to the published version of the manuscript.
Funding
This research was partially funded by the Korea International Cooperation Agency (KOICA) through the ODA (Official Development Assistance) Research and Academic Exchange Support Program (2003-005).
Acknowledgments
We would like to thank Colin McDonald and Gutavo Rodreguez (BS in Environmental Science and Policy of GMU) for their assistance with data collection and processing, as well as Minah Kang’s research team at Ewha Womans University for their field study that provided the ground truth required for this publication.
Conflicts of Interest
The authors declare no conflict of interest.
References
- United States Agency for International Development. Climate Vulnerability Profile: Philippines. 2024. Available online: https://www.preventionweb.net/media/102961/download?startDownload=20250909 (accessed on 3 April 2024).
- World Bank. Vulnerability, Risk Reduction, and Adaptation to Climate Change in Philippines. 2011. Available online: https://www.gfdrr.org/en/publication/climate-risk-and-adaptation-country-profile-philippines (accessed on 8 October 2024).
- Lloyd, S.; Gray, J.; Healey, S.; Opdyke, A. Social vulnerability to natural hazards in the Philippines. Int. J. Disaster Risk Reduct. 2022, 79, 103103. [Google Scholar] [CrossRef]
- Moonen, P.; Defraeye, T.; Dorer, V.; Blocken, B.; Carmeliet, J. Urban Physics: Effect of the Micro-Climate on Comfort, Health and Energy Demand. Front. Archit. Res. 2012, 1, 197–228. [Google Scholar] [CrossRef]
- Santamouris, M.; Kolokotsa, D. Passive Cooling Dissipation Techniques for Buildings and Other Structures: The State of the Art. Energy Build. 2013, 57, 74–94. [Google Scholar] [CrossRef]
- Toparlar, Y.; Blocken, B.; Maiheu, B.; van Heijst, G.J.F. A Review on the CFD Analysis of Urban Microclimate. Renew. Sustain. Energy Rev. 2017, 80, 1613–1640. [Google Scholar] [CrossRef]
- Huijgevoort, M.H.J.; van Cirkel, D.G.; Voeten, J.G.W.F. Climate adaptive solution for artificial turf in cities: Integrated rainwater storage and evaporative cooling. Front. Sustain. Cities 2024, 6, 1399858. [Google Scholar] [CrossRef]
- Braga, D.R.G.C.; Moreno, R.S. Prioritizing the implementation of walkable green spaces: An analysis under climate change in a global south megacity. In Sustainability in Natural Resources Management and Land Planning; Filho, W.L., Azeiteiro, U.M., Setti, A.F.F., Eds.; Springer International Publishing: Cham, Germany, 2021; pp. 343–356. [Google Scholar]
- Pizarro, R.E.; Blakely, E.; Dee, J. Urban planning and policy face climate change. Built Environ. 2006, 32, 400–412. [Google Scholar] [CrossRef]
- Estoque, R.C.; Ooba, M.; Seposo, X.T.; Togawa, T.; Hijioka, Y.; Takahashi, K.; Nakamura, S. Heat health risk assessment in Philippine cities using remotely sensed data and social-ecological indicators. Nat. Commun. 2020, 11, 1581. [Google Scholar] [CrossRef]
- Manalo, J.A.; Matsumoto, J.; Takahashi, H.G.; Villafuerte, M.Q., II; Olaguera, L.M.P.; Ren, G.; Cinco, T.A. The effect of urbanization on temperature indices in the Philippines. Int. J. Climatol. 2021, 42, 850–867. [Google Scholar] [CrossRef]
- Tatlonghari, R.J.A. Assessing Urban Heat Islands Using GIS and Remote Sensing for Sustainable Urban Planning in the Philippines. Int. J. Latest Technol. Eng. Manag. Appl. Sci. 2024, 13, 12. [Google Scholar] [CrossRef]
- Perez, R.T.; Amadore, L.A.; Feir, R.B. Climate Change Impacts and Responses in the Philippines Coastal Sector. Clim. Res. 1999, 12, 97–107. [Google Scholar] [CrossRef]
- Wilby, R.L.; Keenan, R. Adapting to flood risk under climate change. Prog. Phys. Geogr. Earth Environ. 2012, 36, 348–378. [Google Scholar] [CrossRef]
- Hirabayashi, Y.; Mahendran, R.; Koirala, S.; Konoshima, L.; Yamazaki, D.; Watanabe, S.; Kim, H.; Kanae, S. Global flood risk under climate change. Nat. Clim Change 2013, 3, 816–821. [Google Scholar] [CrossRef]
- Merz, B.; Aerts, J.; Arnbjerg-Nielsen, K.; Baldi, M.; Becker, A.; Bichet, A.; Blöschl, G.; Bouwer, L.M.; Brauer, A.; Cioffi, F.; et al. Floods and climate: Emerging perspectives for flood risk assessment and management. Nat. Hazards Earth Syst. Sci. 2014, 14, 1921–1942. [Google Scholar] [CrossRef]
- Mei, W.; Xie, S.P. Intensification of landfalling typhoons over the northwest Pacific since the last 1970s. Nat. Geosci. 2016, 9, 753–757. [Google Scholar] [CrossRef]
- Toda, L.; Orduna, J.R.; Lasco, R.; Santos, C.T. Assessing and mapping barangay level social vulnerability of Tacloban city and Ormoc city to climate-related hazards. Clim. Disasters Dev. 2015, 1, 25–40. [Google Scholar] [CrossRef]
- Tumamao-Guittap, G.; Castro, J.T.; Punay, K.N.G. Exposure analysis of Tacloban city’s humanitarian supply chain to climate-related hazards: Towards a risk-informed site selection process. J. Urban Reg. Plan. 2019, 6, 33–45. [Google Scholar]
- Weerasinghe, S. What We Know About Climate Change and Migration; Institute for the Study of International Migration (ISIM), Georgetown University: Washington, DC, USA, 2021; Available online: https://cmsny.org/wp-content/uploads/2021/02/What-We-Know-About-Climate-Change-and-Migration-Final.pdf (accessed on 21 September 2024).
- Core Writing Team; Lee, H.; Romero, J. (Eds.) Contribution of Working Groups I, II and III to the Sixth Assessment Report of the Intergovernmental Panel on Climate Change; Synthesis Report. In Climate Change 2023; IPCC: Geneva, Switzerland, 2023; pp. 35–115. [Google Scholar] [CrossRef]
- International Marine Design Conference. Global Report on Internal Displacement; Norwegian Refugee Council: Oslo, Norway, 2024; Available online: https://api.internal-displacement.org/sites/default/files/publications/documents/IDMC-GRID-2024-Global-Report-on-Internal-Displacement.pdf (accessed on 23 June 2024).
- See, J.; Wilmsen, B. Just adaptation? Generating new vulnerabilities and shaping adaptive capacities through the politics of climate-related resettlement in a Philippine coastal city. Glob. Environ. Change 2020, 65, 102188. [Google Scholar] [CrossRef]
- Adger, W.N. Social capital, collective action, and adaptation to climate change. Econ. Geogr. 2003, 79, 387–404. [Google Scholar] [CrossRef]
- Aldrich, D.P.; Meyer, M.A. Social capital and community resilience. Am. Behav. Sci. 2015, 59, 254–269. [Google Scholar] [CrossRef]
- Cutter, S.L.; Burton, C.G.; Emrich, C.T. Disaster resilience indicators for benchmarking baseline conditions. J. Homel. Secur. Emerg. Manag. 2010, 7, 1–22. [Google Scholar] [CrossRef]
- Pelling, M.; High, C. Understanding adaptation: What can social capital offer assessments of adaptive capacity? Glob. Environ. Change 2005, 15, 308–319. [Google Scholar] [CrossRef]
- Morrow, B. Community resilience: A social justice perspective. In CARRI Research Report 4; Community and Regional Resilience Institute: Oak Ridge, TN, USA, 2008. [Google Scholar] [CrossRef]
- Kim, Y.; Ross, J. Managing climate risks and adaptation in coastal communities: How to provide information. J. Public Policy Adm. 2024, 8, 73–81. [Google Scholar] [CrossRef]
- Burby, R.J.; Deyle, R.E.; Godschalk, D.R.; Olshansky, R.B. Creating Hazard Resilient Communities through Land-Use Planning. Nat. Hazards Rev. 2000, 2, 99–106. [Google Scholar] [CrossRef]
- Sylves, R. Budgeting for local emergency management and homeland security. In Emergency Management: Principles and Practice for Local Government; Waugh, W.L., Tierney, K., Eds.; International City Managers Association: Washington, DC, USA, 2007; pp. 183–206. [Google Scholar]
- Opoku-Boateng, E.; Agyei, F.; Asibey, M.O.; Mintah, F. Climate change resilience and social capital: Insights from informal urban neighbourhoods in Kumasi, Ghana. Cities 2024, 152, 105234. [Google Scholar] [CrossRef]
- Carmen, E.; Fazey, I.; Ross, H.; Bedinger, M.; Smith, F.M.; Prager, K.; McClymont, K.; Morrison, D. Building community resilience in a context of climate change: The role of social capital. Ambio 2022, 51, 1371–1387. [Google Scholar] [CrossRef] [PubMed]
- Godschalk, D.R. Urban hazard mitigation: Creating resilient cities. Nat. Hazards Rev. 2003, 4, 136–143. [Google Scholar] [CrossRef]
- Deressa, T.; Hassan, R.M.; Ringler, C. Measuring Ethiopian Farmers’ Vulnerability to Climate Change Across Regional States’ Environment and Production Technology; Division IFPRI Discussion Paper 00806; International Food Policy Research Institute: Washington, DC, USA, 2008. [Google Scholar]
- Bass, S.; Ramasamy, S. Community-Based Adaptation in Action: A Case Study from Bangladesh; Food and Agriculture Organization of the United Nations, Rome Department of Agricultural Extension: Dhaka, Bangladesh, 2008; Available online: https://www.uncclearn.org/wp-content/uploads/library/fao30.pdf (accessed on 8 January 2025).
- Favier, A.; Westernhagen, C.H.; Krieg, M.; Kumawat, B. Integrating social capital with urban infrastructure networks for more resilient cities. arXiv 2025, arXiv:2502.06328. [Google Scholar] [CrossRef]
- Mangada, L.L.; Cuaton, G.P. Typhoon Haiyan survivors at the resettlement sites: COVID-19 pandemic realities and challenges. Dialogues Health 2022, 1, 100005. [Google Scholar] [CrossRef]
- Hadlos, A. Determining the depth of households’ participation influencing the level of their residential satisfaction in a post-Haiyan resettlement. Int. J. Disaster Risk Reduct. 2021, 64, 102490. [Google Scholar] [CrossRef]
- Pormon, M.M.M.; Yee, D.K.P.; Gerona, C.K.O. Households condition and satisfaction towards post-disaster resettlement: The case of typhoon Haiyan resettlement areas in Tacloban City. Int. J. Disaster Risk Reduct. 2023, 91, 103681. [Google Scholar] [CrossRef]
- Ensor, J.; Tuhkanen, H.; Boyland, M.; Salamanca, A.; Johnson, K.; Thomalla, F.; Mangada, L.L. Redistributing resilience? Deliberate transformation and political capabilities in post-Haiyan Tacloban. World Dev. 2021, 140, 105360. [Google Scholar] [CrossRef]
- Archila Bustos, M.F.; Hall, O.; Andersson, M. Nighttime lights and population changes in Europe 1992–2012. Ambio 2015, 44, 653–655. [Google Scholar] [CrossRef] [PubMed]
- Elvidge, C.D.; Baugh, K.; Zhizhin, M.; Hsu, F.C. Why VIIRS data are superior to DMSP for mapping nighttime lights. In Proceedings of the Asia-Pacific Advanced Network; Asia Pacific Advanced Network: Hidalgo, Mexico, 2013. [Google Scholar] [CrossRef]
- Elvidge, C.D.; Li, X.; Zhou, Y.; Cao, C.; Warner, T.A. Remote Sensing of Night-Time Light; Taylor & Francis: London, UK, 2021. [Google Scholar]
- Elvidge, C.D.; Zhizhin, M.; Ghosh, T.; Hsu, F.C.; Taneja, J. Annual time series of global VIIRS night-time lights derived from monthly averages: 2012 to 2019. Remote Sens. 2021, 13, 922. [Google Scholar] [CrossRef]
- Enenkel, M.; Shrestha, R.M.; Stokes, E.; Román, M.; Wang, Z.; Espinosa, M.T.M.; Hajzmanova, I.; Ginnetti, J.; Vinck, P. Emergencies do not stop at night: Advanced analysis of displacement based on satellite-derived nighttime light observations. IBM J. Res. Dev. 2020, 64, 8:1–8:12. [Google Scholar] [CrossRef]
- Jiang, W.; He, G.; Long, T.; Liu, H. Ongoing conflict makes Yemen dark: From the perspective of nighttime light. Remote Sens. 2017, 9, 798. [Google Scholar] [CrossRef]
- Levin, N.; Kyba, C.C.M.; Zhang, Q.; Sánchez de Miguel, A.; Román, M.O.; Li, X.; Portnov, B.A.; Molthan, A.L.; Jechow, A.; Miller, S.D.; et al. Remote sensing of night lights: A review and an outlook for the future. Remote Sens. Environ. 2020, 237, 111443. [Google Scholar] [CrossRef]
- Levin, N.; Zhang, Q. A global analysis of factors controlling VIIRS nighttime light levels from densely populated areas. Remote Sens. Environ. 2017, 190, 366–382. [Google Scholar] [CrossRef]
- Chen, X. Nighttime lights and population migration: Revisiting classic demographic perspectives with an analysis of recent European data. Remote Sens. 2020, 12, 169. [Google Scholar] [CrossRef]
- Li, X.; Li, D. Can night-time light images play a role in evaluating the Syrian crisis? Int. J. Remote Sens. 2014, 35, 6648–6661. [Google Scholar] [CrossRef]
- Earth Observation Group. 2025. Available online: https://eogdata.mines.edu/products/vnl/ (accessed on 3 August 2024).
- Elvidge, C.D.; Baugh, K.; Zhizhin, M.; Hsu, F.C.; Ghosh, T. VIIRS night-time lights. Int. J. Remote Sens. 2017, 38, 5860–5879. [Google Scholar] [CrossRef]
- The US Geological Survey. Characterizing Urban Heat Islands Across 50 Major US Cities in the United States. 2023. Available online: https://www.usgs.gov/publications/characterizing-urban-heat-islands-across-50-major-cities-united-states (accessed on 15 July 2024).
- Edamo, M.L.; Ukumo, T.Y.; Lohani, T.K.; Ayana, M.T.; Ayele, M.A.; Mada, Z.M.; Abdi, D.M. A comparative assessment of multi-criteria decision-making analysis and machine learning methods for flood susceptibility mapping and socio-economic impacts on flood risk in Abela-Abaya floodplain of Ethiopia. Environ. Chall. 2022, 9, 100629. [Google Scholar] [CrossRef]
- Meyer, V.; Haase, D.; Scheuer, S. A multicriteria flood risk assessment and mapping approach. Flood Risk Manag. Res. 2008, 4, 1687–1693. [Google Scholar]
- Meyer, V.; Scheuer, S.; Haase, D. A multicriteria approach for flood risk mapping exemplified at the Mulde river, Germany. Nat. Hazards 2009, 48, 17–39. [Google Scholar] [CrossRef]
- Rana, S.M.S.; Habib, S.M.A.; Sharifee, M.N.H.; Sultana, N.; Rahman, S.H. Flood risk mapping of the flood-prone Rangpur division of Bangladesh using remote sensing and multi-criteria analysis. Nat. Hazards Res. 2018, 4, 20–31. [Google Scholar] [CrossRef]
- Rincón, D.; Khan, U.T.; Armenakis, C. Flood Risk Mapping Using GIS and Multi-Criteria Analysis: A Greater Toronto Area Case Study. Geosciences 2018, 8, 275. [Google Scholar] [CrossRef]
- Cooley, M.E.; Turner, R.M. Application of Landsat Products in Range- and Water-Management Problems in the Sahelian Zone of Mali, Upper Volta, and Niger; U.S. Government Printing Office: Washington, DC, USA, 1982. [Google Scholar]
- Demirkesen, A.C.; Evrendilek, F.; Berberoglu, S.; Kilic, S. Coastal flood risk analysis using landsat-7 ETM+ imagery and SRTM DEM: A case study of Izmir, Turkey. Environ. Monit. Assess. 2007, 131, 293–300. [Google Scholar] [CrossRef] [PubMed]
- Olthof, I.; Tolszczuk-Leclerc, S. Comparing Landsat and RADARSAT for Current and Historical Dynamic Flood Mapping. Remote Sens. 2018, 10, 780. [Google Scholar] [CrossRef]
- Zhang, F.; Zhu, X.; Liu, D. Blending MODIS and Landsat images for urban flood mapping. Int. J. Remote Sens. 2014, 35, 3237–3253. [Google Scholar] [CrossRef]
- Gunes, A.E.; Kovel, J.P. Using GIS in Emergency Management Operations. J. Urban Plan. Dev. 2000, 126, 136–149. [Google Scholar] [CrossRef]
- Milenkovic, M.; Kekic, D. Using GIS in emergency management. In International Scientific Conference on ICT and E-Business Related Research; Sinteza: Oradea, Romania, 2016; pp. 202–207. [Google Scholar] [CrossRef]
- Kwan, M.P.; Lee, J. Emergency response after 9/11: The potential of real-time 3D GIS for quick emergency response in micro-spatial environments. Computers. Environ. Urban Syst. 2005, 29, 93–113. [Google Scholar] [CrossRef]
- Šterk, M.; Praprotnik, M. Improving emergency response logistics through advanced GIS. Open Geospat. Data Softw. Stand. 2017, 2, 1. [Google Scholar] [CrossRef]
- Abenir, M.A.D.; Manzanero, L.I.O.; Bollettino, V. Community-based leadership in disaster resilience: The case of small island community in Hagonoy, Bulacan, Philippines. Int. J. Disaster Risk Reduct. 2022, 71, 102797. [Google Scholar] [CrossRef]
- MacLeod, D.; Easton-Calabria, E.; de Perez, E.C.; Jaime, C. Verification of forecasts for extreme rainfall, tropical cyclones, flood and storm surge over Myanmar and the Philippines. Weather Clim. Extrem. 2021, 33, 100325. [Google Scholar] [CrossRef]
- Ravago, M.-L.V.; Mapa, C.D.S.; Aycardo, A.G.; Abrigo, M.R.M. Localized disaster risk management index for the Philippines: Is your municipality ready for the next disaster? Int. J. Disaster Risk Reduct. 2020, 51, 101913. [Google Scholar] [CrossRef]
- Valenzuela, V.P.B.; Esteban, M.; Takagi, H.; Thao, N.D.; Onuki, M. Disaster awareness in three low risk coastal communities in Puerto Princesa City, Palawan, Philippines. Int. J. Disaster Risk Reduct. 2020, 46, 101508. [Google Scholar] [CrossRef]
- Kundzewicz, Z.W.; Kanae, S.; Seneviratne, S.I.; Handmer, J.; Nicholls, N.; Peduzzi, P.; Mechler, R.; Bouwer, L.M.; Arnell, N.W.; Mach, K.; et al. Flood risk and climate change: Global and regional perspectives. Hydrol. Sci. J. 2014, 59, 1–28. [Google Scholar] [CrossRef]
- Kim, Y.; Chadduck, C.; Guerra, V. Mapping green infrastructure for storm water management: A spatial analysis in Northern Virginia, USA. Environ. Pollut. Clim. Change 2023, 7, 358. [Google Scholar]
Disclaimer/Publisher’s Note: The statements, opinions and data contained in all publications are solely those of the individual author(s) and contributor(s) and not of MDPI and/or the editor(s). MDPI and/or the editor(s) disclaim responsibility for any injury to people or property resulting from any ideas, methods, instructions or products referred to in the content. |
© 2025 by the authors. Licensee MDPI, Basel, Switzerland. This article is an open access article distributed under the terms and conditions of the Creative Commons Attribution (CC BY) license (https://creativecommons.org/licenses/by/4.0/).

