Article

Optimizing WRF Configurations for Improved Precipitation Forecasting in West Africa: Sensitivity to Cumulus and PBL Schemes in a Senegal Case Study

1
Laboratoire d’Environnement, Informatique, Télécommunications et Energies Renouvelables, Unité de Formation et de Recherche de Sciences Appliquées et de Technologie, Université Gaston Berger de Saint-Louis, P.O. Box 234, Saint-Louis 32000, Senegal
2
Agence Nationale de l’Aviation Civile et de la Météorologie, Aéroport Militaire Léopold Sédar Senghor, Yoff, Dakar P.O. Box 8184, Senegal
3
Agence Nationale de la Météorologie, Avenue de la Paix, Somgandé, 01, Ouagadougou P.O. Box 576, Burkina Faso
4
NORCAP, NORwegian Refugee Council CAPacity, Prinsens Gate 2, 0152 Oslo, Norway
5
African Climate and Development Initiative, University of Cape Town, Cape Town P.O. Box 7701, South Africa
6
African Center of Meteorological Applications for Development, 55, Avenue des Ministères, Niamey P.O. Box 13 184, Niger
*
Author to whom correspondence should be addressed.
Climate 2025, 13(9), 181; https://doi.org/10.3390/cli13090181
Submission received: 12 July 2025 / Revised: 20 August 2025 / Accepted: 22 August 2025 / Published: 29 August 2025
(This article belongs to the Special Issue Meteorological Forecasting and Modeling in Climatology)

Abstract

Despite significant progress, precipitation forecasting in West Africa remains challenging due to the complexity of atmospheric processes and the region’s climatic variability. This study aims to identify optimal configurations of the WRF model to improve precipitation forecasting. To evaluate the sensitivity of the model’s physical parameterizations, 15 configurations were tested by combining various cumulus parameterization schemes (CPSs) and planetary boundary layer (PBL) schemes. The analysis examines two contrasting rainfall events in Senegal: one characterized by widespread intense precipitation and another featuring localized moderate rainfall. Simulated rainfall, temperature, and humidity were validated against rain gauges, satellite products (ENACTS, ARC2, CHIRPS, and IMERG), and ERA5 reanalysis data. The results show that the WRF configurations achieve correlation coefficients (r) ranging from 0.27 to 0.62 against ENACTS and from 0.15 to 0.41 against rain gauges. The sensitivity analysis reveals that PBL schemes primarily influence temperature and humidity, while CPSs significantly affect precipitation. For the heavy rainfall event, several configurations accurately captured the observed patterns, particularly those using Tiedtke or Grell–Devenyi CPSs coupled with the Mellor–Yamada–Janjic (MYJ) PBL. However, the model showed limited skill in simulating localized convection during the moderate rainfall event. These findings highlight the importance of selecting appropriate parameterizations to enhance WRF-based precipitation forecasting, especially for extreme weather events in West Africa.

1. Introduction

Sub-Saharan Africa, a region mainly dependent on agriculture and livestock, is highly vulnerable and exposed to extreme weather events, such as droughts and excessive rainfall. These phenomena have severe impacts on water availability, crop yields, livestock, and public health [1,2]. Accurate weather forecasting is therefore crucial for mitigating these risks and supporting sustainable development in the region [3].
The West African Monsoon (WAM) is a key driver of the region’s climate, influenced by complex interactions between the Cold Water Tongue (CWT) [4,5], the Saharan Heat Low (SHL) [6], the Intertropical Convergence Zone (ITCZ), and the Intertropical Discontinuity (ITD) [7]. The WAM is further characterized by the interplay of the humid monsoon flow and the dry Harmattan wind, as well as the African Easterly Jet (AEJ) and African Easterly Waves (AEWs) [8,9,10]. These dynamics, combined with atmospheric instability metrics such as Convective Available Potential Energy (CAPE) [11,12], foster the development of Mesoscale Convective Systems (MCSs) and their subsets, Organized Convective Systems (OCSs) [13]. These systems are responsible for extreme weather events, including heavy rainfall, wind gusts, and flash floods, which pose significant challenges to local communities.
Despite advances in understanding WAM dynamics, accurate weather forecasting in West Africa remains hindered by uncertainties in Regional Climate Models (RCMs), particularly in the parameterization of convection [14]. On the other hand, avoiding the convective gray zone (3–10 km), which poses challenges for representing sub-grid-scale processes [15,16], can help to mitigate these issues. Convection-permitting models at higher resolutions (dx ≤ 3 km) offer a promising solution [17,18]. Nevertheless, studies have indicated that employing convective parameterization schemes at these resolutions could enhance simulations [19].
Numerical weather prediction (NWP) models, such as the Weather Research and Forecasting (WRF) model [20], are essential tools for precipitation forecasting. WRF is widely used globally due to its flexible and continuously updated physical parameterization schemes [21]. However, its application in tropical regions, including West Africa, has revealed limitations, such as rainfall underestimation at the equator and overestimation in West Africa [22]. To address these issues, several studies have explored the sensitivity of WRF’s physical parameterizations [23,24,25].
In Senegal, the Agence Nationale de l’Aviation Civile et de la Météorologie (ANACIM) is implementing a Numerical Weather Prediction (NWP) system based on WRF. In the pre-operational phase, understanding WRF’s performance in simulating rainfall is crucial. This initial study focuses on case studies, testing 15 model configurations with different cumulus parameterization schemes (CPSs) and planetary boundary layer (PBL) schemes. Conducting such case comparison studies is essential for evaluating model sensitivity to physical parameterizations, which in turn supports the selection of robust configurations for operational use. The goal is to identify optimal parameterizations for improving precipitation forecasts, with future work assessing the system’s overall skill.
The paper is structured as follows: Section 2 describes the study area, simulation setup, and observational datasets. Section 3 presents the results, including spatial and temporal analyses of rainfall, temperature, relative humidity, and atmospheric dynamics. Section 4 discusses the findings and their implications for operational forecasting in West Africa.

2. Materials and Methods

2.1. Study Area

West Africa features vast plains, low-lying plateaus (<300 m), and mountain ranges (Figure 1). Plains dominate the coastal areas of Senegal and Gambia, while plateaus extend inland. Higher plateaus and mountains shape the southern and northeastern borders, with peaks exceeding 2700 m [26]. This topographic diversity influences climate patterns, particularly precipitation gradients and atmospheric circulations associated with the West African monsoon (AEW, SHL, AEJ, MCS, monsoon flow, CWT, and moisture transport from the Gulf of Guinea). The latter is governed by the thermal contrast between the Atlantic Ocean and the African continent [27]. According to Dione [28], the latitudinal distribution of precipitation in the Senegal river basin allows for the identification of four distinct climatic zones: the Guinean zone (P > 1500 mm/year), the Southern Sudanian zone (1000 < P ≤ 1500 mm/year), the Northern Sudanian zone (500 < P ≤ 1000 mm/year), and the Sahelian zone (P < 500 mm/year).
Senegal, located within this climatic gradient, experiences a tropical climate characterized by a rainy season induced by the WAM and a dry season dominated by the Harmattan winds [29,30,31,32]. Annual rainfall exhibits a marked north–south gradient, ranging from over 1200 mm in the southern regions to less than 200 mm in the northern Sahelian areas.

2.2. Multi-Source Precipitation and Atmospheric Datasets

2.2.1. Global Forecast System

We used analysis data from the Global Forecast System (GFS) at 00 Z, with a spatial resolution of 0.5° and a temporal resolution of 6 h, to force the WRF model as initial and lateral boundary conditions. Developed by the National Centers for Environmental Prediction (NCEP), the GFS is a coupled model consisting of four components: an atmospheric model, an ocean model, a land/soil model, and a sea ice model. It is used operationally to produce global weather forecasts up to 16 days in the future and is widely employed in regional climate and weather modeling studies [33]. The choice of GFS, rather than Climate Forecast System (CFS), was motivated by the objective of evaluating the WRF model in a short-term forecasting context as GFS is more suitable for real-time weather prediction, while CFS is typically used for seasonal to sub-seasonal forecasts.

2.2.2. In Situ Observations

Daily rainfall data, measured between 06:00 UTC on day J and 06:00 UTC on day J+1, from 24 meteorological stations and 42 rain gauge stations distributed across Senegal, were used to validate satellite-based estimates, reanalysis products, and WRF model outputs. These in situ observations, provided by the National Agency of Civil Aviation and Meteorology (ANACIM), represent a valuable data source despite the relatively low density of the rain gauge network in West Africa [28,32]. In this context, satellite-derived estimates serve as a complementary alternative, offering broader spatial and temporal coverage that is particularly useful for hydrometeorological monitoring and the calibration of regional models.
Similarly, hourly temperature and relative humidity data, recorded from 06:00 UTC on day J to 06:00 UTC on day J+1, were collected from four meteorological stations, Dakar-Yoff, Saint-Louis, Ziguinchor, and Tambacounda, operated by the ANACIM. These in situ observations were used to validate both reanalysis datasets and outputs from WRF model. Although the number of stations is limited, the high quality of these ground-based measurements provides a reliable reference for assessing the accuracy of temporal evolution.

2.2.3. Enhancing National Climate Services

Among the datasets used, the Enhancing National Climate Services (ENACTS) product, developed through a collaboration between the ANACIM and the International Research Institute for Climate and Society (IRI), provides high-spatial-resolution data on a 0.0375° (approximately 4 km) grid. This product combines ground-based rainfall observations from Senegalese rain gauges with satellite-derived precipitation estimates from TAMSAT (Tropical Applications of Meteorology using Satellite) [34,35]. ENACTS offers significant advantages in terms of spatial resolution, but its validation is still ongoing.

2.2.4. African Rainfall Climatology Version 2

The African Rainfall Climatology version 2 (ARC2), with a spatial resolution of 0.1° (approximately 10 km), was developed using the Rainfall Estimate (RFE) algorithm. It combines geostationary infrared data (GPI) from EUMETSAT collected every 3 h with precipitation observations reported at 3 h intervals through the Global Telecommunications System (GTS) [36].

2.2.5. Integrated Multi-Satellite Retrievals for GPM

The Level 3 Integrated Multi-satellite Retrievals for GPM (IMERG) product from the Global Precipitation Measurement (GPM) mission provides the final estimation of daily accumulated precipitation. These data are produced by NASA’s Goddard Earth Sciences Data and Information Services Center (GES DISC). The IMERG algorithm combines precipitation estimates from multiple passive microwave satellites, including those of the GPM constellation [37].

2.2.6. Climate Hazards Group Infrared Precipitation with Stations

Climate Hazards Group Infrared Precipitation with Stations (CHIRPS), developed by the Climate Hazards Group (CHG) at the University of California, Santa Barbara (UCSB), compiles an extensive archive of daily, pentadal, and monthly rain gauge precipitation observations from various sources, including GTS archives and more than a dozen national and regional meteorological services [38]. CHIRPS involves a two-part process, creating Infrared Precipitation (IRP) estimates from satellite data and converting them to precipitation values.

2.2.7. ERA5 Reanalysis and Variables Used

The ERA5 reanalysis is produced by the European Centre for Medium-Range Weather Forecasts (ECMWF) under the Copernicus Climate Change Service. ERA5 is the fifth generation of ECMWF’s global reanalysis products, providing a consistent reconstruction of past atmospheric conditions since 1950. It is based on the CY41R2 version of the Integrated Forecasting System (IFS) and applies advanced four-dimensional variational (4D-Var) data assimilation techniques to integrate a large volume of observations, resulting in high temporal and spatial resolutions across 137 hybrid sigma–pressure levels extending from the surface to 0.01 hPa [39].
The following ERA5 variables were used in this work:
  • Total precipitation (TP): Accumulated liquid and frozen water (rain and snow) reaching the surface, combining contributions from large-scale and convective precipitation processes. The accumulation period is typically 1 h for reanalysis data, and values are expressed as water-equivalent depth in meters.
  • 2 m temperature (T2m): Air temperature 2 m above the land or water surface, obtained by interpolating between the lowest model level and the surface, expressed in Kelvin (K) and convertible to degrees Celsius (°C).
  • Relative humidity (RH): Expressed as a percentage of the saturation water vapor pressure, indicating the degree of saturation of the air. It is calculated over water above 0 °C, over ice below −23 °C, and interpolated between ice and water for temperatures in between.
  • Zonal wind component (U): Eastward component of the horizontal wind, where positive values indicate flow toward the east and negative toward the west.
  • Meridional wind component (V): Northward component of the horizontal wind, where positive values indicate flow toward the north and negative toward the south.
The wind components (U and V) and the relative humidity (RH) were analyzed at pressure levels of 925, 850, 700, and 200 hPa, providing information on horizontal wind behavior at different atmospheric layers.

2.3. Case Studies

Two case studies were selected to assess the model’s ability to capture high variability in convective activity during the season. A severe rainfall event on 5 September 2020, which affected all of Senegal [40], was chosen to evaluate the model’s response to extreme weather. During that event, exceptional rainfall was recorded, up to 140 mm in several locations [41], causing widespread flooding in 11 out of 14 regions and 25 departments, affecting 77,260 people, displacing 3285, and resulting in significant losses, including human casualties, livestock deaths, and infrastructure damage [42,43].
The 3 September 2021 event featured moderate rainfall in the central and southern regions of Senegal. This event was characterized by local and weak convective activity. This is a tricky event for forecasters but a good one for discriminating configurations.

2.4. WRF Configurations

For this study, the non-hydrostatic version 4.3 [20] of the WRF-ARW model was used to simulate precipitation. The configuration used to run the model refers to the number of grid points, number of vertical levels, types of vertical coordinates, time step, and spatial resolutions of static geographic data and weather data, which are listed in Table 1.
To produce a 48 h forecast for all simulations, with a spin-up time of 6 h [25,44,45,46], we used GFS analysis data for forcing initial and lateral boundary conditions. The WRF model allows for downscaling by nesting multiple domains, with resolution increasing progressively from the coarse parent domain to the finer child domain, ensuring a buffer of more than 10 grid cells between the lateral boundaries of Dom2 and those of Dom1.
Figure 1 shows the model domains used in the simulations, with the red box indicating the inner domain. One-way nesting (information passed only from the parent domain to the child domain) was applied in all simulations, without any nudging.
The WRF model was configured with a 15 km parent domain and a 3 km nested domain. At 15 km, the PBL, microphysics, radiation, land surface, and convection processes were parameterized. In contrast, at 3 km, convection was explicitly resolved, while the PBL and other physical processes remained parameterized. The different parameterization combinations used to evaluate the WRF model performance are described in Table 2.
Regarding WRF physics, our study primarily focuses on convective parameterization schemes (CPSs) and planetary boundary layer (PBL) schemes, which, according to several studies [23,24,25,59,60], have the most influence on the magnitude of rainfall. While microphysics schemes also play an important role in precipitation simulation, several studies [24,25,61,62] agree that the Thompson microphysics scheme [53] is among the best-performing options for our region, which motivated its use in this work. CPSs hold a pivotal role in accounting for the sub-grid effects of convection, encompassing cloud dynamics, the vertical dispersion of moisture and heat, the computation of convective precipitation, and the subsequent feedback mechanisms within the atmospheric environment. The triggering of CPSs is most likely to be predicated upon lower atmospheric dynamics, including factors such as convective inhibition, soil–atmosphere interactions, and more, thus underscoring the paramount significance of the planetary boundary layer (PBL) for our investigation. It is worth noting that PBL schemes are responsible for the turbulent mixing not only within the PBL but also extending their influence throughout the entire grid column. As such, the selection of appropriate CPSs and PBL schemes becomes of critical importance, particularly in the context of a tropical region characterized by the prevalence of deep convection; for more details, see [21].
In pursuit of our research objectives, we conducted a total of fifteen configurations listed in Table 3, each representing distinct combinations of five CPSs and three PBL schemes, offering valuable insights into their effects and interactions in this dynamic context. Each combination is a configuration of WRF model.

2.5. Model Assessment

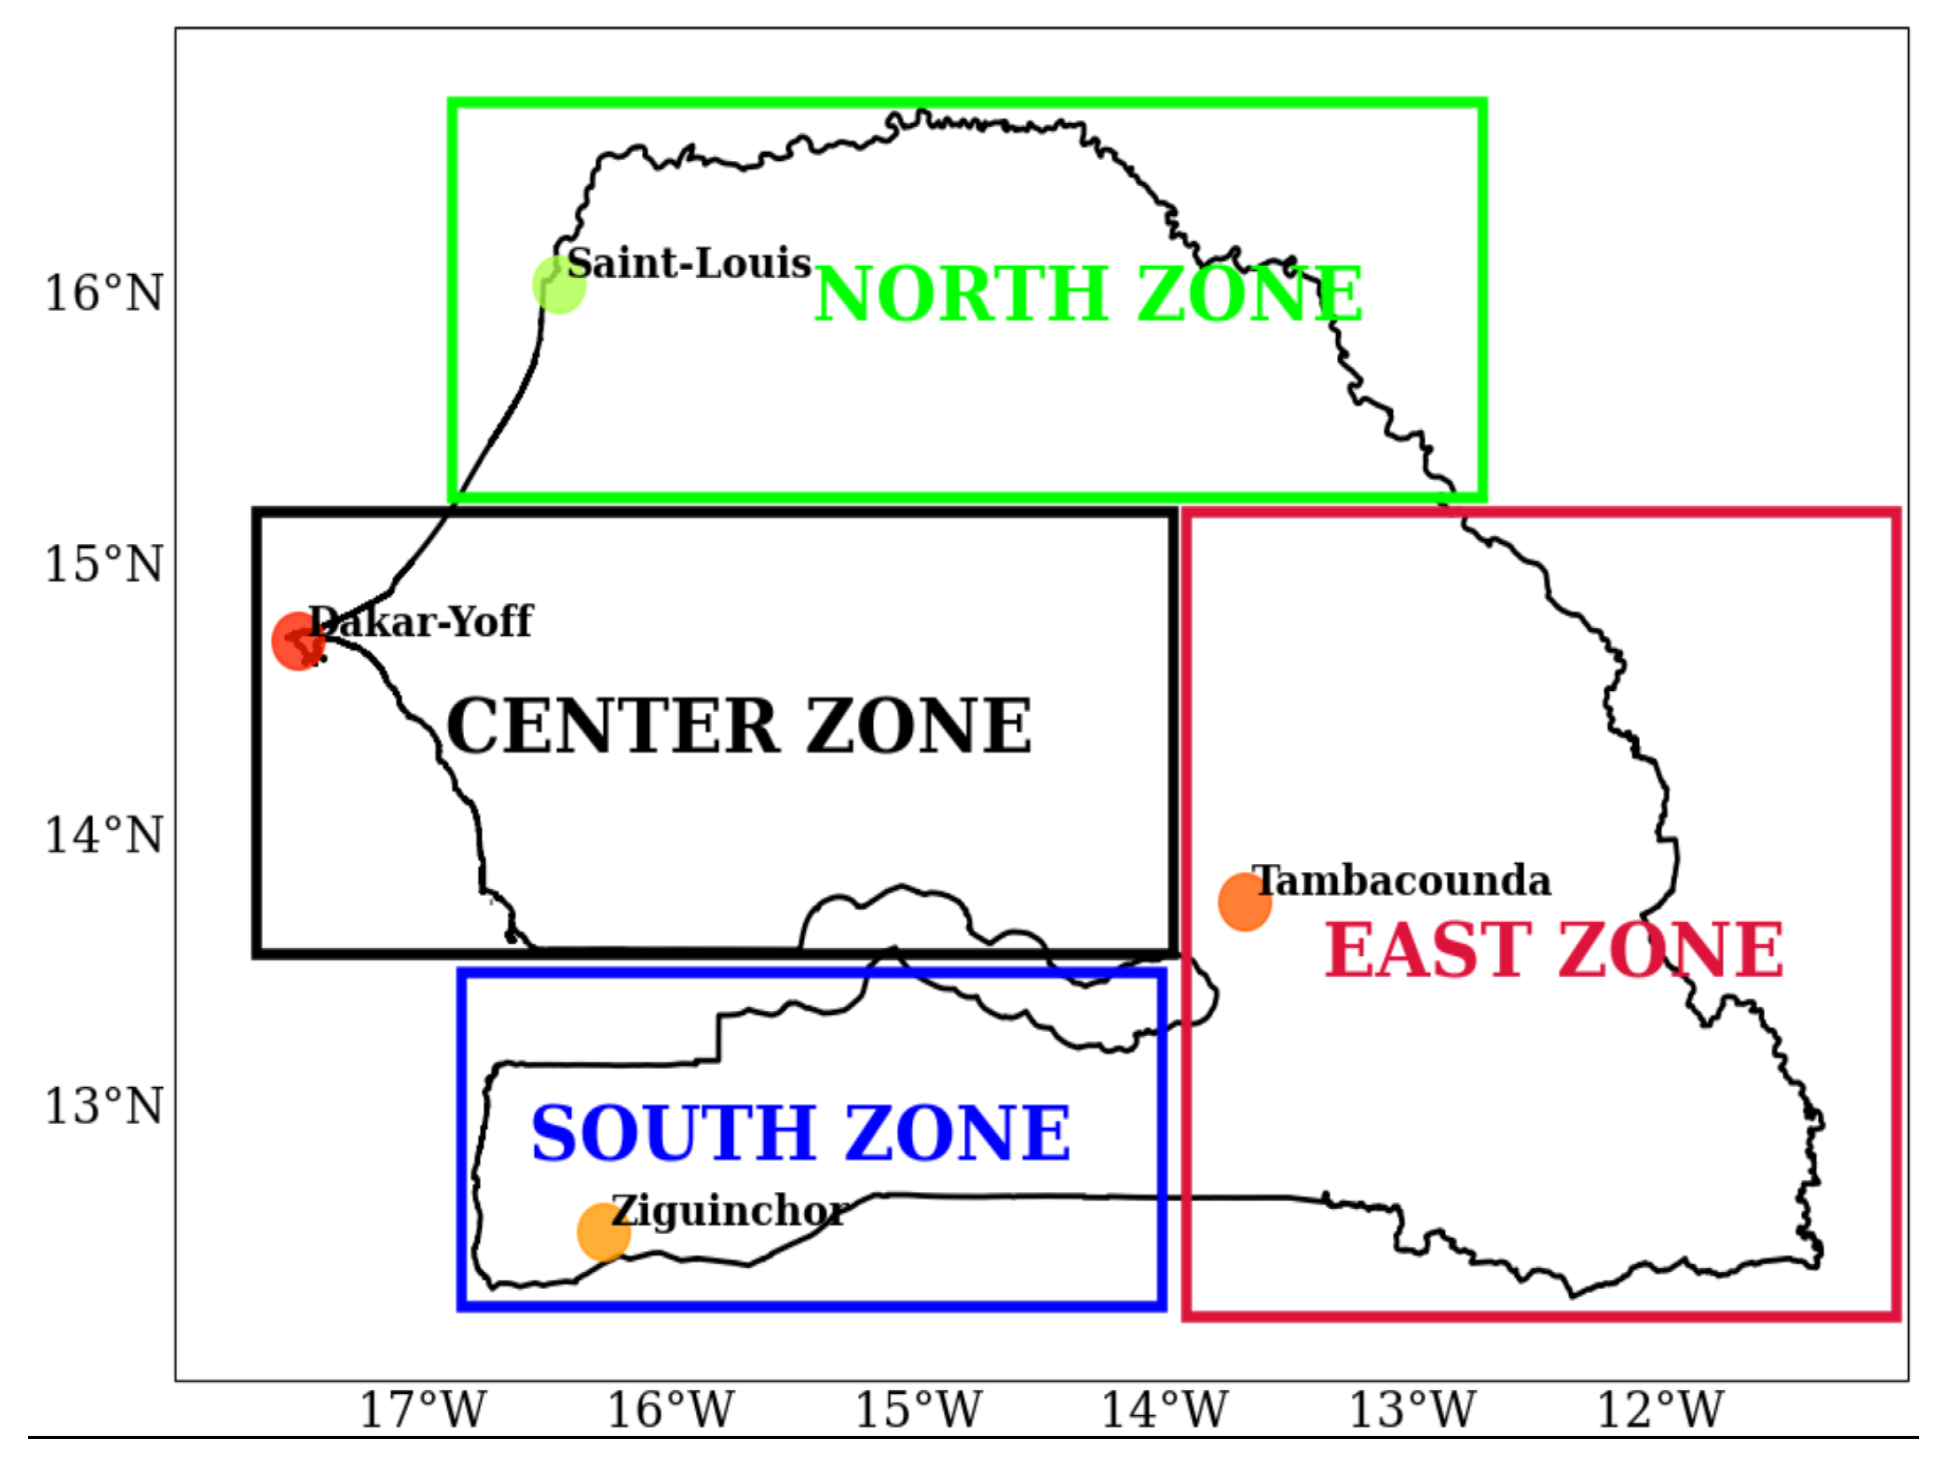
To evaluate the performance of the WRF model in simulating precipitation, we used various metrics in accordance with these studies [24,25,63,64] and in a geographical breakdown of four climatological zones (North, Center, South, and East, illustrated in Figure 2) and the whole of Senegal. This zonal division is consistent with the approach adopted by [65,66], who used similar climatological regions to account for spatial variability across the country.
The performance indicators BIAS, MAE (mean absolute error), RMSE (root mean square error), the Pearson correlation coefficient (r), and Taylor diagram used to evaluate the model are computed for each region based on this breakdown. The red box in Figure 1 designates the region where validation scores are compiled.
  • BIAS, defined by Equation (1), measures the average difference between model predictions and observations, indicating whether a model systematically overestimates or underestimates values. Although bias is useful for detecting systematic errors, it does not provide information on the magnitude of individual errors, and a low bias may hide large compensating errors [67].
    BIAS = 1 n i = 1 n P i O i
    where P i are the predicted values, O i are the observed values, and n is the number of observations.
  • MAE, Equation (2) quantifies the average magnitude of errors in a model’s predictions regardless of their direction. It is easy to interpret and more robust to outliers than RMSE, making it useful for general performance evaluation where large errors are not disproportionately penalized. MAE provides a straightforward measure of accuracy in the same units as the observed variable [68].
    MAE = i = 1 n | ( P i O i ) | n
  • RMSE, Equation (3) calculates the square root of the average squared differences between predictions and observations. It is sensitive to large errors due to the squaring, making it particularly useful when large deviations are critical to assess. However, its sensitivity to outliers may exaggerate overall error metrics in noisy data [69].
    RMSE = i = 1 n ( P i O i ) 2 n
  • Correlation coefficient (r), Equation (4) assesses the strength and direction of the linear relationship between predicted and observed values. A value close to +1 indicates a strong positive linear relationship, while 0 suggests no correlation. While correlation is useful for pattern detection, it does not account for biases or differences in magnitude between datasets [70].
    r = c o v ( O , P ) σ O 2 σ P 2
  • The Taylor diagram, introduced by [71], is a visual tool that offers a statistical overview of the similarity between patterns. Consider factors such as correlation (r), normalized standard deviation ( σ ), and normalized RMSE between points. It serves as a graphical summary to assess how well a set of patterns aligns with observations, making it particularly valuable for evaluating various aspects of complex models or comparing the skills of different models.

2.6. Selection of Reference Dataset and Validation of WRF Simulations

To select the most suitable reference dataset for evaluating the WRF model and validating both the estimated precipitation and reanalysis, we begin with a comprehensive comparison of all available datasets against rain gauge measurements. This allows us to identify the most accurate data source, which will serve as the reference for subsequent evaluation. To ensure a consistent comparison between datasets with different spatial resolutions, all gridded datasets were regridded to match the reference dataset grid using bilinear interpolation. For station-based comparisons, values were extracted at the nearest grid point of each dataset using the nearest-neighbor method [18]. Although observational data represent a valuable source, the low density of the conventional rain gauge network in West Africa limits their spatial representativeness and their ability to capture the temporal variability of simulated precipitation [24].
Using this reference dataset, we assess the spatial accuracy of the different precipitation estimates to identify the model configuration that best reproduces observed patterns, both in magnitude and spatial distribution. The evaluation is based on statistical scores, including BIAS, RMSE, MAE, and the Pearson correlation coefficient, computed for each climatic zone (North, Center, South, and East, as illustrated in Figure 2) as well as for the entire country.

3. Results

3.1. Evaluation of Rainfall Products and WRF Simulations

Table 4 presents the validation scores of satellite and reanalysis datasets compared to rain gauge observations for two case studies: 5 September 2020 and 3 September 2021. The results show that the datasets ENACTS, ARC2, CHIRPS, and IMERG generally perform better than ERA5 across most metrics. Among these, ENACTS consistently achieves the highest scores in both events, as shown in Table 4, with a correlation of r = 0.62 and a bias of –0.1 for the event on 5 September 2020, and r = 0.84 and a bias of –0.1 for the event on 3 September 2021. This strong performance is attributed to its use of 95% ground-based rainfall data combined with TAMSAT satellite estimates.
Given that in situ rainfall observations are sparse and therefore inadequate for assessing the spatial distribution of rainfall, the ENACTS dataset, which obtained the best validation scores, was used as a reference to evaluate satellite and reanalysis rainfall estimates over the climatologically homogeneous zones of Senegal, as shown in Figure 2.
Figure 3 shows the BIAS, RMSE, MAE, and correlation scores of the ARC2, CHIRPS, IMERG, and ERA5 datasets in relation to ENACTS. The trends observed are consistent with the results in Table 4 for both case studies. Notably, ARC2, CHIRPS, and IMERG outperform ERA5 in terms of agreement with the reference dataset. However, IMERG tends to overestimate rainfall in the North zone, while ERA5 shows a similar overestimation in the East zone. In contrast, CHIRPS generally underestimates rainfall in the Center zone. These biases are associated with relatively lower correlation coefficients and higher error values in the respective areas.
Overall, ENACTS exhibits the best skill, while ARC2 and CHIRPS underestimate both rainfall amounts. Meanwhile, IMERG consistently performs best in capturing rainfall but sometimes overestimates, while ERA5 tends to overestimate rainfall [72].

3.1.1. Analysis of Simulations: 5 September 2020 vs. 3 September 2021 Rainfall Events

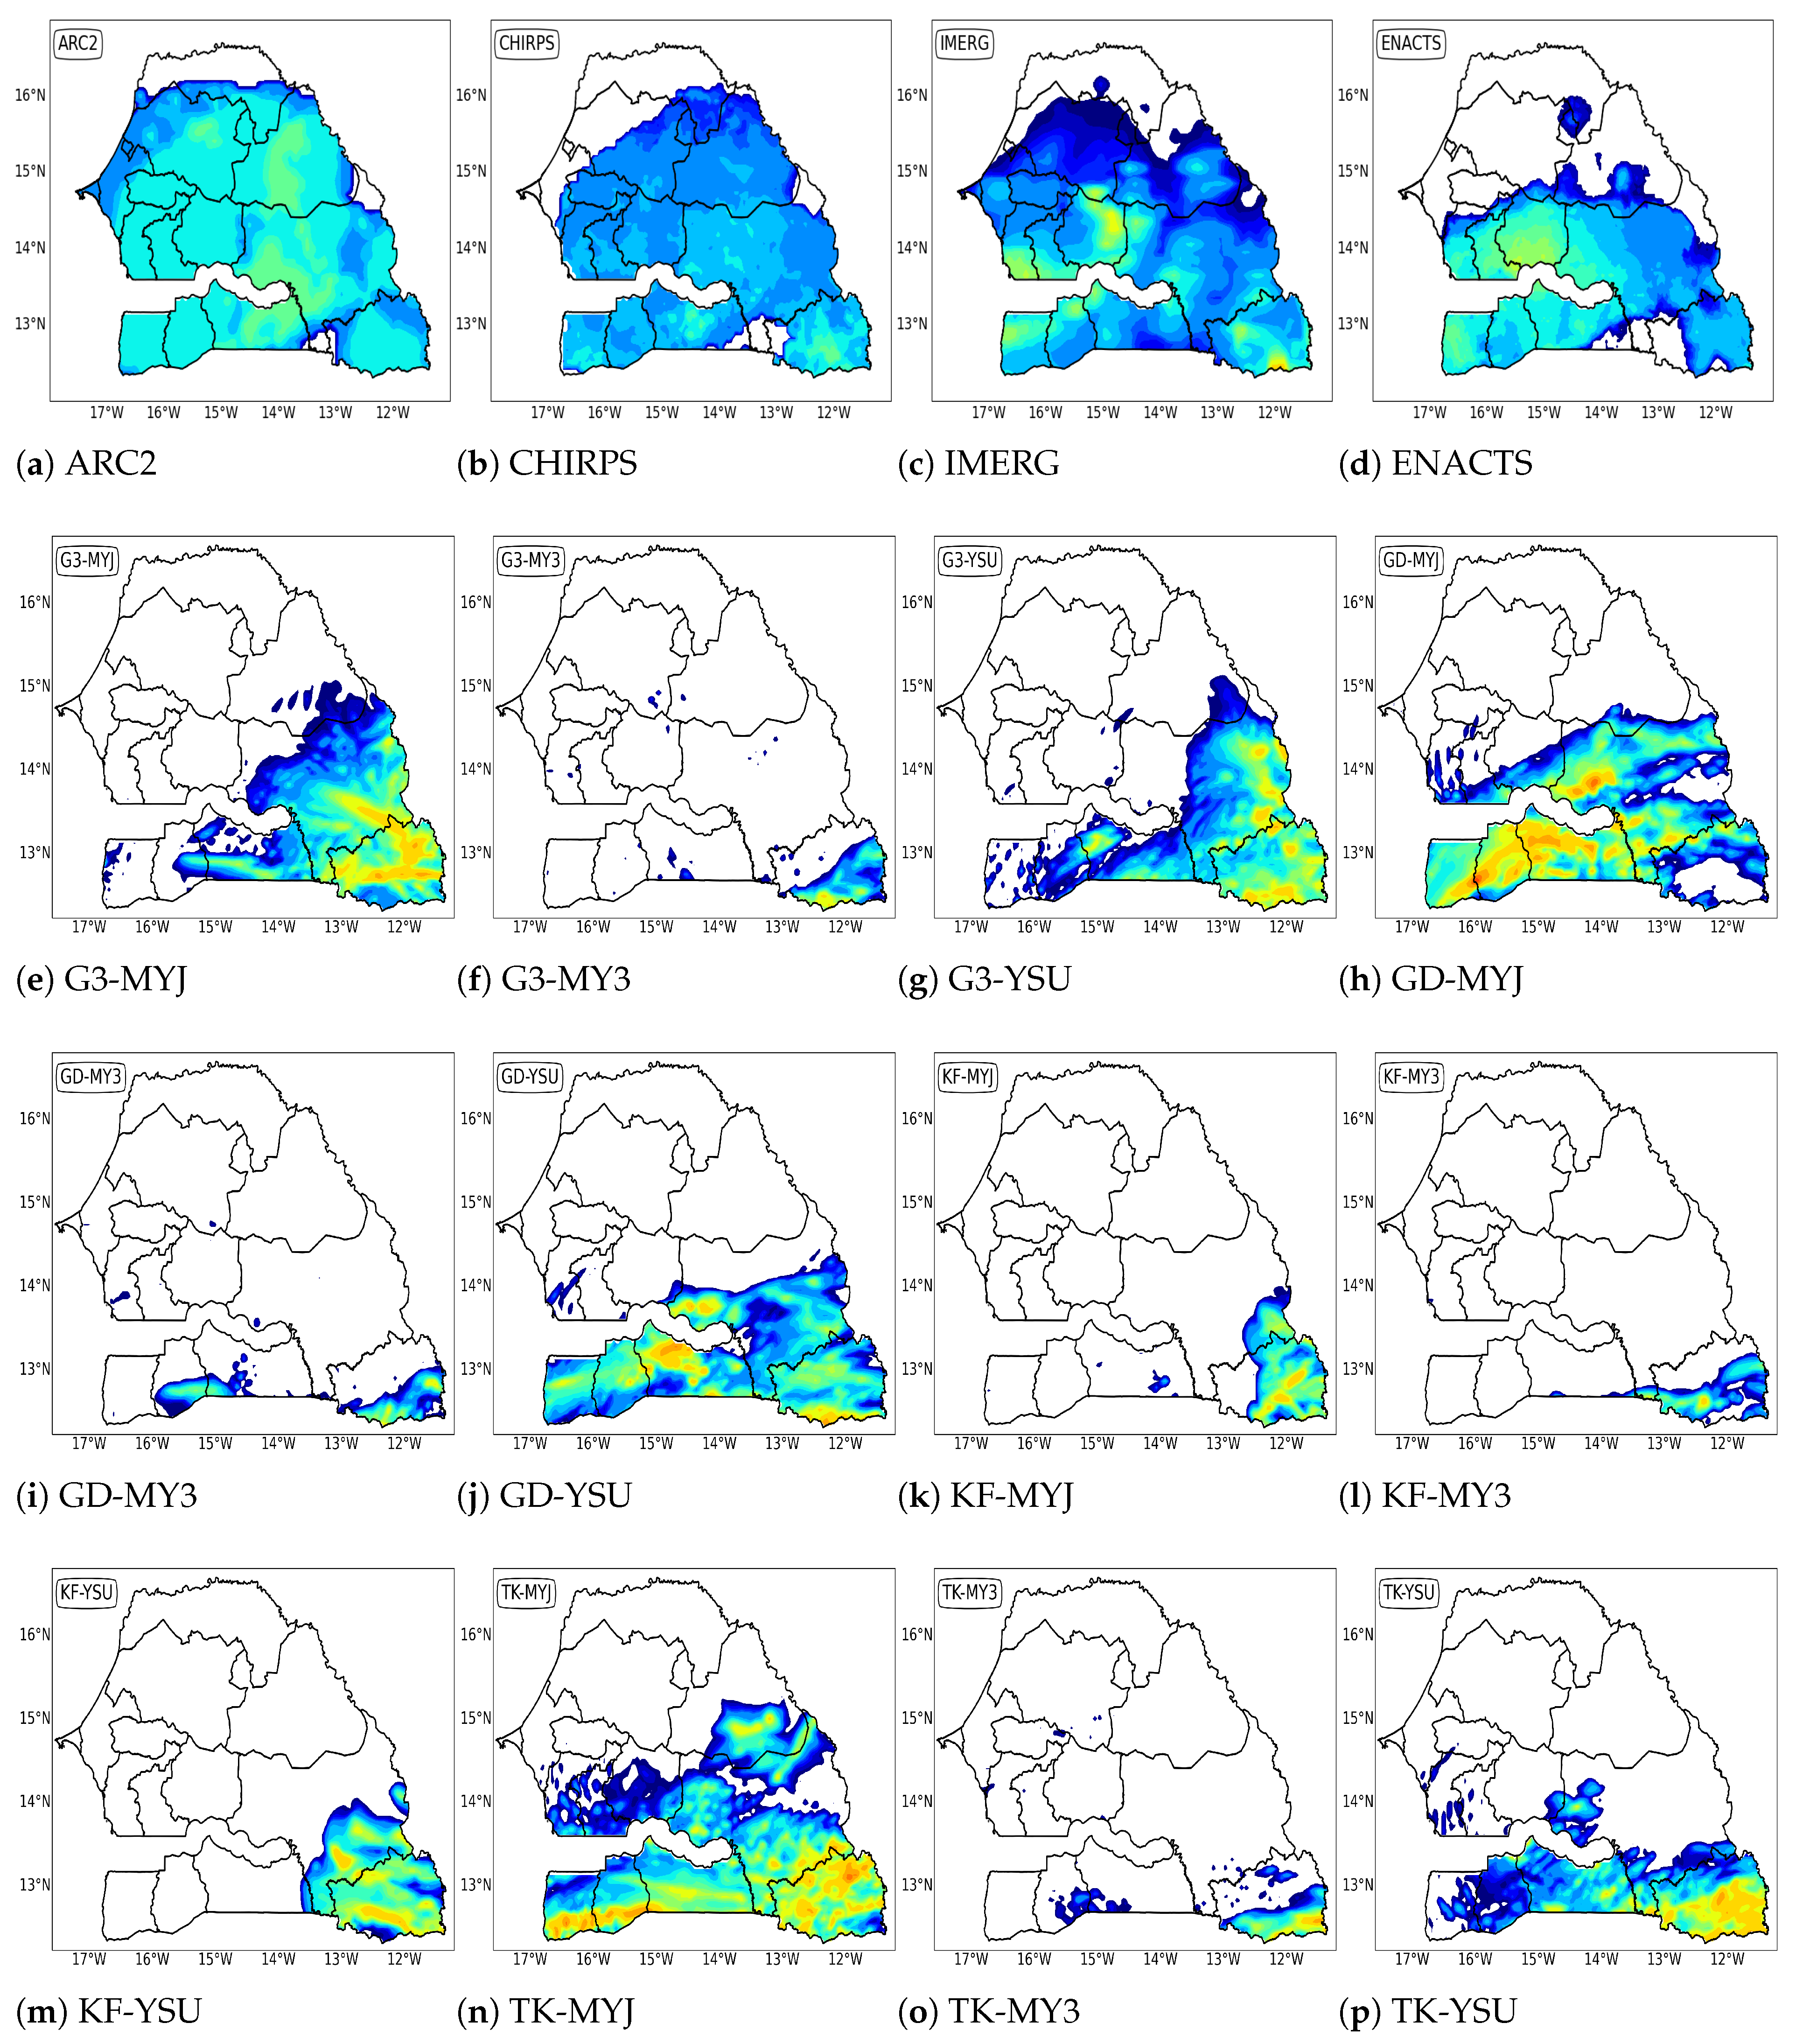
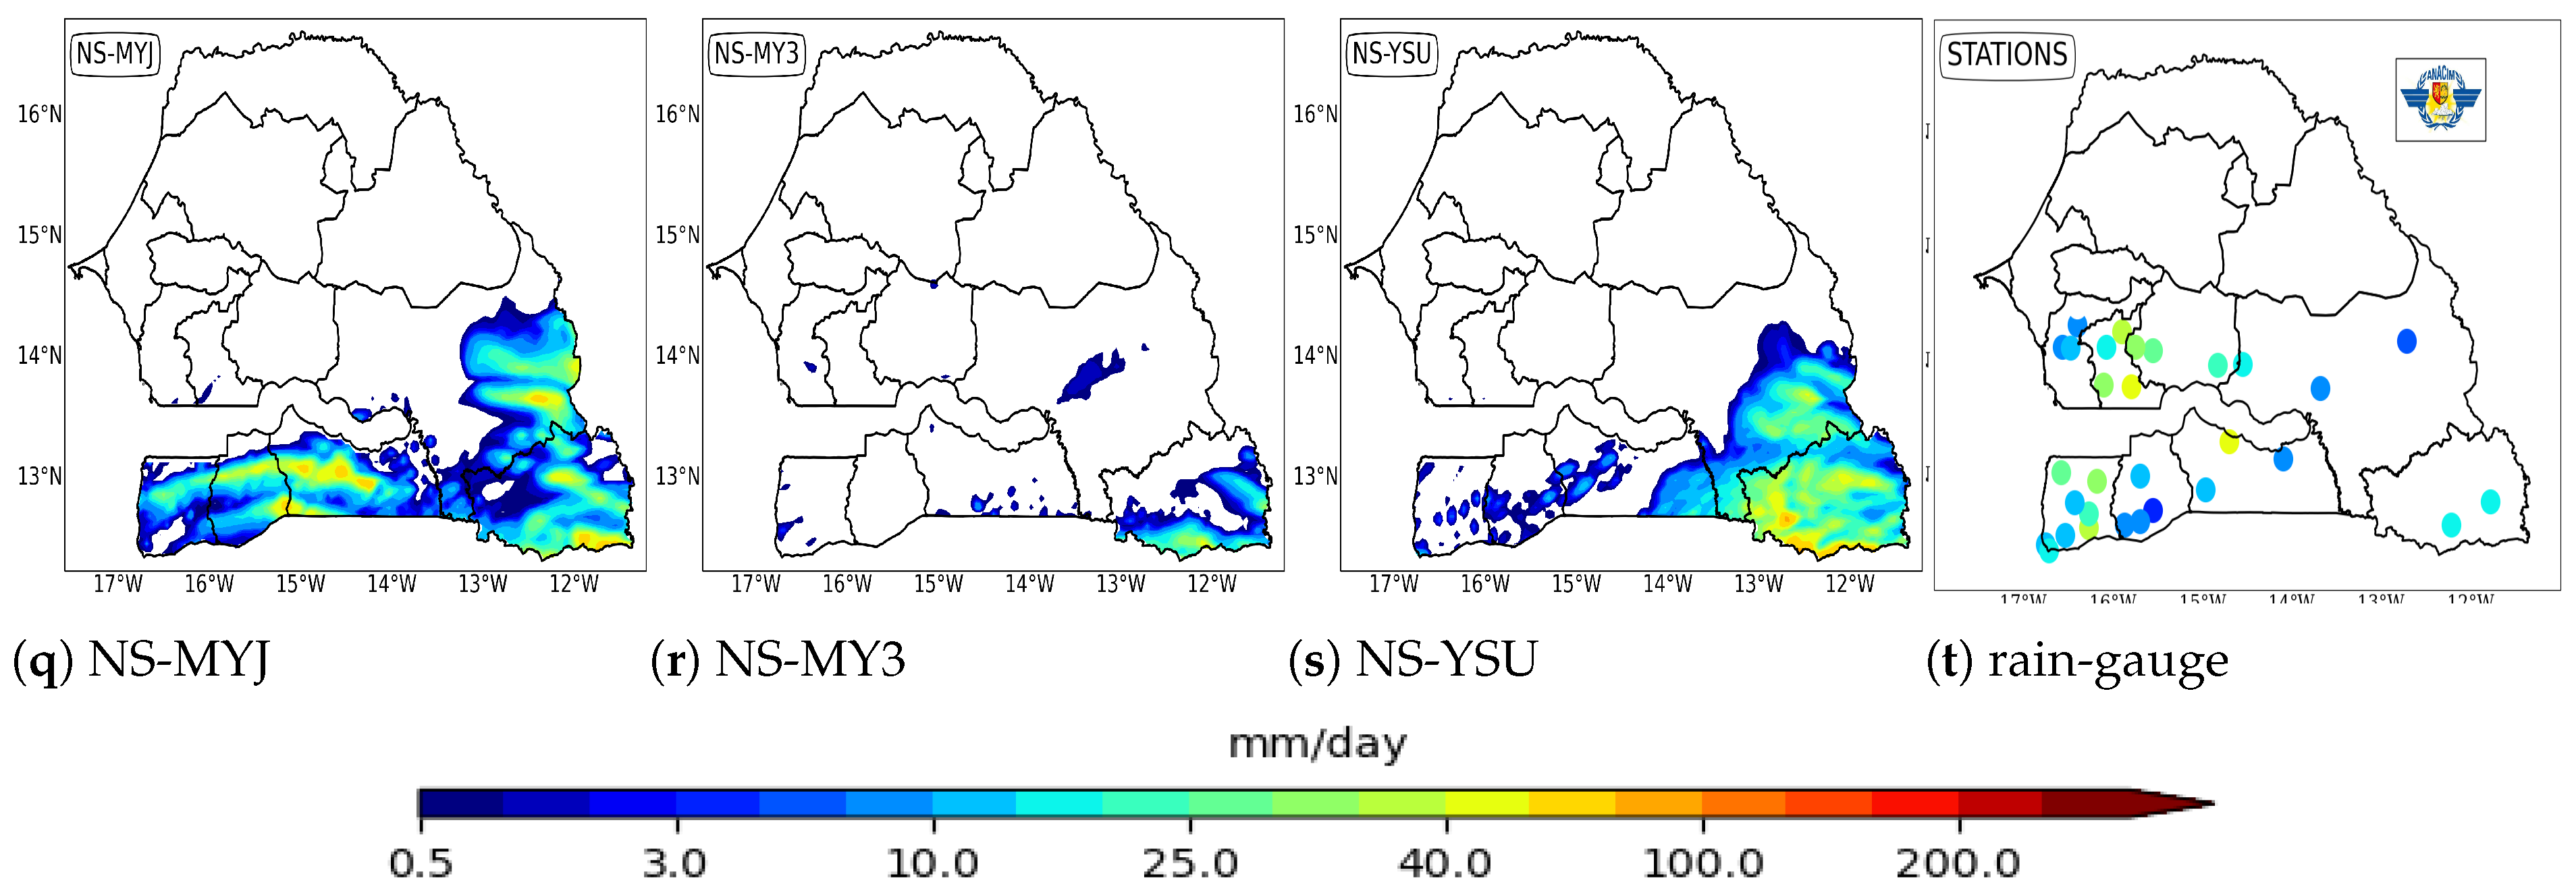
To identify the configurations that provide the best performance when compared to observed data, we conducted simulations of precipitation fields for the 5 September 2020 event using fifteen different configurations of the WRF model. These simulations covered the West African region, with a specific focus on Senegal. The comparison between simulated rainfall fields and observed data is presented in Figure 4.
Figure 4 shows the daily cumulative simulated rainfall by the WRF model at a 3 km resolution (as a reminder, the cumulus parameterization scheme is deactivated). The results indicate a consistent pattern across all the configurations, where precipitation tends to be overestimated in the Center and South zones while underestimated in the North and East areas. Notably, GD-MYJ (CPS associated with the PBL scheme), TK-MYJ, and Tk-YSU exhibit closer alignment with the observed data, displaying better precipitation patterns and greater spatial consistency when compared to the observations. However, these configurations display a dry bias (Figure 5; Table 5).
On the other hand, G3-MY3 fails to simulate precipitation fields accurately in the Center region and shows an overestimation in the south despite good correlation in this region; see Figure 5.
This configuration tends to overestimate precipitation in the southern region, a deviation from the actual observations for this specific event.
Among the WRF configurations tested, GD-MYJ and TK-MYJ demonstrate the highest correlations with observed data, while G3-MY3 shows the lowest. We will proceed with these three configurations in the subsequent stages of this study.
Figure 6 presents a visual representation of skill scores comparing modeled and satellite precipitation estimates for the total precipitation distributions in Senegal.
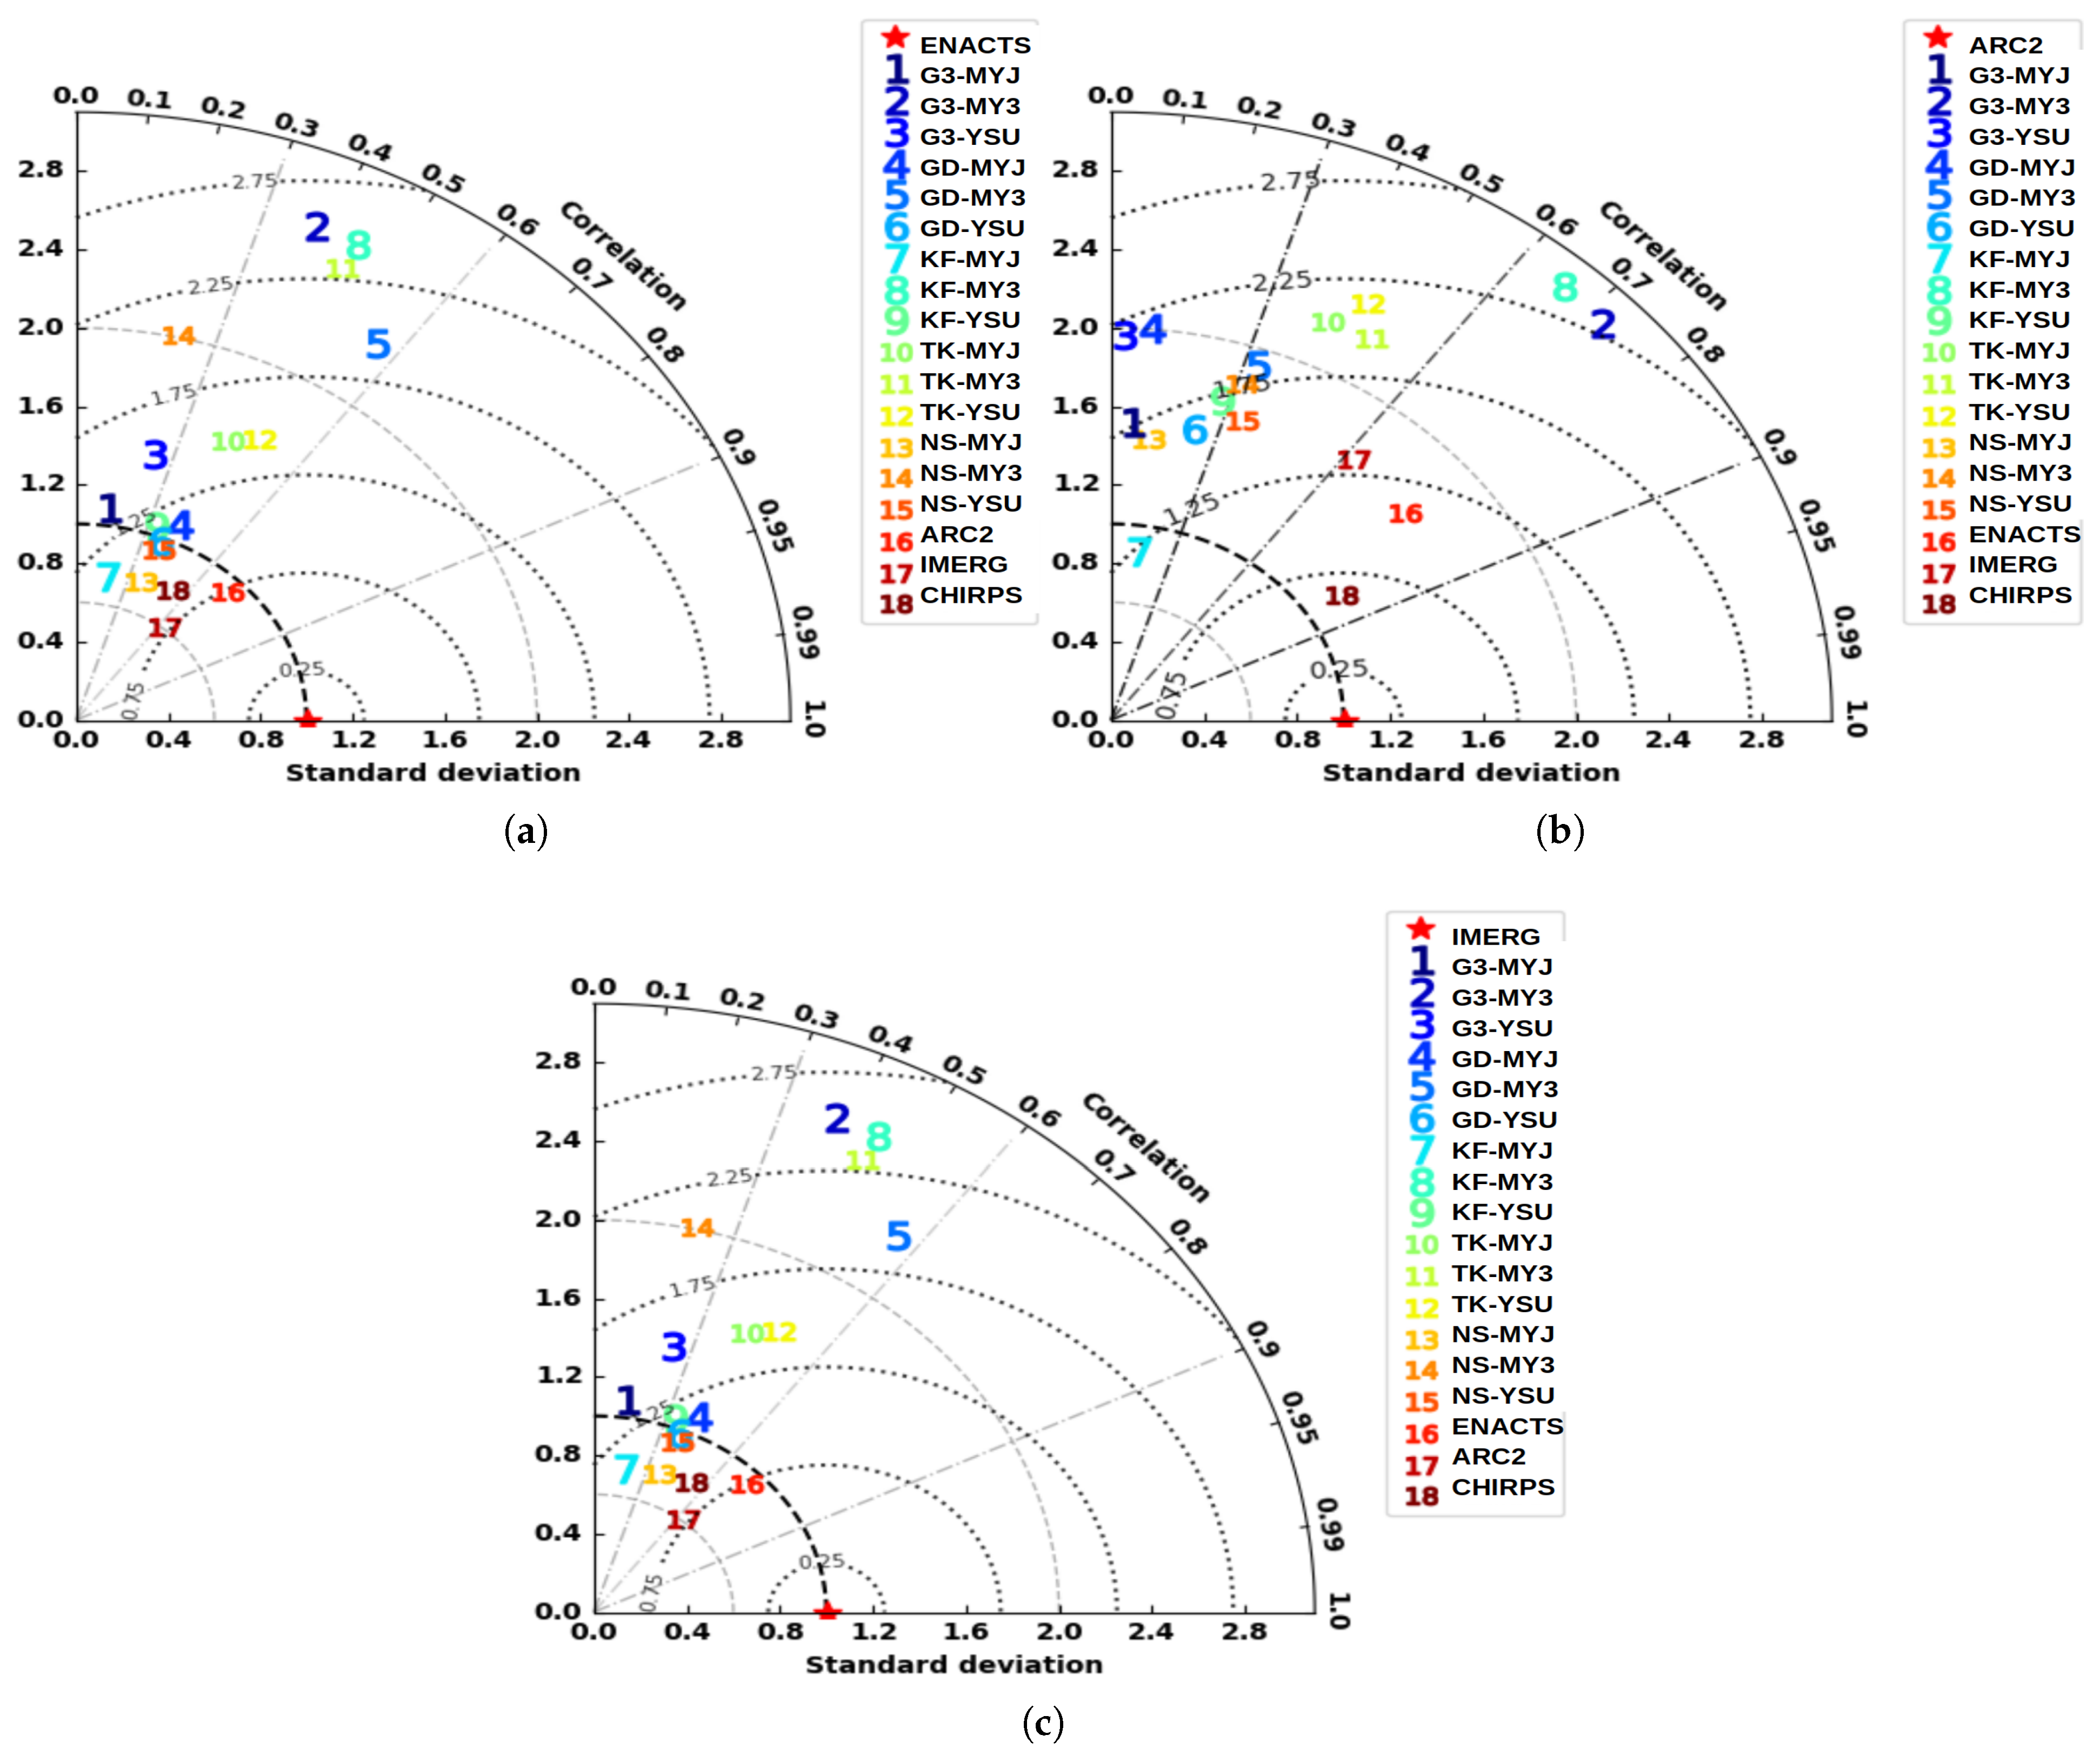
The Taylor diagram (Figure 6a) presents a comparison between WRF model outputs and satellite-based precipitation estimates, using ENACTS data as a reference. In this diagram, the radial distance represents the normalized standard deviation ( σ ), while the azimuthal angle indicates the spatial correlation coefficient (r) between WRF simulations and ENACTS. Dotted semicircles denote the normalized centered root-mean-square differences. Figure 6b,c extend this comparison to other satellite products, namely ARC2 and IMERG. Each diagram summarizes the performance of 15 WRF configurations and includes CHIRPS as a secondary benchmark.
In terms of correlation, the WRF configurations achieve moderate agreement with ENACTS, with r values ranging from 0.27 to 0.62 (Figure 6a). Comparatively, the performance against ARC2 (Figure 6b) shows a wider spread ( r = 0.05 –0.72), while IMERG (Figure 6c) yields intermediate results ( r = 0.1 –0.58).
Configuration 12 (TK-YSU) consistently shows the highest spatial correlation with ENACTS ( r = 0.63 ), and both TK-MYJ and TK-YSU perform well across all three satellite datasets, with r values frequently between 0.4 and 0.63.
CHIRPS systematically outperforms all the WRF configurations, exhibiting the highest correlation scores with each reference dataset: 0.77 with ENACTS, 0.84 with ARC2, and 0.50 with IMERG. Additionally, CHIRPS maintains favorable normalized standard deviations ( σ ), typically between 0.4 and 1.0, indicating strong agreement in variability as well as spatial pattern. In contrast, most WRF configurations show σ values between 1.0 and 1.8, suggesting a tendency to overestimate precipitation variability, consistent with the high resolution. Configurations using the MYNN3 planetary boundary layer scheme (e.g., G3-MY3, GD-MY3, KF-MY3, TK-MY3, and NS-MY3) display the highest σ values, often exceeding 2. Despite this, some of these setups still achieve relatively high correlation scores, highlighting a trade-off between variance and spatial pattern accuracy.
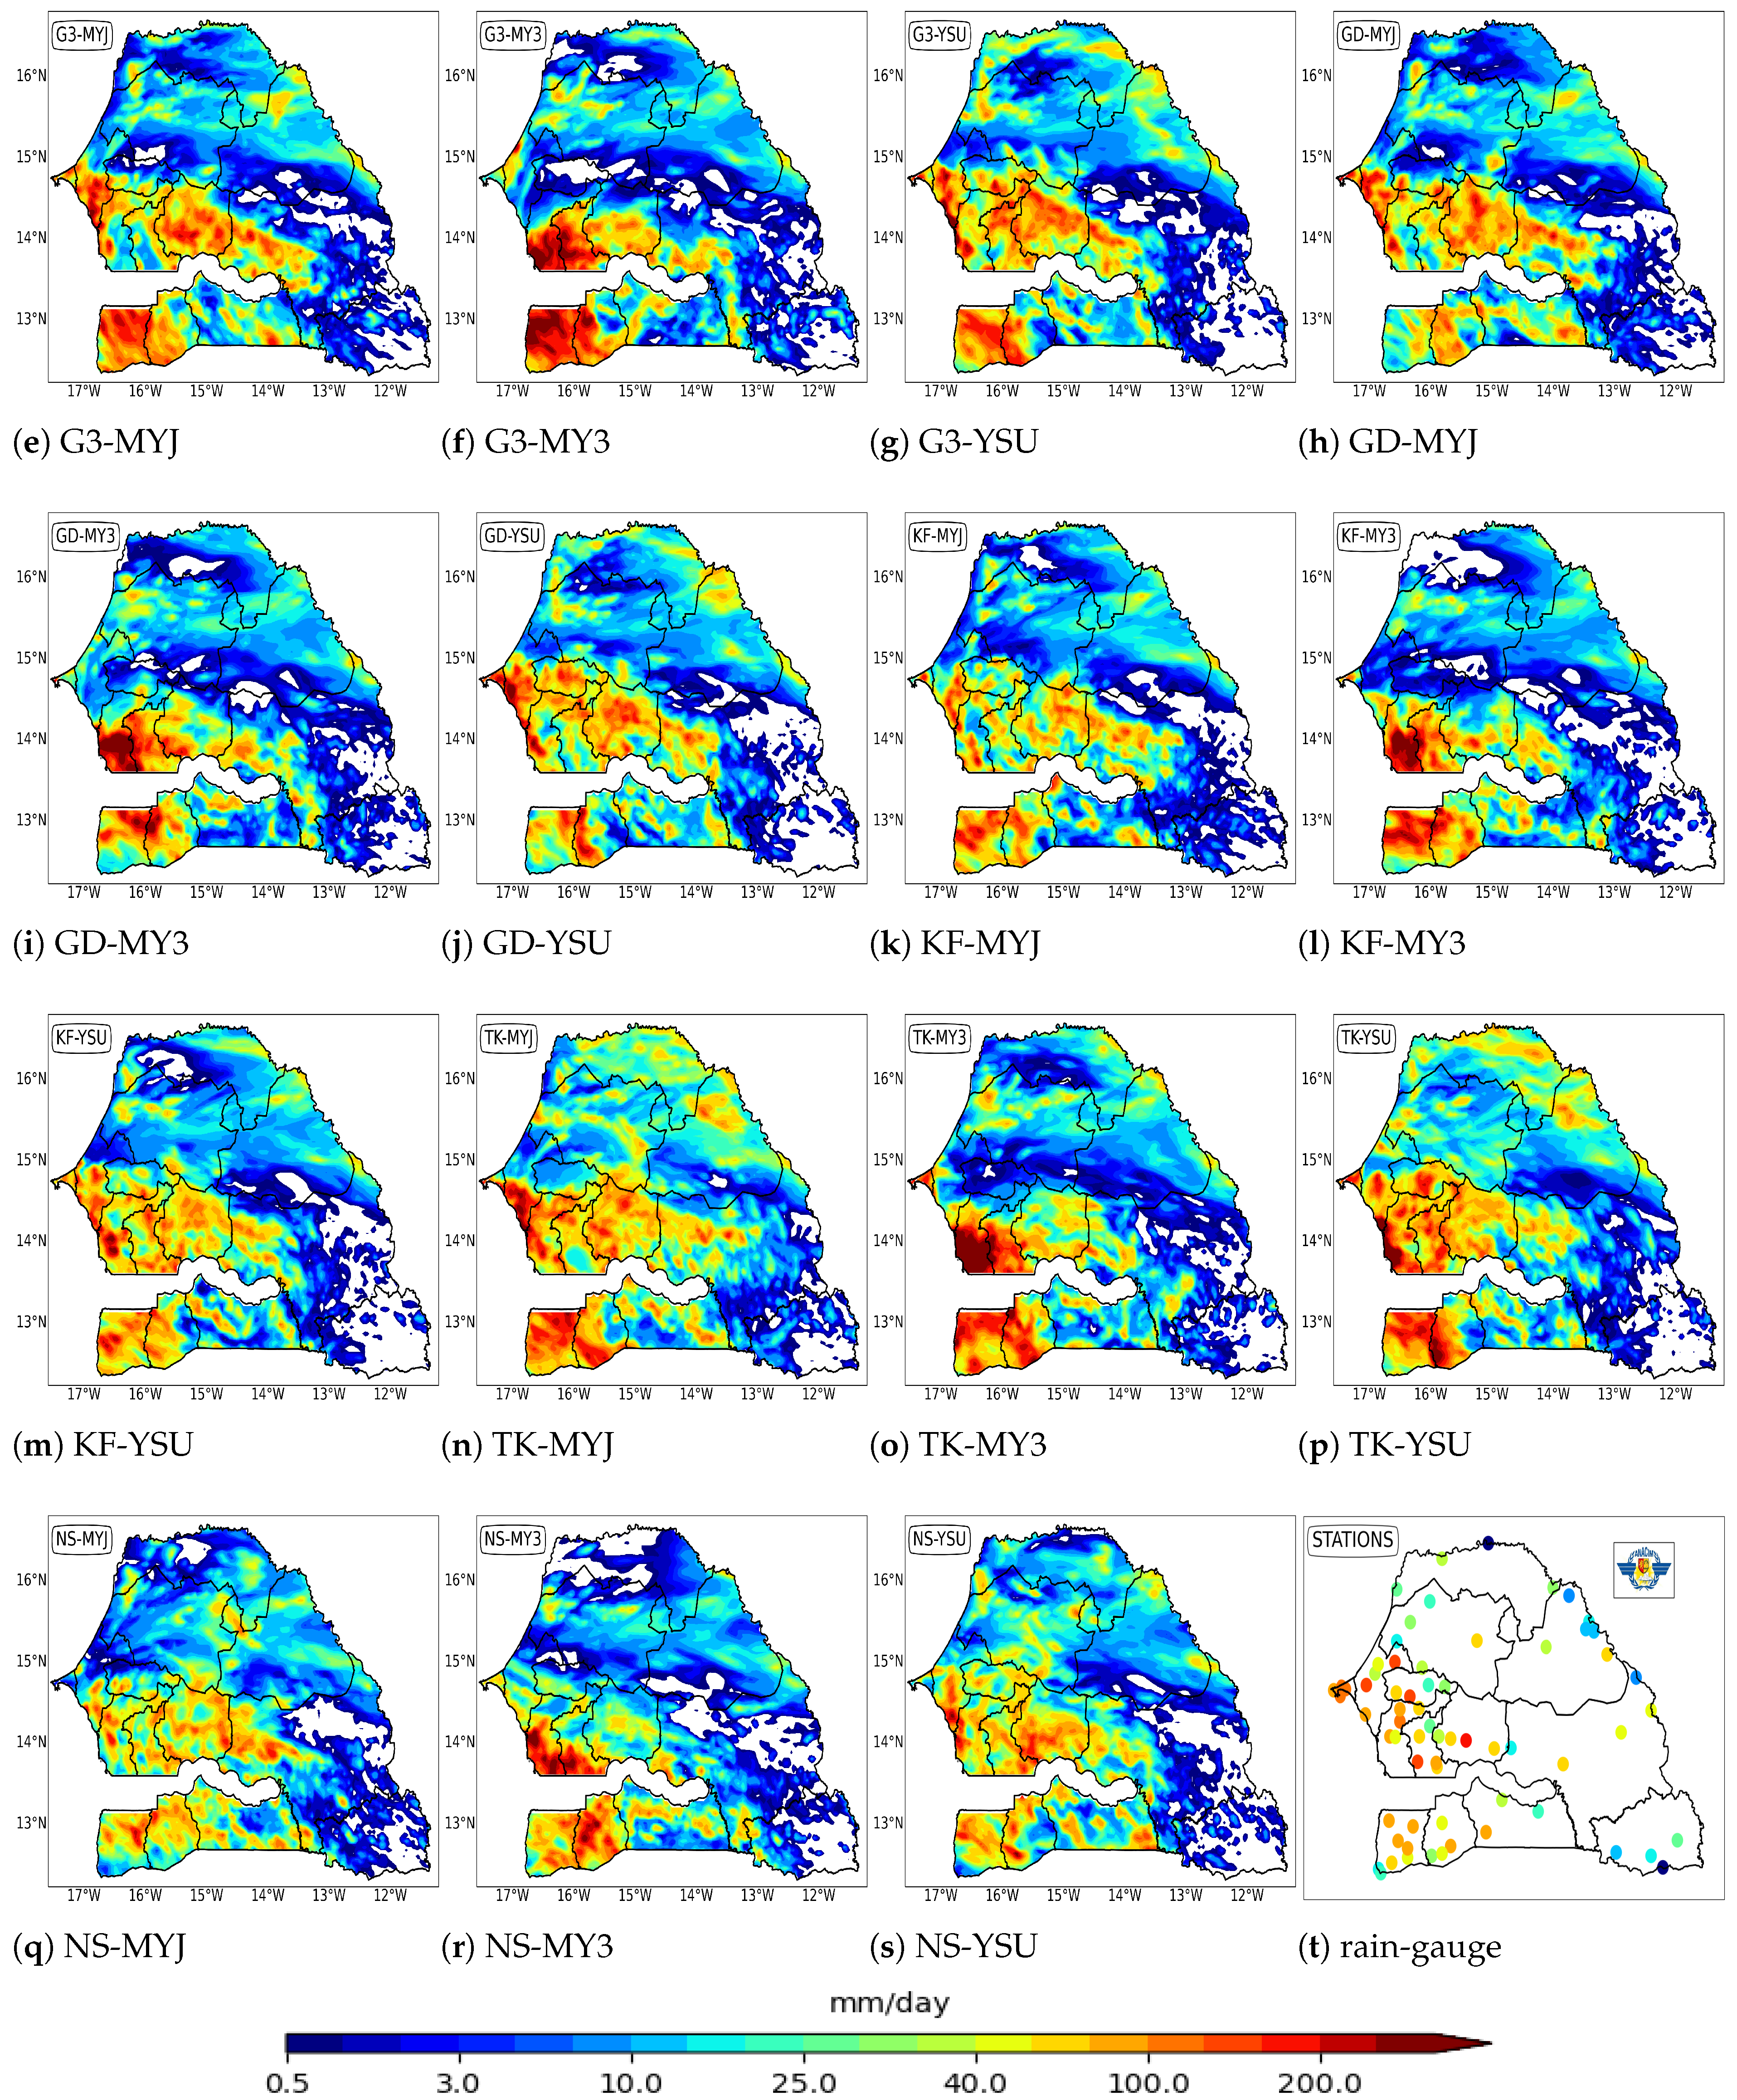
While the main analysis focuses on the extensive and intense rainfall event of 5 September 2020, presented in detail above, a second event of a more localized and moderate nature was also examined for comparison. This additional case is presented in Appendix A (Figure A1 and Figure A2) to highlight the contrasting behavior of the WRF model under different rainfall regimes.
Over West Africa, and in the tropics more generally, rainfall exhibits strong variability at the daily scale. It is therefore essential to assess which WRF configurations are capable of capturing such drastic shifts, ranging from highly convective systems to weak or localized convection. To this end, WRF simulations were carried out for the 3 September 2021 event, which was characterized by localized convective activity and moderate rainfall, mainly affecting the Center and South regions of Senegal.
Figure A1 shows the daily cumulative rainfall simulated at a 3 km resolution. The results indicate that all the configurations had difficulty accurately reproducing the observed rainfall distribution. Interestingly, even satellite observations failed to capture this event with precision. However, GD-MYJ, GD-YSU, and TK-MYJ stood out by delivering relatively better performance, as reported in Table 5, with closer agreement to the observed data.
Further insights are provided in Figure A2, which highlights the differences in the performance of these configurations. TK-MYJ tends to overestimate rainfall in the East zone but more accurately reproduces the rainfall pattern in the Center zone. In contrast, GD-MYJ shows a good overall correlation, although it fails to capture the maximum rainfall in the Center area as well as TK-MYJ.
This analysis highlights the challenges of simulating localized convective rainfall events and the limitations shared by both models and satellite products in such contexts. Nevertheless, GD-MYJ and TK-MYJ demonstrate relatively promising performance when compared to the other configurations.

3.1.2. Evaluation of WRF Model Performance on Diurnal Cycles

To assess the ability of the WRF model to reproduce key atmospheric processes, we examine the thermodynamic characteristics of the simulations over Senegal. The analysis focuses on four major climatic zones (North, East, South, and Center) and four representative stations (Saint-Louis, Tambacounda, Ziguinchor, and Dakar-Yoff), as shown in Figure 2.
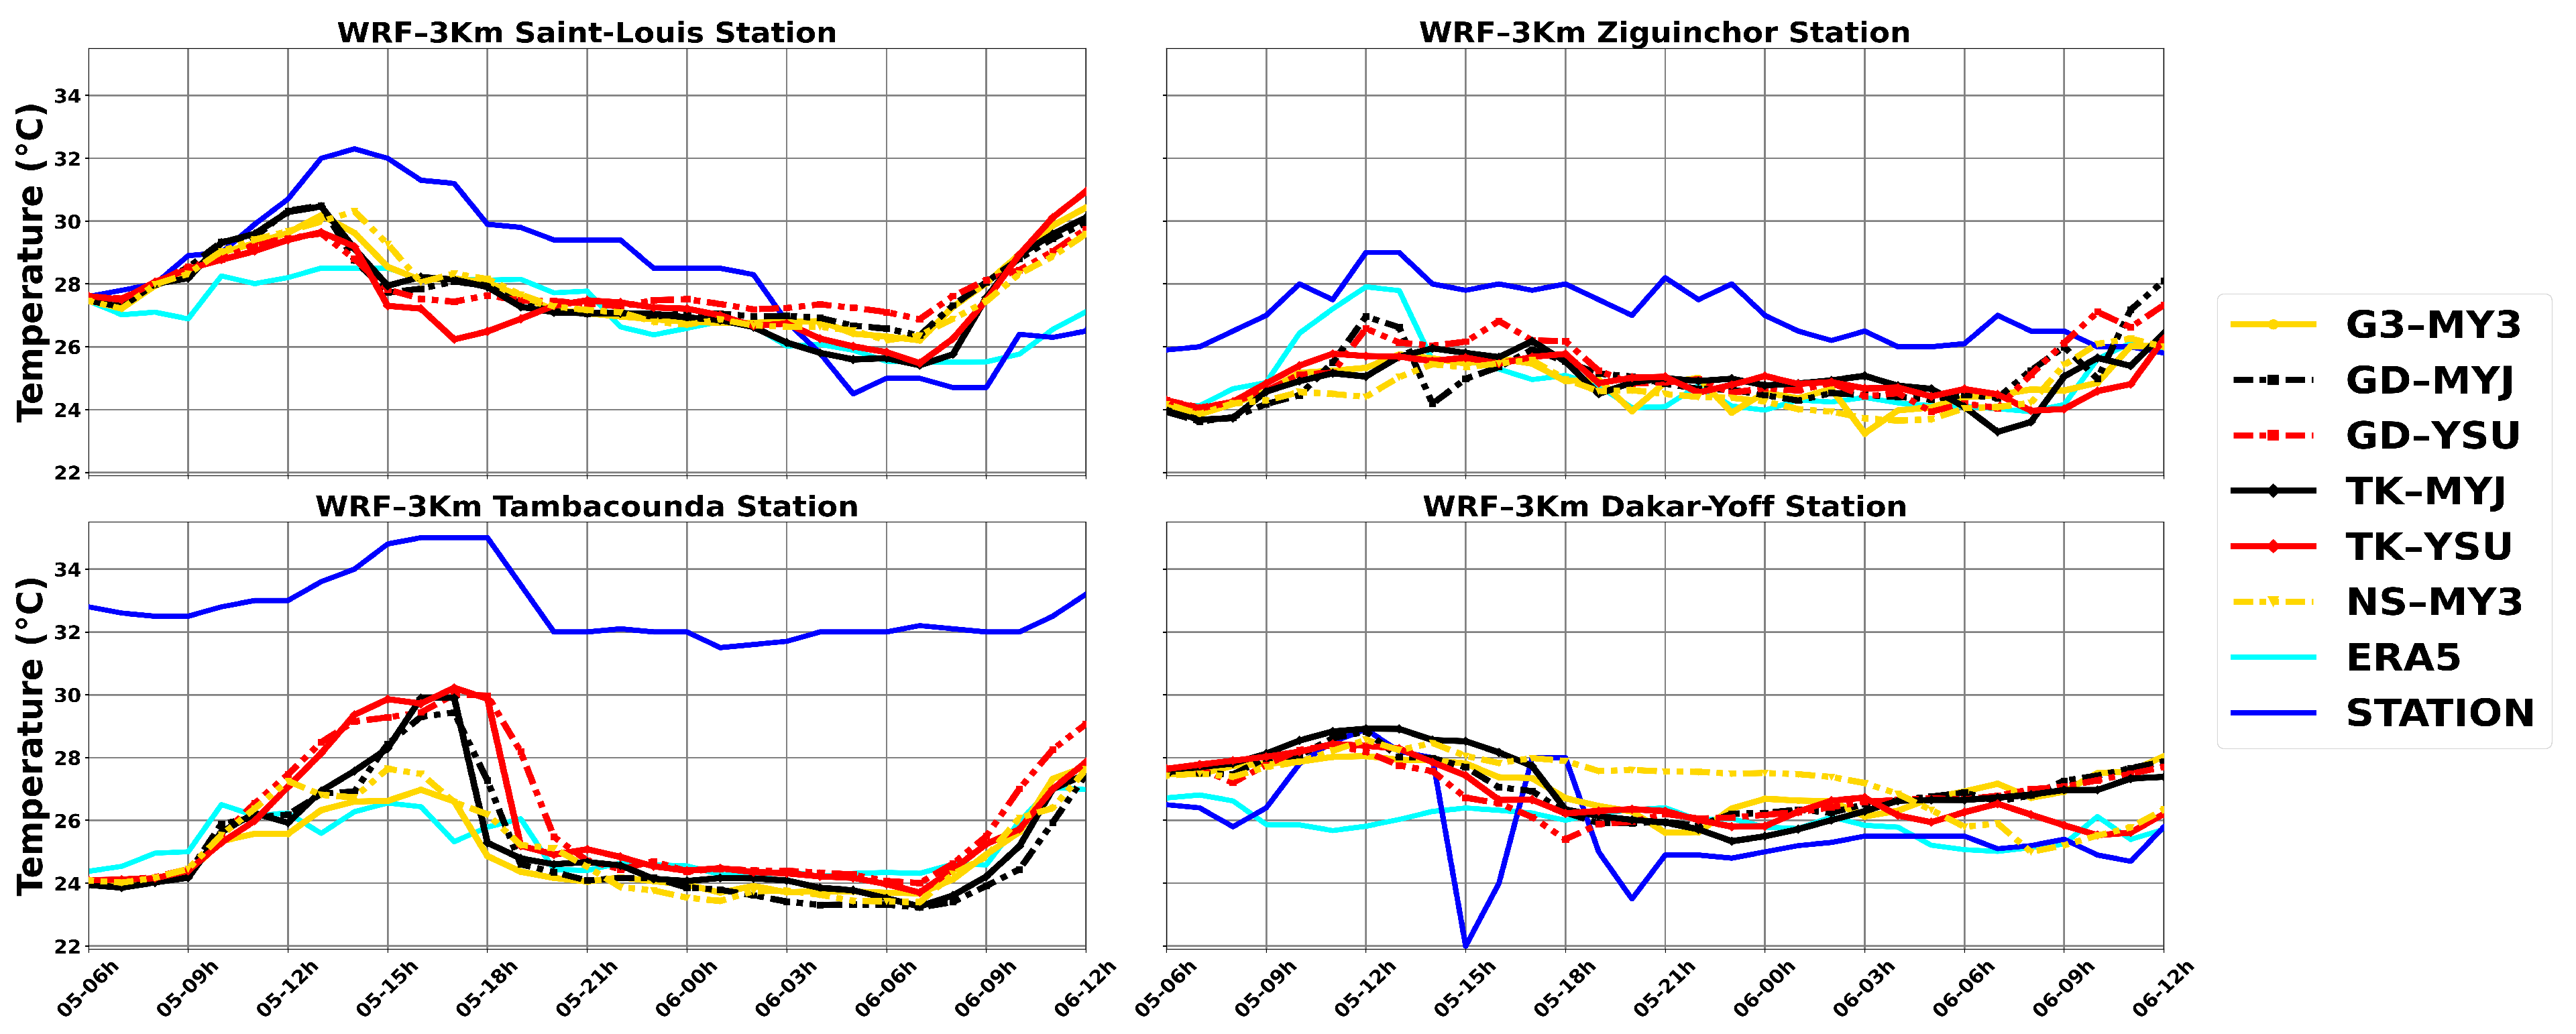
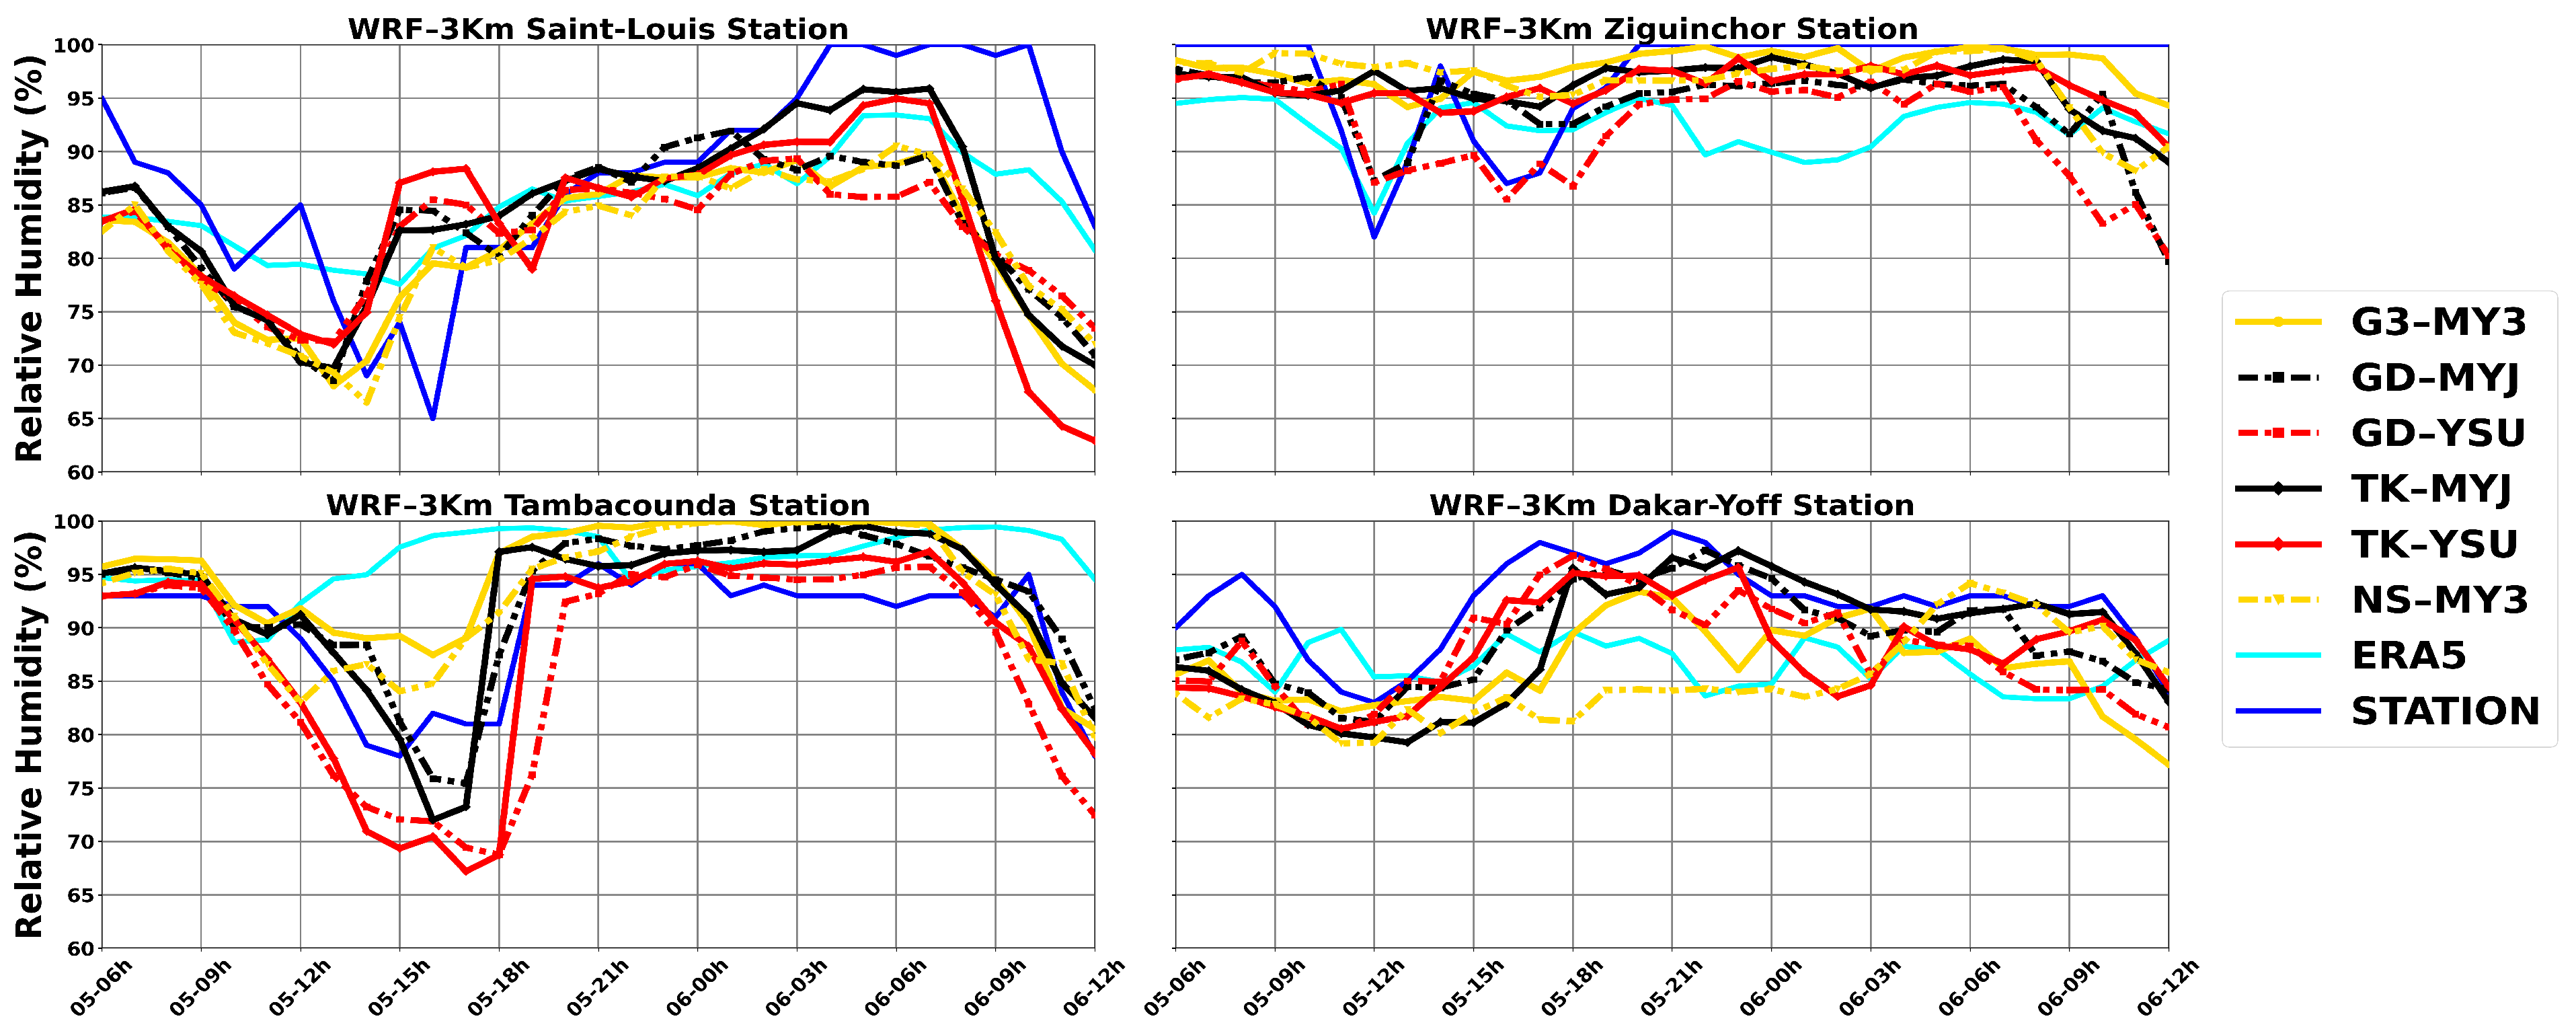
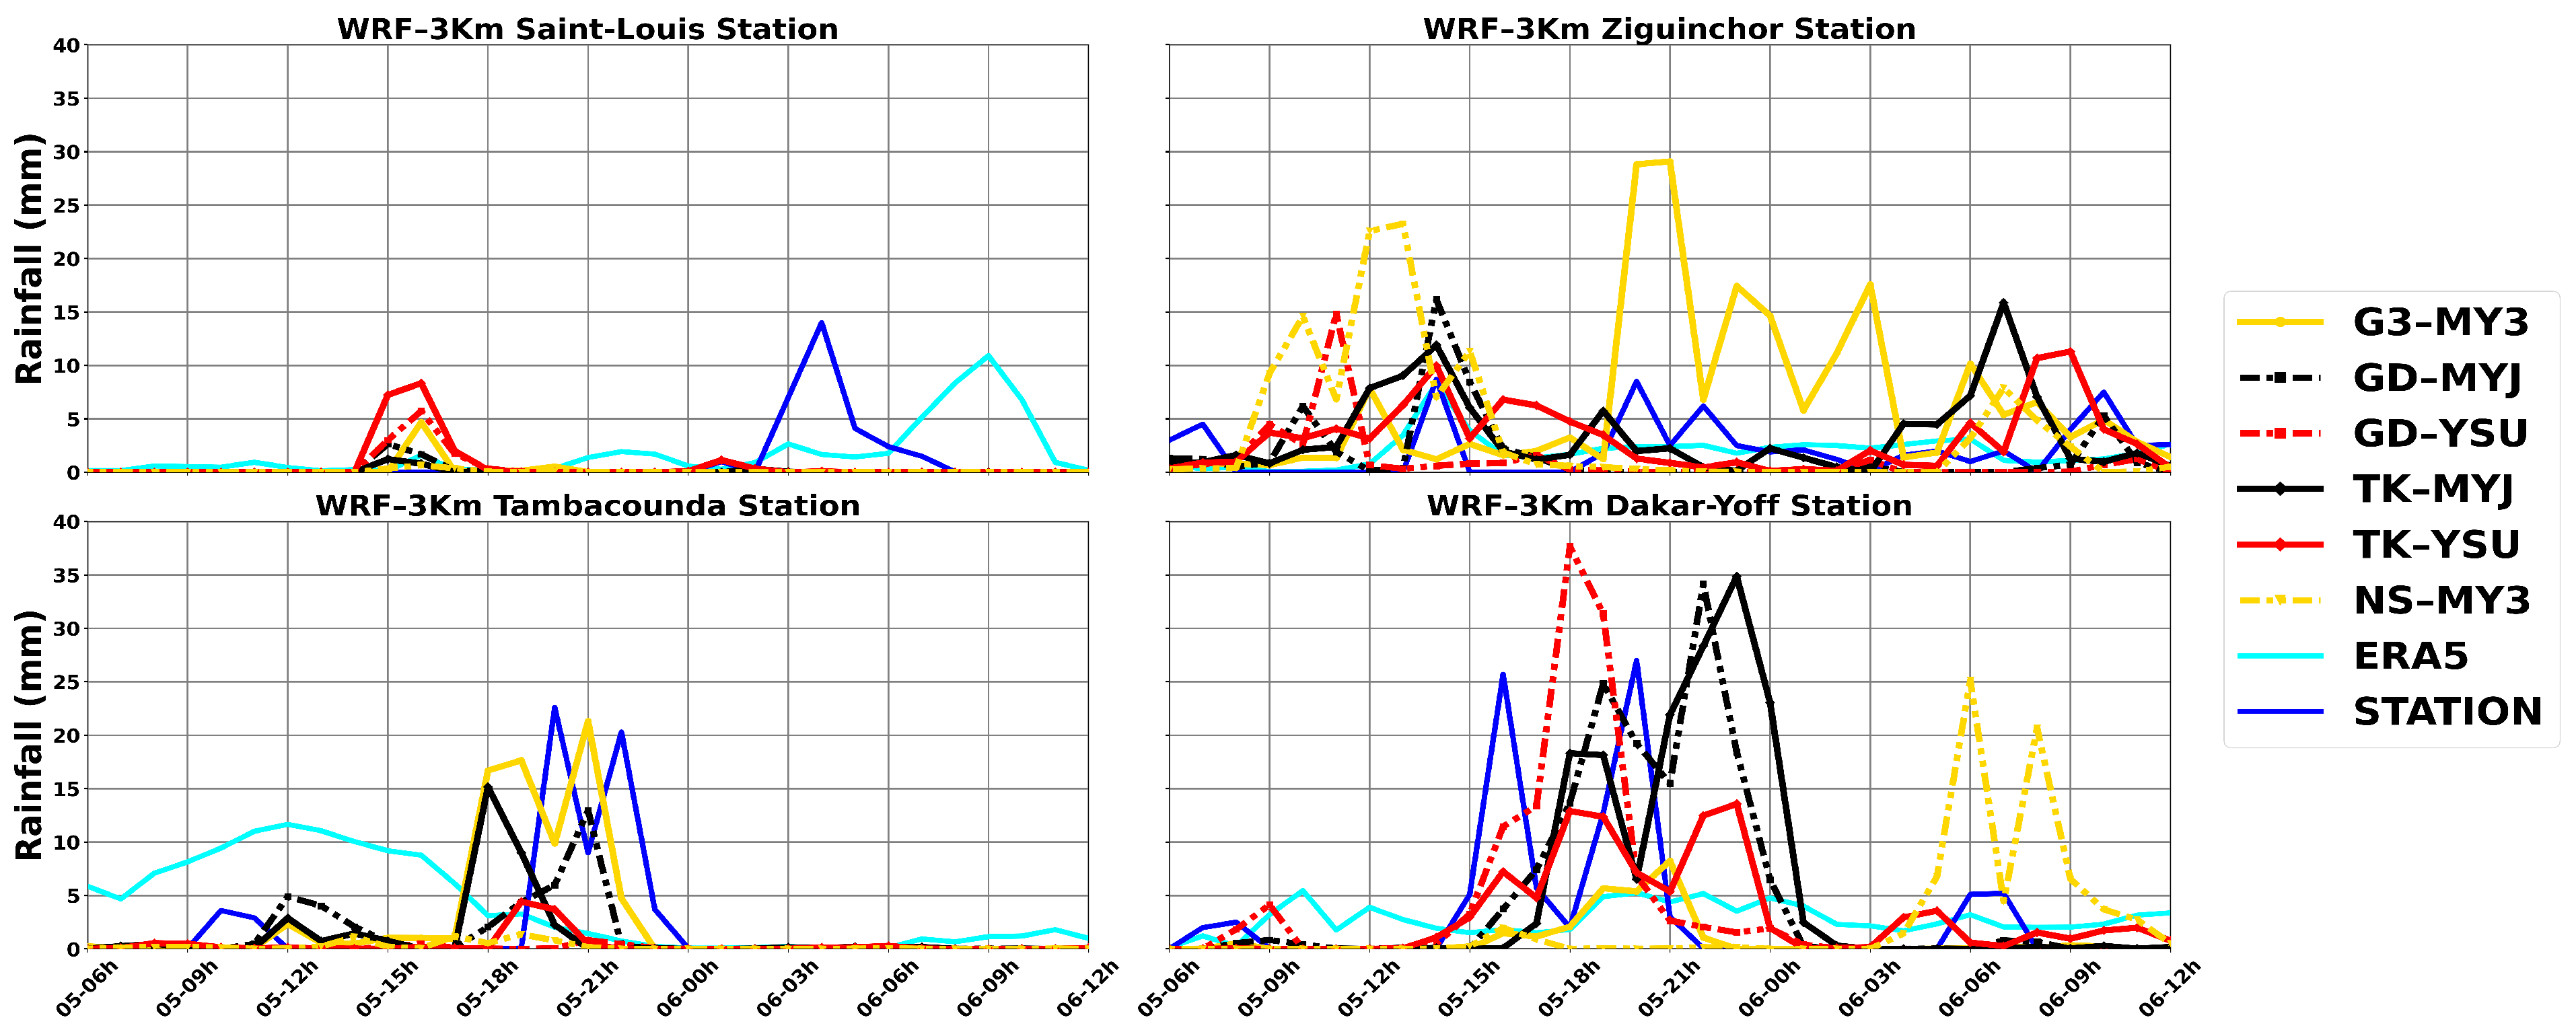
Figure 7, Figure 8, Figure 9, Figure 10 and Figure 11 display the diurnal evolution of selected meteorological variables, namely temperature, relative humidity, and rainfall, over a 30 h period from 06:00 on 5 September to 12:00 on 6 September. The outputs are presented either as spatial averages over the selected zones or as point values at individual stations.
Figure 7 shows the simulated temperature patterns. These exhibit a typical diurnal cycle, with a minimum around 06:00 UTC and a peak near 15:00 UTC, reflecting the influence of solar radiation. The amplitude and phase of the temperature cycle differ slightly among the zones, highlighting regional contrasts in surface–atmosphere interactions.
Almost all the WRF configurations, along with ERA5, display consistent structural behavior across all the zones. However, they tend to underestimate temperature compared to the station observations, with the exception of Dakar-Yoff, as shown in Figure 8. Notably, configurations using the MYNN3 planetary boundary layer (PBL) scheme show the lowest temperature values and are generally closer to the ERA5 outputs.
Figure 9 presents the diurnal evolution of 2 m relative humidity. Unlike temperature, relative humidity follows a pronounced daily cycle, with maximum values around 06:00 UTC and minimum values near 15:00 UTC. The WRF configurations generally underestimate spatially averaged relative humidity when compared to ERA5. Nonetheless, this underestimation is relatively minor and primarily occurs before 12:00 UTC when compared to ground station data, as illustrated in Figure 10.
Rainfall time series, shown in Figure 11, reveal diverse patterns among the WRF configurations at the selected stations. Precipitation peaks typically coincide with a drop or minimum in temperature, indicating convective activity. However, some configurations exhibit a lag in rainfall timing or overestimate precipitation intensity. Despite these discrepancies, GD-MYJ, GD-YSU, TK-MYJ, and TK-YSU provide rainfall estimates that are closer to the observations in both magnitude and timing. These results demonstrate that WRF configurations are capable of detecting and simulating intense rainfall episodes, even though they may occasionally underestimate or overestimate precipitation amounts.
In summary, the time series comparison between the WRF simulations and observational data suggests that planetary boundary layer schemes exert the highest influence on temperature and relative humidity, in agreement with the findings of [23]. Additionally, configurations that share the same PBL scheme tend to produce consistent thermal and moisture profiles. In contrast, cumulus parameterization schemes appear to play a more decisive role in modulating rainfall amounts, consistent with the results reported in previous sensitivity studies [24,63,73].

3.1.3. Evaluation of WRF-Simulated Atmospheric Dynamics Across Multiple Vertical Levels

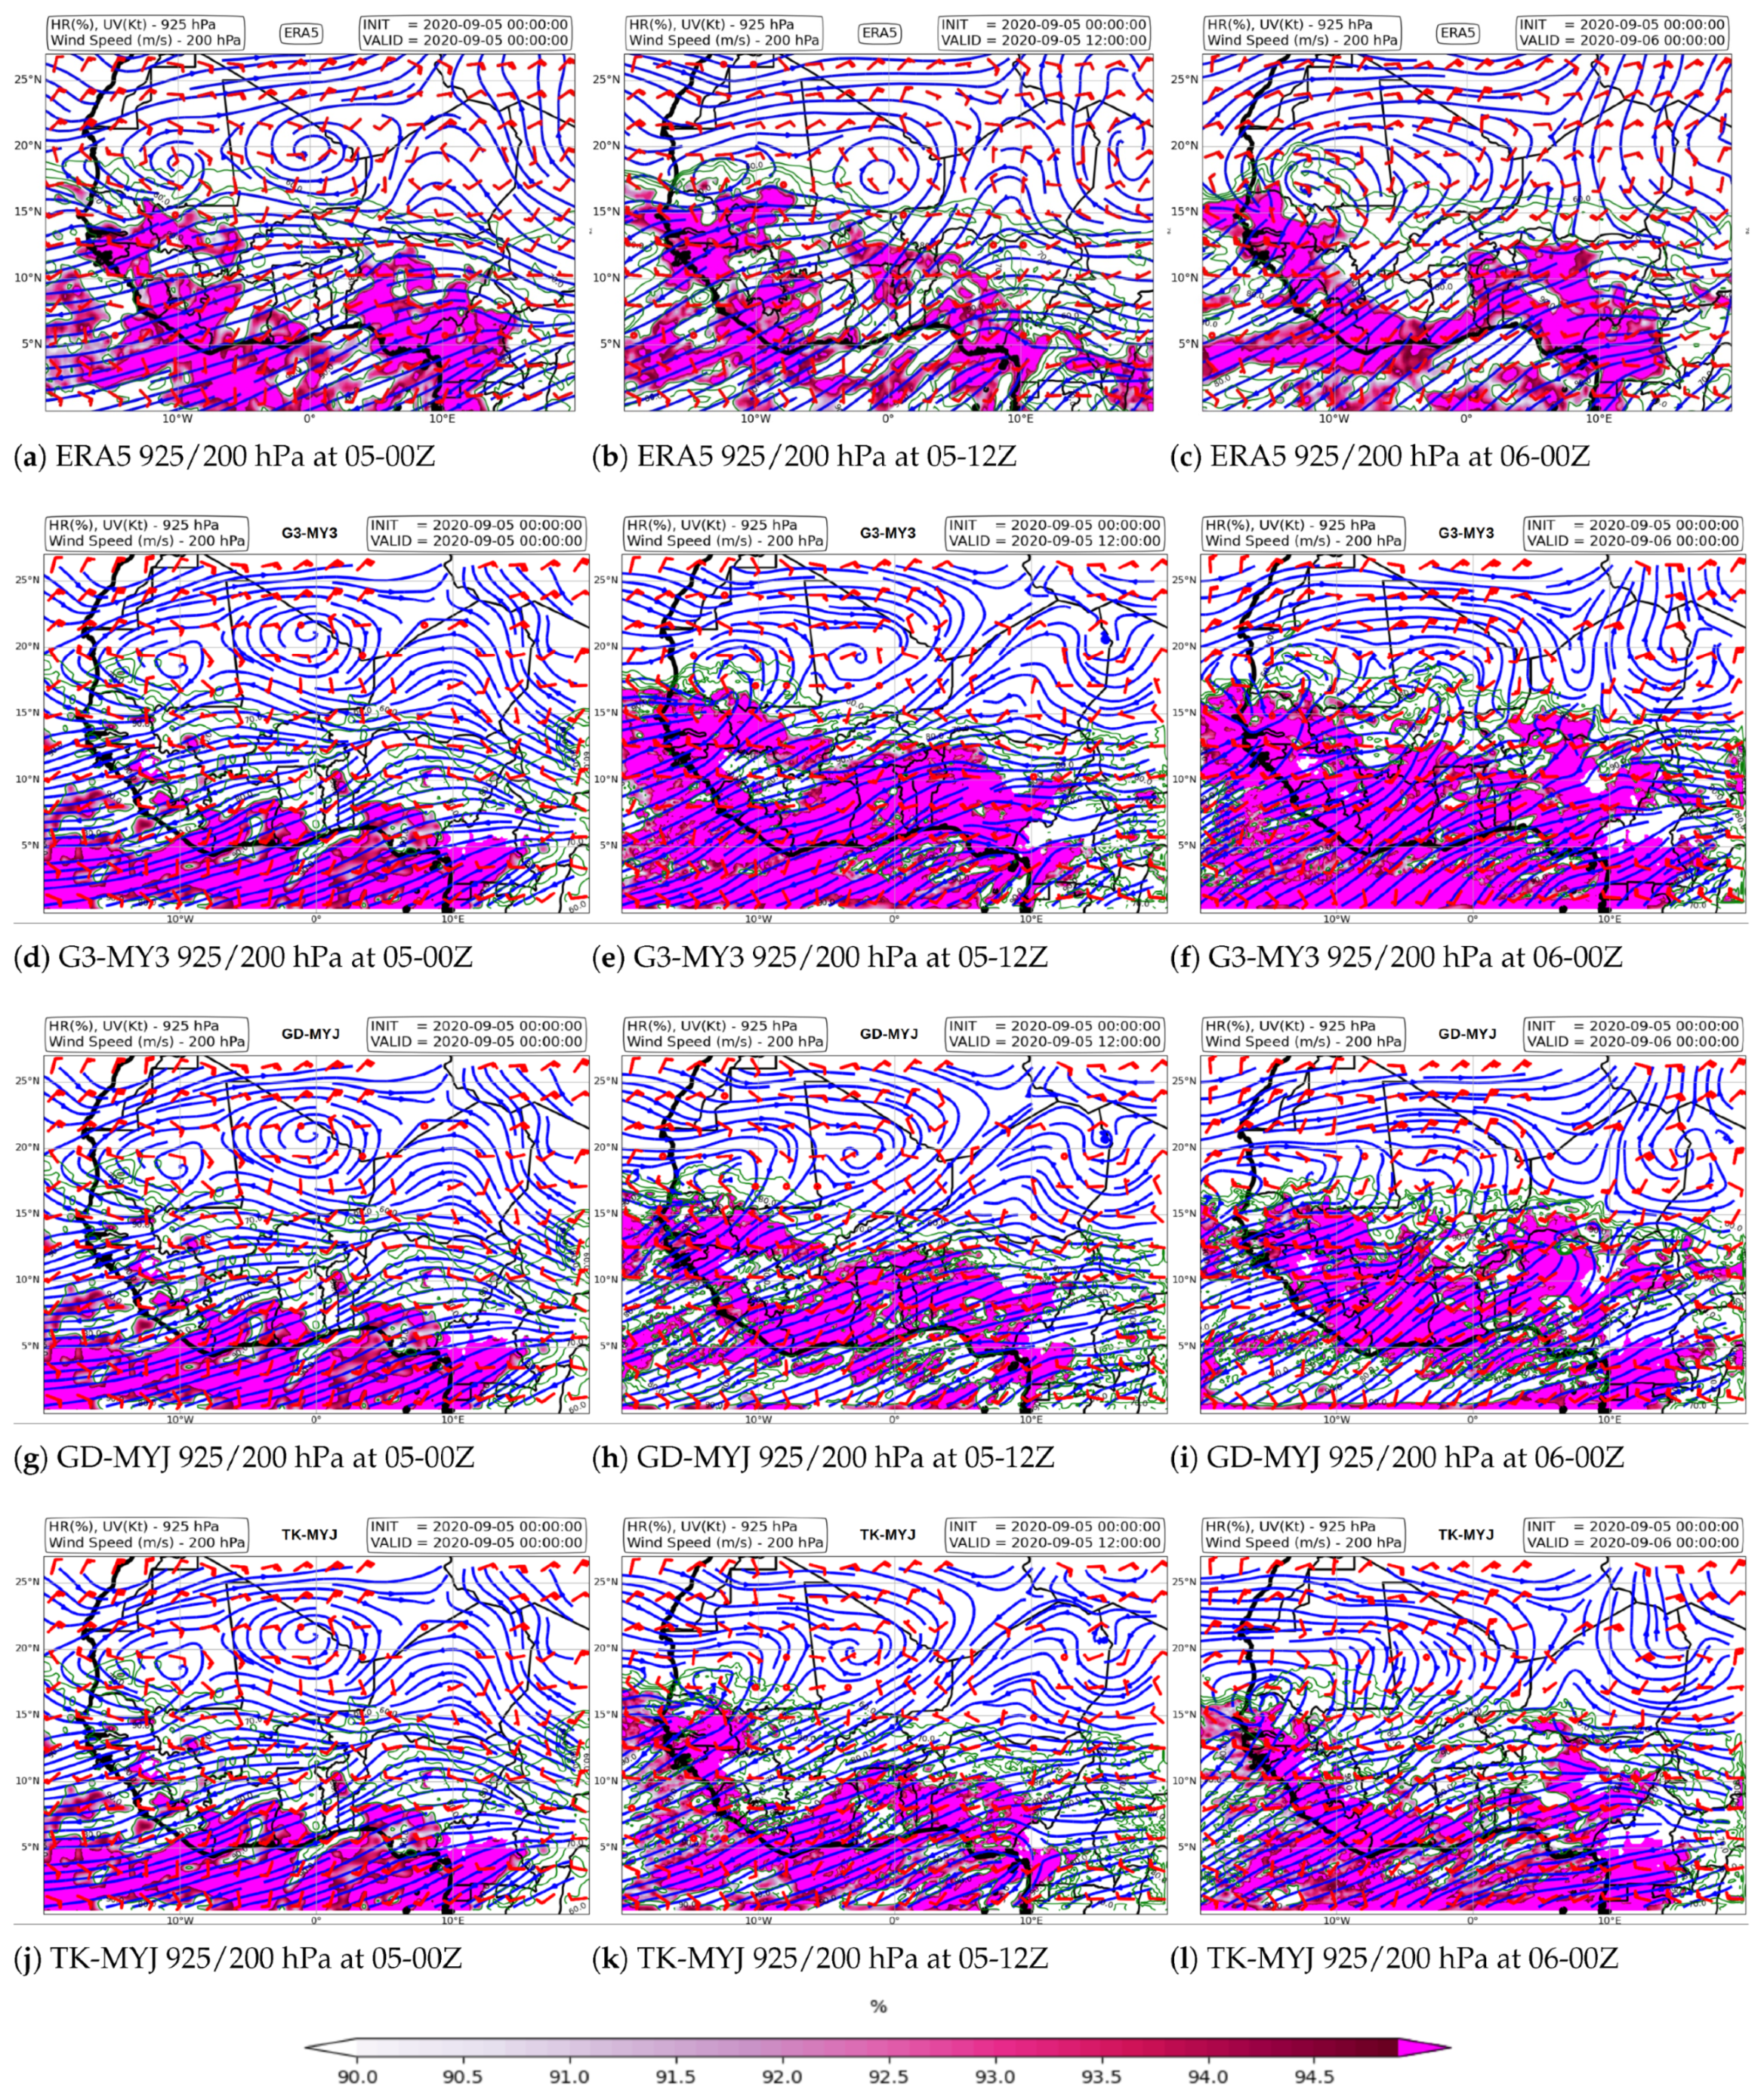
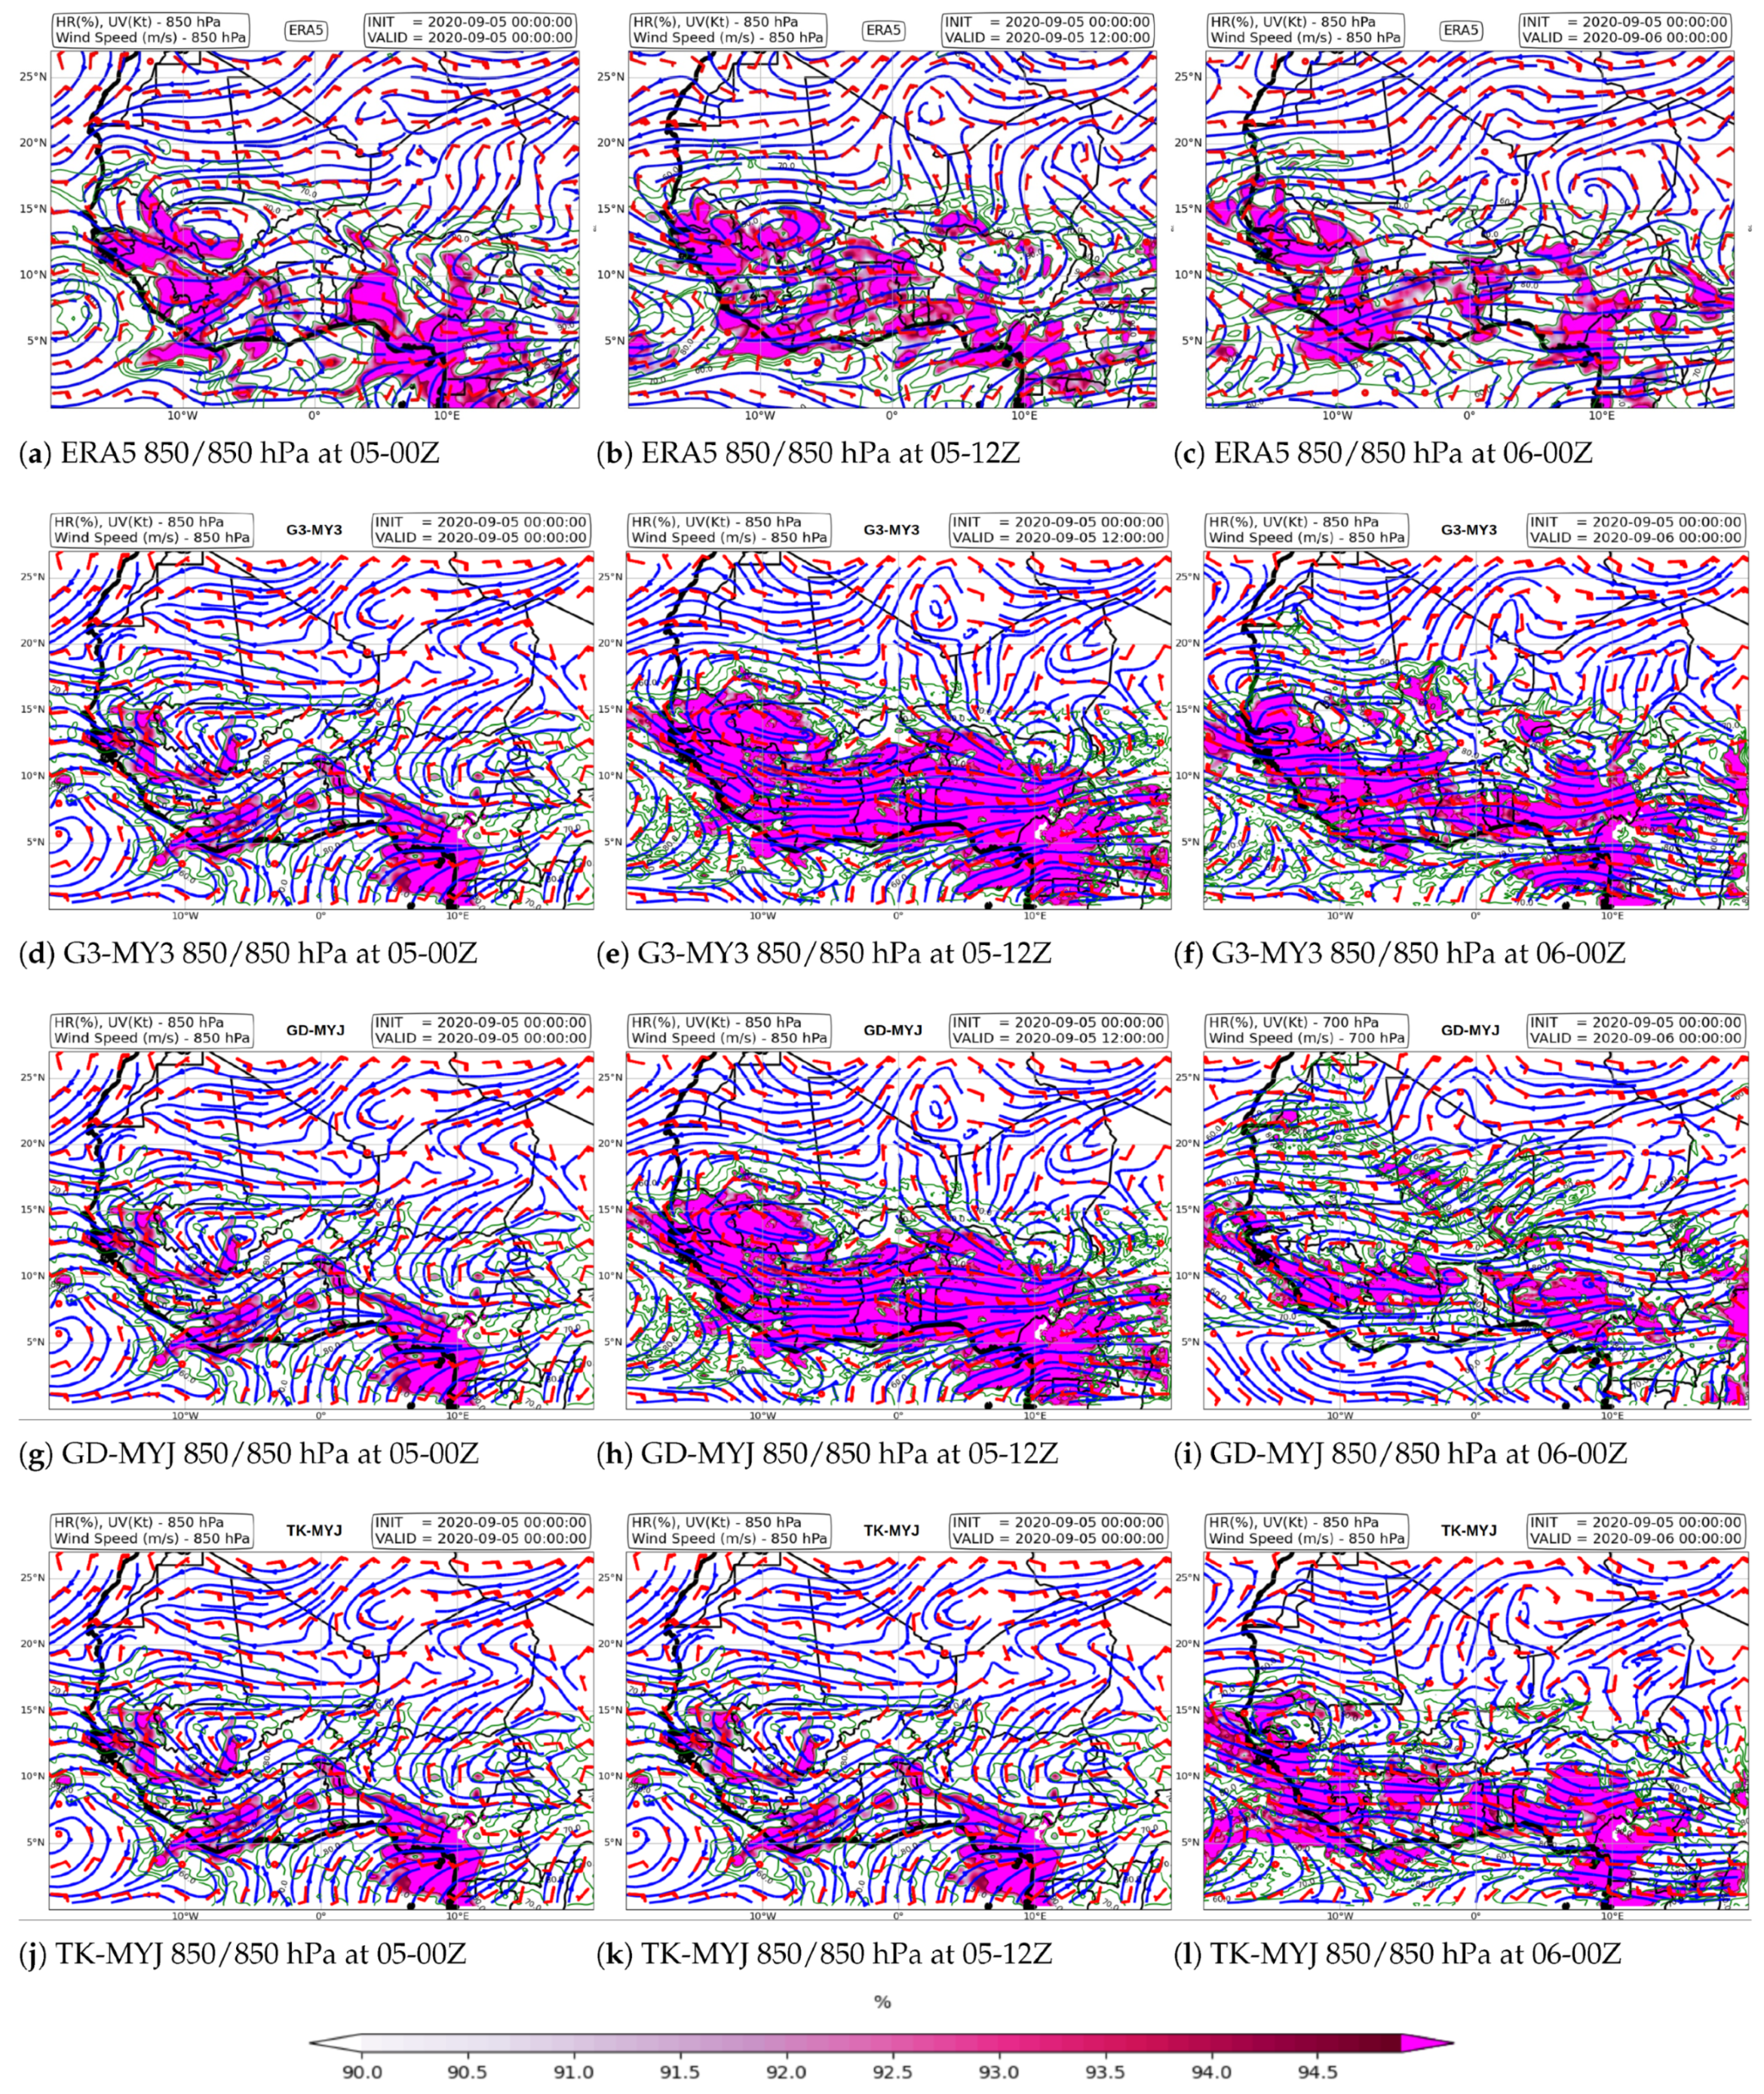
To examine atmospheric circulation at different vertical levels, we compared three selected WRF configurations (G3-MY3, GD-MYJ, and TK-MYJ), run at a 15 km resolution, with ERA5 reanalysis data. This comparison aims to evaluate how each configuration reproduces the observed large-scale and regional dynamics.
Figure 12 illustrates the relative humidity and wind fields at 925 hPa for each configuration, with streamlines at 200 hPa overlaid to highlight upper-level flow. Similarly, Figure 13 and Figure 14 present the same analysis for the 850 hPa and 700 hPa levels, respectively, including relative humidity, wind vectors, and upper-level streamlines.
The forecasts were initialized on 5 September at 00:00 UTC (with the GFS initial condition) and are evaluated at 12 h and 24 h lead times, allowing for an assessment of model performance at short-term synoptic scales.
The analysis of these figures reveals several key features. At the 925 hPa level, the WRF-simulated humidity and wind speeds are generally lower than those in ERA5, with wind speed differences reaching approximately 5 knots. This underestimation persists at both 12 h and 24 h lead times, indicating challenges in accurately reproducing low-level atmospheric conditions. Among the configurations, G3-MY3 shows higher humidity values near the surface and a more pronounced divergent circulation at 200 hPa compared to GD-MYJ, TK-MYJ, and ERA5. These differences likely contribute to variations in rainfall simulation. Most configurations simulate near-saturated humidity over the country, except in the northern region, along with divergent flux lines at 200 hPa. The intensity and extent of this divergence vary between configurations and provide useful insight into the development of deep convection.
At the 850 hPa level, the humidity fields from the WRF simulations are initially consistent with those from ERA5. However, differences emerge over time, which affects the timing and structure of cyclonic systems. G3-MY3 tends to maintain higher humidity throughout the forecast period, while, in GD-MYJ, the vortex system identified at this altitude appears slightly delayed over the country after 24 h of simulation.
The strengthening of the African Easterly Jet (AEJ), associated with a vortex system at 700 hPa, is captured by the WRF model configurations, although it appears slightly weaker compared to ERA5. In contrast, the WRF simulations display higher humidity at this level. This pattern persists at the 24 h forecast lead time and may help to explain the enhanced rainfall simulated in certain configurations, particularly TK-MYJ.
In summary, the spatial structures of atmospheric dynamics are consistent with the rainfall patterns discussed earlier. Features such as low-level humidity convergence, upper-level divergence at 200 hPa, and the presence of vortex systems are clearly associated with regions of increased precipitation. The greater the intensity of these dynamical features, the higher the resulting rainfall amounts.

4. Discussion

This study shows that the ENACTS data products, which combine TAMSAT and rain gauge observations, demonstrate good skill in capturing cumulative daily rainfall. The daily data accurately represent rainfall occurrence, with the average performance metrics across the two case studies showing a correlation of 0.73 (r), a bias of –0.1, a mean absolute error (MAE) of 13.3 mm/day, and a root mean square error (RMSE) of 18.25 mm/day. ENACTS also effectively differentiates between rainy and non-rainy days throughout Senegal; however, it does not adequately capture variability in rainfall amounts [35]. While ENACTS benefits from the integration of ground observations, the satellite-derived component (TAMSAT) can still introduce uncertainties, particularly in regions with sparse gauge coverage or complex terrain, where satellite estimates may struggle to capture localized rainfall events or intensity variability. Although two case studies are not sufficient to conclude that ENACTS is the best dataset for studying precipitation in Senegal, it nevertheless appears promising for daily precipitation studies more generally, provided its limitations are carefully considered in future applications.
Similarly, although many studies report that ERA5 has considerably reduced bias in West Africa [74,75], we observed in this study that ERA5 tends to overestimate precipitation in certain areas of the country. This finding is consistent with the results of [76,77], which show that the largest errors in ERA5 data occur in the tropics, leading to limitations in reproducing the homogeneity of precipitation, even though it manages to represent the overall rainfall regime.
Building on these evaluations, the current analysis shows that domain configuration and grid nesting can have a significant impact on model performance, a finding consistent with [78]. Furthermore, the analysis reveals a notable sensitivity of precipitation to both the planetary boundary layer and cumulus parametrization schemes. Specifically, CPSs emerged as having the most significant impact on simulating rainfall amounts. The disparity in simulated precipitation accumulations by WRF appears to be primarily linked to the moisture content in the lower and middle layers of the atmosphere and its associated dynamics, as noted by [23,24,73,79].
Among the various simulations conducted, those employing the TK and GD cumulus parameterization schemes combined with the MYJ planetary boundary layer scheme at a 3 km resolution yielded the best performance, consistent with [24,80], which also found that GD produced the most realistic representation of the precipitation field, while [25] favored the TK CPS combined with the Thompson microphysics scheme.
These findings underscore the WRF model’s strong sensitivity to physical parameterization in simulating precipitation, as highlighted by [81]. While many studies emphasize the impact of microphysics schemes, it appears that the Thompson microphysics scheme effectively reproduces the precipitation structure, aligning with the findings of [64,82]. Implementing these schemes in all the simulations led to more accurate results.
For static geography, while high-resolution (3–30 arc-second) static datasets are generally recommended for convection-permitting simulations, several studies suggest that their impact depends strongly on terrain complexity [83]. Wu [84] showed that model formulation often plays a larger role than static data resolution in shaping precipitation biases over Africa, with resolution mainly refining daily rainfall distributions. Likewise, sensitivity to fine-scale static data has been shown to be most pronounced in regions with strong orographic gradients [85]. In our domain, which consists mainly of flat coastal plains and low-lying plateaus (<300 m), the terrain variability and land-cover heterogeneity are modest, suggesting limited sensitivity of the main precipitation features to higher-resolution static fields. Nevertheless, future work will include targeted tests with 30-arc-second datasets to better quantify potential improvements in coastal rainfall representation.
However, despite the WRF model’s capability to simulate precipitation, discrepancies persist when compared to observations, particularly concerning spatial distribution and precipitation amounts. Notably, the precipitation simulation on 3 September exhibited spatial discrepancies, weak correlations, and instances of underestimation or overestimation of precipitation amounts in certain areas. These discrepancies could be attributed to persistent errors in the initial and boundary conditions, as well as to the model’s physical parameterizations.
Although the two selected events represent contrasting synoptic conditions, their limited number constrains the generalizability of the findings. The results should therefore be seen as preliminary insights into model behavior based on case-study sensitivity analysis in support of a pre-operational setup rather than definitive conclusions. Moreover, in real-time forecasting, the nature of upcoming weather systems is unknown, making it difficult to rely on a configuration optimized for specific conditions. Given the variability among the 15 tested configurations, using the ensemble mean as a reference benchmark could offer a more robust baseline for assessing model performance and identifying outliers. It would also be relevant to incorporate advanced categorical verification metrics such as Probability of Detection (POD), False Alarm Ratio (FAR), Critical Success Index (CSI), Frequency Bias Index (FBI), and Percent Correct (PC), as well as spatial verification metrics like Structure, Amplitude, and Location (SAL) score and Fractions Skill Score (FSS), to further enhance the robustness of the evaluation.

5. Conclusions

This study aimed to assess the sensitivity of the WRF model to different physical parameterization schemes by analyzing simulated precipitation and associated thermodynamic and dynamic processes over West Africa. To achieve this, the WRF model was applied to two significant rainfall events during the 2020 and 2021 rainy seasons in Senegal, using rain gauge data provided by the ANACIM.
For each event, 15 different model configurations were tested. The simulations were initialized and forced at the lateral boundaries using GFS analysis data. The model outputs were evaluated against multiple satellite-based precipitation products (ENACTS, IMERG, ARC2, and CHIRPS), rain gauge observations, and ERA5 reanalysis data for atmospheric dynamics. A comparative analysis of the spatial precipitation patterns and performance metrics was conducted for both events.
Overall, the WRF model was able to reproduce the observed precipitation patterns and key atmospheric structures with reasonable accuracy, although some biases were noted. Configurations that combined the Tiedtke (TK) or Grell–Devenyi (GD) cumulus parametrization schemes in the parent domain with the MYJ planetary boundary layer scheme provided the most consistent and reliable results in the convection-permitting domain at a 3 km resolution. Our findings emphasize the practical importance of case-based model evaluation for optimizing WRF configurations and enhancing forecast reliability in operational settings across West Africa.
These findings are encouraging as they demonstrate that appropriate selection of physical parameterizations significantly enhances the model’s performance in short-term weather forecasting over West Africa. The results also underscore the importance of conducting targeted sensitivity tests to optimize WRF performance in regions characterized by strong convective activity and complex dynamics.
Considering that the performance of the 15 tested configurations largely depends on the variable analyzed, the chosen evaluation criterion (intensity or spatial distribution), and the spatial domain under consideration, it would be premature to claim that one configuration definitively outperforms the others. A common approach in the literature is to consider the ensemble average of all configurations as this average is often statistically more robust and reliable than any single experiment.
However, the results obtained in this preliminary study are encouraging and suggest that the rainfall fields simulated by the WRF model can be considered relatively reliable. It would also be valuable to further investigate the model’s ability to better reproduce scattered convection and its relationship with atmospheric instability and organized convective systems at larger scales. In this operational implementation phase, continuous efforts in (objective and forecaster-subjective) forecast verification will be necessary to obtain more meaningful comprehension of how this system behaves as a function of different weather regimes.
It would also be relevant to conduct additional events and sensitivity tests on physical parameterizations, particularly focusing on new scale-sensitive microphysics and radiation schemes, to better understand their individual and combined effects. Further research could evaluate the added value of the ensemble approach, analyze the impact of domain size and nesting distance, especially in coastal regions, and validate model performance over multiple seasons to enhance the robustness and generalizability of the results. These efforts are particularly relevant to the ANACIM’s goal of implementing WRF for seasonal-scale forecasting, where identifying robust configurations across diverse climatic conditions is essential for reliable long-term operational use.

Author Contributions

Conceptualization, A.A.C., A.D. and E.D.P.; methodology, A.A.C., E.D.P. and A.D.; software, A.A.C.; validation, A.A.C., A.D., E.D.P. and S.D.; formal analysis, A.A.C.; investigation, A.A.C.; resources, A.D., Y.S. and O.N.; data curation, A.A.C.; writing—original draft preparation, A.A.C.; writing—review and editing, E.D.P., A.D., S.D., H.S., Y.S., O.N. and D.G.; visualization, A.A.C.; supervision, A.D. and E.D.P.; project administration, A.D.; funding acquisition, A.D. All authors have read and agreed to the published version of the manuscript.

Funding

This study is part of the implementing a Numerical Weather Prediction (NWP) system based on WRF in the pre-operational phase in Senegal, and is also conducted within the JEAI IRD program through JEAI-CLISAS (Young Team Associated with IRD Climate and Health in Senegal). This work is also supported by LMI-ECLAIRS-2-1, which focuses on integrated studies of climate and ocean in West Africa and responses to climate change in Senegal. The funders played no role in determining the study design, selecting the data collection or analysis methods employed, the decision to publish, or the preparation of the paper.

Institutional Review Board Statement

Not applicable.

Informed Consent Statement

Not applicable.

Data Availability Statement

The in situ data used in this study (rainfall, temperature, and relative humidity) are available from the Agence Nationale de l’Aviation Civile et de la Météorologie (ANACIM) upon request. ENACTS data can also be obtained from the ANACIM or accessed via the following link: https://iridl.ldeo.columbia.edu/SOURCES/.ANACIM/.ENACTS/.version3/.ALL/.daily/.rainfall/.rfe/ (accessed on 21 June 2025); however, access may be restricted due to national data sharing policies. IMERG data are publicly available from NASA Giovanni at https://giovanni.gsfc.nasa.gov/giovanni/ (accessed on 21 June 2025). ARC2 data are available at https://iridl.ldeo.columbia.edu/SOURCES/.NOAA/.NCEP/.CPC/.FEWS/.Africa/.DAILY/.ARC2/.daily/.est_prcp/ (accessed on 21 June 2025). CHIRPS data can be accessed at https://iridl.ldeo.columbia.edu/SOURCES/.UCSB/.CHIRPS/.v2p0/.daily/.global/.0p05/.prcp/ (accessed on 21 June 2025). ERA5 reanalysis data are available via the Copernicus Climate Data Store: relative humidity and UV component at https://cds.climate.copernicus.eu/datasets/reanalysis-era5-pressure-levels?tab=overview (accessed on 21 June 2025) and total precipitation and temperature 2m at https://cds.climate.copernicus.eu/datasets/reanalysis-era5-single-levels?tab=overview (accessed on 21 June 2025).

Acknowledgments

The authors gratefully acknowledge the Agence Nationale de l’Aviation Civile et de la Météorologie (ANACIM) for providing in situ data, ENACTS data, and access to high-performance computing (HPC) resources for WRF simulations. We also thank the International Research Institute for Climate and Society (IRI) for providing the ARC2 and CHIRPS datasets available, NASA Giovanni for access to IMERG data, and the Copernicus Climate Data Store for providing ERA5 reanalysis data. We would like to express our sincere gratitude to Cheikh Abdou Lahat Diop, Romain Fievet, and Mor Kébé for their contributions to the data analysis.

Conflicts of Interest

The authors declare no conflicts of interest.

Appendix A

Figure A1. Daily simulated precipitation by the WRF model for 3 September 2021 in Dom2 (3 km resolution) compared to observational data from ARC2, IMERG, CHIRPS, and ENACTS.
Climate 13 00181 g0a1aClimate 13 00181 g0a1b
Figure A2. Performance scores of WRF-15Km (red), WRF-3Km (yellow), IMERG (lime), ARC2 (black), and CHIRPS (tan) compared to ENACTS on 3 September 2021. The subplots display BIAS, RMSE, MAE, and correlation (R) for three configurations: (a) G3-MY3, (b) GD-MYJ, and (c) TK-MYJ.
Climate 13 00181 g0a2

References

  1. Sarr, M.A.; Zoromé, M.; Seidou, O.; Bryant, C.R.; Gachon, P. Recent trends in selected extreme precipitation indices in Senegal—A changepoint approach. J. Hydrol. 2013, 505, 326–334. [Google Scholar] [CrossRef]
  2. Barry, A.A.; Caesar, J.; Klein Tank, A.M.G.; Aguilar, E.; McSweeney, C.; Cyrille, A.M.; Nikiema, M.P.; Narcisse, K.B.; Sima, F.; Stafford, G.; et al. West Africa climate extremes and climate change indices. Int. J. Climatol. 2018, 38, e921–e938. [Google Scholar] [CrossRef]
  3. Diouf, S.; Sambou, M.-J.G.; Deme, A.; Fall, P.; Gueye, D.; Mignot, J.; Janicot, S. Dust Content Modulation and Spring Heat Waves in Senegal (2003–2022). Atmosphere 2024, 15, 1413. [Google Scholar] [CrossRef]
  4. Hastenrath, S.; Lamb, P.J. Climatic Atlas of the Tropical Atlantic and Eastern Pacific Oceans; University of Wisconsin: Madison, WI, USA, 1977. [Google Scholar]
  5. Xie, S.-P.; Carton, J.A. Tropical Atlantic Variability: Patterns, Mechanisms, and Impacts. In Earth’s Climate: The Ocean–Atmosphere Interaction; Geophysical Monograph Series; American Geophysical Union: Washington, DC, USA, 2004; Volume 147, pp. 121–142. [Google Scholar]
  6. Lavaysse, C.; Flamant, C.; Janicot, S.; Parker, D.J.; Lafore, J.-P.; Sultan, B.; Pelon, J. Seasonal Evolution of the West African Heat Low: A Climatological Perspective. Climate Dyn. 2009, 33, 313–330. [Google Scholar] [CrossRef]
  7. Issa Lélé, M.; Lamb, P.J. Variability of the Intertropical Front (ITF) and Rainfall over the West African Sudan–Sahel Zone. J. Climate 2010, 23, 3984–4004. [Google Scholar] [CrossRef]
  8. Burpee, R.W. The Origin and Structure of Easterly Waves in the Lower Troposphere of North Africa. J. Atmos. Sci. 1972, 29, 77–90. [Google Scholar] [CrossRef]
  9. Cook, K.H. Generation of the African Easterly Jet and Its Role in Determining West African Precipitation. J. Climate 1999, 12, 1165–1184. [Google Scholar] [CrossRef]
  10. Diedhiou, A.; Janicot, S.; Viltard, A.; De Felice, P.; Laurent, H. Easterly Wave Regimes and Associated Convection over West Africa and Tropical Atlantic: Results from the NCEP/NCAR and ECMWF Reanalyses. Climate Dyn. 1999, 15, 795–822. [Google Scholar] [CrossRef]
  11. Meukaleuni, C.; Lenouo, A.; Monkam, D. Climatology of Convective Available Potential Energy (CAPE) in ERA-Interim Reanalysis over West Africa. Atmos. Sci. Lett. 2016, 17, 65–70. [Google Scholar] [CrossRef]
  12. Olaniyan, E.; Afiesimama, E.; Oni, F.; Lawal, K.A. Simulating the Daily Evolution of West African Monsoon Using High Resolution Regional COSMO-Model: A Case Study of the First Half of 2015 over Nigeria. J. Climatol. Weather Forecast. 2015, 3, 142. [Google Scholar] [CrossRef]
  13. Mathon, V.; Laurent, H.; Lebel, T. Mesoscale Convective System Rainfall in the Sahel. J. Appl. Meteorol. Climatol. 2002, 41, 1081–1092. [Google Scholar] [CrossRef]
  14. Milovac, J.; Warrach-Sagi, K.; Behrendt, A.; Späth, F.; Ingwersen, J.; Wulfmeyer, V. Investigation of PBL Schemes Combining the WRF Model Simulations with Scanning Water Vapor Differential Absorption Lidar Measurements. J. Geophys. Res. Atmos. 2016, 121, 624–649. [Google Scholar] [CrossRef]
  15. Hong, S.-Y.; Dudhia, J. Next-Generation Numerical Weather Prediction: Bridging Parameterization, Explicit Clouds, and Large Eddies. Bull. Am. Meteorol. Soc. 2012, 93, ES6–ES9. [Google Scholar] [CrossRef]
  16. Prein, A.F.; Langhans, W.; Fosser, G.; Ferrone, A.; Ban, N.; Goergen, K.; Keller, M.; Tölle, M.; Gutjahr, O.; Feser, F.; et al. A Review on Regional Convection-Permitting Climate Modeling: Demonstrations, Prospects, and Challenges. Rev. Geophys. 2015, 53, 323–361. [Google Scholar] [CrossRef] [PubMed]
  17. Klemp, J.B. Advances in the WRF Model for Convection-Resolving Forecasting. Adv. Geosci. 2006, 7, 25–29. [Google Scholar] [CrossRef]
  18. Solano-Farias, F.; Ojeda, M.G.-V.; Donaire-Montaño, D.; Rosa-Cánovas, J.J.; Castro-Díez, Y.; Esteban-Parra, M.J.; Gámiz-Fortis, S.R. Assessment of Physical Schemes for WRF Model in Convection-Permitting Mode over Southern Iberian Peninsula. Atmos. Res. 2024, 299, 107175. [Google Scholar] [CrossRef]
  19. Deng, A.; Stauffer, D.R. On Improving 4-km Mesoscale Model Simulations. J. Appl. Meteorol. Climatol. 2006, 45, 361–381. [Google Scholar] [CrossRef]
  20. Skamarock, W.C.; Klemp, J.B.; Dudhia, J.; Gill, D.O.; Liu, Z.; Berner, J.; Huang, X.Y. A Description of the Advanced Research WRF Model Version 4.3 (No. NCAR/TN-556+ STR); National Center for Atmospheric Research: Boulder, CO, USA, 2021. [Google Scholar]
  21. Powers, J.G.; Klemp, J.B.; Skamarock, W.C.; Davis, C.A.; Dudhia, J.; Gill, D.O.; Coen, J.L.; Gochis, D.J.; Ahmadov, R.; Peckham, S.E.; et al. The Weather Research and Forecasting Model: Overview, System Efforts, and Future Directions. Bull. Am. Meteorol. Soc. 2017, 98, 1717–1737. [Google Scholar] [CrossRef]
  22. Crétat, J.; Pohl, B.; Richard, Y.; Drobinski, P. Sensibilité d’un Modèle à Aire Limitée à sa Paramétrisation Physique: Application en Afrique Australe. In Proceedings of the Ateliers de Modélisation de l’Atmosphère, Toulouse, France, 26–28 January 2010. [Google Scholar]
  23. Flaounas, E.; Bastin, S.; Janicot, S. Regional climate modelling of the 2006 West African monsoon: Sensitivity to convection and planetary boundary layer parameterisation using WRF. Clim. Dyn. 2011, 36, 1083–1105. [Google Scholar] [CrossRef]
  24. Noble, E.; Druyan, L.M.; Fulakeza, M. The Sensitivity of WRF Daily Summertime Simulations over West Africa to Alternative Parameterizations. Part II: Precipitation. Mon. Weather Rev. 2017, 145, 215–233. [Google Scholar] [CrossRef]
  25. Igri, P.M.; Tanessong, R.S.; Vondou, D.A.; Panda, J.; Garba, A.; Mkankam, F.K.; Kamga, A. Assessing the Performance of WRF Model in Predicting High-Impact Weather Conditions over Central and Western Africa: An Ensemble-Based Approach. Nat. Hazards 2018, 93, 1565–1587. [Google Scholar] [CrossRef]
  26. Bouali, L. Prévisibilité des Précipitations Ouest Africaines (Échelles Intrasaisonnières et Saisonnières) au Travers des Simulations Type DEMETER et des Observations. Ph.D. Thesis, Université de Bourgogne, Dijon, France, 2009. [Google Scholar]
  27. Bodian, A.; Dezetter, A.; Dacosta, H. Apport de la modélisation pluie-débit pour la connaissance de la ressource en eau: Application au haut bassin du fleuve Sénégal. Climatologie 2012, 9, 109–125. [Google Scholar] [CrossRef]
  28. Dione, O. Évolution climatique récente et dynamique fluviale dans les hauts bassins des fleuves Sénégal et Gambie. Sci. Chang. Planét/Sécheresse 1998, 8, 300–301. [Google Scholar]
  29. Sane, Y.; Panthou, G.; Bodian, A.; Vischel, T.; Lebel, T.; Dacosta, H.; Quantin, G.; Wilcox, C.; Ndiaye, O.; Diongue-Niang, A.; et al. Intensity–duration–frequency (IDF) rainfall curves in Senegal. Nat. Hazards Earth Syst. Sci. 2018, 18, 1849–1866. [Google Scholar] [CrossRef]
  30. Diop, L.; Bodian, A.; Diallo, D. Spatiotemporal Trend Analysis of the Mean Annual Rainfall in Senegal. Eur. Sci. J. 2016, 12, 231. [Google Scholar] [CrossRef]
  31. Salack, S.; Muller, B.; Gaye, A.T. Rain-Based Factors of High Agricultural Impacts over Senegal. Part I: Integration of Local to Sub-Regional Trends and Variability. Theor. Appl. Climatol. 2011, 106, 1–22. [Google Scholar] [CrossRef]
  32. Sagna, P.; Ndiaye, O.; Diop, C.; Niang, A.D.; Sambou, P.C. Les variations récentes du climat constatées au Sénégal sont-elles en phase avec les descriptions données par les scénarios du GIEC? Pollut. Atmos. Clim. Santé Soc. 2016, 227. [Google Scholar] [CrossRef]
  33. Wang, J.-W.A.; Sardeshmukh, P.D.; Compo, G.P.; Whitaker, J.S.; Slivinski, L.C.; McColl, C.M.; Pegion, P.J. Sensitivities of the NCEP Global Forecast System. Mon. Weather Rev. 2019, 147, 1237–1256. [Google Scholar] [CrossRef]
  34. Faniriantsoa, R.; Hansen, J. Enhancing ANACIM High-Resolution Merged Historical Datasets by Generating Additional Meteorological Parameters. In Accelerating Impacts of CGIAR Climate Research for Africa; World Bank: Washington, DC, USA, 2022. [Google Scholar]
  35. Maidment, R.I.; Grimes, D.; Black, E.; Tarnavsky, E.; Young, M.; Greatrex, H.; Allan, R.P.; Stein, T.; Nkonde, E.; Senkunda, S.; et al. A new, long-term daily satellite-based rainfall dataset for operational monitoring in Africa. Sci. Data 2017, 4, 170063. [Google Scholar] [CrossRef]
  36. Novella, N.S.; Thiaw, W.M. African Rainfall Climatology Version 2 for Famine Early Warning Systems. J. Appl. Meteorol. Climatol. 2013, 52, 588–606. [Google Scholar] [CrossRef]
  37. Tan, J.; Huffman, G.J.; Bolvin, D.T.; Nelkin, E.J. Diurnal cycle of IMERG V06 precipitation. Geophys. Res. Lett. 2019, 46, 13584–13592. [Google Scholar] [CrossRef]
  38. Funk, C.C.; Peterson, P.J.; Landsfeld, M.F.; Pedreros, D.H.; Verdin, J.P.; Rowland, J.D.; Romero, B.E.; Husak, G.J.; Michaelsen, J.C.; Verdin, A.P. A Quasi-Global Precipitation Time Series for Drought Monitoring; US Geological Survey: Reston, VA, USA, 2014.
  39. Hersbach, H.; Bell, B.; Berrisford, P.; Hirahara, S.; Horányi, A.; Muñoz-Sabater, J.; Nicolas, J.; Peubey, C.; Radu, R.; Schepers, D.; et al. The ERA5 global reanalysis. Q. J. R. Meteorol. Soc. 2020, 146, 1999–2049. [Google Scholar] [CrossRef]
  40. Diedhiou, S.; Rauch, M.; Dieng, A.L.; Bliefernicht, J.; Sy, S.; Sall, S.M.; Kunstmann, H. Extreme Rainfall in Dakar (Senegal): A Case Study for 5 September 2020. Front. Water 2024, 6, 1439404. [Google Scholar] [CrossRef]
  41. ANACIM. Bulletin Pluviométrique et Hydrologique Juillet-Août-Septembre 2020. Agence Nationale de l’Aviation Civile et de la Météorologie du Sénégal, 2020. Available online: https://www.secnsa.sn/wp-content/uploads/2022/09/202011-Bulletin-SAP-Juillet-Aout-Septembre-2020_recu-par-email-du-26-octobre-2020-c.pdf (accessed on 2 July 2025).
  42. Reuters. Senegal Activates Emergency Floods Aid Plan After Downpour; Reuters: London, UK, 2020. [Google Scholar]
  43. Ndiaye, A.L. Impacts des Inondations de 2020 au Niveau des Ménages Sinistrés—Enquête de Base pour l’Évaluation des Besoins Post Catastrophes; United Nations Development Programme: New York, NY, USA, 2021. [Google Scholar]
  44. Liu, Y.; Zhuo, L.; Han, D. Developing spin-up time framework for WRF extreme precipitation simulations. J. Hydrol. 2023, 620, 129443. [Google Scholar] [CrossRef]
  45. Skamarock, W.C. Evaluating mesoscale NWP models using kinetic energy spectra. Mon. Weather Rev. 2004, 132, 3019–3032. [Google Scholar] [CrossRef]
  46. Nooni, I.K.; Tan, G.; Hongming, Y.; Chaibou, A.A.S.; Habtemicheal, B.A.; Gnitou, G.T.; Lim Kam Sian, K.T.C. Assessing the performance of WRF model in simulating heavy precipitation events over East Africa using satellite-based precipitation product. Remote Sens. 2022, 14, 1964. [Google Scholar] [CrossRef]
  47. Grell, G.A. Prognostic Evaluation of Assumptions Used by Cumulus Parameterizations. Mon. Weather Rev. 1993, 121, 764–787. [Google Scholar] [CrossRef]
  48. Grell, G.A.; Dévényi, D. A Generalized Approach to Parameterizing Convection Combining Ensemble and Data Assimilation Techniques. Geophys. Res. Lett. 2002, 29, 38–41. [Google Scholar] [CrossRef]
  49. Kain, J.S. The Kain–Fritsch Convective Parameterization: An Update. J. Appl. Meteorol. Climatol. 2004, 43, 170–181. [Google Scholar] [CrossRef]
  50. Han, J.; Pan, H.-L. Revision of Convection and Vertical Diffusion Schemes in the NCEP Global Forecast System. Weather Forecast. 2011, 26, 520–533. [Google Scholar] [CrossRef]
  51. Tiedtke, M. A Comprehensive Mass Flux Scheme for Cumulus Parameterization in Large-Scale Models. Mon. Weather Rev. 1989, 117, 1779–1800. [Google Scholar] [CrossRef]
  52. Zhang, C.; Wang, Y.; Hamilton, K. Improved Representation of Boundary Layer Clouds over the Southeast Pacific in ARW-WRF Using a Modified Tiedtke Cumulus Parameterization Scheme. Mon. Weather Rev. 2011, 139, 3489–3513. [Google Scholar] [CrossRef]
  53. Thompson, G.; Field, P.R.; Rasmussen, R.M.; Hall, W.D. Explicit Forecasts of Winter Precipitation Using an Improved Bulk Microphysics Scheme. Part II: Implementation of a New Snow Parameterization. Mon. Weather Rev. 2008, 136, 5095–5115. [Google Scholar] [CrossRef]
  54. Iacono, M.J.; Delamere, J.S.; Mlawer, E.J.; Shephard, M.W.; Clough, S.A.; Collins, W.D. Radiative Forcing by Long-Lived Greenhouse Gases: Calculations with the AER Radiative Transfer Models. J. Geophys. Res. Atmos. 2008, 113, D13103. [Google Scholar] [CrossRef]
  55. Janjić, Z.I. The Step-Mountain Eta Coordinate Model: Further Developments of the Convection, Viscous Sublayer, and Turbulence Closure Schemes. Mon. Weather Rev. 1994, 122, 927–945. [Google Scholar] [CrossRef]
  56. Nakanishi, M.; Niino, H. Development of an Improved Turbulence Closure Model for the Atmospheric Boundary Layer. J. Meteorol. Soc. Jpn. Ser. II 2009, 87, 895–912. [Google Scholar] [CrossRef]
  57. Hong, S.-Y.; Noh, Y.; Dudhia, J. A New Vertical Diffusion Package with an Explicit Treatment of Entrainment Processes. Mon. Weather Rev. 2006, 134, 2318–2341. [Google Scholar] [CrossRef]
  58. Tewari, M.; Chen, F.; Wang, W.; Dudhia, J.; LeMone, M.; Mitchell, K.; Ek, M.; Gayno, G.; Wegiel, J.; Mukul Tewari, N. Implementation and Verification of the Unified NOAH Land Surface Model in the WRF Model. In Proceedings of the 20th Conference on Weather Analysis and Forecasting/16th Conference on Numerical Weather Prediction, Seattle, WA, USA, 12–16 January 2004; Volume 14. [Google Scholar]
  59. Klein, C.; Heinzeller, D.; Bliefernicht, J.; Kunstmann, H. Variability of West African Monsoon Patterns Generated by a WRF Multi-Physics Ensemble. Clim. Dyn. 2015, 45, 2733–2755. [Google Scholar] [CrossRef]
  60. Chawla, I.; Osuri, K.K.; Mujumdar, P.P.; Niyogi, D. Assessment of the Weather Research and Forecasting (WRF) model for simulation of extreme rainfall events in the upper Ganga Basin. Hydrol. Earth Syst. Sci. 2018, 22, 1095–1117. [Google Scholar] [CrossRef]
  61. Douluri, D.L.; Chakraborty, A. Assessment of WRF-ARW model parameterization schemes for extreme heavy precipitation events associated with atmospheric rivers over West Coast of India. Atmos. Res. 2021, 249, 105330. [Google Scholar] [CrossRef]
  62. Merino, A.; García-Ortega, E.; Navarro, A.; Sánchez, J.L.; Tapiador, F.J. WRF hourly evaluation for extreme precipitation events. Atmos. Res. 2022, 274, 106215. [Google Scholar] [CrossRef]
  63. Gbode, I.E.; Dudhia, J.; Ogunjobi, K.O.; Ajayi, V.O. Sensitivity of different physics schemes in the WRF model during a West African monsoon regime. Theor. Appl. Climatol. 2019, 136, 733–751. [Google Scholar] [CrossRef]
  64. Drigeard, E. Microphysique Glacée des Systèmes Convectifs Observés dans le Cadre de Megha-Tropiques en Afrique de l’Ouest: Comparaison des Mesures Aéroportées avec des Radars Sol et un Modèle Numérique. Ph.D. Thesis, Université Blaise Pascal-Clermont-Ferrand II, Aubière, France, 2014. [Google Scholar]
  65. Mohamed, A.; Faye, C.; Othman, A.; Abdelrady, A. Hydro-Geophysical Evaluation of the Regional Variability of Senegal’s Terrestrial Water Storage Using Time-Variable Gravity Data. Remote Sens. 2022, 14, 4059. [Google Scholar] [CrossRef]
  66. Nakalembe, C.; Frimpong, D.B.; Kerner, H.; Sarr, M.A. A 40-Year Remote Sensing Analysis of Spatiotemporal Temperature and Rainfall Patterns in Senegal. Front. Clim. 2025, 7, 1462626. [Google Scholar] [CrossRef]
  67. Willmott, C.J. Some Comments on the Evaluation of Model Performance. Bull. Am. Meteorol. Soc. 1982, 63, 1309–1313. [Google Scholar] [CrossRef]
  68. Willmott, C.J.; Matsuura, K. Advantages of the Mean Absolute Error (MAE) over the Root Mean Square Error (RMSE) in Assessing Average Model Performance. Clim. Res. 2005, 30, 79–82. [Google Scholar] [CrossRef]
  69. Chai, T.; Draxler, R.R. Root mean square error (RMSE) or mean absolute error (MAE)?—Arguments against avoiding RMSE in the literature. Geosci. Model Dev. 2014, 7, 1247–1250. [Google Scholar] [CrossRef]
  70. Wilks, D.S. Statistical Methods in the Atmospheric Sciences; Academic Press: San Diego, CA, USA, 2011; Volume 100. [Google Scholar]
  71. Taylor, K.E. Summarizing multiple aspects of model performance in a single diagram. J. Geophys. Res. Atmos. 2001, 106, 7183–7192. [Google Scholar] [CrossRef]
  72. Young, M.P.; Williams, C.J.R.; Chiu, J.C.; Maidment, R.I.; Chen, S.-H. Investigation of discrepancies in satellite rainfall estimates over Ethiopia. J. Hydrometeorol. 2014, 15, 2347–2369. [Google Scholar] [CrossRef]
  73. Ahmed, R.H.; Roomi, T.O.; Hussain, H.H.; Salah, Z. Sensitivity of Different Physical Schemes in WRF Model of a Rainfall Event in Baghdad Station. Al-Mustansiriyah J. Sci. 2023, 34, 1–7. [Google Scholar] [CrossRef]
  74. Gbode, I.E.; Babalola, T.E.; Diro, G.T.; Olaniyan, E.O.; Dosio, A.; Lennard, C.; Adefisan, E.A. Assessment of ERA5 and ERA-Interim in reproducing mean and extreme climates over West Africa. Adv. Atmos. Sci. 2023, 40, 570–586. [Google Scholar] [CrossRef]
  75. Quagraine, K.A.; Nkrumah, F.; Klein, C.; Klutse, N.A.B.; Quagraine, K.T. West African Summer Monsoon precipitation variability as represented by reanalysis datasets. Climate 2020, 8, 111. [Google Scholar] [CrossRef]
  76. Bodjrenou, R.; Cohard, J.-M.; Hector, B.; Lawin, E.A.; Chagnaud, G.; Danso, D.K.; N’tcha, M.Y.; Badou, F.; Ahamide, B. Evaluation of reanalysis estimates of precipitation, radiation, and temperature over Benin (West Africa). J. Appl. Meteorol. Climatol. 2023, 62, 1005–1022. [Google Scholar] [CrossRef]
  77. Lavers, D.A.; Simmons, A.; Vamborg, F.; Rodwell, M.J. An evaluation of ERA5 precipitation for climate monitoring. Q. J. R. Meteorol. Soc. 2022, 148, 3152–3165. [Google Scholar] [CrossRef]
  78. Pohl, B.; Crétat, J.; Camberlin, P. Testing WRF capability in simulating the atmospheric water cycle over Equatorial East Africa. Clim. Dyn. 2011, 37, 1357–1379. [Google Scholar] [CrossRef]
  79. Crétat, J.; Richard, Y.; Pohl, B.; Rouault, M.; Reason, C.; Fauchereau, N. Recurrent daily rainfall patterns over South Africa and associated dynamics during the core of the austral summer. Int. J. Climatol. 2012, 32, 261–273. [Google Scholar] [CrossRef]
  80. Berry, G.J.; Thorncroft, C.D. African easterly wave dynamics in a mesoscale numerical model: The upscale role of convection. J. Atmos. Sci. 2012, 69, 1267–1283. [Google Scholar] [CrossRef]
  81. Vemuri, A.; Buckingham, S.; Munters, W.; Helsen, J.; Van Beeck, J. Sensitivity analysis of mesoscale simulations to physics parameterizations over the Belgian North Sea using Weather Research and Forecasting–Advanced Research WRF (WRF-ARW). Wind Energy Sci. 2022, 7, 1869–1888. [Google Scholar] [CrossRef]
  82. Karki, R.; ul Hasson, S.; Gerlitz, L.; Talchabhadel, R.; Schenk, E.; Schickhoff, U.; Scholten, T.; Böhner, J. WRF-based simulation of an extreme precipitation event over the Central Himalayas: Atmospheric mechanisms and their representation by microphysics parameterization schemes. Atmos. Res. 2018, 214, 21–35. [Google Scholar] [CrossRef]
  83. Ruijsch, J.; Taylor, C.M.; Hutjes, R.W.A.; Teuling, A.J. Scale-dependent cloud enhancement from land restoration in West African drylands. Commun. Earth Environ. 2025, 6, 174. [Google Scholar] [CrossRef]
  84. Wu, M.; Nikulin, G.; Kjellström, E.; Belušić, D.; Jones, C.; Lindstedt, D. The impact of regional climate model formulation and resolution on simulated precipitation in Africa. Earth Syst. Dyn. 2020, 11, 377–394. [Google Scholar] [CrossRef]
  85. Mwanthi, A.M.; Mutemi, J.N.; Opijah, F.J.; Mutua, F.M.; Atheru, Z.; Artan, G. Implications of WRF model resolutions on resolving rainfall variability with topography over East Africa. Front. Clim. 2024, 6, 1311088. [Google Scholar] [CrossRef]
Figure 1. The nested domains used for WRF model simulations, highlighting key topographic and fluvial features of West Africa. Dom1 (15 km) represents the outer domain covering West Africa, while Dom2 (3 km), outlined in red, focuses on Senegal.
Climate 13 00181 g001
Figure 2. Division of Senegal into four (4) homogeneous climatological zones based on temperature and precipitation data, as well as the main synoptic stations.
Climate 13 00181 g002
Figure 3. Performance metrics (BIAS, RMSE, MAE, and correlation) of ARC2 (black), CHIRPS (tan), IMERG (lime), and ERA5 (cyan) compared to ENACTS for (a) the 5 September 2020 case and (b) the 3 September 2021 case.
Climate 13 00181 g003
Figure 4. Daily simulated precipitation by the WRF model on 5 September 2020 over Dom2 (3 km resolution) compared to observational data from ARC2, IMERG, CHIRPS, and ENACTS.
Climate 13 00181 g004aClimate 13 00181 g004b
Figure 5. Performance scores of WRF-15Km (red), WRF-3Km (yellow), IMERG (lime), ARC2 (black), and CHIRPS (tan) compared to ENACTS on 5 September 2020. The subplots display BIAS, RMSE, MAE, and correlation (R) for three configurations: (a) G3-MY3, (b) GD-MYJ, and (c) TK-MYJ.
Climate 13 00181 g005
Figure 6. Taylor diagrams illustrate the validation results for 15 WRF model simulations of precipitation accumulations on 5 September 2020, focused on the region delineated by the red box in Figure 1. The corresponding scores from other datasets and the ENACTS simulation are also depicted. The chosen WRF configurations are clearly labeled. Radial lines display spatial correlation coefficients r, while values along the x and y axes represent standard deviations σ , which are normalized with respect to the reference data. Dotted semicircles represent the centered normalized root mean square error (RMSE) differences between each data point and the reference data, including comparisons with (a) ENACTS reference data, (b) ARC2 reference data, and (c) IMERG reference data.
Climate 13 00181 g006
Figure 7. Daily diurnal temperature averaged (North, East, South, Center, and Senegal) for the ERA5 data and WRF simulations; models with the same marker have the same convection; see legend. Models in black have MYJ as PBL, models with MYNN3 in yellow, models with YSU in red, and ERA5 in cyan.
Climate 13 00181 g007
Figure 8. Daily diurnal temperature at selected stations (Saint-Louis, Tambacounda, Ziguinchor, and Dakar-Yoff) from ERA5 data and WRF simulations. Models sharing the same marker use the same cumulus parameterization scheme; see legend. Models using the MYJ PBL scheme are shown in black, those with MYNN3 in yellow, YSU in red, and ERA5 in cyan.
Climate 13 00181 g008
Figure 9. Daily diurnal relative humidity averaged over the North, East, South, Center, and All zones from ERA5 data and WRF simulations. Models with the same marker use the same cumulus parameterization scheme; see legend. WRF configurations with the MYJ PBL scheme are shown in black, MYNN3 in yellow, YSU in red, and ERA5 in cyan.
Climate 13 00181 g009
Figure 10. Daily diurnal relative humidity at selected stations (Saint-Louis, Tambacounda, Ziguinchor, and Dakar-Yoff) from ERA5 data and WRF simulations. Models with the same marker share the same cumulus parameterization scheme; see legend. WRF configurations using the MYJ PBL scheme are shown in black, MYNN3 in yellow, YSU in red, and ERA5 in cyan.
Climate 13 00181 g010
Figure 11. Daily diurnal precipitation at selected stations (Saint-Louis, Tambacounda, Ziguinchor, and Dakar-Yoff) from ERA5 data and WRF simulations. Models with the same marker use the same cumulus parameterization scheme; see legend. WRF configurations with the MYJ PBL scheme are shown in black, MYNN3 in yellow, YSU in red, and ERA5 in cyan.
Climate 13 00181 g011
Figure 12. Flux lines at 200 hPa, humidity, and winds at 925 hPa in ERA5 and WRF with a 15 km resolution. The forecast was initiated on 5 September at 00:00Z and validated on 5 September at 12:00Z and 6 September at 00:00Z. Blue lines represent the flux lines (m/s), green contour lines indicate changes in humidity between 60% and 90%, while values above 90% are shaded in magenta. The red wind barbs indicate wind direction and intensity (kt).
Climate 13 00181 g012
Figure 13. Flux lines, humidity, and winds at 850 hPa in ERA5 and WRF with a 15 km resolution. The forecast was initiated on 5 September at 00:00Z and validated on 5 September at 12:00Z and 6 September at 00:00Z. Blue lines represent the flux lines (m/s), green contour lines indicate changes in humidity between 60% and 90%, while values above 90% are shaded in magenta. The red wind barbs indicate wind direction and intensity (kt).
Climate 13 00181 g013
Figure 14. Flux lines, humidity, and winds at 700 hPa in ERA5 and WRF with a 15 km resolution. The forecast was initiated on 5 September at 00:00Z and validated on 5 September at 12:00Z and 6 September at 00:00Z. Blue lines represent the flux lines (m/s), green contour lines indicate changes in humidity between 60% and 90%, while values above 90% are shaded in magenta. The red wind barbs indicate wind direction and intensity (kt).
Climate 13 00181 g014
Table 1. Configuration details of the nested domains in the WRF model simulations.
ParameterDom1Dom2
Meteo-res15 km3 km
Time step60 s12 s
Nb of points295 × 200316 × 286
Nb of levels51
Vertical coordinateHybrid
CumulusOnOff
Table 2. WRF parameterizations considered for all simulations, with abbreviated code used throughout this study and source citations.
WRF Model ParameterizationAbbrev.Source
Cumulus parameterization schemes (CPSs)
Grell 3DGr3d (5)[47]
Grell–DevenyiGD (93)[48]
Kain–FritschKF (1)[49]
New Arakawa–SchubertNSAS (14)[50]
TiedtkeTK (6)[51,52]
Microphysics scheme (MPS)
Thompson SchemeTS (8) [53]
Radiation scheme (RAD)
RRTMG Shortwave and Longwave SchemesRRTMG (4) [54]
PBL Model
Mellor–Yamada–JanjicMYJ (2) [55]
Mellor–Yamada Nakanishi NiinoMYNN3 (6) [56]
Yonsei University SchemeYSU (1) [57]
Land surface (LSM)
Unified Noah Land SurfaceNoah (2) [58]
Table 3. The fifteen (15) different WRF model combinations of parameterizations.
WRF ConfigurationsCPSPBL
G3-MYJGrell 3DMYJ
G3-MY3Grell 3DMYNN3
G3-YSUGrell 3DYSU
GD-MYJGDMYJ
GD-MY3GDMYNN3
GD-YSUGDYSU
KF-MYJKFMYJ
KF-MY3KFMYNN3
KF-YSUKFYSU
TK-MYJTKMYJ
TK-MY3TKMYNN3
TK-YSUTKYSU
NS-MYJNSASMYJ
NS-MY3NSASMYNN3
NS-YSUNSASYSU
Table 4. Validation scores of satellite-based and ERA5 reanalysis precipitation estimates compared to rain gauge observations for the events of 5 September 2020 and 3 September 2021.
DateScoreARC2CHIRPSENACTSIMERGERA5
5 September 2020R0.550.390.620.410.30
MAE (mm/day)27.032.222.729.129.1
BIAS (mm/day)−17.3−28.4−0.1−14.7−9.8
RMSE (mm/day)374529.738.139.6
3 September 2021R0.320.490.840.440.54
MAE (mm/day)11.17.43.96.68.6
BIAS (mm/day)5.4−1.6−0.1−0.1−8.4
RMSE (mm/day)13.111.26.811.714.7
Table 5. Validation scores of different WRF model configurations (Domain 2, 3 km resolution) compared to rain gauge observations for 5 September 2020 and 3 September 2021 case studies. CPS refers to the cumulus parameterization scheme.
CPSGrell 3DGDKFTKNSAS
Config G3-MYJ G3-MY3 G3-YSU GD-MYJ GD-MY3 GD-YSU KF-MYJ KF-MY3 KF-YSU TK-MYJ TK-MY3 TK-YSU NS-MYJ NS-MY3 NS-YSU
5 September 2020
R0.270.130.330.380.200.140.290.200.300.400.360.410.150.370.24
BIAS−15.5−22.6−7.5−19.9−31.1−16.4−26.0−28.9−19.8−11.3−7.7−1.1−32.0−28.1−22.1
MAE36.443.135.432.636.436.737.836.534.933.139.735.038.634.033.4
RMSE46.355.147.843.149.048.948.049.045.644.453.445.652.846.945.7
3 September 2021
R0.08−0.050.040.500.030.330.130.120.100.19−0.010.070.16−0.030.02
BIAS−6.8−7.9−6.2−0.9−7.3−2.8−7.5−8.6−7.41.6−7.7−5.2−5.4−7.7−6.6
MAE9.09.29.77.59.28.39.08.69.111.69.19.88.49.29.1
RMSE16.115.816.313.215.416.315.415.015.420.715.717.614.716.016.3
Disclaimer/Publisher’s Note: The statements, opinions and data contained in all publications are solely those of the individual author(s) and contributor(s) and not of MDPI and/or the editor(s). MDPI and/or the editor(s) disclaim responsibility for any injury to people or property resulting from any ideas, methods, instructions or products referred to in the content.