Article

Long-Term Climate Trends in Southern Angola and Possible Implications in Agriculture

by
Carlos D. N. Correia
1,2,
André Fonseca
2,
Malik Amraoui
2,
Carlos A. Pereira
3,4 and
João A. Santos
2,*
1
Huíla Polytechnic Institute, Mandume Ya Ndemufayo University, Arimba Main Road, 776, Lubango P.O. Box 201, Angola
2
Centre for the Research and Technology of Agro-Environmental and Biological Sciences, CITAB, Inov4Agro, Universidade de Trás-os-Montes e Alto Douro, UTAD, Quinta de Prados, 5000-801 Vila Real, Portugal
3
Portuguese Institute for the Sea and Atmosphere (IPMA), Rua C, Aeroporto Humberto Delgado, 1749-077 Lisboa, Portugal
4
Dom Luiz Institute, Faculdade de Ciências da Universidade de Lisboa, Campo Grande Edifício C1, Piso 1, 1749-016 Lisboa, Portugal
*
Author to whom correspondence should be addressed.
Climate 2025, 13(9), 173; https://doi.org/10.3390/cli13090173
Submission received: 4 June 2025 / Revised: 31 July 2025 / Accepted: 23 August 2025 / Published: 26 August 2025
(This article belongs to the Special Issue Climate Change Impacts at Various Geographical Scales (2nd Edition))

Abstract

Climate change poses a significant challenge to agriculture in southern Angola, particularly for smallholder farming systems that are highly exposed and vulnerable, lacking the resources and capacity to respond effectively. This study analyses climate trends from 1950 to 2024 in Huíla, Namibe, and Cunene, focusing on eight variables: Tmax, Tmin, Tmean, PRCPTOT, R95p, R95pTOT, CDD, and CWD. Due to inconsistencies in local meteorological station data, ERA5-Land reanalysis was used. Trends such as rising Tmin in Namibe (+0.32 °C/decade), Tmean in Huíla (+0.16 °C/decade), and increased precipitation in Huíla (+29.3 mm/decade), along with fewer dry days in Namibe (–2.7 days/decade), were observed. Crop–climate relationships (2000–2023) were explored using a categorical contingency analysis. Maize showed its highest yield frequency (46%) during hot years; cassava and beans were more stable under cooler, drier conditions; millet yielded above average (31%) in dry years, confirming drought resilience; potatoes performed poorly in wet years (17% above-average yields). The contingency method provided insights where linear models were insufficient, helping to understand climate–yield interactions in data-limited environments. This study offers the first long-term climate–agriculture assessment for southern Angola, providing critical evidence for climate-informed agricultural strategies in regions with scarce and unreliable observational records. The findings emphasise the urgent need for adaptation policies focused on crop-specific climate vulnerabilities. They also demonstrate the value of combining reanalysis data and categorical analysis to overcome data gaps and guide sustainable agricultural planning.

1. Introduction

Climate change has become one of the most significant global threats of the 21st century, profoundly affecting both natural and anthropogenic systems. In recent decades, the frequency and intensity of weather events—including heat waves, prolonged and severe droughts, and heavy precipitation—have increased considerably, threatening food security, water availability, and agricultural productivity [1,2].
These changes have been particularly severe across Africa, where widespread environmental vulnerability, economic challenges, and limited adaptive capacity have intensified their impact. Several regions across the continent have experienced warming trends surpassing the global average, coupled with highly variable precipitation patterns [3,4,5,6]. Southern Africa, in particular, has emerged as one of the hotspots of climate vulnerability, where socioeconomic fragilities and a heavy reliance on predominantly rain-fed agricultural systems coexist with an increasingly unstable climate [7,8].
In Angola, several studies indicate an average annual temperature increase of 1.4 °C since 1951, corresponding to an approximate rate of 0.2 °C per decade [7]. This warming trend has intensified over time and is evident across all seasons, with the most pronounced increases occurring during the winter months (JJA). These changes have exacerbated aridity levels in the country’s semiarid regions and are linked to a higher incidence of extreme heat events [7,8]. In contrast, precipitation trends have been less consistent, characterised by high interannual and decadal variability, without a clear pattern of increase or decrease in annual totals [9]. Moreover, there are signs of seasonal shifts, with a notable reduction in precipitation during crucial months of the rainy season, such as October, November, and February [10].
Southern Angola, particularly the provinces of Huíla, Namibe, and Cunene, has long faced high climate vulnerability. Characterised by a dry climate, irregular precipitation, and frequent multi-year droughts, the region has been severely affected by the impacts of climate change in recent decades [7,11,12]. Between 1960 and 2016, drought events occurred, on average, every three years in the region [11]. Over the past 40 years, the southern region of Angola has experienced several drought episodes, with the most recent ones occurring between 2012–2014, 2015, 2016, 2017, 2019, and 2022—the latter standing out as the most severe drought of the period, with serious impacts on agricultural production and food security [7,9,10,12,13,14,15].
The main regional crops, including corn (cv. Zea mays), sorghum (cv. Sorghum bicolour), finger millet (cv. Pennisetum glaucum), beans (cv. Phaseolus vulgaris), cassava (cv. Manihot scougente), and potatoes (cv. Solanum tuberosum), play crucial roles in ensuring the country’s food security and supporting agricultural development [16]. According to Angola’s Ministry of Agriculture, the predominant cereal crops in Huila are corn, sorghum, and finger millet, alongside significant potato cultivation. In Cunene, in turn, the primary cereal crops are sorghum and finger millet. Huila makes the most substantial contribution to national corn production, while Namibe’s contribution to national production is very limited owing to the prevailing arid conditions, though the cultivation areas that exist are vital for the food security of the local population [17].
Agriculture in this region is predominantly family-based and heavily dependent on climatic conditions, making it highly sensitive to, e.g., temperature and precipitation variability [16]. However, there are significant gaps in the understanding of long-term climate trends in southern Angola. These gaps are exacerbated by the discontinuity and limited reliability of historical meteorological data, particularly between the 1970s and 2000s [7,18]. Since 2010, the observation network has been partially strengthened with the installation of 22 automatic meteorological stations by the Southern African Centre for Science and Services for Climate Change Adaptation and Sustainable Land Management (SASSCAL) project [18]. Nonetheless, the weather station network density remains insufficient to support robust climate analyses across the entire national territory, and inhomogeneities in the data records persist.
Given these limitations, it is crucial to develop studies that balance statistical robustness and temporal continuity. This study aims to address this gap by analysing temperature and precipitation time series in southern Angola, covering the period from 1950 to 2024. The investigation applies the nonparametric Mann–Kendall test and Sen’s slope estimator, both widely used to assess trends in hydroclimatic series [19,20]. This approach aims to offer effective support for sustainable agricultural planning and the formulation of evidence-based climate adaptation policies [21,22,23]. Previous studies indicate that agricultural yields tend to increase with rising temperatures up to a certain threshold, beyond which yields begin to decline [24,25,26]. Moreover, precipitation plays a vital role in crop growth and productivity, while the occurrence of severe droughts can ultimately compromise entire harvests [27].
Therefore, this study aims to analyse the long-term climatic trends in southern Angola, from 1950 to 2024, for temperature and precipitation and some of their extremes. As previously mentioned, the research seeks to address existing knowledge gaps by applying simple, robust, and well-established statistical methods. Additionally, the study includes an analysis of the production trends of the six previously mentioned crops to assess how climatic trends have impacted their yields, contributing to the development of adaptation and mitigation strategies for local farmers.

2. Materials and Methods

2.1. Study Area Characterisation
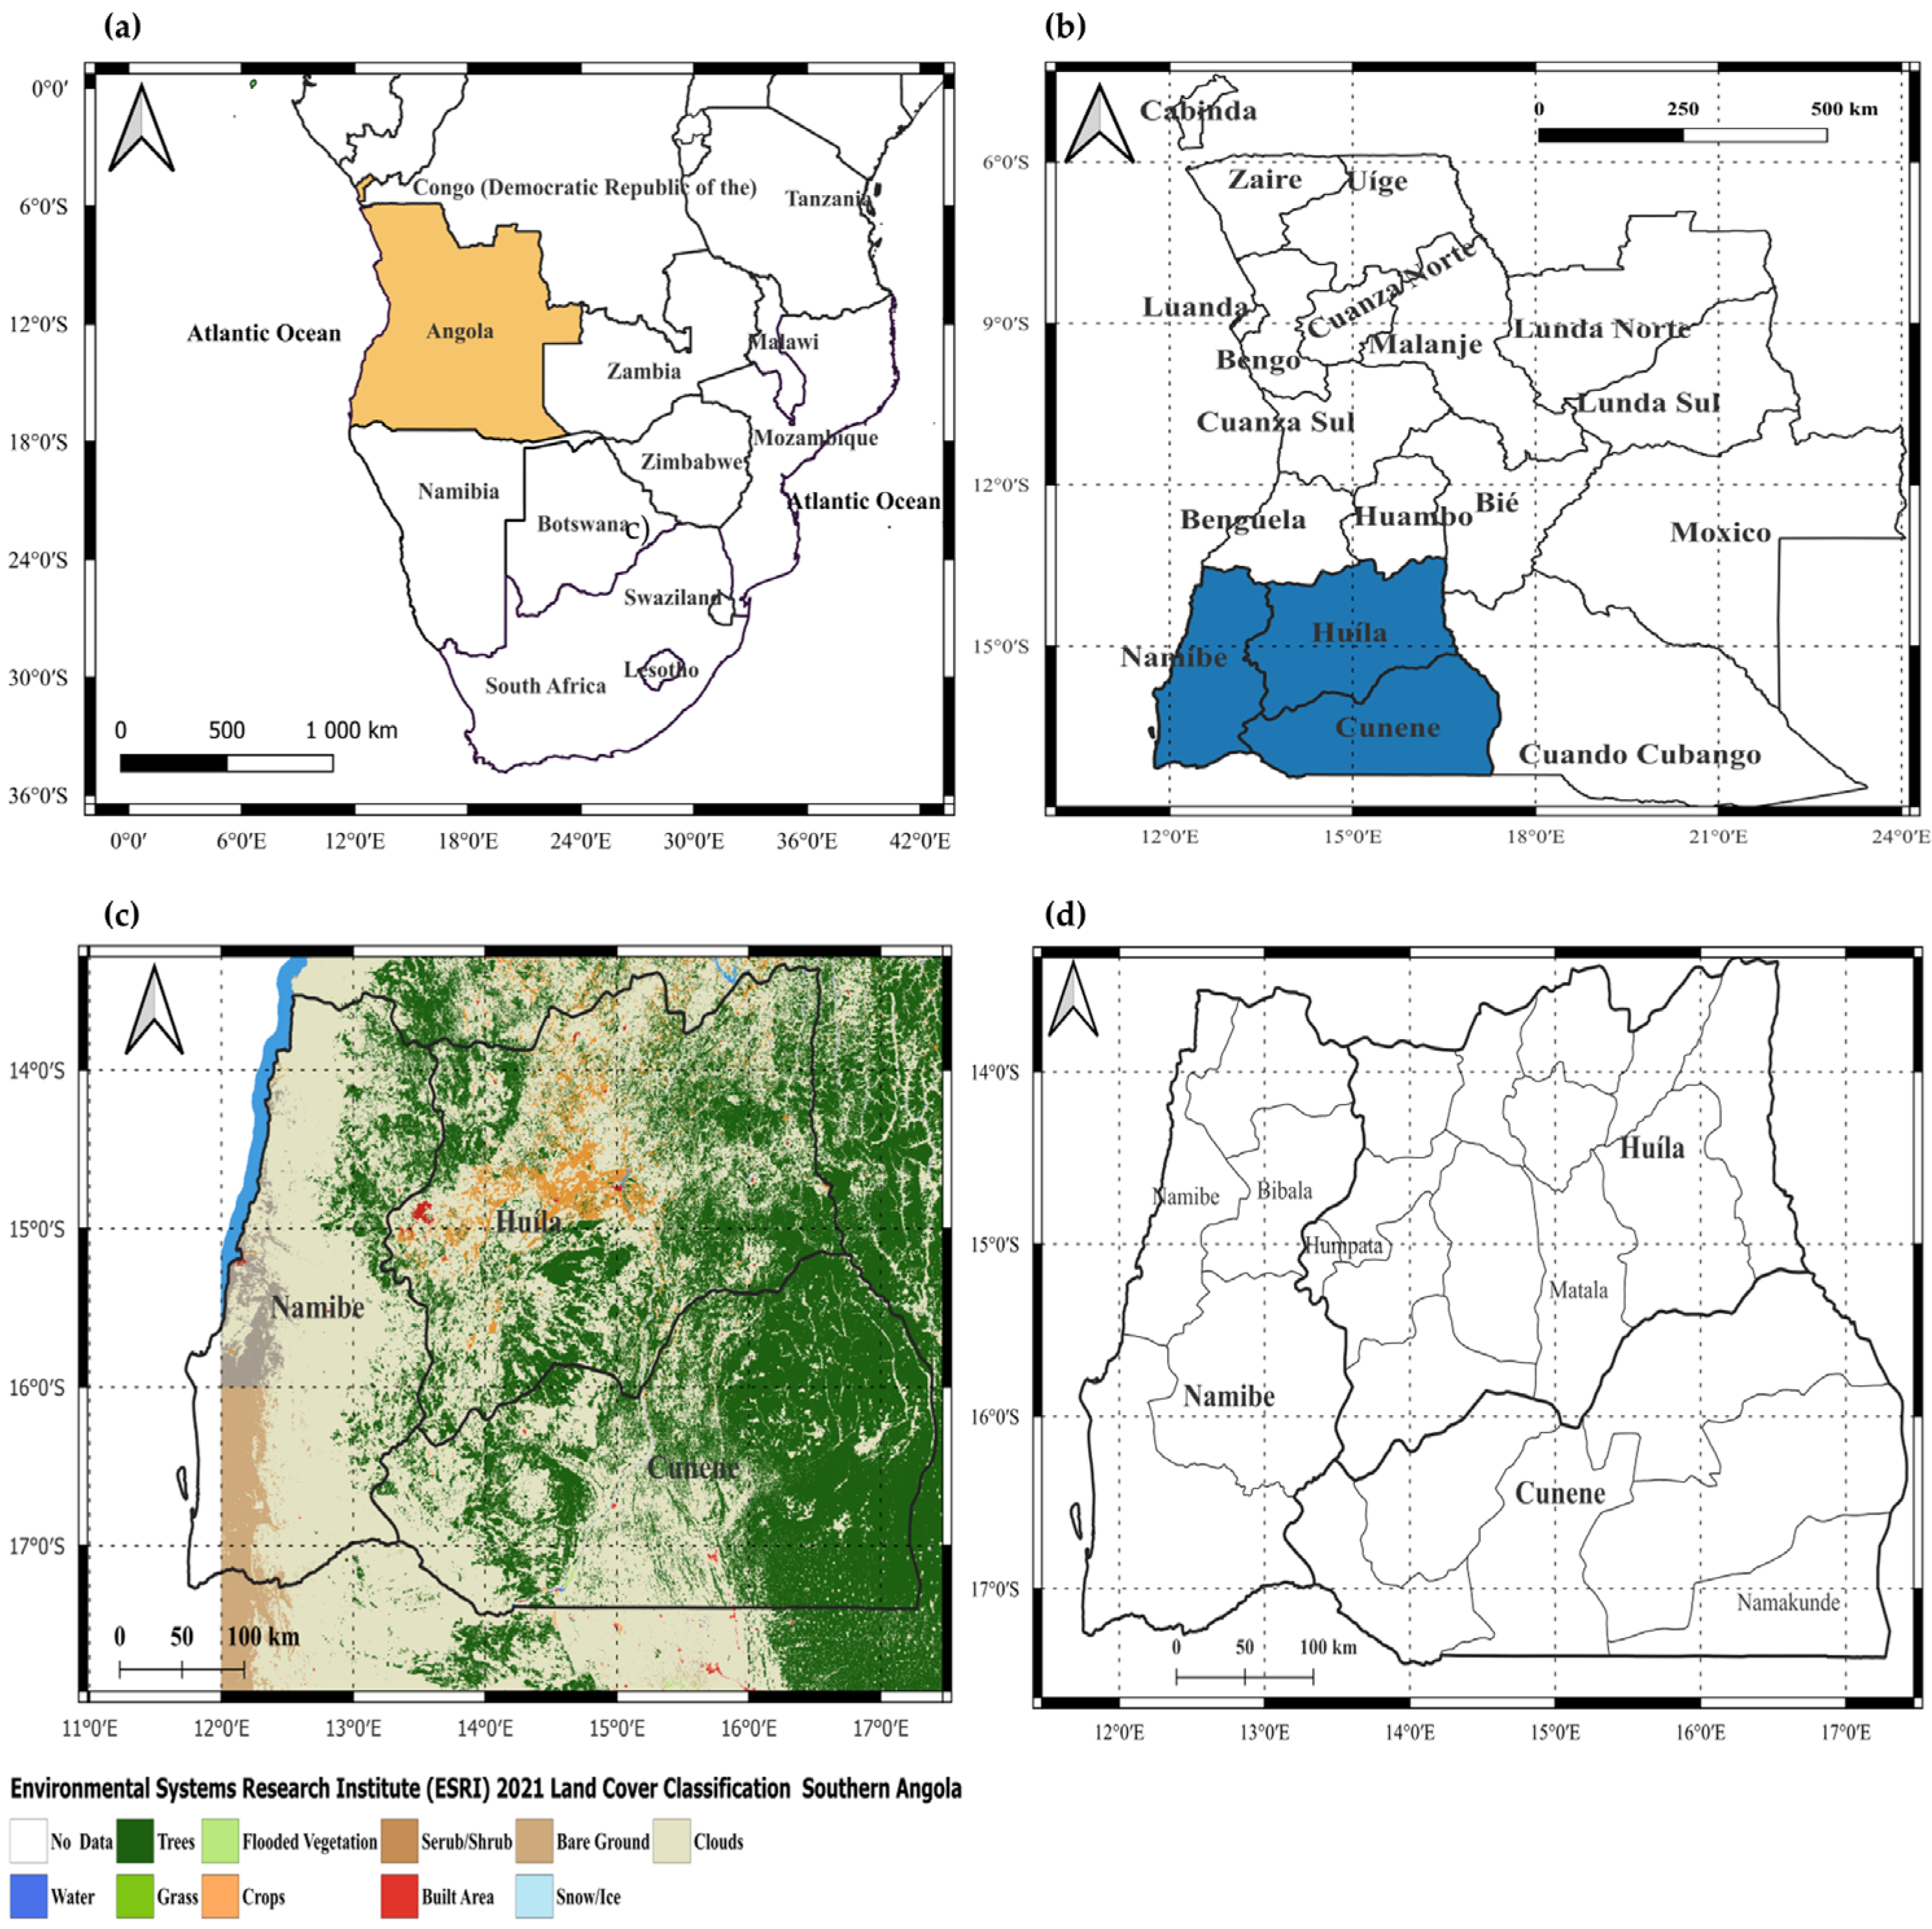
Angola is a large country in southern Africa, with a total area of 1,246,700 km2. It is bordered to the north and northeast by the Democratic Republic of the Congo, to the east by Zambia, to the south by Namibia, and to the west by the South Atlantic Ocean (Figure 1). Additionally, Angola includes the exclave of Cabinda, which borders the Republic of the Congo to the north [7,28].
The study area is located in the southeastern region of Angola, spanning a latitudinal range of 11°54′ S to 13°54′ S and a longitudinal range of 18°05′ E to 20°34′ E [23]. According to the Köppen–Geiger climate classification, Huíla presents a subtropical highland climate (Cwb) in elevated areas such as Lubango and a hot semi-arid climate (BSh) in its lower, drier zones. Namibe is predominantly characterised by a hot desert climate (BWh), with minimal precipitation and strong influence from the Benguela Current; and Cunene has a hot semi-arid climate (BSh), marked by irregular rainfall, long dry seasons, and frequent drought episodes [29].
Figure 1. Map of Southern Africa: (a) Angola’s geographical location on the African continent is highlighted in light brown; (b) the geographical location of the southern region, encompassing the provinces of Huíla, Namibe, and Cunene, within Angola; (c) land use and soil cover mapping of the southern region for the year 2021 (adapted data from Karra, Kontis, et al., 2021) [30]; (d) location of stations in the southern region.
Climate 13 00173 g001

2.2. Global Reanalysed Data and Local Observational Data

Climate data comprises gridded variables from the ERA5-Land analysis data provided by ECMWF. This dataset offers valuable resources for studying land surface processes, monitoring terrestrial hydrological changes, assessing temperature variations, and analysing vegetation dynamics [31]. As an alternative to local weather station data, the ERA5-Land analysis dataset, developed by the European Centre for Medium-Range Weather Forecasts (ECMWF), offers high-resolution gridded (0.1° × 0.1°; ~9 km × 9 km) climate data and physically consistent variables derived from state-of-the-art data assimilation techniques and atmospheric models [32]. ERA5-Land consistently describes the evolution of the water and energy cycles over land throughout the available period and can be used, among other applications, to assess trends and anomalies. This is achieved through high-resolution global numerical integrations of the European Centre for Medium-Range Weather Forecasts (ECMWF) land surface model, driven by downscaled meteorological forcing from the ERA5 climate reanalysis, which includes an elevation correction for the near-surface thermodynamic state [33]. Thanks to its temporal continuity and spatial completeness, ERA5-Land is increasingly used for regional climate analysis and long-term trend assessments, particularly in situ data with sparse regions, such as southern Angola.
Based on the ERA5-Land dataset described above, the following daily meteorological variables were extracted and analysed over the study region, projected onto a 0.1° × 0.1° latitude/longitude grid (~9 km × 9 km resolution), covering the period from 1950 to 2024:
  • Annual means of daily maximum temperature (Tmax);
  • Annual means of daily minimum temperature (Tmin);
  • Annual means of daily mean temperature (Tmean); and
  • Annual precipitation totals.
Furthermore, to assess changes in precipitation extremes and patterns, several precipitation-related indices were computed using the aforementioned daily precipitation data from the ERA5-Land reanalysis [31]. The dataset, which offers relatively high-resolution gridded daily precipitation values, served as the basis for computing the following indices, using the Climate Data Operators (CDO) tool:
  • The total accumulated precipitation from all wet days (≥1 mm) over a given period (PRCPTOT);
  • The total precipitation amount from very wet days (R95p);
  • The percentage of total precipitation contributed by very wet days, defined as days with daily precipitation above the 95th percentile of a reference period (R95pTOT);
  • The maximum number of consecutive days with precipitation below 1 mm (CDD); and
  • The maximum number of consecutive days with precipitation equal to or above 1 mm (CWD).
Moreover, daily observational data from Angolan weather stations, covering the period from 2011 to 2023 and provided by the SASSCAL project, were also used. The included stations were Matala, Humpata, Namacunde, Bibala, and Namibe. These data consist of daily precipitation and temperature series (maximum, minimum, and mean) [34]. Climate studies in Angola have faced difficulties in recent years due to the collapse of the network of meteorological stations maintained during the colonial era [18]. According to the Initial National Report of the Ministry of Environment (GA, 2013), the country’s meteorological network dropped from 225 climate stations in 1974 to none in 2010 [18,35]. Meanwhile, the number of synoptic stations decreased from 29 in 1974 to 23 in 2010, of which 12 were automatic and 11 were conventional. Since then, the network has been strengthened with 22 automatic stations established by SASSCAL, aimed at improving adaptation to climate change and sustainable land management [18]. Angola has made efforts to improve its meteorological station network, with SASSCAL installing a total of 45 weather stations in the country, while the FRESAN project has contributed to enhancing the network’s capacity and coverage in the southern region [36].
To assess the agreement between observed data and ERA5-Land temperature estimates, statistical analyses were performed using standard metrics. Scatterplots were also generated to visually examine the correspondence and potential biases between the two datasets for each station.
Agricultural production data for Angola were sourced from the FAOSTAT database, maintained by the Food and Agriculture Organisation of the United Nations (FAO), which provides standardised and internationally comparable agricultural statistics. The data include national production figures from 1961 to 2023 [37].
The agricultural production data used in this study were obtained from the FAOSTAT database, maintained by the Food and Agriculture Organisation of the United Nations (FAO) [38]. FAOSTAT compiles agricultural statistics reported by national governments. When official data are unavailable, incomplete, or delayed, the FAO applies standardised statistical models and imputation methods to estimate values. Each data entry is accompanied by a metadata flag indicating whether it is based on official reports, FAO estimates, or imputations [38]. The database also provides detailed metadata describing the definitions, collection methods, units of measurement, and quality indicators for each dataset. Importantly, the yield data retrieved from FAOSTAT [37] refer specifically to crop production per unit area, expressed in tonnes per hectare (t/ha). This standardisation enables reliable comparisons across years and regions, as it minimises the influence of fluctuations in cultivated area caused by socioeconomic conditions, land-use changes, or other non-climatic factors. While FAOSTAT is widely used due to its global coverage and temporal consistency (starting from 1961), it is important to note that in countries with limited statistical capacity, such as Angola, the estimates may have higher levels of uncertainty [38]. Therefore, results derived from FAOSTAT data should be interpreted with appropriate caution, particularly in data-scarce regions.

2.3. Methodology

2.3.1. Methodological Framework and Technical Roadmap

Figure 2 outlines the methodological pathway adopted in this study, from defining the research scope to data selection, statistical analysis, and interpretation of results. The flowchart summarises the integration of ERA5-Land climate data and FAOSTAT agricultural statistics, along with the analytical procedures applied to assess trends and climate–agriculture relationships in southern Angola. This visual representation provides a clear and structured overview of the technical steps and decisions that guided the study.

2.3.2. Statistical Metrics for Model Validation

We apply three commonly used statistical metrics—Pearson correlation coefficient (r), bias, and root mean square error (RMSE)—to assess the agreement between the ERA5-Land reanalysis and ground-based observations. These indicators provide complementary information about the strength, direction, and magnitude of discrepancies between datasets [39,40]. Their definition is as follows:
Pearson Correlation Coefficient (r)
The Pearson coefficient measures the strength and direction of the linear relationship between two variables:
r = i = 1 n X i X ¯ Y i Y ¯ i = 1 n X i X ¯ 2 i = 1 n Y i Y ¯ 2
where
  • X i : observed value at time i ;
  • Y i : reanalysis (ERA5-Land) value at time i ;
  • X ¯ and Y ¯ are the means of observed and ERA5-Land values, respectively;
  • n : number of data pairs.
Following the validation of ERA5-Land against local station observations, this study proceeds to assess long-term climatic trends across southern Angola. Building upon this validation, the full ERA5-Land dataset (1950–2024) was used to investigate historical climate evolution in the provinces of Cunene, Huíla, and Namibe. This dataset offers a consistent and spatially continuous perspective on climate variability across the region. A statistical trend analysis was carried out to detect low-frequency changes in the time series of Tmax, Tmin, Tmean, and key precipitation indices, including PRCPTOT, CDD, CWD, R95p, and R95pTOT. Both parametric (linear regression) and non-parametric methods (Sen’s slope and Mann–Kendall test) were applied to identify significant long-term trends across the study area. In parallel, the agricultural production time series were analyzed using linear regression models to assess trends and potential correlations with climatic variables. The FAOSTAT data were processed to extract annual values for key crops, which were then statistically compared with temperature and precipitation indices over the 1961–2023 period.

2.3.3. Linear Regression

Linear regression is a simple yet effective method for identifying patterns in time series. It enables the quantification of the direction and intensity of low-frequency variation over time. The series trend has been estimated using the simple linear regression equation [41]. The significance of the trend was verified with the corresponding p-value and the coefficient of determination, R2, for each indicator and province.

2.3.4. Mann–Kendall’s Trend Test

The non-parametric Mann–Kendall (MK) test was also used, given its widespread application in monitoring trends across diverse variables, such as climatic indicators [42,43]. Positive values from the trend test indicate an upward trend in parameters over time, whereas negative values signify a downward trend [44]. The trend analysis proceeds in two phases: initially, the MK test assesses the presence of a consistent linear increase or decrease; subsequently, Sen’s non-parametric slope estimator is employed to quantify the magnitude of this linear trend, providing a quantitative representation of the parameters’ change. The MK test has emerged as the most prevalent trend test among various time-series trend detection methodologies, owing to its simplicity, capacity to accommodate non-Gaussian distributions, and ability to mitigate the influence of outliers and erroneous values in the time series. Moreover, the trend test can be implemented across diverse temporal scales, including monthly, seasonal, or annual.
The MK trend test is applied to an n -length series of values x i , i = 1,2 n 1 . The MK statistic, S, can be calculated by the following Equations (2) and (3).
S = i = 1 n 1 j = i + 1 n s g n x j x i
s g n x j x i = + 1 , x j > x i 0 , x j = x i 1 , < ( x j < x i )
If the number of records used for the test is greater than 10 (n > 10), then the average of the distribution statistic is approximately equal to zero, and the variance of S is calculated using Equation (4):
V a r ( S ) = n n 1 2 n + 1 i = 1 m t i i i 1 2 i + 5 18
where t i represents the number of observations that are tied in the i-th group of ties. The statistic Zc (standard average deviation) for n > 10 can be calculated with values of S and Var(S) using Equation (5):
Z c = S 1 V a r ( S ) , S > 0 , 0 , S = 0 , S + 1 V a r ( S ) , S < 0 .

2.3.5. Sen’s Slope Estimate

Since the MK test indicates the direction of trends (positive or negative), Sen’s slope estimate can be used as a complementary statistical test to determine the magnitude of that decrease or increase. Sen’s slope quantifies the rate of increase or decrease corresponding to the MK trend. Assuming a linear trend in the dataset, Sen’s slope provides a robust estimate of this rate using a simple non-parametric and systematic procedure [45,46]. Slope pairs for all data points can be calculated using the following Equation (6):
T i = x j x k j k , i = 1,2 , 3 . n , j > k ,
where T i is the slope and x j , and x k are the data values at time j and k , respectively. The mean of the n values of, T i is encoded as Sen’s slope estimator Q i and is calculated using Equation (7).
Q i = T n + 1 2 , n   i s   o d d , 1 2 T n 2 + T n + 2 2 n   i s   e v e n

3. Results

3.1. Validation of ERA5-Land Data Using Observational Records

Due to significant inconsistencies, discontinuities, and substantial gaps in the observational records from local meteorological stations, precipitation data were excluded from the study from the outset. They were not considered at any stage of the analysis.
For temperature variables (Tmax, Tmin, and Tmean), an initial comparison was carried out between ERA5-Land reanalysis data and records from the five available weather stations (Matala, Humpata, Bibala, Namacunde, and Namibe). However, due to the short duration of records (5–10 years), data discontinuities, and concerns about data homogeneity, these station records were deemed unsuitable for direct validation. This preliminary comparison is presented solely as supplementary material to ensure methodological transparency.
Consequently, all primary trend and correlation analyses were conducted exclusively using ERA5-Land data, which offer continuous spatial and temporal coverage and have been validated in numerous climate studies across tropical and semi-arid regions, including contexts similar to those covered in this study, such as the provinces of Huíla, Namibe, and Cunene.
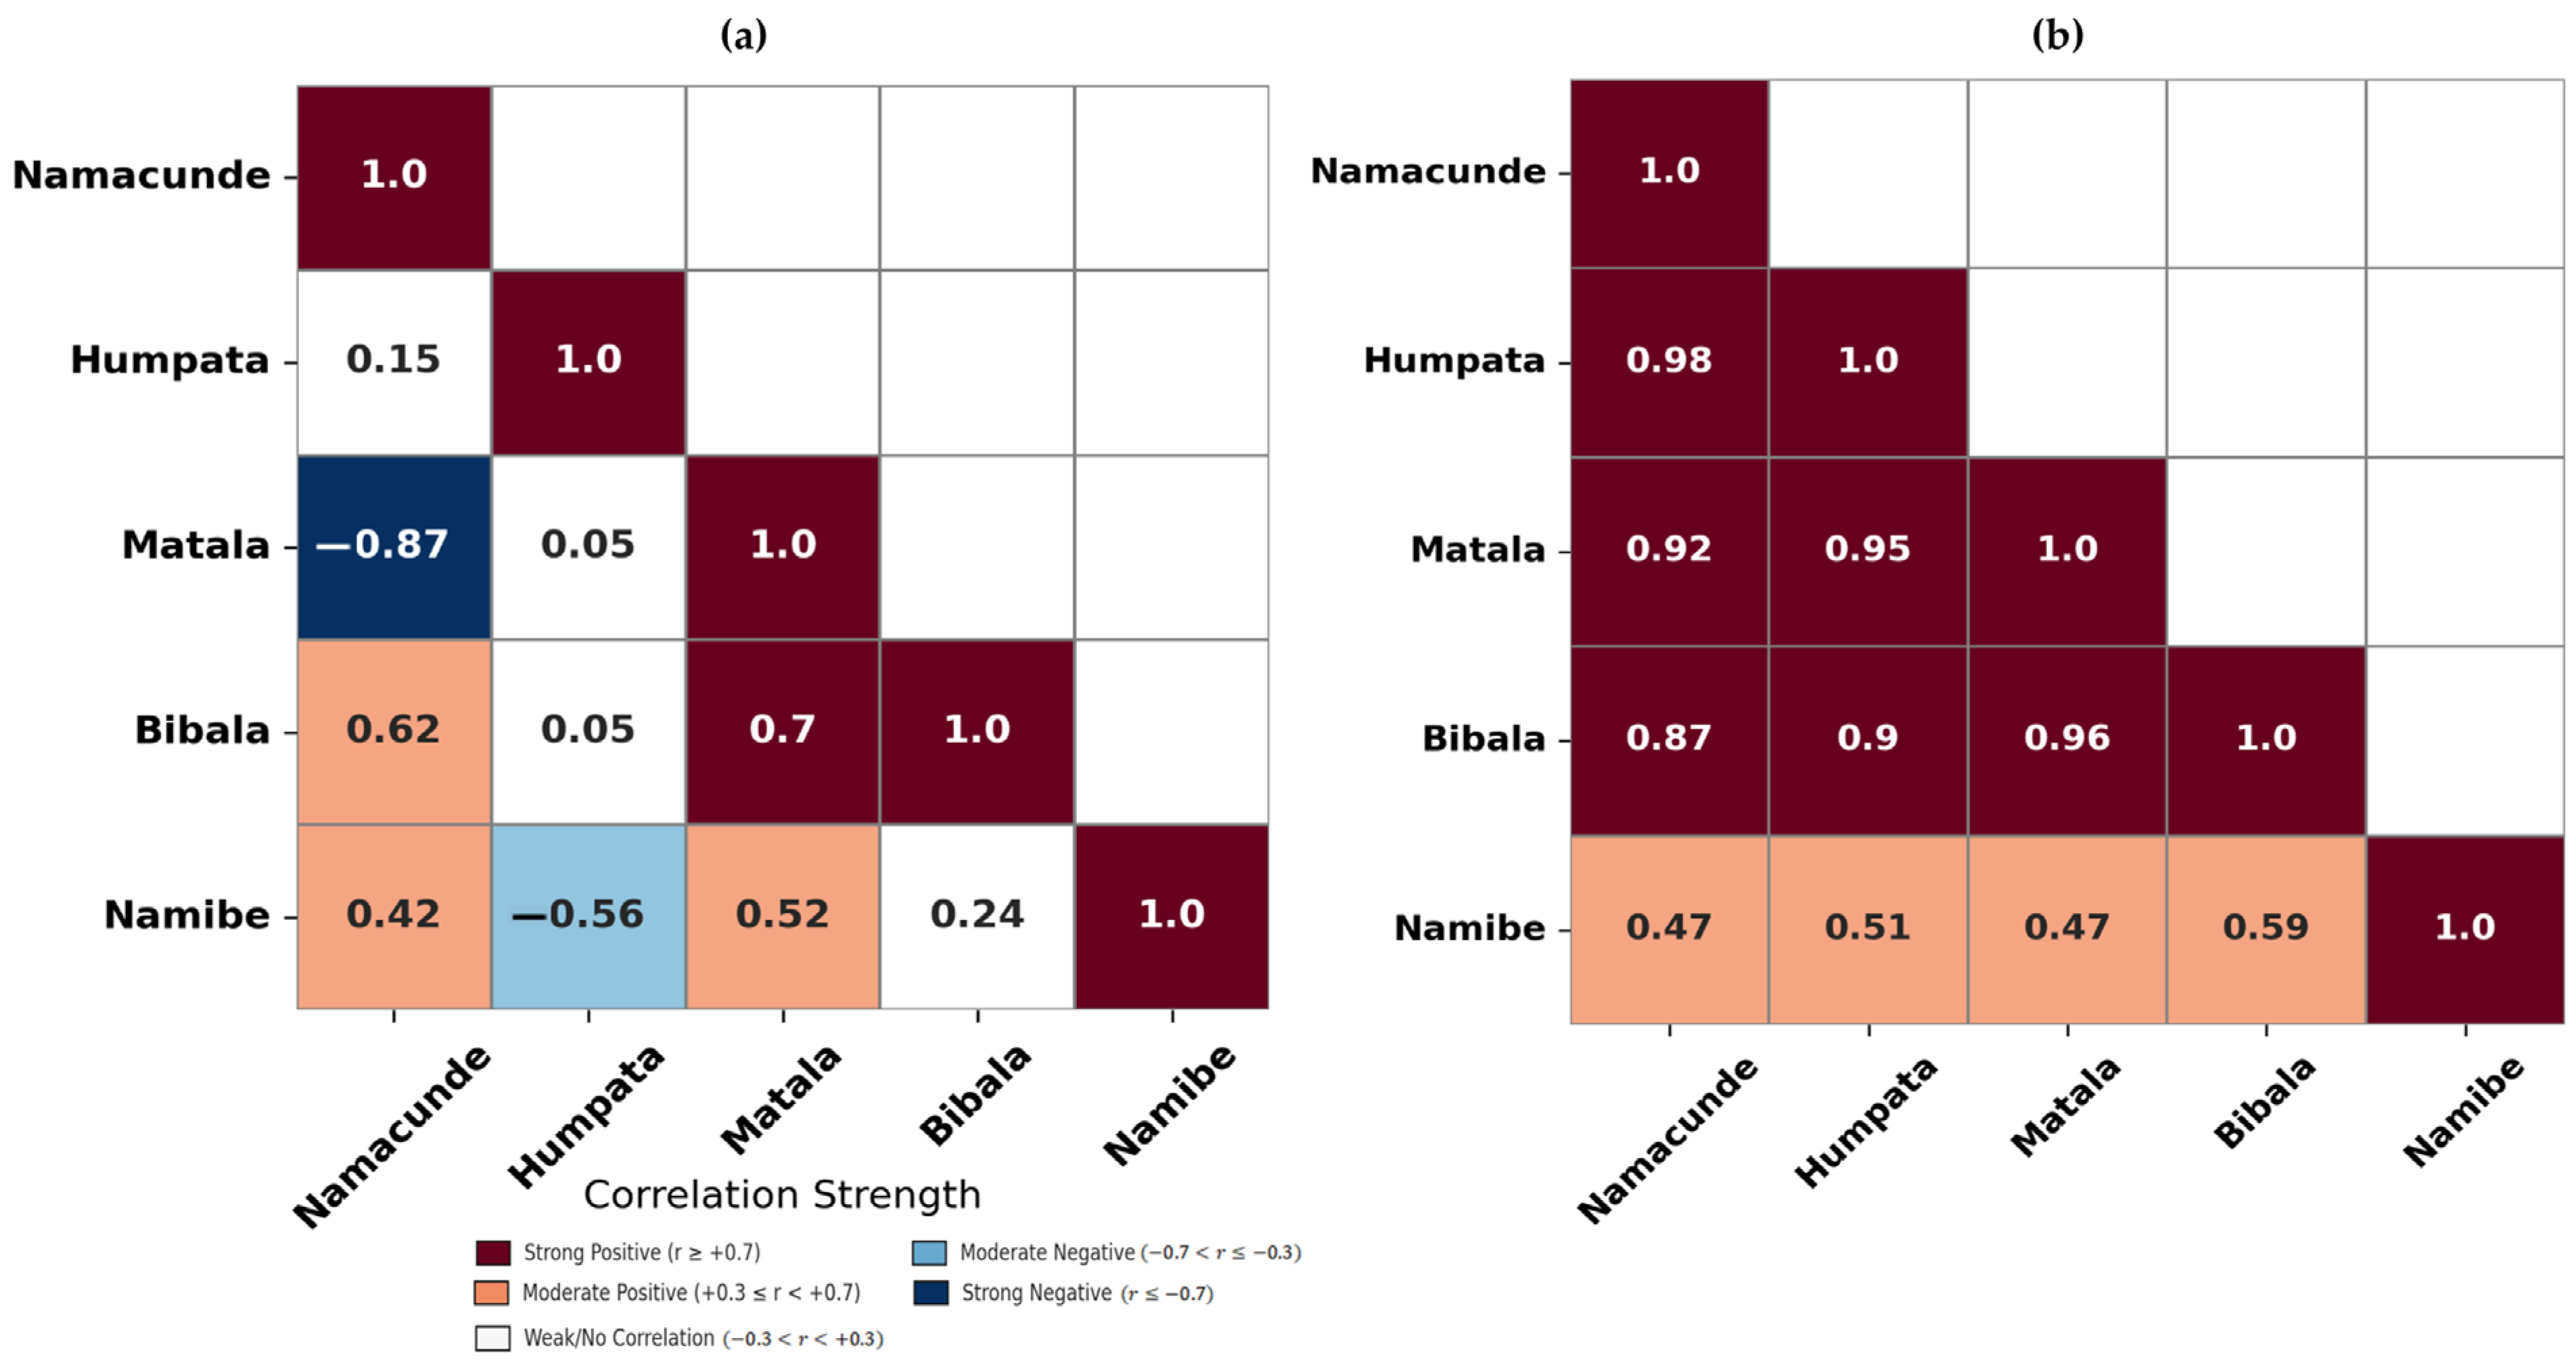
As an illustration, Figure 3 presents an evaluation of the spatial consistency of Tmean through Pearson cross-correlation matrices among meteorological stations (Figure 3a) or the corresponding ERA5-Land data (Figure 3b). This approach allows for the assessment of the spatial consistency in the observational records and, simultaneously, the comparison with ERA5-Land, which is based on a dynamically coherent approach. It is important to note that the correlations based on observational data are derived from relatively short time series, ranging from 5 to 10 years, whereas the ERA5-Land correlations cover a much longer period, from 1950 to 2024.
Figure 3a reveals substantial spatial inconsistencies, with most inter-station correlations falling within the weak or negative range of correlations. For example, strong negative correlations are observed between Matala and Namacunde (r = −0.87) and between Namibe and Humpata (r = −0.56), while only a few pairs, such as Matala–Bibala (r = 0.70), show moderate to strong positive correlations. Although poor station maintenance may be a factor affecting the correlation results between them, this cannot be considered the only explanation for the observed patterns [47,48]. In panel (a), the period from 2014 to 2023 is being compared, while in panel (b), the period from 1950 to 2024 is analysed. Thus, it is natural that the correlation with ERA5-Land is stronger in the second case, due to the greater temporal coverage [49]. If the stations had a longer temporal coverage, such intense negative correlations as those observed would be less likely [50]. The stations located in the province of Namibe, such as Namibe and Bibala, present weaker correlations due to the influence of cold and humid air flows coming from the South Atlantic, in addition to the impact of stratocumulus and fog that affect the desert region [47,48,51,52]. On the other hand, Figure 3b shows the corresponding cross-correlation matrix derived from ERA5-Land reanalysis data for the full period of 1950–2024. In contrast to the observational dataset, ERA5-Land displays high spatial coherence, with most correlation coefficients exceeding 0.85, indicating strong spatial-temporal consistency. The relatively lower correlations with Namibe (e.g., Namibe–Matala: r = 0.47) may also reflect specific atmospheric characteristics, such as coastal influences related to the cold oceanic Benguela current, which commonly creates very contrasting conditions with inland areas of southern Angola, as stated in the previous paragraph [53,54,55].
Although useful for a general validation, given the short temporal coverage (5–10 years) and inconsistencies among weather stations, these records are unsuitable for climate trend analysis [56]. In contrast, the strong spatial coherence observed in the ERA5-Land data, along with its long-term and uninterrupted temporal coverage, supports its use in validating and assessing climate trends [49]. Hence, ERA5-Land data will be used to assess regional climatic trends in the following section.

3.2. Climate Trend Analysis

3.2.1. Temperature Trends

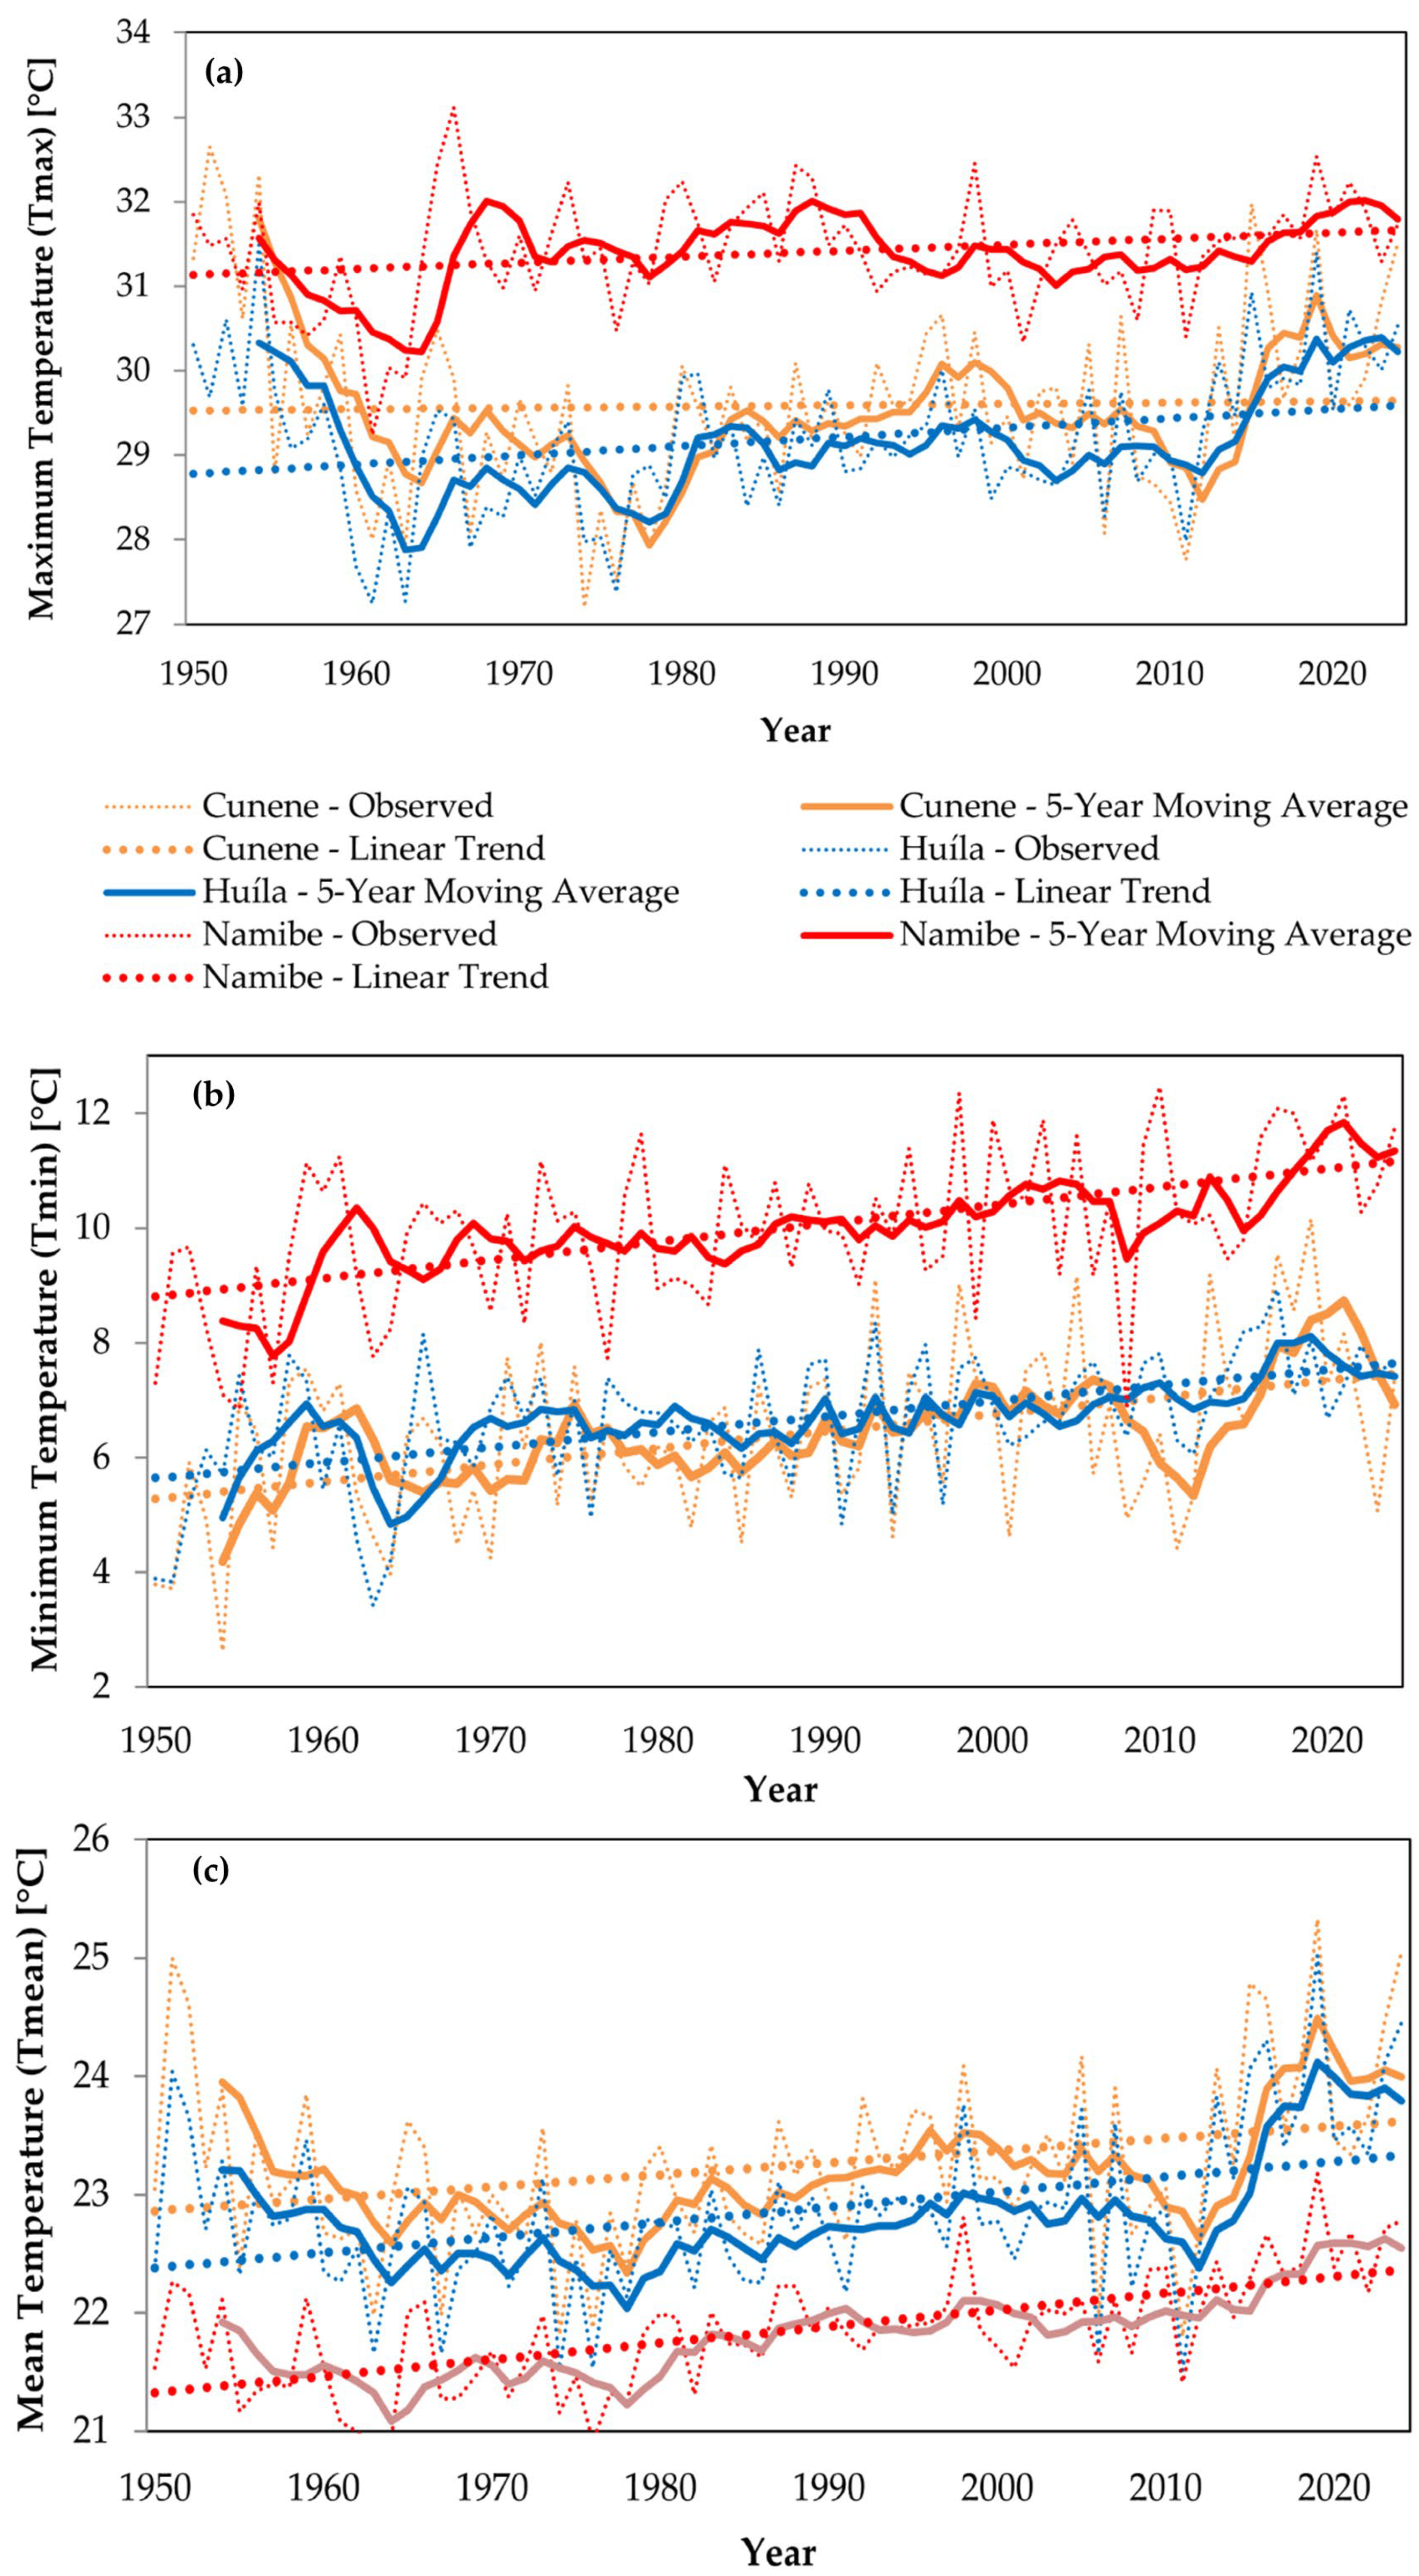
The analysis focused on eight key climatic variables essential for understanding climate trends in the three selected provinces of Huíla, Namibe, and Cunene. These variables are Tmax, Tmin, Tmean, PRCPTOT, R95p, R95pTOT, CDD, and CWD. In this study, we examined how these variables evolved from 1950 to 2024 to identify patterns of regional climate variability and/or change. To visualise the temporal evolution of the climatic variables, chronograms were generated, illustrating the trends of Tmax, Tmin, and Tmean for the provinces of Huíla, Namibe, and Cunene over the period from 1950 to 2024. Linear regression lines are also plotted, along with the 5-year moving averages for each series.
To confirm the observed trends, a statistical analysis was conducted to quantify the magnitude of these changes and assess their significance. For each variable, the linear regression slope, coefficient of determination (R2), and p-value were calculated to assess the strength and statistical significance of the linear trends. Additionally, a non-parametric approach was employed, utilising the Sen slope estimator and the Mann–Kendall test to detect monotonic trends and quantify their magnitude. The Kendall Tau coefficient was also computed to assess the strength of the correlation. Table 1, Table 2 and Table 3 present the statistical results of trend analyses for Tmax, Tmin, and Tmean in Cunene, Huíla, and Namibe from 1950 to 2024. These outcomes hint at the statistical robustness of the observed warming trends, confirming that most of these changes are not attributable to random variability but represent significant long-term climate signals.
The analysis of the climatic variables in the provinces of Huíla, Namibe, and Cunene, based on the observations of maximum (Tmax), minimum (Tmin), and mean (Tmean) temperatures, between 1950 and 2024, reveals a consistent trend of regional warming. As shown in Figure 4a, the annual maximum temperature (Tmax) displays an increasing trend in all three provinces, with a more pronounced pattern in Huíla. From Sen’s slope analysis, it was found that the rate of increase in Tmax in Huíla was +0.0171 °C/year, indicating the highest rate of warming. Table 1 confirms that the trend in Huíla is statistically significant, with a p-value of virtually zero, validating the observed increase (also confirmed by the Mann–Kendall test). In Namibe and Cunene, Tmax increase was more modest, with the growth rate in Namibe being +0.008 °C/year, which is also significant (p-value of 0.026 for Namibe, as shown in Table 1, though lower compared to Huíla. These results indicate continued warming in all three provinces, with Huíla being the most affected region, which may be related to geographic characteristics or specific climatic patterns of that province. It is worth noting that for Cunene, no clear trend was observed, although there is an increase in temperature.
Figure 4b shows that the minimum temperatures (Tmin) also show a clear increasing trend in all provinces, with the highest rate of increase recorded in Namibe at +0.0324 °C/year, as indicated by Sen’s slope analysis. Table 2 confirms that this trend is statistically significant in all provinces, with very low p-values (close to 0.000), highlighting that the increasing trend in Tmin is robust. This pattern may be associated with the rise in global average temperatures, the intensification of heatwaves, and a possible reduction in the variability of minimum temperatures. The more pronounced increase in Tmin in Namibe may also be linked to changes in precipitation patterns and a potential increase in the frequency of extreme weather events.
Finally, Figure 4c shows that the mean temperature (Tmean) follows the same warming trend observed for Tmax and Tmin. In Huíla, the rate of increase was +0.0164 °C/year, one of the highest among the variables analysed, according to Sen’s slope analysis. Table 3 shows that the increasing trends in Tmean are also statistically significant in all provinces, with very low p-values, indicating that the observed changes are not random. All statistical tests confirmed significant increases for this variable in the study area. These findings highlight a coherent regional warming pattern in southern Angola, in alignment with global projections of increasing average temperatures [57].

3.2.2. Precipitation Trends

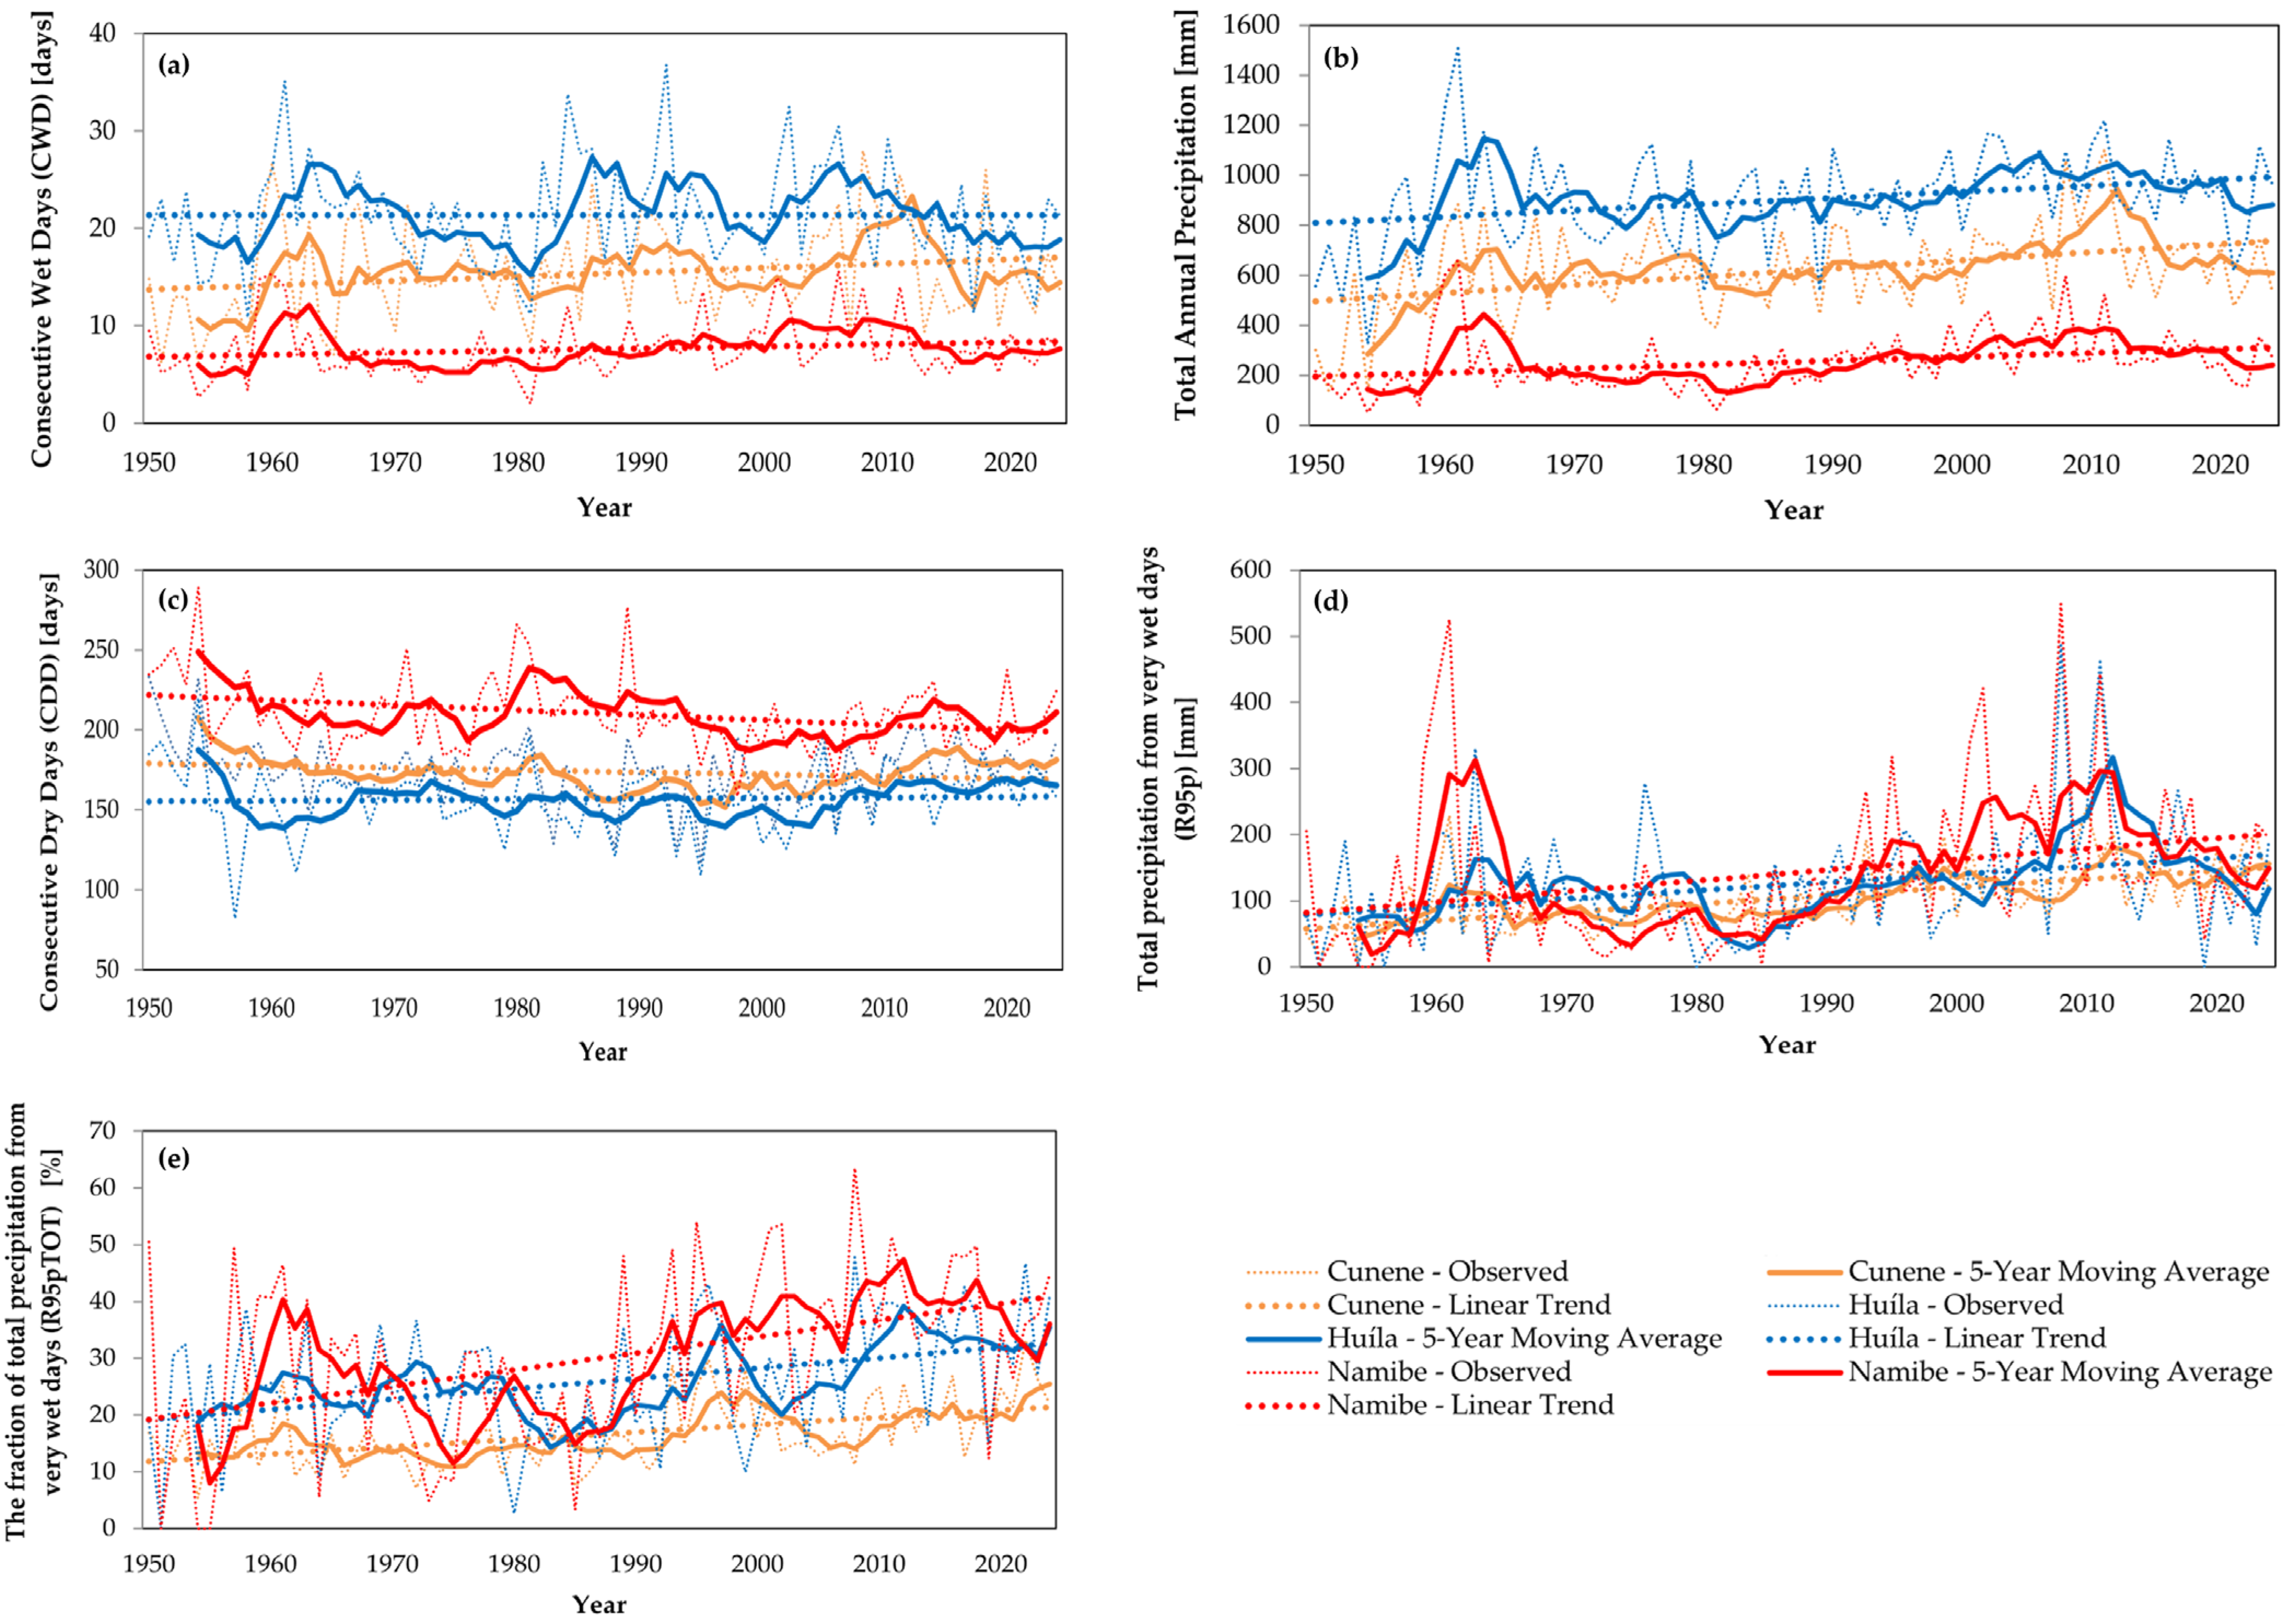
Table 4 depicts the precipitation-related variables analysed in this study, which are widely considered extreme indices [58]. To better identify trends in precipitation-related variables, chronograms were generated illustrating the temporal evolution (1950–2024) of the variables CWD, CDD, Total Annual Precipitation, R95p, and R95pTOT and for each province separately (Figure 5). Overall, the analysis of precipitation-related variables reveals significant climatic trends in Huíla, Namibe, and Cunene. The increases in total and extreme precipitation in the three provinces, as well as the variation in consecutive dry and wet days, are noteworthy. As previously carried out for the temperature-related variables, a statistical analysis was also performed for the precipitation-related variables to confirm the significance of observed trends (Table 5, Table 6, Table 7, Table 8 and Table 9).
Figure 5a, for the CWD, reveals that there was no statistically significant trend in any of the provinces, as seen in Table 5. The variables for Cunene, Huíla, and Namibe showed high p-values (above 0.05), indicating that there is no substantial change in the number of consecutive wet days. Although there is a natural variability in precipitation patterns, a reduction in the CWD over the last two decades is observed, as seen in Figure 5a. However, this trend is not statistically significant, as indicated by the trend tests in Table 5, suggesting that the observed fluctuations may be due to natural variability in the data. The analyses of the CDD (Figure 5b) show an interesting trend in Namibe, where there is a significant decrease in the number of consecutive dry days, with a Sen’s slope of −0.265 and a p-value of 0.029, as shown in Table 6. However, while this reduction in consecutive dry days is observed in Namibe, the trend is still not entirely robust, as the p-value for the Mann–Kendall test is marginal. In contrast, no significant trends were observed in the provinces of Cunene and Huíla, as indicated by their high p-values of 0.784 and 0.826, respectively. These results suggest that while there are fluctuations in consecutive dry days, no statistically significant trends are present in these regions.
Figure 5c, showing PRCPTOT, reveals a consistent trend of increasing precipitation in all three provinces. According to Table 7, statistical analyses confirm this increasing trend, with Cunene (Sen’s slope of +2.598 mm/year), Huíla (Sen’s slope of +2.930 mm/year), and Namibe (Sen’s slope of +1.886 mm/year) showing very low p-values, all significant (below 0.05). These results suggest that over time, there has been an increase in the amount of annual precipitation, especially in Huíla, which showed the largest average increase.
Regarding extreme precipitation (R95p), Figure 5d shows an increasing trend, especially in Cunene and Huíla. Table 8 confirms that although Cunene and Huíla showed high p-values for R95p, the positive Sen’s slopes indicate a slightly increasing trend in extreme precipitation. In particular, Cunene shows a Sen’s slope of +0.037 and a p-value of 0.177, though the trend is not statistically significant.
Figure 5e and Table 9 indicate a clear increasing trend in the fraction of extreme precipitation (R95pTOT) in all provinces. Cunene exhibits a strong increasing trend, with a Sen’s slope of +0.009 and a p-value < 0.001, indicating a statistically significant increase in total extreme precipitation over the study period. In Huíla, the Sen’s slope of +0.001 and the p-value of 0.001 also indicate a significant increase, while in Namibe, although the increase is observed, the p-value of 0.031 suggests a weaker trend.
R95pTOT has increased across all three provinces, with the highest rate observed in Namibe (Sen’s slope: +0.011%/year). Although the annual increments are modest, the trends are statistically significant, indicating a gradual intensification in the frequency of extreme precipitation events. Nevertheless, this increase does not imply more regular precipitation. On the contrary, recent observations and reports highlight increasing irregularity and prolonged droughts, especially in Huíla [9,59]. These changes are likely shifting the temporal distribution of precipitation, which in turn disrupts agricultural calendars and affects crop growth and development.
Together, these results provide a comprehensive overview of precipitation trends, enabling robust comparisons of precipitation intensity, frequency, and distribution across the southern provinces of Angola. They also offer insights into the statistical significance and practical implications of these trends in the context of increasing climate variability.
Despite the aforementioned results, it is important to highlight that these trends do not imply the absence or decrease of drought occurrences during the analysis period. On the contrary, several studies have documented the occurrence of severe-to-extreme droughts in specific decades (such as the 1980s and 1990s, as well as in 2012 and 2019), which had profound impacts on agriculture and livelihoods [10,14,15,35,60,61]. This apparent contradiction arises because statistical trends reflect long-term average behaviour, which can coexist with high intra-annual, interannual, and inter-decadal variability. As highlighted in the literature, the central and southern regions of Angola exhibit significant uncertainties regarding precipitation patterns [62]. Precipitation is a complicated, uncertain, and difficult-to-measure variable, and there is no certainty that it will decrease in the future. In the central plateau of Angola, projections suggest an increase in precipitation in the future, though with considerable uncertainty [16,63]. This apparent contradiction arises because statistical trends reflect long-term average behaviour, which can coexist with high intra-annual, interannual, and inter-decadal variability. Therefore, even in the context of an overall increase in precipitation, periods with very dry conditions may still occur. The growing irregularity and intensification of precipitation events may exacerbate water scarcity and agricultural vulnerability in the region [9,13]. These findings likely reflect a shift toward more intense and concentrated precipitation events with extended dry periods, which is one of the footprints of climate change [10,15]. Concentrated precipitation within shorter timeframes can reduce water infiltration and increase surface runoff and soil erosion, ultimately posing challenges to agricultural productivity [35,64].

3.3. Full Climate-Crop Statistical Analysis for Angola (1961–2023)

3.3.1. Impact of Isolated Climate Variables on Crop Yield (2000–2023)

Given the low correlation values obtained through linear regression and Pearson coefficients, a complementary categorical approach was adopted to identify robust climate–yield associations. This method relies on contingency tables, which classify the frequency of years with above-average yields under specific climatic conditions. Similar to [65], who used contingency tables to validate tea yield forecasts in Kenya when model performance was weak, our results show that even in the absence of strong linear relationships, temperature and precipitation categories can reveal recurring patterns. This enhances interpretability and strengthens the credibility of the findings by linking climatic regimes to consistent yield behavior.
Table 10 presents the percentage of years (2000–2023) in which crop yields were above or below their historical average, stratified by two key climatic variables: mean temperature (Tmean) and total precipitation (PRCPTOT). Rather than relying on a combined climate index, this analysis separates the effects of temperature and precipitation to understand better the isolated contributions of each variable to yield variation.
By examining yield outcomes under specific climatic regimes—namely, conditions above or below the long-term mean for each variable—the table highlights which types of weather patterns are more frequently associated with favorable (above-average) or unfavorable (below-average) crop performance. This approach helps to reveal whether certain crops are more sensitive to heat stress or drought or, conversely, benefit more from cool or wet years. The most frequent percentages (either above or below average) are highlighted in bold to emphasize which climatic regimes are most strongly associated with yield variation.
The contingency structure provides a transparent and interpretable summary of crop–climate relationships, particularly in contexts where traditional correlation analyses yield weak or ambiguous results.
Maize
Under the condition of mean temperature below the historical average (Tmean < mean), 4.0% of the years saw yields above the mean, while 42.0% were below. Conversely, when the temperature was above the mean (Tmean > mean), 46.0% of the years had higher yields, and 8.0% had lower yields.
For precipitation, in years with PRCPTOT below the mean, 36.0% of the years showed above-average yields, and 19.0% showed below-average yields. When precipitation was above the mean, 14.0% of the years were favourable, while 31.0% had below-average yields.
These patterns suggest the sensitivity of milho yield to climatic regimes. For instance, a higher frequency of productive years during warmer (or wetter) years may indicate a positive response to those conditions. Conversely, more frequent poor performance under specific regimes highlights potential vulnerability.
Cassava
Under the condition of mean temperature below the historical average (Tmean < mean), 23.0% of the years saw yields above the mean, while 27.0% were below. Conversely, when the temperature was above the mean (Tmean > mean), 27.0% of the years had higher yields, and 23.0% had lower yields.
For precipitation, in years with PRCPTOT below the mean, 32.0% of the years showed above-average yields, and 23.0% showed below-average yields. When precipitation was above the mean, 18.0% of the years were favourable, while 27.0% had below-average yields.
These patterns suggest the sensitivity of mandioca yield to climatic regimes. For instance, a higher frequency of productive years during warmer (or wetter) years may indicate a positive response to those conditions. Conversely, more frequent poor performance under specific regimes highlights potential vulnerability.
Beans
Under the condition of mean temperature below the historical average (Tmean < mean), 14.0% of the years saw yields above the mean, while 40.0% were below. Conversely, when the temperature was above the mean (Tmean > mean), 36.0% of the years had higher yields, and 10.0% had lower yields.
For precipitation, in years with PRCPTOT below the mean, 32.0% of the years showed above-average yields, and 20.0% showed below-average yields. When precipitation was above the mean, 18.0% of the years were favourable, while 30.0% had below-average yields.
These patterns suggest the sensitivity of feijão yield to climatic regimes. For instance, a higher frequency of productive years during warmer (or wetter) years may indicate a positive response to those conditions. Conversely, more frequent poor performance under specific regimes highlights potential vulnerability.
Millet
Under the condition of mean temperature below the historical average (Tmean < mean), 38.0% of the years saw yields above the mean, while 19.0% were below. Conversely, when the temperature was above the mean (Tmean > mean), 12.0% of the years had higher yields, and 31.0% had lower yields.
For precipitation, in years with PRCPTOT below the mean, 19.0% of the years showed above-average yields, and 31.0% showed below-average yields. When precipitation was above the mean, 31.0% of the years were favourable, while 19.0% had below-average yields.
These patterns suggest the sensitivity of milheto yield to climatic regimes. For instance, a higher frequency of productive years during warmer (or wetter) years may indicate a positive response to those conditions. Conversely, more frequent poor performance under specific regimes highlights potential vulnerability.
Potatoes
Under the condition of mean temperature below the historical average (Tmean < mean), 21.0% of the years saw yields above the mean, while 29.0% were below. Conversely, when the temperature was above the mean (Tmean > mean), 29.0% of the years had higher yields, and 21.0% had lower yields.
For precipitation, in years with PRCPTOT below the mean, 33.0% of the years showed above-average yields, and 21.0% showed below-average yields. When precipitation was above the mean, 17.0% of the years were favourable, while 29.0% had below-average yields.
These patterns suggest the sensitivity of batata yield to climatic regimes. For instance, a higher frequency of productive years during warmer (or wetter) years may indicate a positive response to those conditions. Conversely, more frequent poor performance under specific regimes highlights potential vulnerability.
Sorghum
Under the condition of mean temperature below the historical average (Tmean < mean), 25.0% of the years saw yields above the mean, while 25.0% were below. Conversely, when the temperature was above the mean (Tmean > mean), 25.0% of the years had higher yields, and 25.0% had lower yields.
For precipitation, in years with PRCPTOT below the mean, 25.0% of the years showed above-average yields, and 29.0% showed below-average yields. When precipitation was above the mean, 25.0% of the years were favourable, while 21.0% had below-average yields.
These patterns suggest that sorgo yield is sensitive to climatic regimes. For instance, a higher frequency of productive years during warmer (or wetter) years may indicate a positive response to those conditions. Conversely, more frequent poor performance under specific regimes highlights potential vulnerability.
The contingency framework provides an intuitive and complementary approach to understanding climate–yield relationships, particularly when linear correlations are weak. By focusing on frequency patterns rather than strength of association, this approach provides evidence of how specific climatic thresholds repeatedly influence agricultural outcomes.

3.3.2. Statistical Significance of Contingency Patterns

Significance Test and Visual Representation of Climate Contingency
To verify the statistical robustness of the climate–yield relationships, a chi-square test of independence was performed on the contingency tables built using residual-based frequency analysis.
The results were as follows:
-
Temperature vs. Yield: p-value = 1.51 × 10⁻¹⁷ (highly significant)
-
Precipitation vs. Yield: p-value = 0.00041 (statistically significant)
These values indicate that the observed distribution of years with above- or below-average yield, under different climatic regimes, is not random. Therefore, the frequency of high or low yields is significantly influenced by whether temperatures or precipitation levels were above or below their historical means.
Figure 6 illustrates the frequency distribution of productivity performance across climate conditions:

4. Discussion

The results of this study reveal clear and crop-specific climate sensitivities that traditional linear models often fail to capture. While regression analyses revealed weak to moderate associations between climate variables and crop yields, the contingency analysis provided deeper insights by examining the frequency of yield responses under varying climatic conditions.
Maize demonstrated a strong association with higher temperatures, recording 46% of its above-average yields in years when mean temperature exceeded the historical average. This aligns with the findings of [66], who demonstrated that maize yields can increase under moderate warming in tropical systems, although beyond certain thresholds, thermal stress can become limiting. Millet followed with 31% in such years, indicating relative thermal tolerance. Conversely, cassava and beans showed a more balanced distribution, with a slight tendency to perform better during cooler years, suggesting potential vulnerability to warming conditions. Similarly, ref. [67] found that crops such as cassava and sorghum exhibit greater resilience in hotter and drier African regions.
In terms of precipitation, sorghum and millet again stood out, achieving 31% of their above-average yields during dry years, thereby reinforcing their drought resilience. Potatoes, however, showed the lowest frequency of yield success in wet years—only 17%—indicating heightened sensitivity to excessive soil moisture or rainfall extremes. These patterns are supported by [68], which highlights that many African farming systems are highly vulnerable to both temperature extremes and irregular precipitation.
These findings reinforce the value of crop-specific adaptation strategies. Crops like millet and sorghum are particularly suited to hotter and drier environments. In contrast, crops such as potatoes and beans may require enhanced agronomic support, such as improved drainage or stress-resistant varieties, to thrive under increasingly variable climate conditions.
The use of contingency analysis proved essential in this context. Rather than relying on a combined climate index, this study analysed temperature and precipitation separately to better understand their contributions to yield variability. This approach enhances interpretability, particularly in data-limited environments like southern Angola, where compound indices may obscure crop-specific sensitivities. Our methodology is aligned with existing literature; for instance, refs. [66,69] emphasise the value of isolating climatic drivers when analysing agricultural outcomes under climate variability. It allows for the identification of climate yield relationships based on frequency patterns, which linear models could not detect due to non-linear dynamics, confounding factors, and interannual variability. Contingency-based approaches and categorical climate–yield assessments have proven valuable in other African contexts with limited data, offering insights that regression models often fail to capture [69]. These findings demonstrate that evaluating yield responses through categorical data, particularly in regions with limited or low-quality observational records, can greatly enhance understanding of agricultural vulnerability and adaptation needs.
The study also reveals clear trends in temperature and precipitation across three southern provinces of Angola, namely Cunene, Huíla, and Namibe, over the relatively long period of 1950–2024. The statistically significant increase in Tmax, Tmin, and Tmean across the region aligns with both global and regional climate change projections. For Huíla, a continental and highland region, the highest warming rates were found in Tmax and Tmean, while for Namibe, located in a coastal area, the most pronounced increase was in Tmin. The analysis of total annual precipitation further supports the conclusion of increasing precipitation across all provinces during the study period. Despite high interannual variability, the five-year moving averages and linear trend lines indicate a consistent rise in total annual precipitation, particularly in Huíla. The province of Huila plays a crucial role as a ‘water reservoir’ for the neighbouring provinces of Namibe and Cunene. As described by [70], the rivers originating from Huila direct the water that falls in this region to the adjacent areas, supporting agricultural activities, especially in Namibe, where farming is largely carried out in riverbeds. This behaviour supports the hypothesis of an intensified hydrological cycle, with significant implications for water resource management, agricultural planning, and climate adaptation.
However, a comparison with the R95pTOT index reveals a more subtle picture. While the total precipitation increased, the contribution of extreme precipitation events to total precipitation also increased proportionally, or even more rapidly, in some regions. This pattern suggests that the precipitation increase was not uniformly distributed throughout the year but concentrated in heavy precipitation events. This is particularly concerning as it elevates the risk of extreme impacts such as flooding, agricultural losses, and infrastructure overload. Concurrently, prolonged inter-event drought periods remain a threat, as local reports in Huíla indicate. Furthermore, the decreasing trend in CDD, especially significant in Namibe, suggests a potential reduction in the duration of dry spells. However, CWD showed no statistically significant trend, consistent with the increasing irregularity of precipitation rather than a sustained increase in continuous rainy periods. The combined use of parametric and non-parametric methods strengthens the statistical confidence of the identified trends.
Given the scarcity and inconsistency of observational station data in southern Angola, the study relied exclusively on ERA5-Land reanalysis for climate trend analysis. Although a preliminary comparison (2013–2019) with five local stations (Matala, Humpata, Bibala, Namibe, and Namacunde) showed moderate to strong agreement for Tmax and Tmean, the Tmin values exhibited greater divergence, likely due to local factors such as fog, cloud cover, and station inhomogeneities. These limitations, combined with long gaps and inconsistencies in station data, reinforced the decision to use ERA5-Land exclusively. ERA5-Land offers spatial and temporal consistency and has been validated in similar data-scarce contexts, making it a reliable alternative for long-term climatological assessments in the region. These findings underscore the effectiveness of using categorical approaches to evaluate yield responses, especially in regions where observational records are sparse or unreliable. Such methods provide critical insights into agricultural vulnerability and help inform targeted adaptation strategies under conditions of climatic uncertainty.
This study confirms a clear upward trend in temperature and total precipitation across southern Angola from 1950 to 2024. As previously stated, the R95pTOT index, representing the percentage of precipitation from extreme events, also increased over the study period. This precipitation concentration raises concerns about drought. Despite the increase in total precipitation, prolonged dry spells have become more frequent, particularly in Huíla, as observed in recent years. These alternating periods of heavy precipitation and extended drought reflect increasing climate variability, which poses significant risks to agricultural systems.
Regression analysis shows that crop yields, namely of maize, cassava, beans, and potatoes, respond positively to increasing temperature and precipitation. Temperature variations seem to favour the growth of these crops, with very low p-values, indicating that increases in annual temperatures have a direct impact on the productivity of these crops. For example, maize and cassava benefit from moderate temperatures, while beans and potatoes perform better with increasing temperatures, within certain limits. Nevertheless, millet and sorghum showed weaker responses to mean temperature, with higher p-values and lower R2 values, suggesting that these crops might be less sensitive to changes in mean temperature, or that other factors like soil quality or agricultural practices play a more significant role. Given the increasing temperatures and the likelihood of more frequent and prolonged dry periods due to climate change, it is essential to explore the use of drought-resistant and heat-tolerant crop varieties. These varieties can help ensure agricultural productivity even under extreme climate conditions. However, for crops such as millet and sorghum, which showed weaker temperature dependence, the development of more resilient varieties is crucial to address the challenges created by changing climatic conditions. Thus, the integration of drought-resistant and heat-tolerant seeds should be a central aspect of agricultural policy in the region, aiming to sustain crop production under increasingly adverse climate conditions.
Regarding total precipitation, maize, cassava, beans, and potatoes also showed a significant positive relationship with production, indicating that these crops rely on water for healthy growth and are more productive with increasing annual precipitation. On the other hand, millet and sorghum again exhibited weaker responses to precipitation, especially sorghum, which showed a very low correlation (R2 of 0.1%) with precipitation, suggesting that this crop might be more resistant to rainfall variations or that other factors, such as drought resistance and farmer’s choice for these more resilient crops under severe drought conditions, are more important for its production. Nonetheless, the irregular distribution of precipitation, coupled with more frequent dry periods, may offset potential benefits. Excessive rainfall events can lead to soil erosion and water-logging, while intervening droughts can stress crops during critical growth stages. Therefore, the increasing R95pTOT index combined with evidence of persistent droughts reinforce the vulnerability of precipitation agriculture in the region. This reflects the importance of water distribution during the growth cycle, particularly in the germination and development phases. Agricultural production in the region is especially sensitive to the timing and duration of the rainy season, as well as the amount of precipitation associated with it. The high uncertainty in precipitation patterns, including significant interannual variability, as well as uncertainties regarding the onset and end of the rainy season, complicates the ability of farmers to plan effectively. This uncertainty is critical, as it directly impacts the success of crops, which are highly dependent on consistent rainfall during key stages of growth (e.g., germination and development) [71]. The high interannual variability in precipitation has been well documented, with large fluctuations in rainfall amounts from year to year [71,72]. Additionally, the uncertainty regarding the onset and end of the rainy season, as well as the unpredictability of precipitation amounts, constitute significant challenges to agricultural planning [48].
In conclusion, the study emphasises the need for adaptive strategies that consider the specific climate sensitivities of each crop. Strengthening seed systems for drought- and heat-tolerant varieties, improving water management, and enhancing early warning systems will be essential to building resilience in the agricultural sector of southern Angola.
While this study primarily focused on the statistical relationships between climate variables and crop yields, it is essential to acknowledge the potential influence of human activities, particularly irrigation practices, land-use changes, and soil management, on these relationships. In certain regions, localised irrigation can partially buffer the impacts of rainfall variability, meaning that crop responses to precipitation anomalies may be attenuated or altered. Conversely, areas without irrigation infrastructure remain highly exposed to rainfall extremes, amplifying the climatic signal on productivity.
Unfortunately, comprehensive and spatially explicit data on irrigation coverage, efficiency, or drainage systems in southern Angola are currently lacking. This limits the possibility of consistently quantifying human influence. However, the limited mechanisation and predominance of rainfed agriculture in the region suggest that, on average, climate variables, particularly precipitation and temperature, remain the dominant drivers of yield variability.
Future studies could benefit from incorporating land management data (e.g., irrigation intensity, cropping systems, fertilization) to refine the attribution of observed yield changes.

5. Conclusions

This study presents the first integrated assessment of climate variability and agricultural response in southern Angola, combining seven decades of reanalysis data (1950–2024) with recent crop yield records (2000–2023). The findings reveal a significant increase in annual mean temperature and notable shifts in climate extremes—particularly in the number of consecutive dry days (CDD) and extreme precipitation events (R95p)—indicating growing thermal stress and increasing rainfall irregularity across the region. These patterns are consistent with findings from other tropical and semi-arid regions, where climate change manifests through gradual warming, intensified precipitation extremes, and disruptions in seasonal rainfall patterns [36,46].
Contingency analysis revealed apparent differences in crop performance under distinct climatic regimes. Maize favoured warmer conditions (46%), and millet showed a preference for warmer conditions (31%). In contrast, cassava and beans performed more favorably during cooler periods, with slightly higher yield frequencies in years with below-average temperatures. Regarding moisture sensitivity, sorghum and millet again stood out, achieving 31% of their above-average yields during dry years (PRCPTOT < mean), confirming their resilience in arid conditions. Potatoes, on the other hand, performed poorly during wet years, with only 17% of those years yielding above-average results, suggesting vulnerability to excess moisture.
These results underscore the importance of crop-specific adaptation strategies. Heat- and drought-resilient crops, such as sorghum and millet, are better aligned with emerging climatic conditions, while crops more sensitive to temperature and precipitation extremes may require targeted agronomic interventions to sustain productivity.
In this context, the use of contingency analysis proved especially valuable, offering deeper insights than traditional regression approaches by capturing nonlinear and frequency-based relationships. This approach is advantageous in regions with irregular climate patterns and limited or inconsistent observational records.
Due to substantial gaps and inconsistencies in local precipitation observations, all primary analyses were conducted using ERA5-Land reanalysis data, which provided superior spatial and temporal coverage—especially for temperature variables—and helped ensure the robustness of climate–crop interactions identified in the study.
Finally, the observed increases in extreme precipitation indices, such as R95p, raise concerns about the rising risk of short-term flood events, even in semi-arid environments, which could potentially disrupt already fragile agricultural systems.
Taken together, these findings emphasise the urgent need for climate-adaptive strategies tailored to vulnerable crops and farming systems. Strengthening seed systems for drought- and heat-tolerant varieties, improving water resource management, and enhancing early warning systems will be crucial to ensuring agricultural resilience and food security in southern Angola in the face of ongoing and future climate change.

Supplementary Materials

The following supporting information can be downloaded at https://www.mdpi.com/article/10.3390/cli13090173/s1: Observational temperature data from local meteorological stations in the provinces of Huíla, Namibe, and Cunene.

Author Contributions

C.D.N.C., critical review of intellectual content, methodology development, data analysis, and manuscript writing; J.A.S., critical review of scholarly content, project supervision, and obtaining funding; M.A., A.F. and C.A.P., crucial review of scholarly content. All authors have read and agreed to the published version of the manuscript.

Funding

This research was funded by the National Funds by FCT—Portuguese Foundation for Science and Technology, under the projects UID/04033 and LA/P/0126/2020 (https://doi.org/10.54499/UIDB/04033/2020) (accessed on 3 April 2025).

Data Availability Statement

The original contributions presented in this study are included in the article, and the observational data of tmax, tmin, and tmean, their interpretation, and graphs are included in the Supplementary Materials. Additional questions can be directed to the corresponding author(s).

Acknowledgments

The authors acknowledge the use of climate datasets obtained from the Copernicus Climate Data Store (2024), the CDO software version 2.0.5, and QGIS version 3.36.1.

Conflicts of Interest

The authors declare no conflicts of interest.

Abbreviations

The following abbreviations are used in this manuscript:
CDDconsecutive dry days
CDOclimate data operators
CWDconsecutive wet days
ECMWFEuropean Centre for Medium-Range Weather Forecasts
ERA5-Landfifth-generation ECMWF atmospheric reanalysis
ERA5-Landhigh-resolution land component of ERA5-Land
ETCCDIExpert Team on Climate Change Detection and Indices
FCTFoundation for Science and Technology
MKMann–Kendall
PRCPTOTtotal annual precipitation on days with ≥ 1 mm
QGISQuantum Geographic Information System
R95pvery wet days (total precipitation from days exceeding the 95th percentile threshold)
R95ptotthe fraction of total precipitation from very wet day
SASSCALSouthern African Science Service Centre for Climate Change and Adaptive Land Management
Tmaxdaily maximum temperature
Tmeandaily mean temperature
Tmindaily minimum temperature

References

  1. IPCC. Climate Change 2023 Synthesis Report; IPCC: Geneva, Switzerland, 2023; Volume 13, pp. 35–115. [Google Scholar]
  2. Nhemachena, C.C.R.; Nhamo, L.; Matchaya, G.; Nhemachena, C.C.R.; Muchara, B.; Karuaihe, S.T.; Mpandeli, S. Climate change impacts on water and agriculture sectors in southern africa: Threats and opportunities for sustainable development. Water 2020, 12, 2673. [Google Scholar] [CrossRef]
  3. Nooni, I.K.; Hagan, D.F.T.; Ullah, W.; Lu, J.; Li, S.; Prempeh, N.A.; Gnitou, G.T.; Sian, K.T.C.L.K. Projections of Drought Characteristics Based on the CNRM-CM6 Model over Africa. Agriculture 2022, 12, 495. [Google Scholar] [CrossRef]
  4. Girdler-Brown, B. Eastern and southern Africa. Int. Migr. 1998, 36, 513–551. [Google Scholar] [CrossRef]
  5. Brown, M.E.; de Beurs, K.; Vrieling, A. The response of African land surface phenology to large scale climate oscillations. Remote Sens. Environ. 2010, 114, 2286–2296. [Google Scholar] [CrossRef]
  6. Tadross, M.; Suarez, P.; Lotsch, A.; Hachigonta, S.; Mdoka, M.; Unganai, L.; Lucio, F.; Kamdonyo, D.; Muchinda, M. Growing-season rainfall and scenarios of future change in southeast Africa: Implications for cultivating maize. Clim. Res. 2009, 40, 147–161. [Google Scholar] [CrossRef]
  7. Pinto, I.; de Perez, E.C.; Jaime, C.; Wolski, P.; van Aardenne, L.; Jjemba, E.; Suidman, J.; Serrat-Capdevila, A.; Tall, A. Climate change projections from a multi-model ensemble of CORDEX and CMIPs over Angola. Environ. Res. Clim. 2023, 2, 035007. [Google Scholar] [CrossRef]
  8. Thomas, N.; Nigam, S. Twentieth-century climate change over Africa: Seasonal hydroclimate trends and sahara desert expansion. J. Clim. 2018, 31, 3349–3370. [Google Scholar] [CrossRef]
  9. Group, T.W.B. Angola Country Climate and Development Report. 2022. Available online: http://hdl.handle.net/10400.26/42558 (accessed on 27 May 2025).
  10. Mateus, N.P.A.; Marengo, J.A.; Cunha, A.P.M.A.; Diogo, A.M.; António, J.F. Spatial–temporal characterization of droughts in Angola. Int. J. Climatol. 2024, 44, 370–392. [Google Scholar] [CrossRef]
  11. Chivangulula, F.M.; Amraoui, M. The Drought Regime in Southern Africa: Long-Term Space-Time Distribution of Main Drought Descriptors. Climate 2024, 12, 221. [Google Scholar] [CrossRef]
  12. Correia, C.D.N.; Amraoui, M.; Santos, A. Analysis of the Impacts of Climate Change on Agriculture in Angola: Systematic Literature Review. Agronomy 2024, 14, 783. [Google Scholar] [CrossRef]
  13. The Southern Africa Drought Resilience Initiative, S.A.D.R.I.A. Drought Resilience Profiles | Angola Drought: Historical and Future. South Africa. 2021, pp. 1–9. Available online: https://www.ciwaprogram.org/wp-content/uploads/SADRI_Drought_Resilience_Profile_Angola.pdf (accessed on 27 May 2025).
  14. CIMA Research Foundation; UNDRR. Disaster Risk Profile of Angola. Nairobi: UNDRR and CIMA Research Foundation. 2019, pp. 1–52. Available online: https://www.undrr.org/media/86920/download (accessed on 27 May 2025).
  15. Lourenco, M.; Woodborne, S.; Fitchett, J.M. Drought history and vegetation response in the Angolan Highlands. Theor. Appl. Climatol. 2023, 151, 115–131. [Google Scholar] [CrossRef]
  16. Correia, C.D.N.; Amraoui, M.; Santos, J.A. Assessment of Climate Change in Angola and Potential Impacts on Agriculture. Climate 2025, 13, 12. [Google Scholar] [CrossRef]
  17. MINAGRIP Relatório de Resultados da Campanha Agrícola 2019/2020. 2020. Available online: https://rvaaatlas.sadc.int/media/352be47c-048c-40cc-8567-74d40ec147aa/5b3a7c6a-7572-4f3a-be0d-406bd7356e27/RCA%202019-2020-FINAL.pdf (accessed on 27 May 2025).
  18. Brian, H.; Vladimir, R.; Fernanda, L.; Nuno, A. Biodiversidade de Angola. 2021. Available online: https://www.unescolifeonland.com/fotos/editor2/BiodiversidadeAngola_.pdf (accessed on 27 May 2025).
  19. Gadedjisso-Tossou, A.; Adjegan, K.I.; Kablan, A.K.M. Rainfall and Temperature Trend Analysis by Mann—Kendall Test and Significance for Rainfed Cereal Yields in Northern Togo. Science 2021, 3, 17. [Google Scholar] [CrossRef]
  20. Alahacoon, N.; Edirisinghe, M.; Simwanda, M.; Perera, E.N.C.; Nyirenda, V.R.; Ranagalage, M. Rainfall variability and trends over the african continent using tamsat data (1983–2020): Towards climate change resilience and adaptation. Remote Sens. 2022, 14, 96. [Google Scholar] [CrossRef]
  21. Meshram, S.G.; Kahya, E.; Meshram, C.; Ghorbani, M.A.; Ambade, B.; Mirabbasi, R. Long-term temperature trend analysis associated with agriculture crops. Theor. Appl. Climatol. 2020, 140, 1139–1159. [Google Scholar] [CrossRef]
  22. Caloiero, T.; Guagliardi, I. Climate change assessment: Seasonal and annual temperature analysis trends in the Sardinia region (Italy). Arab. J. Geosci. 2021, 14, 1–10. [Google Scholar] [CrossRef]
  23. Sakalis, V.D. Trend analysis of the annual and seasonal temperature series in the Eastern Coast of Peloponnese (Greece). Arab. J. Geosci. 2023, 16, 1–17. [Google Scholar] [CrossRef]
  24. Li, C.; Camac, J.; Robinson, A.; Kompas, T. Predicting changes in agricultural yields under climate change scenarios and their implications for global food security. Sci. Rep. 2025, 15, 2858. [Google Scholar] [CrossRef]
  25. Schmidt, M.; Felsche, E. The effect of climate change on crop yield anomaly in Europe. Clim. Resil. Sustain. 2024, 3, 1–13. [Google Scholar] [CrossRef]
  26. Fisher, A.; Hanemann, M.; Roberts, M.; Schlenker, W. Estimating the Effect of Climate Change on Crop Yields and Farmland Values: The Importance of Extreme Temperatures. NCEE Presentation, U.S. Environmental Protection Agency; 12 February 2008. Available online: https://19january2021snapshot.epa.gov/sites/static/files/2014-11/documents/estimating-the_effect_of_climate_change_on_crop_yields_and_farmland_values.pdf (accessed on 27 May 2025).
  27. Zhu, X.; Troy, T.J. Agriculturally Relevant Climate Extremes and Their Trends in the World’s Major Growing Regions. Earth’s Futur. 2018, 6, 656–672. [Google Scholar] [CrossRef]
  28. Biastoch, A.; Rühs, S.; Ivanciu, I.; Schwarzkopf, F.U.; Veitch, J.; Reason, C.; Zorita, E.; Tim, N.; Hünicke, B.; Vafeidis, A.T.; et al. The Agulhas Current System as an Important Driver for Oceanic and Terrestrial Climate. In Sustainability of Southern African Ecosystems under Global Change; Springer: Cham, Switzerland, 2024; pp. 191–220. [Google Scholar] [CrossRef]
  29. Utilizada, M. Relatório de Consultoria sobre: Assistência Técnica para a Realização do Estudo de Diagnóstico “Sementes para a Agricultura Familiar Incluindo as Práticas Tradicionais de Produção, Conservação e Armazenamento” no Âmbito do Projeto FRESAN—Fortalecimento da Resiliência e da Segurança Alimentar e Nutricional em Angola (FED/2017/389-710) . 2017, pp. 1–11. Available online: https://fresan-angola.org/wp-content/uploads/2022/08/AP2-A.-1.2.2-a-Relatório-Final_SEMENTES-PARA-A-AGRICULTURA-FAMILIAR-INCLUINDO-AS-PRÁTICAS.pdf (accessed on 27 May 2025).
  30. Karra, K.; Kontgis, C.; Statman-Weil, Z.; Mazzariello, J.C.; Mathis, M.; Brumby, S.P. Global land use/land cover with Sentinel-2 and deep learning. In Proceedings of the IGARSS 2021—2021 IEEE International Geoscience and Remote Sensing Symposium, Brussels, Belgium, 11–16 July 2021. [Google Scholar]
  31. Muñoz Sabater, J. ERA5-Land Hourly Data from 1950 to Present. Copernicus ECMWF: Reading, UK, 2019. [Google Scholar] [CrossRef]
  32. Silva; de Lima, E.H.Z. Agroclimático e Potencial de Rendimento da Soja na Região do SEALBA; RIUFAL: Simões, Brazil, 2022; Volume 9, pp. 356–363. Available online: https://www.repositorio.ufal.br/jspui/handle/123456789/12258 (accessed on 27 May 2025).
  33. Muñoz-Sabater, J.; Dutra, E.; Agustí-Panareda, A.; Albergel, C.; Arduini, G.; Balsamo, G.; Boussetta, S.; Choulga, M.; Harrigan, S.; Hersbach, H.; et al. ERA5-Land: A state-of-the-art global reanalysis dataset for land applications. Earth Syst. Sci. Data 2021, 13, 4349–4383. [Google Scholar] [CrossRef]
  34. Kaspar, F.; Helmschrot, J.; Mhanda, A.; Butale, M.; de Clercq, W.; Kanyanga, J.K.; Neto, F.O.S.; Kruger, S.; Matsheka, M.C.; Muche, G.; et al. The SASSCAL contribution to climate observation, climate data management and data rescue in Southern Africa. Adv. Sci. Res. 2015, 12, 171–177. [Google Scholar] [CrossRef]
  35. Carvalho, S.C.P.; Santos, F.D.; Pulquério, M. Climate change scenarios for Angola: An analysis of precipitation and temperature projections using four RCMs. Int. J. Climatol. 2017, 37, 3398–3412. [Google Scholar] [CrossRef]
  36. Intergovernmental Panel on Climate Change (IPCC). Climate Change 2021—The Physical Science Basis; Cambridge University Press: Cambridge, UK, 2023. [Google Scholar] [CrossRef]
  37. FAOSTAT Statistical Database. Food and Agriculture Organization of the United Nations. 2024. Available online: https://www.fao.org/faostat (accessed on 30 June 2025).
  38. Mayo, R.; Division, S. FAOSTAT2 Project: Revising the Conceptual Statistical Frameworks, Underlying Statistical Methodologies, Database System and Processes. 2024. Available online: http://www.fao.org/faostat/countrystat_en.asp (accessed on 30 June 2025).
  39. Yuemei, H.; Xiaoqin, Z.; Jianguo, S.; Jina, N. Conduction between left superior pulmonary vein and left atria and atria fibrillation under cervical vagal trunk stimulation. Colomb. Med. 2008, 39, 227–234. [Google Scholar] [CrossRef]
  40. Tarek, M.; Brissette, F.P.; Arsenault, R. Evaluation of the ERA5 reanalysis as a potential reference dataset for hydrological modelling over North America. Hydrol. Earth Syst. Sci. 2020, 24, 2527–2544. [Google Scholar] [CrossRef]
  41. Montgomery, C.D.; Peck, A.E.; Vining, G.G. Introducing To Linear Regression Analysis, 5th ed.; John Wiley and Sons: Hoboken, NJ, USA, 2012; p. 642. [Google Scholar]
  42. Wang, W.; Chen, X.; Shi, P.; van Gelder, P.H.A.J.M.; Corzo, G. Extreme precipitation and extreme streamflow in the Dongjiang River Basin in southern China To cite this version: HAL Id: Hal-00298863 Extreme precipitation and extreme streamflow in the Dongjiang River Basin in southern China. Hydrol. Earth Syst. Sci. Discuss. 2008, 4, 2323–2360. [Google Scholar]
  43. Ali, R.; Kuriqi, A.; Abubaker, S.; Kisi, O. Long-term trends and seasonality detection of the observed flow in Yangtze River using Mann-Kendall and Sen’s innovative trend method. Water 2019, 11, 1855. [Google Scholar] [CrossRef]
  44. Gadgil, A.; Dhorde, A. Temperature trends in twentieth century at Pune, India. Atmos. Environ. 2005, 39, 6550–6556. [Google Scholar] [CrossRef]
  45. Frimpong, B.F.; Koranteng, A.; Molkenthin, F. Analysis of temperature variability utilising Mann–Kendall and Sen’s slope estimator tests in the Accra and Kumasi Metropolises in Ghana. Environ. Syst. Res. 2022, 11, 1–13. [Google Scholar] [CrossRef]
  46. Akhundzadah, N.A. Analyzing Temperature, Precipitation, and River Discharge Trends in Afghanistan’s Main River Basins Using Innovative Trend Analysis, Mann–Kendall, and Sen’s Slope Methods. Climate 2024, 12, 196. [Google Scholar] [CrossRef]
  47. Hansen, J.; Ruedy, R.; Sato, M.; Lo, K. Global surface temperature change. Rev. Geophys. 2010, 48, 1–29. [Google Scholar] [CrossRef]
  48. Manton, M.J.; Della-Marta, P.M.; Haylock, M.R.; Hennessy, K.J.; Nicholls, N.; Chambers, L.E.; Collins, D.; Daw, G.; Finet, A.; Gunawan, D.; et al. Trends in extreme daily rainfall and temperature in southeast Asia and the south Pacific: 1961–1998. Int. J. Climatol. 2001, 21, 269–284. [Google Scholar] [CrossRef]
  49. Hersbach, H.; Bell, B.; Berrisford, P.; Hirahara, S.; Horányi, A.; Muñoz-Sabater, J.; Nicolas, J.; Peubey, C.; Radu, R.; Schepers, D.; et al. The ERA5 global reanalysis. Q. J. R. Meteorol. Soc. 2020, 146, 1999–2049. [Google Scholar] [CrossRef]
  50. Bojinski, S.; Verstraete, M.; Peterson, T.C.; Richter, C.; Simmons, A.; Zemp, M. The concept of essential climate variables in support of climate research, applications, and policy. Bull. Am. Meteorol. Soc. 2014, 95, 1431–1443. [Google Scholar] [CrossRef]
  51. Pereira, C.A.; Martins, J.P.; Fink, A.H.; Pinto, J.G.; Ramos, A.M. Drivers of seasonal rainfall variability over the Angolan and Namibian plateaus. Int J Climatol. 2024, 44, 3706–3725. [Google Scholar] [CrossRef]
  52. Wood, R. Stratocumulus clouds. Mon. Weather. Rev. 2012, 140, 2373–2423. [Google Scholar] [CrossRef]
  53. Vizy, E.K.; Cook, K.H.; Sun, X. Decadal change of the south Atlantic ocean Angola–Benguela frontal zone since 1980. Clim. Dyn. 2018, 51, 3251–3273. [Google Scholar] [CrossRef]
  54. Majumder, S.; Schmid, C. A study of the variability in the Benguela Current volume transport. Ocean. Sci. 2018, 14, 273–283. [Google Scholar] [CrossRef]
  55. NAPA Tuvalu. Angola’s National Adaptation Programme of Action: Under the auspices of the United Nations Framework Convention on Climate Change. Dep. Environ. 2007, 55, 19. Available online: https://unfccc.int/resource/docs/napa/ago01.pdf (accessed on 30 June 2025).
  56. Moreno, A.; Hasenauer, H. Spatial downscaling of European climate data. Int. J. Climatol. 2016, 36, 1444–1458. [Google Scholar] [CrossRef]
  57. Dawson, B.; Spannagle, M. Intergovernmental Panel on Climate Change (IPCC). In The Complete Guide to Climate Change, 1st ed.; Routledge: Oxfordshire, UK, 2020. [Google Scholar] [CrossRef]
  58. Zhang, X.; Alexander, L.; Hegerl, G.C.; Jones, P.; Tank, A.K.; Peterson, T.C.; Trewin, B.; Zwiers, F.W. Indices for monitoring changes in extremes based on daily temperature and precipitation data. Wiley Interdiscip. Rev. Clim. Change 2011, 2, 851–870. [Google Scholar] [CrossRef]
  59. Coelho, E.d.S.R. Eventos Climáticos de Seca Prolongada em Angola. Avaliação de Necessidades Específicas de Operações de Emergência e Socorro. 2020. Available online: https://comum.rcaap.pt/entities/publication/1b3d78fa-8bda-4b70-a8f6-445af09f5bdb/full (accessed on 27 May 2025).
  60. Chivangulula, F.M.; Amraoui, M.; Pereira, M.G. The Drought Regime in Southern Africa: A Systematic Review. Climate 2023, 11, 147. [Google Scholar] [CrossRef]
  61. Nhamo, L.; Mabhaudhi, T.; Modi, A.T. Preparedness or repeated short-term relief aid? Building drought resilience through early warning in southern africa. Water SA 2019, 45, 75–85. [Google Scholar] [CrossRef]
  62. Dosio, A.; Jones, R.G.; Jack, C.; Lennard, C.; Nikulin, G.; Hewitson, B. What can we know about future precipitation in Africa? Robustness, significance and added value of projections from a large ensemble of regional climate models. Clim. Dyn. 2019, 53, 5833–5858. [Google Scholar] [CrossRef]
  63. Dosio, A.; Jury, M.W.; Almazroui, M.; Ashfaq, M.; Diallo, I.; Engelbrecht, F.A.; Klutse, N.A.B.; Lennard, C.; Pinto, I.; Sylla, M.B.; et al. Projected future daily characteristics of African precipitation based on global (CMIP5, CMIP6) and regional (CORDEX, CORDEX-CORE) climate models. Clim. Dyn. 2021, 57, 3135–3158. [Google Scholar] [CrossRef]
  64. Lal, R. Soil degradation by erosion. L Degrad. Dev. 2001, 12, 519–539. [Google Scholar] [CrossRef]
  65. Sitienei, B.J.; Juma, S.G.; Opere, E. On the use of regression models to predict tea crop yield responses to climate change: A case of Nandi East, Sub-County of Nandi County, Kenya. Climate 2017, 5, 54. [Google Scholar] [CrossRef]
  66. Lobell, D.B.; Schlenker, W.; Costa-Roberts, J. Climate trends and global crop production since 1980. Science 2011, 333, 616–620. [Google Scholar] [CrossRef]
  67. Schlenker, W.; Lobell, D.B. Robust negative impacts of climate change on African agriculture. Environ. Res. Lett. 2010, 5, 014010. [Google Scholar] [CrossRef]
  68. Parmesan, T.; Morecroft, C. Impacts, Adaptation, and Vulnerability; Working Group II Contribution to the IPCC Sixth Assessment Report of the Intergovernmental Panel on Climate, Change; Roberts, D.C.O., Tignor, M., Poloczanska, E.S., Mintenbeck, K., Ale, A., Eds.; Cambridge University Press: Cambridge, UK, 2023. [Google Scholar] [CrossRef]
  69. Aryal, J.P.; Sapkota, T.B.; Rahut, D.B.; Marenya, P.; Stirling, C.M. Climate risks and adaptation strategies of farmers in East Africa and South Asia. Sci. Rep. 2021, 11, 1–14. [Google Scholar] [CrossRef]
  70. Lourenco, M.; Woodborne, S. Defining the Angolan Highlands Water Tower, a 40 plus-year precipitation budget of the headwater catchments of the Okavango Delta. Environ. Monit. Assess 2023, 195, 1–16. [Google Scholar] [CrossRef]
  71. Giorgi, F.; Lionello, P. Climate change projections for the Mediterranean region. Glob. Planet. Change 2008, 63, 90–104. [Google Scholar] [CrossRef]
  72. Faye, D.; Kaly, F.; Dieng, A.L.; Wane, D.; Fall, C.M.N.; Mignot, J.; Gaye, A.T. Regionalization of the Onset and Offset of the Rainy Season in Senegal Using Kohonen Self-Organizing Maps. Atmosphere 2024, 15, 378. [Google Scholar] [CrossRef]
Figure 2. Flowchart methodology of the study.
Climate 13 00173 g002
Figure 3. Spatial correlation of annual mean temperature (Tmean) across meteorological stations in southern Angola. (a) shows a heatmap of Pearson correlation coefficients for annual Tmean between five meteorological stations, based on observed data. (b) presents the corresponding correlations derived from ERA5-Land reanalysis data. The colour gradient represents the strength and direction of the correlations. All analyses are based on overlapping years between stations (2011–2023 for observations; 1950–2024 for ERA5-Land).
Climate 13 00173 g003
Figure 4. Temporal evolution of (a) maximum (Tmax), (b) minimum (Tmin), and (c) mean (Tmean) temperatures in Cunene, Huíla, and Namibe from 1950 to 2024. Linear regression lines and 5-year moving averages are also shown (cf. legend for details).
Climate 13 00173 g004
Figure 5. Temporal trends in Cunene, Huíla, and Namibe (1950–2024), of (a) CWD; (b) CDD; (c) total annual precipitation; (d) R95p; and (e) R95pTOT. Linear regression lines and 5-year moving averages are also shown (cf. legend for details).
Climate 13 00173 g005
Figure 6. Frequency distribution of crop yield responses under different regimes of (a) mean temperature and (b) annual precipitation (2000–2023).
Climate 13 00173 g006
Table 1. Trend metrics for the maximum temperature (Tmax): Linear regression trend, R-squared and corresponding p-value, Sen’s slope and corresponding p-value, and trend statistical significance. Statistically significant trends are highlighted in bold font.
ProvinceLinear TrendR2 (%)p-Value (Linear)Sen’s Slopep-Value Trend
Significance
Cunene0.0020.1660.7290.0050.470No trend
Huíla0.01312.6260.0020.0170.000Increasing
Namibe0.0085.8490.0370.0080.026Increasing
Table 2. As Table 1, but for minimum temperature (Tmin).
ProvinceLinear TrendR2 (%)p-Value (Linear)Sen’s Slopep-Value Trend
Significance
Cunene0.03017.6260.0000.0280.001Increasing
Huíla0.02726.1270.0000.0250.000Increasing
Namibe0.03225.8060.0000.0320.000Increasing
Table 3. As Table 1, but for mean temperature.
ProvinceLinear TrendR2 (%)p-Value (Linear)Sen’s Slopep-Value Trend
Significance
Cunene0.0094.5740.0650.0120.022Increasing
Huíla0.01427.7680.0000.0160.000Increasing
Namibe0.01116.3600.0000.0120.000Increasing
Table 4. List of the precipitation indices selected in the present study and recommended by the ETCCDI [58].
Index NameAbbreviationDescription
Consecutive Dry DaysCDDMaximum number of consecutive days with precipitation < 1 mm
Consecutive Wet DaysCWDMaximum number of consecutive days with precipitation ≥ 1 mm
Total Annual PrecipitationPRCPTOTTotal annual precipitation on days with≥ 1 mm
Very Wet DaysR95pVery wet days concerning the 95th percentile of reference period
Very Wet Days (%) R95pTOTThe fraction of total precipitation from very wet days
Table 5. As in Table 1, but for CWD.
ProvinceLinear TrendR2 (%)p-Value (Linear)Sen’s Slopep-Value Trend
Significance
Cunene0.0382.8650.1470.0370.177No trend
Huíla0.0030.0160.9150.0000.920No trend
Namibe0.0252.3020.1940.0290.087No trend
Table 6. As in Table 1, but for CDD.
ProvinceLinear TrendR2 (%)p-Value (Linear)Sen’s Slopep-Value Trend
Significance
Cunene−0.1171.4560.302−0.0290.784No trend
Huíla−0.0180.0360.871−0.0140.826No trend
Namibe−0.3118.1280.013−0.2650.029Decreasing
Table 7. As in Table 1, but for PRCTOT.
ProvinceLinear TrendR2 (%)p-Value (Linear)Sen’s Slopep-Value Trend
Significance
Cunene3.14013.5040.0012.5980.009Increasing
Huíla2.5666.8030.0242.9300.016Increasing
Namibe1.5316.1770.0321.8860.003Increasing
Table 8. As in Table 1, but for R95p.
ProvinceLinear TrendR2 (%)p-Value (Linear)Sen’s Slopep-ValueTrend
Significance
Cunene0.0382.8650.1470.0370.177No trend
Huíla0.0030.0160.9150.0000.920No trend
Namibe0.0252.3020.1940.0290.087No trend
Table 9. As in Table 1, but for R95pTOT.
ProvinceLinear TrendR2 (%)p-Value (Linear)Sen’s Slopep-ValueTrend
Significance
Cunene0.00328.3590.0−0.0090.0Increasing
Huíla0.00211.8140.003−0.0010.001Increasing
Namibe0.0026.450.0280.0110.031Increasing
Table 10. Proportion (%) of yield above average under different climate conditions.
CropTmean < MeanTmean > MeanPRCPTOT < MeanPRCPTOT > Mean
Maize>4463614
Maize<4281931
Cassava>23273218
Cassava<27232327
Beans>14363218
Beans<40102030
Millet>38121931
Millet<19313119
Potato>21293317
Potato<29212129
Sorghum>25252525
Sorghum<25252921
Disclaimer/Publisher’s Note: The statements, opinions and data contained in all publications are solely those of the individual author(s) and contributor(s) and not of MDPI and/or the editor(s). MDPI and/or the editor(s) disclaim responsibility for any injury to people or property resulting from any ideas, methods, instructions or products referred to in the content.