Abstract
Drought is a complex and impactful natural hazard, with sometimes catastrophic impacts on small or subsistence agriculture and water security. In Pacific Island countries, there lacks an agreed approach for monitoring agricultural drought hazard with satellite-derived remote sensing data. This study addresses this gap through a framework for agricultural drought monitoring in the Pacific using freely available space-based observations. Applying World Meteorological Organization’s (WMO) recommendations and a set of objective selection criteria, three remotely sensed drought indicators were chosen and combined using fuzzy logic to form a composite drought hazard index: the Standardised Precipitation Index, Soil Water Index, and Normalised Difference Vegetation Index. Each indicator represents a subsequential flow-on effect of drought on agriculture. The index classes geographic areas as low, medium, high, or very high levels of drought hazard. To test the drought hazard index, two case studies for drought in the western Pacific, Papua New Guinea (PNG), and Vanuatu, are assessed for the 2015–2016 El Niño-related drought. Findings showed that at the height of the drought in October 2015, 58% of PNG and 72% of Vanuatu showed very high drought hazard, compared to 6% and 40%, respectively, at the beginning of the drought. The hazard levels calculated were consistent with conditions observed and events that were reported during the emergency drought period. Application of this framework to operational drought monitoring will promote adaptive capacity and improve resilience to future droughts for Pacific communities.
1. Introduction
As one of the most pervasive and complex natural hazards, drought is a slow-onset phenomenon characterised by prolonged periods of abnormally low water availability, with profound implications for water security, human health, economic systems, and natural ecosystems worldwide [1]. The World Health Organisation estimates that 55 million people globally have reduced food security caused by drought every year, with crops, pastures and livestock being particularly susceptible to the hazard [2].
Droughts are complex environmental phenomena typically categorised into four key types: meteorological, hydrological, agricultural and socio-economic [3]. Droughts are also classified by their frequency, severity, duration, and extent, which ultimately determine their consequences on the environment and hence people and human systems [4].
A prolonged lower than average precipitation during crop and pasture growing seasons can reduce water availability and suppress crop and pasture development [5,6]. Agricultural drought then occurs due to the reductions in soil water content that results from the rapid percolation of soil water and insufficient storage of local water and irrigation, which inhibits healthy plant growth [7]. The progression of dry conditions over time leads to different types of droughts and their eventuating consequences (for detail, see Figure A1 in Appendix A).
Spread across 800,000 km2 of the Pacific Ocean lie the Pacific Island Countries (PICs), which include ~20,000 islands and atolls supporting over 10 million residents [8]. Agriculture is central to life in PICs, providing food and livelihoods. Most households depend on subsistence farming as the population grows across the region [9]. Around 80% of people living in PICs rely on their agricultural produce to support or supplement their diets [10]. For this reason, disruptions and damages to crop yield can have far-reaching implications for communities and people’s individual health and wellbeing. Building resilience and adaptive capacity to drought is essential for both health and economic development.
Natural climate variability plays a significant role in developing dry conditions in the Pacific. The most important climate driver is the El Niño–Southern Oscillation (ENSO) while other notable drivers are the Indian Ocean Dipole (IOD) and the Madden Julian Oscillations (MJO). These can have a significant impact upon the two critical regions of convergence: the Intertropical Convergence Zone (ITCZ) and South Pacific Convergence Zone (SPCZ). El Niño events are typically associated with significant rainfall deficits in countries southwest of the SPCZ, including Papua New Guinea (PNG) and Vanuatu, which can result in meteorological drought with severe impacts on agricultural systems and water resources [11]. Similar, a 2020 study in Peru, the opposing side of the Pacific, found that of four key oceanic oscillations, ENSO was the main contributor to very dry or very wet conditions [12].
In PICs, anthropogenic climate change is projected to increase the frequency and severity of agricultural and ecological droughts due to higher evapotranspiration driven by rising temperatures and increased atmospheric demand for moisture. Even without major changes in rainfall, these conditions will reduce soil moisture and strain ecosystems, agriculture, and water resources as global warming exceeds 2 °C [13].
Seasonal cycles can further exacerbate drought impacts, particularly in regions with pronounced dry seasons. If the wet season fails to deliver sufficient rainfall and water reserves remain low, this will increase the vulnerability during the subsequent dry season. Their interactions contribute to the complex dynamics that underpin PICs’ heightened vulnerability to drought events.
Droughts are not a new phenomenon to PICs, with palaeoclimatological records suggesting they have occurred for at least 7000 years [14]. Despite this, their occurrence in PICs can be challenging to detect and characterise due to the heterogeneous geographical and socioeconomic contexts across the region. Detecting and monitoring drought in PICs is complex owing to the limitations of in situ hydro-meteorological observations of variables such as precipitation, near-surface air temperature, wind speed, and water vapour [15]. PICs, also categorised as small island developing states, typically are less economically developed, have meteorological services with fewer resources and shorter historical in situ records, limiting their capacity to accurately detect, predict, and respond to drought events in a timely and effective manner [11]. With this context, it is important that further research into monitoring, and ultimately warning for, agricultural drought be conducted in the Pacific region.
Drought monitoring has evolved significantly with the recognition that single drought indices have limited capability to indicate complex drought states, leading to increased development of composite and multivariate approaches. Traditional single indices such as Precipitation Condition Index, Temperature Condition Index, and Evapotranspiration Condition Index provide insufficient drought characterisation, prompting researchers to develop integrated methodologies that combine multiple indicators for more accurate drought assessment [16]. Recent advances demonstrate that composite drought indices can indicate and predict drought states more efficiently and accurately than individual indicators [16].
Satellite-based drought monitoring has shifted the field by providing high-resolution spatial and temporal data, significantly improving capacity to monitor and assess agricultural drought conditions. Remote sensing technology offers coverage that addresses the limitations of ground-based observations which is particularly important for regions with sparse monitoring networks [17]. However, the unpredictable nature of environmental conditions continues to pose challenges in drought assessment, necessitating robust methodological frameworks [17].
Fuzzy logic approaches have emerged as powerful tools for handling uncertainty in drought assessment. The development of Composite Fuzzy Matter Element models demonstrates effectiveness in capturing meteorological drought events with high accuracy, achieving probability of detection rates above 0.78 and critical success index values exceeding 0.70 [18]. These fuzzy-based approaches address the inherent uncertainties in environmental data while providing scientifically robust drought characterisation [18]. Advanced applications incorporate fuzzy identification models coupled with optimisation algorithms to quantify relationships between drought conditions and disaster impacts through scenario simulations [19].
Composite drought indices increasingly utilise sophisticated mathematical approaches including three-dimensional Euclidean space methods and principal component analysis to integrate multiple drought indicators. Studies have shown strong correlations between composite indices and established drought measures, with correlation coefficients ranging from 0.56 to 0.61 when validated against standardised precipitation indices and soil moisture conditions [16]. Geographic Information Systems provide essential platforms for implementing multivariate drought assessments, enabling spatial analysis of hydrogeological drought conditions across different management scenarios [20].
Understanding drought propagation relationships has revealed significant temporal patterns, with meteorological drought propagating to agricultural drought over approximately 5.7 months and to groundwater drought over 14.47 months globally [21]. These propagation timescales vary considerably based on climate conditions and land cover types, with forests showing different propagation characteristics compared to grasslands and croplands [21].
Despite these advances, significant gaps remain in drought monitoring frameworks specifically designed for small island developing states where in situ measurements are particularly limited. Current composite drought approaches have been developed primarily for continental or large regional scales, with limited application to Pacific Island environments where satellite remote sensing offers the most viable monitoring alternative. This study addresses these gaps by developing the first satellite-based agricultural drought framework specifically for PICs, applying fuzzy logic methodology to integrate complementary indicators that capture sequential agricultural drought effects, and demonstrating effectiveness during major climate events.
This study aims to develop the first agricultural drought monitoring framework specifically tailored for PICs by integrating satellite-derived indicators within a fuzzy logic approach. While numerous satellite-based drought studies exist at continental and national scales, and fuzzy-based drought indices have been tested in other regions, there remains no operational or research framework that combines these methods for small island developing states with limited in situ observations. This research therefore contributes novel methodological and regional insights by bridging these two strands of literature.
Objectives.
- To identify and select appropriate satellite-based drought indicators (precipitation, soil water, vegetation) that provide adequate regional coverage, spatial resolution, and temporal frequency over the Pacific.
- To develop a composite drought hazard index that uniquely integrates sequential drought impacts (meteorological → soil moisture → vegetation health) through fuzzy logic, a method not yet applied to Pacific Islands’ agricultural drought.
- To demonstrate the applicability of the framework using historical drought case studies in PNG and Vanuatu, thereby providing new evidence on the performance of composite fuzzy drought indices in island environments.
2. Materials and Methods
This section outlines the ways in which study’s objectives were achieved through an incremental process of knowledge building and exploration of indicators. These increments are understanding the key drought indicators, visualising these in Geographic Information System (GIS), combining them into a composite drought hazard index and applying them to a selected case study area.
2.1. Study Area
To evaluate the performance of the developed framework, a case study using the impact of the 2015–2016 El Nino-related drought on PNG and Vanuatu was used. Three separate months were chosen for the case study period: May 2015, October 2015, and March 2016. These correspond with the Australian Bureau of Meteorology (BoM) declaration that El Niño was underway in May 2015, the middle of the El Niño period in October 2015, and the easing of the El Niño in March 2016.
PNG and Vanuatu were selected as a large and a small case study countries to demonstrate the effectiveness of the developed framework for agricultural drought monitoring. PNG is the largest and most populous country within the Pacific, while Vanuatu is far less populous and has a smaller land area. Figure 1 highlights the location of PNG and Vanuatu in the Pacific region, while Figure 2 and Figure 3 present key geographical features in each country.
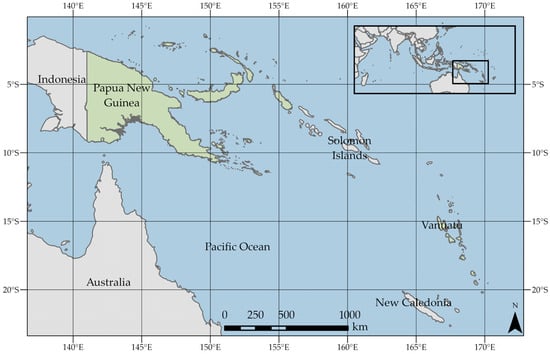
Figure 1.
Papua New Guinea and Vanuatu location in Pacific region, major neighbour countries and extent highlighted. Map projection: WGS 1984 Web Mercator (EPSG:3857).
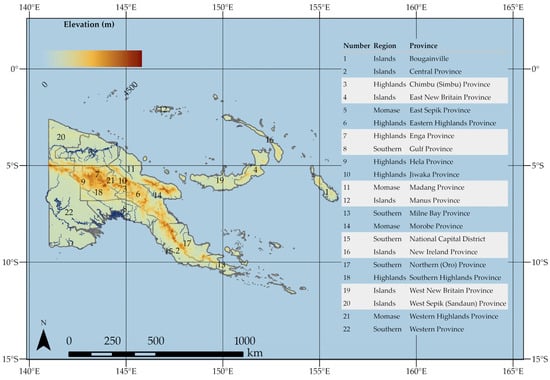
Figure 2.
Provincial-level divisions of Papua New Guinea based on [22] with major waterways and elevation. Map projection: WGS 1984 Web Mercator (EPSG:3857).
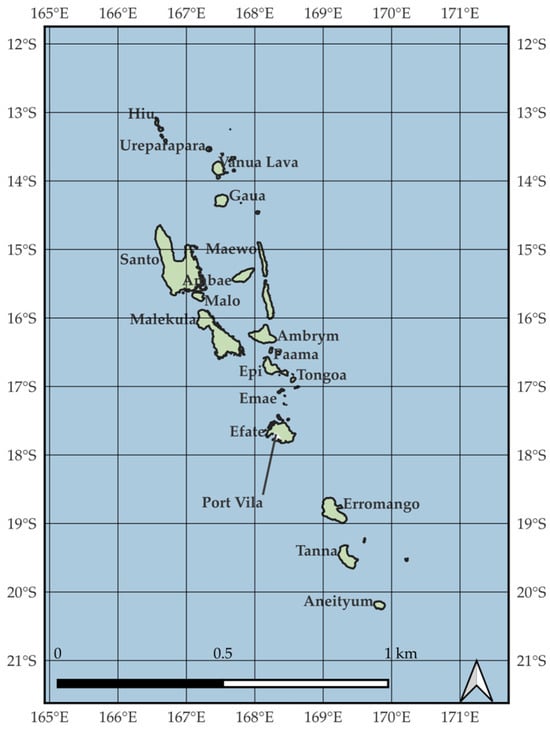
Figure 3.
Map of Vanuatu with major islands labelled and the capital city, Port-Vila. Map projection: WGS 1984 Web Mercator (EPSG:3857).
PNG is characterised by rugged, tectonically active mountainous terrain, extensive lowland rainforests, and complex river systems, resulting in highly varied topography and ecological diversity.
Vanuatu consists of a chain of volcanic islands with steep, rugged terrain, narrow coastal plains, and active geophysical processes that contribute to its dynamic and environmentally diverse landscape.
2.2. Identifying Satellite-Derived Drought Indicators
Selecting the appropriate indicators to achieve the aims of this study required them to meet several key criteria. The initial pool of options was drawn from the forty-seven indicators and indices for drought monitoring recommended by the World Meteorological Organization’s (WMO) Handbook of Drought Indicators and Indices [23]. The handbook grades indicators and indices by ease of use; for this framework, only green (easy to use) indices were selected. With the potential of translating this framework to an operational product, it was also a requirement that they met the FAIR (Findability, Accessibility, Interoperability, and Reusability) guiding principles for digital assets [24]. Several studies have already investigated drought monitoring in the Pacific region, these provided potential options for indicators that were previously applied in the region [25,26,27]. From this list, further exclusion was applied for regional coverage, spatial resolution, and temporal frequency over the Pacific. The full selection criteria and justification is shown in Figure A2. Based on this filtering process, three indicators were selected: the Standardised Precipitation Index (SPI), the Soil Water Index (SWI), and the Normalised Difference Vegetation Index Deviation (NDVIdev).
2.2.1. Standardised Precipitation Index
Drought usually begins with a deficiency of rainfall; SPI is an effective indicator for detecting a meteorological drought. SPI quantifies precipitation anomalies by normalising the difference from the long-term mean using the standard deviation of historical records [28]. SPI is recommended by the WMO for use in characterising meteorological droughts in addition to other drought indices [29]. In this study, precipitation data from the Multi-Source Weighted Ensemble Precipitation Version 2 (MSWEP V2) was utilised to compute the SPI. MSWEP V2 is a gridded precipitation dataset with global coverage and a temporal span from 1979, high spatial and temporal resolution, and a multi-source approach to estimating precipitation through merging diverse data sources [30]. An evaluation of 23 gridded global precipitation datasets found MSWEP V2.8 had the highest performance as compared to observed precipitation, largely due to its merged sources [31]. The calculated SPI dataset used in this study was provided by the BoM.
2.2.2. Soil Water Index
Given that agricultural drought is defined by soil moisture’s deficiency, understanding the relative volume of water in the ground is essential for agricultural drought monitoring [25,32]. Data from SWI V3 2007–present (raster 12.5 km), global, dekadal from the Copernicus Land Monitoring Service (CLMS) was used in this study. The SWI data are obtained from microwave scatterometers on ASCAT and Sentinel 1, and they allow estimating moisture conditions at varying soil depths. The SWI is a representation of the relationship between the surface soil moisture content and the soil profile moisture content below the surface which serves as a reservoir to the surface, storing water for a longer time. Surface soil moisture is more temporally dynamic due to its constant interaction with the atmosphere, unlike the sub-surface water content, which is regulated by past precipitation events [33].
2.2.3. Normalised Difference Vegetation Index
NDVI was used as a proxy for overall vegetation health due to its quantification of vegetation density and chlorophyll content, which are insightful for identifying drought-related stress to agriculture. The indicator is widely used for vegetation monitoring [34]. The CLMS NDVI V3 1999–2020 (raster 1 km), global, dekadal, and its long-term statistics equivalent were used in this framework. The NDVI 1 km V3 products are of “very high quality” and are used operationally, utilising the PROBA-V satellite and, more recently, Sentinel-3 [35,36,37].
2.2.4. Data Quality Assessment and Preprocessing
All datasets were sourced from operational services (BoM, CLMS) with established quality control and validation procedures prior to distribution. The BoM SPI product undergoes routine validation against ground observations, while CLMS products include comprehensive quality flags and uncertainty estimates. Preprocessing steps were applied to ensure spatial and temporal alignment across all indicators, including reprojection to a common coordinate system, resampling to consistent spatial resolution, and temporal aggregation to matching monthly periods.
All layers were reprojected to WGS 1984 Web Mercator (EPSG:3857) using bilinear interpolation for continuous data and clipped to country shapefiles for PNG and Vanuatu to ensure consistent spatial extent and resolution. This clipping procedure standardized the analysis domain and reduced computational requirements. Dekadal SWI and NDVI products were aggregated to monthly composites using arithmetic mean across the three dekads within each target month.
Quality flags provided with CLMS products were evaluated to identify pixels affected by cloud contamination, atmospheric interference, or sensor retrieval uncertainties. For SWI, areas with consistently poor retrieval quality were identified but retained in the analysis with appropriate flagging. NDVI products were filtered for cloud contamination using accompanying cloud masks.
Areas with missing data or flagged poor quality were excluded from fuzzy overlay calculations rather than interpolated or gap-filled. This conservative approach preserves data integrity while acknowledging that spatial coverage is reduced in affected areas, particularly along coastlines and over complex terrain.
The framework relies entirely on satellite-derived products without local ground-based validation, which limits assessment of absolute accuracy. The 0.1° resolution constraint imposed by SWI and SPI products limits applicability to smaller islands, with many outer islands in Vanuatu not captured in the analysis. ASCAT soil moisture retrievals have known limitations over dense tropical vegetation, potentially underestimating variability in forested areas. NDVI can be affected by persistent cloud cover typical of the Pacific region, potentially reducing temporal consistency. No outlier detection was performed, meaning extreme values may represent either genuine environmental conditions or sensor artifacts. These factors may influence the accuracy of drought hazard assessment in specific locations and vegetation types.
2.3. Integrating Drought Indicators in GIS
ArcGIS Pro 3.5 was used to visualise and analyse satellite remote sensing data, involving several key steps in the processing of spatial information throughout the study. It was selected due to its wide application by the research community and ease of use. Models were developed in ArcGIS to automate the processing steps in this framework. Several functions were applied to indicator products, as described below. A summary of all functions applied to the satellite remote sensing products is provided in Figure A3.
2.3.1. Standardised Precipitation Index
The SPI was pre-generated from MSWEP V2 by the BoM, aggregating precipitation over 3-month periods, comparing these totals to corresponding periods across a 41-year historical record (1981–2021) and standardising the anomalies using the method of moments with a fitted gamma distribution at a 0.1° spatial resolution. Similar methods of SPI calculation have been evaluated in earlier studies for China, India and Iran, with positive results yielded for drought assessment [38,39,40]. SPI values were grouped into five classes adapted from the European Drought Observatory classifications as shown in Table 1 [28,41].

Table 1.
SPI Classes.
Monthly averages of global SPI were loaded into GIS and clipped to the relevant country shapefile obtained from the Humanitarian Data Exchange [42]. The continuous float values were reclassified into discrete integer classes according to the categories outlined in Table 1. Symbology was applied such that low values had red colours (dry conditions), and high values had blue colours (wet conditions).
2.3.2. Soil Water Index
Dekadal SWI products were obtained for day 1, day 11 and day 21 of each target month, from which a monthly mean was calculated. SWI relies on a T-value representing the characteristic time length over which past surface soil moisture observations influence current estimates, with higher T-values reflecting deeper and more stable soil moisture conditions [43]. The selection of optimal the T value differs depending on the soil composition and target depth. Robust selection would require a validation process, comparing SWI with differing T-values to in situ measurements. Instead, a T value of 20 was selected as this was a middle range in the options available (1, 5, 10, 15, 20, 40, 60, 100). A moderate T value, like 20, effectively captures infiltration dynamics without being too sensitive to short-term surface fluctuations [44]. It also incorporates a large portion of most root zones, understanding that agricultural drought generally refers to soil moisture deficits within the root zone, which is usually in the top 100 cm of soil [45].
The SWI was divided into five categories (Table 2) to emphasise the detection of extreme dry and wet conditions, which ASCAT products capture most reliably and which are most relevant for drought monitoring [46,47]. The chosen thresholds balance the need for operational interpretability with ASCAT’s retrieval uncertainty, following common practice in soil moisture and drought indices that communicate conditions as very dry, dry, normal, wet, or very wet [48,49].
Table 2.
SWI classes.
2.3.3. Normalised Difference Vegetation Index Deviation (NDVIdev)
Dekadal NDVI products were obtained for day 1, day 11 and day 21 of each target month, from which a monthly mean was calculated. The same process was applied to the long term mean from the long-term statistics dataset.
NDVI effectively monitors vegetation cover but does not reflect drought severity. To evaluate drought severity, the NDVI deviation (NDVIdev) was used, as recommended in [50,51], to describe the following equation:
where is the NDVI for month m, and is the long-term NDVI mean for the same month m. Negative values indicate below normal vegetation health, implying a “greater magnitude of prevailing drought” [50]. Five classes of NDVI deviation were produced, ranging from above normal to below normal vegetation condition based on the classes created in [51]; these are shown in Table 3.
NDVIdev = NDVIm − NDVImean,m
Table 3.
NDVI deviation classes.
NDVIdev was reclassified, using the thresholds in Table 3 to create five classes, with low integers being below normal vegetation condition and high integers above normal. Focal statistics were applied, using a rectangular neighbourhood with a length and width of 3. This was applied to reduce the noise of NDVI changes across the terrain, which can be influenced by numerous ground-level variables. Symbology was applied such that low values had brown colours (dry/little growth conditions), and high values had jade colours (wet/high growth conditions).
2.3.4. Drought Indicator Mapping
For each selected month (m), individual drought indicator maps were generated for the study areas to enable direct comparison of each indicator’s representation of drought hazard. A summary of each of the three indicators is provided in Table 4, outlining key details about the indicator and differences between each.
Table 4.
Characteristics of agricultural drought indicators used to create the drought index.
2.4. Establishing a Framework for a Composite Drought Hazard Index
2.4.1. Fuzzy Membership
Several alternative approaches for combining drought indicators were considered, including equal weighting averaging, principal component analysis (PCA), and expert weighting systems. Fuzzy logic was selected over these alternatives because it effectively handles the continuous nature of drought transitions without forcing binary classifications, accommodates the inherent uncertainties in satellite-derived environmental data, and has demonstrated success in similar multi-indicator drought assessments [52,53]. Fuzzy logic was selected as appropriate for generating a composite agricultural drought hazard index using the three drought indicators: SPI, SWI, and NDVIdev. Unlike traditional binary classification methods, fuzzy logic allows for the representation of gradual transitions between classes, capturing the nuanced variations in drought conditions. It effectively addresses the inherent uncertainties and imprecise boundaries associated with environmental data. Fuzzy linear was chosen because it provides a transparent, proportional relationship between indicator values and drought severity, avoids arbitrary threshold assumptions required by non-linear functions, and is best suited to the continuous nature of the satellite-derived drought indicators in a data-sparse Pacific context. Pre-processing steps were required to transform each indicator into a fuzzy member. With fuzzy logic, μ = 0 represents a zero likelihood of drought occurrence, and μ = 1 represents a certainty of drought occurrence based on the input layers. The minimum and maximum boundaries set are outlined in Table 5.
Table 5.
Fuzzy Membership Linear Boundaries.
SWI did not require resampling, as it had the coarsest resolution of all layers (0.1°). A linear fuzzy membership function was applied, with the maximum being set to 0% (μ = 1, certainty of drought) and the minimum set to 100% (μ = 0, certainty of no drought).
SPI was resampled before fuzzy membership to ensure it maintained the common resolution. Unlike in for individual indicator maps, a bilinear interpolation function was used. Bilinear interpolation is a more appropriate function for continuous data; it calculates each pixel value based on the value of the nearest four pixels. The linear fuzzy membership function was then applied, setting the maximum to −2 (μ = 1, certainty of drought) and minimum to 2 (μ = 0, certainty of no drought). These minimum and maximum values were selected based on Table 2, where an SPI of −2 or lower is classified as extreme drought, and the inverse is true. Values outside of these values are converted to μ = 1 or μ = 0.
Both SPI and NDVIdev were resampled using bilinear interpolation to a common cell resolution. SWI was used as the reference grid for resampling, as it had the coarsest spatial resolution in practice (≈12.5 km cell size, compared to ≈11 km for SPI) and provided a consistent base to which higher-resolution layers could be downscaled, avoiding the introduction of artificial spatial detail and false precision [30]. A linear fuzzy membership function was applied, with a defined minimum of 0.2 and a maximum of −0.2. These boundaries were selected based on the NDVIdev ranges used in [51]. Limiting the fuzzy membership function to this range reduced the influence of extreme outliers, thereby minimising the impact of abnormally high or low deviations.
The selection of these boundaries was dependent on earlier studies using each indicator for drought monitoring. For the SWI, published sources were limited, so the physical minimum (0) was used to indicate drought conditions, and the observed maximum (100) was used to indicate saturated soil and no drought. SPI ranges below −1.5 are considered very dry; thus, 0.2 was selected for the drought certainty maximum. An NDVIdev value of −1.5 and 1.5 are considered either severely below or above normal [28], which guided the maximum and minimum membership function.
2.4.2. Fuzzy Overlay
The composite agricultural drought index integrates multiple fuzzy membership layers into a single output. Each member was on a continuous scale from 0 to 1, where values closer to 1 represent a higher degree of membership in the drought class, and values closer to 0 indicate a lower degree of membership.
The composite agricultural drought hazard index was generated using the fuzzy overlay tool with the fuzzy GAMMA operator, which balances the restrictive nature of the fuzzy AND operator, and the permissive nature of the fuzzy OR operator. The gamma overlay type is the algebraic product of the fuzzy sum and fuzzy product, both raised to the power of gamma. A default gamma value of 0.9 was used for this calculation, in the absence of a comprehensive suitability analysis. Similar methods were applied in [54], which used drought thresholds to identify ideal locations to plant drought-resilient crops. Earlier research in hazard and GIS found that gamma values close to 0.9 were accurate when validated [54,55,56].
2.4.3. Focal Statistics
As a final processing step to improve the visual clarity and completeness of the fuzzy overlay map, focal statistics were calculated for each cell based on the values of surrounding cells. This method allowed for the interpolation of no-data cells by considering the values of adjacent input cells within a defined neighbourhood, thereby smoothing the output and enhancing overall map aesthetics. A rectangular neighbourhood of length and width 2 was applied, using the mean as the aggregation statistic. Classified symbology was applied to this layer, using an equal interval. Values closer to 0 had green colours for low drought hazard; values closer to 1 had red colours, representing high drought hazard.
3. Results
Using the developed framework, an agricultural drought hazard assessment was conducted for PNG and Vanuatu for May 2015, October 2015, and March 2016 representing the start, middle, and end of the 2015–2016 El Niño. Maps of each indicator (SPI, SWI and NDVIdev) and the composite agricultural drought hazard index are presented.
3.1. Agricultural Drought in PNG
Trends in SPI across PNG over the examined period are presented in Figure 4. A substantial reduction in precipitation between May 2015 (Figure 4a) and October 2015 (Figure 4b) and an increase into March 2016 (Figure 4c) is evident. Most of PNG had normal or above normal rainfall in May 2015, except for parts of the western province, which had below normal rainfall. Map of SPI for October 2015 displays very dry conditions across most of Western PNG, New Britain and Bougainville, with normal or moderately dry conditions around Port Moresby and the central province. Leading into March 2016, conditions improved, with higher-than-normal rainfall in the Momase (north) region and mostly normal conditions elsewhere, except for the southern coast, which remains drier than normal.
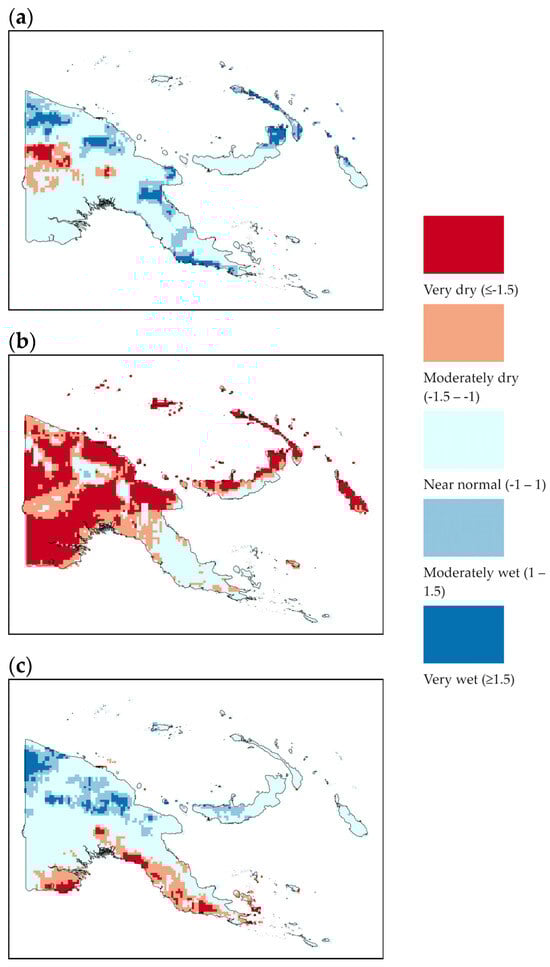
Figure 4.
3-month Standardised Precipitation Index for Papua New Guinea ending in (a) May 2015, (b) October 2015, and (c) March 2016. Indicates precipitation anomaly as higher than normal (blue) or lower than normal (red) based on 41 year normal.
Figure 5 demonstrates the changes in SWI (T = 20); there is a significant reduction in soil water between May 2015 (Figure 5a) and October 2015 (Figure 5b), particularly in the southwest by the Fly River and the Morehead District. This reduction is also significant in the north, by the Sepik River and on the island of New Britain, east of the mainland. Toward the capital, Port Moresby, there are also notable reductions in SWI. Particularly dry soil conditions across the entire country were observed in October 2015. In March 2016, conditions improved, with New Britain soil moisture improving, as well as northern parts of PNG around the Sepik River (Figure 5c). The southwest remained dry around the basin of the Fly River. There was a general trend of drying conditions from May into October 2015 and wetting into March 2016.
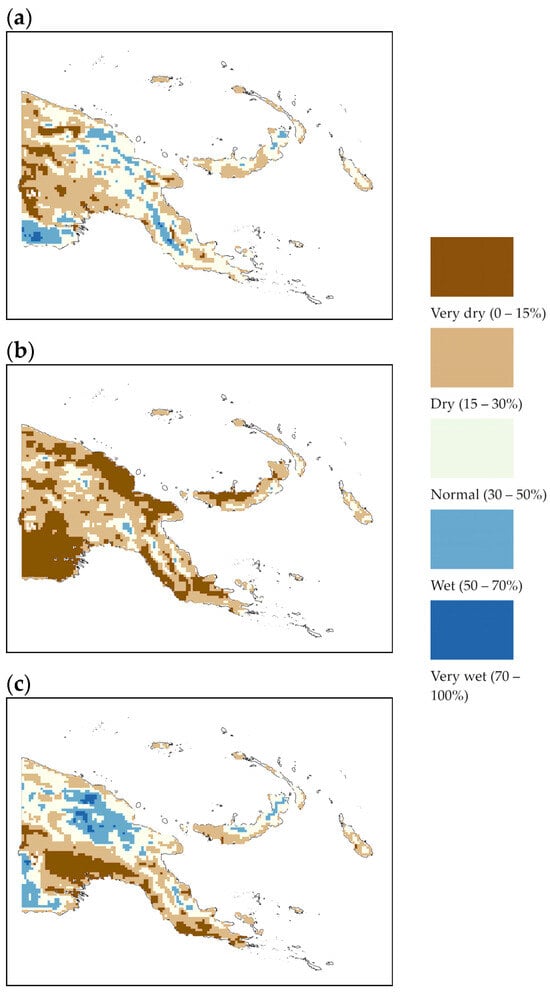
Figure 5.
Soil Water Index for Papua New Guinea for (a) May 2015, (b) October 2015 and (c) March 2016. Brown cells indicate dry soil, blue cells indicate moist soil.
It is challenging to ascertain trends in vegetation health from Figure 6 as NDVIdev is highly dependent on vegetation type, land cover, and land type. Generally, there is a trend of vegetation worsening from healthy to normal or becoming unhealthy across PNG between May 2015 (Figure 6a) and October 2015 (Figure 6b). This is notable in the Highlands and Momase regions. In March 2016, vegetation around the central province and the Momase region became less healthy, while vegetation health improved in the highland region and western province (Figure 6c). The worsening of vegetation health around Port Moresby and the central province is particularly notable in March 2016.
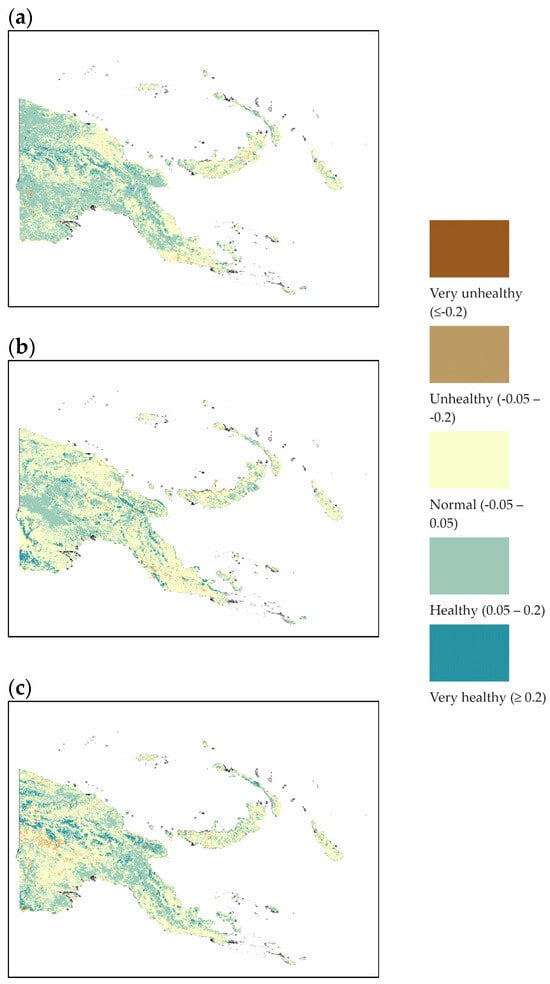
Figure 6.
Normalised Difference Vegetation Index Deviation for Papua New Guinea in (a) May 2015, (b) October 2015 and (c) March 2016. Indicates deviation of the vegetation condition from long term (1999 to 2019) mean with unhealthy (brown) vegetation and healthy vegetation (jade) indicated.
The composite agricultural drought hazard index, which incorporates conditions from all three indicators, is presented in Figure 7. It highlights a significant increase in drought hazard nationally between May 2015 (Figure 7a) and October 2015 (Figure 7b), and an improvement by March 2016 (Figure 7c). May 2015 shows a very high level of drought hazard in the Western province and a high or normal level of hazard elsewhere. In October 2015, most of PNG was at a very high level of drought hazard, including Bougainville and New Britain. The largest area of very high drought hazard is the West region near the Fly River. Only parts of the Momase region and the Central and Oro provinces are at lower levels of drought hazard. In March 2016, conditions improved in the Momase and parts of the Highland regions, reducing the level of drought hazard to normal or low. Conditions also improved from very high to high levels of hazard over New Britain and Bougainville. Drought hazard remained very high throughout the Southern Region across the Gulf of Papua coast and into parts of the highlands.
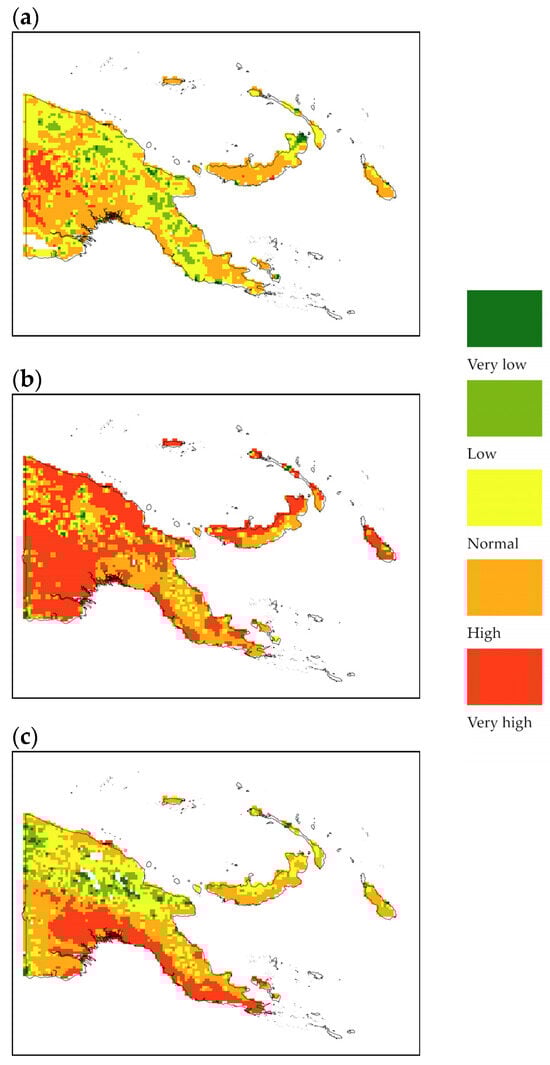
Figure 7.
Composite agricultural drought hazard index for Papua New Guinea in (a) May 2015, (b) October 2015, and (c) March 2016. Indicates severity of drought from very low (green) to very high (red) based on the combination of NDVIdev, SWI, and SPI.
3.2. Agricultural Drought in Vanuatu
Vanuatu is a relatively small country, with a total area of 12,189 km2. Results are mostly constrained to its major islands due to the 0.1° resolution of the datasets used.
A clear trend in decreased precipitation between May 2015 (Figure 8a) and October 2015 (Figure 8b) is observed. There is very low precipitation in October 2015 across nearly all of Vanuatu, except for southern islands such as Erromango and Tanna, which also had abnormally high rainfall in May 2015. Rainfall across the entire country returned to normal in March 2016 (Figure 8c).
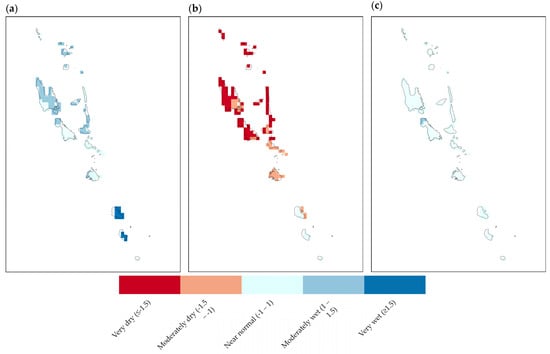
Figure 8.
3-month Standardised Precipitation Index for Vanuatu ending in (a) May 2015, (b) October 2015, and (c) March 2016. Indicates precipitation anomaly as higher than normal (blue) or lower than normal (red) based on 41 year normal.
Figure 9 shows SWI changes in Vanuatu across the 10 months examined. Soil moisture remains similar between May 2015 (Figure 9a) and October 2015 (Figure 9b), with slightly drier soil on Espiritu Santo. Between October 2015 and March 2016 (Figure 9c), soil dried substantially on Espiritu Santo, Malakula, and smaller islands to the south. On the island of Efate, soil drying continued into March. Many islands, particularly those on the east side of Vanuatu, are too small in area for a remotely sensed soil water index result at this resolution.
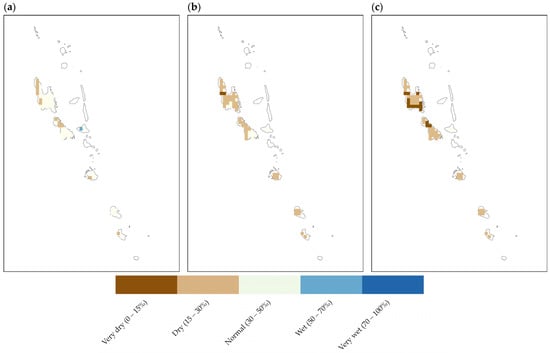
Figure 9.
Soil Water Index for Vanuatu in (a) May 2015, (b) October 2015 and (c) March 2016. Brown cells indicate dry soil, blue cells indicate moist soil.
Figure 10 displays the changes in vegetation anomaly across the 10 months throughout Vanuatu. As with PNG, it is difficult to identify an ongoing trend with NDVIdev due to the influence of land cover, land use and vegetation type. On Efate, vegetation was consistently unhealthy or very unhealthy compared to the mean, which is similar on Unpongkor. On the largest two islands, Espiritu Santo and Malakula, there is a wide range of vegetation with conditions ranging from healthy to unhealthy, which generally remains similar across the period.
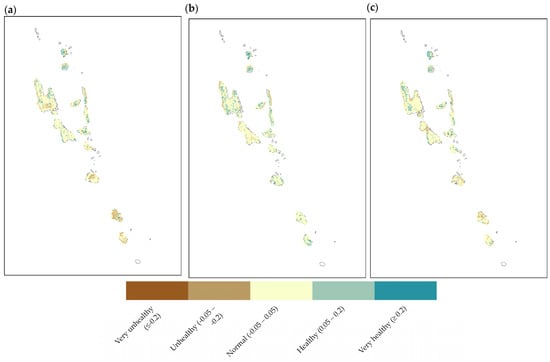
Figure 10.
Normalised Difference Vegetation Index Deviation for Vanuatu in (a) May 2015, (b) October 2015, and (c) March 2016. Indicates deviation of the vegetation condition from long term (1999 to 2019) mean with unhealty (brown) vegetation and healthy vegetation (jade).
Figure 11 uses fuzzy overlay to combine the three indicators. Unlike PNG, focal statistics were not applied to preserve the geographic specificity required for a small country like Vanuatu. The composite index shows a trend of worsening agricultural drought hazard from May 2015 (Figure 11a) to October 2015 (Figure 11b). Only the larger islands contain cells with the combined drought hazard indicator, limited by the lack of soil water data on small islands. In May 2015, drought hazard was at a normal level; by October 2015, this progressed to high and very high on Espiritu Santo, Malakula, and Efate. Very high drought hazard subsides to high by March 2016 (Figure 11c).
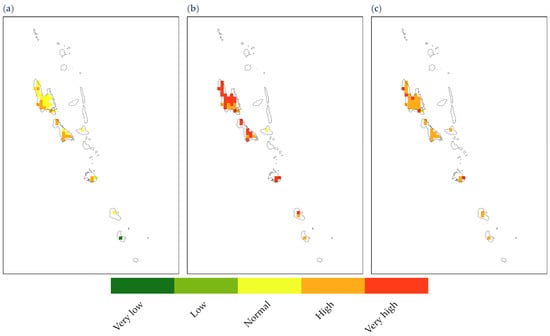
Figure 11.
Composite agricultural drought hazard index for Vanuatu in (a) May 2015, (b) October 2015 and (c) March 2016. Indicates severity of drought from very low (green) to very high (red) based on the combination of NDVIdev, SWI and SPI.
3.3. General Trends
Overall, drought hazard assessments for both PNG and Vanuatu demonstrated worsening conditions associated with El Niño-induced drought from May to October 2015, and improving conditions into March 2016. The trends of the composite drought hazard index align closely with those of SPI and SWI. The NDVIdev, however, has a high level of variation throughout, rendering it challenging to deduce a consistent statistical signal.
This research aims to develop a framework for monitoring agricultural drought effectively utilising satellite-derived indicators. The results demonstrate that integrating three key indicators, SPI, SWI, and NDVIdev into a composite drought hazard index provides a nuanced view that captures meteorological and agricultural drought. By applying this framework to case studies in PNG and Vanuatu across three significant time points, the study demonstrated that combining multiple indicators provides a more holistic and spatially explicit representation of drought hazard. This is particularly valuable in the Pacific, where in situ drought monitoring is sparse and satellite remote sensing offers a viable, scalable alternative.
4. Discussion
4.1. Context
4.1.1. Connection Between Indicators
It is unsurprising that there exists a moderate to strong positive linear correlation between soil moisture and precipitation datasets used [57]. This correlation was stronger in areas of limited vegetation than in dense vegetation. PNG has dense levels of tropical vegetation, as do many PICs, which are likely to impact SWI results [58].
Changes in NDVI are dependent on the change of climatic factors (temperature and precipitation); it is generally inversely proportional to temperature and proportional to precipitation [59,60,61].
Soil moisture and NDVI are positively correlated, with increases in soil moisture generally leading to healthier vegetation and higher NDVI values, although this relationship can exhibit saturation points beyond which further moisture has little effect. The strength of this correlation varies by region, vegetation type, and environmental conditions, making it a valuable but context-dependent indicator for drought monitoring [62].
4.1.2. Connection to Climate Variability
Both PNG and Vanuatu in May 2015 showed drought hazard conditions varying from normal to very high, with few areas at low or very low hazard stages (Figure 7 and Figure 11). During this time, 6% of PNG was in a “very high” drought period and 40% of Vanuatu was classed as “very high” drought. This period corresponds with the BoM declaration on 13 May 2015 that El Niño was underway. El Niño is known to suppress rainfall across the Western Pacific, which was reflected in the clear reduction of SPI in both PNG and Vanuatu between May and October 2015. This decline in rainfall subsequently led to reductions in soil moisture, as captured by the SWI, and contributed to deteriorating vegetation health in some regions, as shown by the NDVIdev. Composite drought hazard maps corroborate this trend, with drought conditions severe in October 2015. 58% of PNG is shown as “very high” drought hazard while 72% of Vanuatu is shown as “very high” drought hazard. In March 2016, the BoM noted a weakening of the El Niño which progressed to neutral by May. This trend is reflected in the reduction of drought hazard conditions seeing in Figure 7b,c and Figure 11b,c. While dry conditions were evident in March 2016, conditions had improved significantly compared to October 2015.
The 2015/2016 El Niño was an extreme event, marked by record-breaking central Pacific warming and significant rainfall anomalies, but it was weaker than the 1982/1983 and 1997/1998 El Niños, which remain the strongest on record. Unlike those earlier events that showed strong eastward-propagating SST anomalies and exceptional eastern Pacific rainfall, the 2015/2016 event was characterised by a mixed pattern with exceptionally strong central Pacific warming and only moderate eastern Pacific anomalies. In terms of wind variability, heat content discharge, and westerly wind burst activity, the 2015/2016 El Niño was still extreme but fell short of the magnitude of the 1982/1983 and 1997/1998 events, reflecting the nonlinear and diverse nature of ENSO extremes [63].
Analysis of co-occurring IOD and ENSO events over northeast Australia [64] and PNG [65] demonstrated that it resulted in increased frequency, duration and severity of drought and heatwave events in the western Pacific region. A positive IOD was observed from March to November 2015, which transitioned to a negative IOD in June 2016. These co-occurring events are likely to have worsened drought conditions in PNG, as described by the composite agricultural drought hazard index indicating very high severity of drought for many parts of PNG in October 2015 (Figure 7b).
4.1.3. Connection to Existing Drought Research
Findings from this study align with prior assessments, which examined the same period in the western Pacific. However, these studies focused on meteorological drought (not agricultural) in PNG only and employed a multi-dimensional approach that combined drought hazard with exposure and vulnerability metrics. The novelty presented in this framework is the combination of indicators specific to agricultural drought with effective spatial coverage over the western Pacific region. Unlike previous studies, the results presented specifically highlighted areas where agricultural drought hazard is of most concern.
4.1.4. Connection to Lived Experience in Papua New Guinea
Impacts of drought during the El Niño in 2015 and 2016 are widely documented as being catastrophic and far-reaching. In PNG, prolonged below-average rainfall (Figure 4b) and frost events resulted in crop damage across the country, especially in the Highland provinces, and resulted in low water storages that also impacted hydroelectric generation. In high elevation areas, reduced cloud cover resulted in damaging frosts that further reduced agricultural yields. A PNG government report released in October 2015 estimated that 1.33 million people needed food assistance due to widespread crop damage [66]. Although it is thought that morbidity and mortality increased overall as a result of the drought period, there are insufficient statistics to track health and death statistics to support this. Nonetheless, anecdotal evidence suggests that child malnutrition and mortality and morbidity worsened in 2015 and 2016 due to insufficient agricultural supply [66]. In response, the Australian Government Department of Foreign Affairs and Trade was the largest donor, providing ~A$8 million in humanitarian aid in response to the drought in PNG. €1.26 million was provided to PNG by the European Commission’s Civil Protection and Humanitarian Aid Operations in response to critical drought conditions by September of 2015 [67].
4.1.5. Connection to Lived Experience in Vanuatu
Similar conditions were experienced by Vanuatu from mid-2015, in conjunction with category 5 tropical cyclone Pam in March 2016. Vanuatu recorded fatalities related to malnutrition and contamination, driven by a shortage of food and water supply [68]. The effects of two compound events, drought and tropical cyclone, amplified the impacts of both, reducing community resilience to further shocks. Compound hazards like this are of growing concern with anthropogenic climate change, increasing the frequency and intensity of extreme climate events and reducing the time for recovery [69]. In a press release, the Vanuatu government shared that the El Niño would “peak in October to December 2015”, reducing rainfall across the country [70], which corresponds with results seen in Figure 8b. In June 2016, it was noted that reasonable rain had improved water concerns (congruent with Figure 10c); however, as Vanuatu shifted into the drier season of 2016, food security remained an “issue in some areas” [71].
In summary, the drought hazard conditions presented in this study are supported by lived experience and documented post-event research. Further validation of local results is required to better understand the specificity of the results.
4.2. Evaluation
4.2.1. Fuzzy Logic
The composite agricultural drought hazard index developed using fuzzy logic offered a flexible and effective means of integrating multiple space-based drought indicators with varying characteristics. Several alternative overlay methods were considered, including equal weighting averaging of indicators, principal component analysis (PCA) and expert weighting systems. Each presented benefits and drawbacks.
Equal weighting uses scaled indicators averaged together to calculate a composite indicator. This is a simple and transparent method for combining indicators without statistical models or expert judgment. However, equal weighting fails to give insights into the relationships between indicators such as the flow-on effect of soil moisture deficiency on vegetation health [72].
Expert weighting systems apply weight based on literature reviews and expert consultation to each indicator, depending on their influence over drought. Expert weighting can sometimes be biased or subjective, depending on how they were formed; they can also be difficult to reproduce in other regions if they include local knowledge and specificity. This was unsuitable for a region-wide framework.
PCA was also considered, providing objective and data-driven weighting based on how each indicator contributes to variability. However, PCA also can have weightings that differ from reality and be overly sensitive to changing scales between variables [72].
Fuzzy overlay proved to be a suitable technique for combining drought indicators together; it is commonly used in drought spatial assessments, such as in [53,73,74]. One of the key advantages of fuzzy logic is its ability to represent the continuous nature of environmental processes, enabling partial membership rather than binary classification. This is particularly relevant for drought, where transitions between normal and stressed conditions are often gradual rather than abrupt.
While fuzzy overlay offers a flexible and theoretically sound approach, the method requires careful parameter calibration and lacks direct interpretability, which can limit transparency without supporting validation data. Calibration of membership function parameters (min/max, linear vs. sigmoidal) and the gamma value in fuzzy overlay affects the results and may be arbitrary without ground truth data. It was essential to keep these consistent in the model throughout the result generation process. Fuzzy overlay can sometimes dilute strong signals if one indicator is significantly stronger/weaker than others due to the blending of input values.
4.2.2. Focal Statistics
Focal statistics were applied to the composite drought hazard maps for PNG to smooth isolated extreme values and improve visual clarity. By averaging each cell with neighbouring cells, the output became more spatially coherent and easier to interpret. This process helps to smooth abrupt transitions and fill small gaps where no-data values might have occurred after fuzzy overlay, particularly in heterogeneous terrains or along coastlines. This was particularly important given PNG’s larger landmass and raster size. Focal statistics were not applied to Vanuatu to preserve the finer detail required for its smaller islands.
4.3. Limitations
This study demonstrated an effective framework for agricultural drought hazard assessment and mapping in the Pacific. There were some limitations that should be acknowledged for the improvement of the framework. These concern the decisions made with processing SWI and NDVIdev, assumptions made with thresholds and options in GIS processing.
4.3.1. SWI T Value
The SWI V3 dataset selected from the CLMS is a robust, validated product in an operational stage, making it appropriate for use in this study. Careful selection was made for the T value of 20 used, as discussed earlier. A higher T value describes a deeper soil layer if the soil diffusivity is constant; with changing soil diffusivity, the same T value can describe different depths for different soils. This logic stems from the two-layer water balance model, which accounts for surface soil moisture and lower layers acting as water reservoirs [33]. For a more robust use of SWI, calibration of the chosen T-value in GIS would be required, depending on soil texture and the data sampling interval in each country [44]. Lack of in situ observations prevented this calibration from occurring.
4.3.2. Spatial Resolution
SWI and SPI were available at a 0.1° resolution, with each cell ~12.5 km in length and width. This relatively coarse spatial resolution and the need to resample the composite agricultural drought hazard index to match it created cells too large to effectively deduce trends in small countries like Vanuatu. Observing Figure 10, there are far fewer cells than land area, with many islands not accounted for at all. If higher resolution SWI and SPI datasets were to be used, this coarseness would be reduced, improving the viability of the framework in small PICs. Satellite remote sensing products are constantly evolving and improving, such as a Sentinel-1 Synthetic Aperture Radar-based global 1 km soil moisture data product and the 1 km Standardised Precipitation Evapotranspiration Index (SPEI) using European Centre for Medium Weather Forecasting Reanalysis V5 (ERA5) [75,76]. Further research and validation are required to determine which indicators provide a high resolution while maintaining the accuracy and accessibility that SWI V3, SPI and NDVIdev provide.
4.3.3. NDVI
Calculation was required to convert NDVI observations to vegetation anomaly indicators, deviating from normal conditions over time. Long-term statistics (LTS) were used for this purpose. NDVI deviation from the mean was selected; however, there were several other options available for consideration. The product user manual refers to Standardised Difference Vegetation Index (SDVI) [77], Vegetation Condition Index (VCI) [78] and the Vegetation Productivity Indicator (VPI) [79]. These account for the LTS of NDVI, such as the standard deviation (SDVI) and the long-term minimum and maximum (VCI and VPI). In this study, it was decided to use the NDVIdev as used in [51], which only considered the long-term mean and observed value. This simplified the raster calculator function model by avoiding the need to integrate multiple datasets, reducing the risk of human error under time constraints.
Despite the limitations identified in this study, the comparison of drought indicators and the composite agricultural drought hazard index against recorded experiences suggests that the proposed methodology effectively captures drought hazard in PNG and Vanuatu. With further calibration, this approach could be adapted for use in operational drought monitoring systems.
4.4. Future Direction
With a suggested framework for agricultural drought hazard assessment and mapping in PICs, further research can be conducted to apply the following suggestions.
4.4.1. Machine Learning
The field of satellite remote sensing is evolving rapidly with advancements in machine learning, artificial intelligence (AI), and sophisticated modelling techniques, developments that have significant implications for drought hazard monitoring. Emerging drought prediction systems that utilise these technologies often outperform conventional indicators [80,81]. AI-based models such as decision trees, generalised linear models, support vector machines, deep learning, and random forests integrate both in situ and satellite remote sensing data to enhance the accuracy of drought forecasting. As these technologies continue to advance, it is recommended that future agricultural drought hazard indices incorporate such methods to improve their reliability and responsiveness.
4.4.2. Other Drought Indicators
A consideration for future research is whether more indicators, or different ones, would be valuable in the composite agricultural drought hazard index. There are many indicators available, using in situ observation, satellite remote sensing or models and reanalysis to represent drought and climatic conditions. One such potential indicator is the SPEI, rather than SPI, which considers evapotranspiration in addition to precipitation. With considerations of climate change and an increasing global surface temperature, SPEI may be more suitable, as the two become more decoupled over time [82]. Considerable amount of recent research has suggested the concept of flash drought, a subset of all drought types characterised by their unusually rapid intensification [83]. Flash droughts are increasing in frequency, which is attributed, in part, to anthropogenic climate change and increasing evaporative demand. A change in evapotranspiration is reflected in the SPEI, but not SPI, which suggests that SPEI may be preferable in an agricultural drought hazard framework when incorporating the context of a changing climate.
4.4.3. Further Considerations for Composite Index
As this framework focuses specifically on agricultural drought, it would be beneficial for the composite index to incorporate additional contextual factors such as land use, land cover type, and terrain. These variables affect drought manifestation across different landscapes. For example, the hydrological impacts of rainfall can vary significantly between valleys and steep mountainous regions, such as the Bismarck Range in PNG. In such areas, water may run off quickly rather than infiltrate the soil, affecting soil moisture and vegetation differently. Communities living closer to mountainous terrain will experience different impacts of rainfall shortages than ones living in more flat areas; such implications are not currently considered in the agricultural framework. A focus on regional terrain in the Pacific, particularly due to their low elevation would be beneficial for this framework.
Additionally, changes in vegetation health, measured with indicators like NDVIdev, can occur due to factors unrelated to drought, such as deforestation, urban development, or agricultural clearing. These anthropogenic activities can mimic the effects of drought by reducing vegetation cover, potentially leading to misinterpretation when NDVI anomalies are used in isolation. As a result, there is a risk that the composite index could falsely identify drought conditions where none exist. Incorporating land use data and understanding local terrain and development pressures can help mitigate these limitations and improve the accuracy of agricultural drought assessments.
5. Conclusions
This research advances agricultural drought monitoring in Pacific Island Countries by proposing a composite framework that integrates satellite-derived remote sensing indicators, providing a regionally tailored tool to better capture and assess agricultural drought conditions. The performance of the developed framework was examined for two countries in the western Pacific, Papua New Guinea and Vanuatu, across three time points: May 2015, October 2015, and March 2016, representing the onset, peak, and decline of a severe El Niño-related drought. Three indicators, combined into a composite hazard index (SPI, SWI and NDVIdev), were used as proxies for the observed reduction in rainfall over an extended period, the subsequent change in soil moisture available for crop and pasture growth, and the decline in vegetation health that can signal a drought is well underway, and impacts on agriculture have likely started.
Drought hazard maps were developed, showing each of the three indicators across the 2015-16 El Niño-induced drought period, in both countries. The results were congruent with lived experience, highlighting a trend of developing and worsening drought conditions from May 2015 to October 2015 (6% to 58% of PNG in very high drought and 40% to 72% of Vanuatu in very high drought hazard), and some recovery into March 2016. Unlike previous studies on the 2015-16 drought in the South Pacific, these results specifically highlight the agricultural drought hazard, which is known to have a high impact at family, community, and national levels.
Future research should focus on incorporating the Standardised Precipitation Evapotranspiration Index (SPEI) to better account for evaporative stress under climate change, automating the framework through scripting and API access for operational implementation, and conducting local ground-based validation to improve accuracy.
Establishing this understanding of agricultural drought hazard is the first step in building a comprehensive drought risk assessment that encompasses the exposure and vulnerability at provincial scales. This framework provides Pacific Island nations with a cost-effective drought monitoring tool that requires no ground-based infrastructure. Such assessments have the potential to support early warning systems and improve both country and community resilience, including reducing morbidity and mortality, an increasingly vital goal in a changing climate.
Author Contributions
Conceptualization, S.M., Y.K. and A.B.W.; methodology, S.M.; software, S.M.; validation, S.M., Y.K. and A.B.W.; formal analysis, S.M.; writing—original draft preparation, S.M.; writing—review and editing, S.M., Y.K. and A.B.W.; supervision, Y.K. and A.B.W.; project administration, Y.K.; funding acquisition, Y.K. All authors have read and agreed to the published version of the manuscript.
Funding
This research received no external funding.
Data Availability Statement
SPI data sourced from the BoM, NDVI, and SWI data sourced from Copernicus Land Monitoring Service.
Acknowledgments
We thank colleagues from the CREWS (Climate Risk and Early Warning Systems) team at BoM (Bureau of Meteorology) for valuable advice on this research. We thank Zhi-Weng Chua, Cameron Do and Jessica Bhardwaj at the BoM for their support during this research.
Conflicts of Interest
The authors declare no conflicts of interest.
Abbreviations
The following abbreviations are used in this manuscript:
| BOM | Bureau of Meteorology |
| CLMS | Copernicus land monitoring service |
| CREWS | Climate Risk and Early Warning Systems |
| DRA | Drought risk assessment |
| ENSO | El Niño–Southern Oscillation |
| LTS | Long-term statistics |
| MSWEP | Multi-source weighted ensemble precipitation |
| NDVI | Normalised difference vegetation index |
| NDVIdev | Normalised difference vegetation index deviation |
| PIC | Pacific Island Countries |
| PNG | Papua New Guinea |
| SPI | Standardised precipitation index |
| SWI | Soil water index |
| WMO | World Meteorological Organisation |
Appendix A

Figure A1.
Agricultural drought occurrence sequence and impacts. Highlights that droughts originate with climate variability and some interaction with anthropogenic climate change and deficient precipitation, and cascade over a prolonged time leading to various consequences. Adapted from US National Drought Mitigation Centre [6].

Figure A2.
Criteria for selecting appropriate drought indicators, providing justification for each criterion and positive/negative outcomes for each option.

Figure A3.
Summary of functions applied to drought indicators for generating results. Contains the steps involved in creating the agricultural drought indicator maps and the composite index maps.
References
- BoM. Australian Water Information Dictionary—Drought. Available online: http://www.bom.gov.au/water/awid/id-861.shtml (accessed on 13 March 2025).
- WHO. Drought. World Health Organisation. 2024. Available online: https://www.who.int/health-topics/drought#tab=tab_1 (accessed on 4 March 2025).
- Wilhite, D.A.; Glantz, M.H. Understanding: The Drought Phenomenon: The Role of Definitions. Water Int. 1985, 10, 111–120. [Google Scholar] [CrossRef]
- Wilhite, D.A. The Enigma of Drought. In Drought Assessment, Management, and Planning: Theory and Case Studies; Wilhite, D.A., Ed.; Springer: New York, NY, USA, 1993; pp. 3–15. [Google Scholar]
- Fuchs, B.A.; Svoboda, M.D.; Wilhite, D.A.; Hayes, M.J. Drought Indices for Drought Risk Assessment in a Changing Climate. In Handbook of Engineering Hydrology: Modeling, Climate Change, and Variability, 1st ed.; Eslamian, S., Ed.; CRC Press: Boca Raton, FL, USA, 2014. [Google Scholar]
- National Drought Mitigation Centre. Types of Drought. National Drought Mitigation Centre. 2024. Available online: https://drought.unl.edu/Education/DroughtIn-depth/TypesofDrought.aspx (accessed on 25 February 2025).
- Zhang, Y.; Wu, Z.; Singh, V.P.; Lin, Q.; Ning, S.; Zhou, Y.; Jin, J.; Zhou, R.; Ma, Q. Agricultural drought characteristics in a typical plain region considering irrigation, crop growth, and water demand impacts. Agric. Water Manag. 2023, 282, 108266. [Google Scholar] [CrossRef]
- Taylor, M.; McGregor, A.; Dawson, B. Vulnerability of Pacific Island Agriculture and Forestry to Climate Change; Pacific Community: Nouméa, New Caledonia, 2016. [Google Scholar]
- Gibson, J. The role of agriculture in the development process in the Pacific. N. Z. Econ. Pap. 2023, 57, 99–104. [Google Scholar] [CrossRef]
- Georgeou, N.; Hawksley, C.; Wali, N.; Lountain, S.; Rowe, E.; West, C.; Barratt, L. Food security and small holder farming in Pacific Island countries and territories: A scoping review. PLOS Sustain. Transform. 2022, 1, e0000009. [Google Scholar] [CrossRef]
- Kuleshov, Y.; McGree, S.; Jones, D.; Charles, A.; Cottrill, D.; Prakash, B.; Atalifo, T.; Nihmei, S.; Seuseu, F.L.S.K. Extreme Weather and Climate Events and Their Impacts on Island Countries in the Western Pacific: Cyclones, Floods and Droughts. Atmos. Clim. Sci. 2014, 4, 803–818. [Google Scholar] [CrossRef]
- Mohammadi, B.; Vaheddoost, B.; Danandeh Mehr, A. A spatiotemporal teleconnection study between Peruvian precipitation and oceanic oscillations. Quat. Int. 2020, 565, 1–11. [Google Scholar] [CrossRef]
- Intergovernmental Panel on Climate Change. Climate Change 2023: Synthesis Report. In Contribution of Working Groups I, II and III to the Sixth Assessment Report of the Intergovernmental Panel on Climate Change; Intergovernmental Panel on Climate Change: Geneva, Switzerland, 2023; pp. 35–115. [Google Scholar] [CrossRef]
- Nunn, P.D.; Kumar, R. Alluvial charcoal in the Sigatoka Valley, Viti Levu Island, Fiji. Palaeogeogr. Palaeoclimatol. Palaeoecol. 2004, 213, 153–162. [Google Scholar] [CrossRef]
- Easterling, D.R.; Meehl, G.A.; Parmesan, C.; Changnon, S.A.; Karl, T.R.; Mearns, L.O. Climate Extremes: Observations, Modeling, and Impacts. Science 2000, 289, 2068–2074. [Google Scholar] [CrossRef] [PubMed]
- Li, J.; Li, Y.; Yin, L.; Zhao, Q. A novel composite drought index combining precipitation, temperature and evapotranspiration used for drought monitoring in the Huang-Huai-Hai Plain. Agric. Water Manag. 2024, 291, 108626. [Google Scholar] [CrossRef]
- Gholinia, A.; Abbaszadeh, P. Agricultural Drought Monitoring: A Comparative Review of Conventional and Satellite-Based Indices. Atmosphere 2024, 15, 1129. [Google Scholar] [CrossRef]
- Zhang, X.; Wu, Z.; Wang, H.; He, C.; Zhang, F.; Zhou, Y. Urban meteorological drought comprehensive index based on a composite fuzzy matter element-moment estimation weighting model. iScience 2024, 27, 110798. [Google Scholar] [CrossRef]
- Xu, W.; Tang, M.; Jin, J.; Xie, Q.; Hu, Y. Concept and method of drought disaster risk measurement based on drought propagation level--a case study of AnHui Province. Ecol. Indic. 2024, 166, 112286. [Google Scholar] [CrossRef]
- Nakhaei, M.; Mohebbi Tafreshi, A.; Saadi, T. A novel GIS-based modified multivariate drought index for modeling and management of the hydrogeological drought (Case study: Hashtgerd Aquifer, Iran). Environ. Sci. Pollut. Res. Int. 2025, 32, 6005–6026. [Google Scholar] [CrossRef] [PubMed]
- Liu, Y.; Shan, F.; Yue, H.; Wang, X.; Fan, Y. Global analysis of the correlation and propagation among meteorological, agricultural, surface water, and groundwater droughts. J. Environ. Manag. 2023, 333, 117460. [Google Scholar] [CrossRef]
- Edkins, K.; Papua New Guinea Provinces (Numbers) 2012. Wikipedia. 2012. Available online: https://commons.wikimedia.org/wiki/File:Papua_new_guinea_provinces_(numbers)_2012.png (accessed on 28 May 2025).
- Svoboda, M.; Fuchs, B. Handbook of Drought Indicators and Indices; World Meteorological Organization: Geneva, Switzerland, 2016. [Google Scholar]
- Wilkinson, M.D.; Dumontier, M.; Aalbersberg, I.J.; Appleton, G.; Axton, M.; Baak, A.; Blomberg, N.; Boiten, J.-W.; da Silva Santos, L.B.; Bourne, P.E.; et al. The FAIR Guiding Principles for scientific data management and stewardship. Sci. Data 2016, 3, 160018. [Google Scholar] [CrossRef]
- Bhardwaj, J.; Kuleshov, Y.; Chua, Z.-W.; Watkins, A.B.; Choy, S.; Sun, Q. Evaluating Satellite Soil Moisture Datasets for Drought Monitoring in Australia and the South-West Pacific. Remote Sens. 2022, 14, 3971. [Google Scholar] [CrossRef]
- Chua, Z.W.; Kuleshov, Y.; Watkins, A.B. Drought detection over papua new guinea using satellite-derived products. Remote Sens. 2020, 12, 3859. [Google Scholar] [CrossRef]
- Kuleshov, Y.; Kurino, T.; Kubota, T.; Tashima, T.; Xie, P. WMO Space-Based Weather and Climate Extremes Monitoring Demonstration Project (SEMDP): First Outcomes of Regional Cooperation on Drought and Heavy Precipitation Monitoring for Australia and Southeast Asia. In Rainfall—Extremes, Distribution and Properties; Abbot, J., Hammond, A., Eds.; IntechOpen: London, UK, 2019. [Google Scholar]
- McKee, T.B.; Doesken, N.J.; Kleist, J. The Relationship of Drought Frequency and Duration to Time Scales. In Proceedings of the 8th Conference on Applied Climatology, Anaheim, CA, USA, 17–22 January 1993; pp. 179–184. [Google Scholar]
- Svoboda, M.; Hayes, M.J.; Wood, D. Standardized Precipitation Index: User Guide; World Meteorological Organization: Geneva, Switzerland, 2012. [Google Scholar]
- Beck, H.E.; Wood, E.F.; Pan, M.; Fisher, C.K.; Miralles, D.G.; van Dijk, A.I.J.M.; McVicar, T.R.; Adler, R.F. MSWEP V2 Global 3-Hourly 0.1° Precipitation: Methodology and Quantitative Assessment. Bull. Am. Meteorol. Soc. 2019, 100, 473–500. [Google Scholar] [CrossRef]
- Abbas, A.; Yang, Y.; Pan, M.; Tramblay, Y.; Shen, C.; Ji, H.; Gebrechorkos, S.H.; Pappenberger, F.; Pyo, J.C.; Feng, D.; et al. Comprehensive Global Assessment of 23 Gridded Precipitation Datasets Across 16,295 Catchments Using Hydrological Modeling. EGUsphere 2025, 2025. [Google Scholar] [CrossRef]
- Zeri, M.; Williams, K.; Cunha, A.P.M.A.; Cunha-Zeri, G.; Vianna, M.S.; Blyth, E.M.; Marthews, T.R.; Hayman, G.D.; Costa, J.M.; Marengo, J.A.; et al. Importance of including soil moisture in drought monitoring over the Brazilian semiarid region: An evaluation using the JULES model, in situ observations, and remote sensing. Clim. Resil. Sustain. 2022, 1, e7. [Google Scholar] [CrossRef]
- Ceballos, A.; Scipal, K.; Wagner, W.; Martínez-Fernández, J. Validation of ERS scatterometer-derived soil moisture data in the central part of the Duero Basin, Spain. Hydrol. Process. 2005, 19, 1549–1566. [Google Scholar] [CrossRef]
- Huang, S.; Tang, L.; Hupy, J.P.; Wang, Y.; Shao, G. A commentary review on the use of normalized difference vegetation index (NDVI) in the era of popular remote sensing. J. For. Res. 2021, 32, 1–6. [Google Scholar] [CrossRef]
- Swinnen, E.; Toté, C.; Tavares, J.L.; Lacaze, R. Copernicus Global Land Service NDVI Continuity with Sentinel-3 Data. In Proceedings of the 2021 IEEE International Geoscience and Remote Sensing Symposium IGARSS, Brussels, Belgium, 11–16 July 2021; pp. 6731–6734. [Google Scholar]
- Toté, C.; Swinnen, E.; Sterckx, S.; Adriaensen, S.; Benhadj, I.; Iordache, M.-D.; Bertels, L.; Kirches, G.; Stelzer, K.; Dierckx, W.; et al. Evaluation of PROBA-V Collection 1: Refined Radiometry, Geometry, and Cloud Screening. Remote Sens. 2018, 10, 1375. [Google Scholar] [CrossRef]
- Toté, C.; Swinnen, E.; Sterckx, S.; Clarijs, D.; Quang, C.; Maes, R. Evaluation of the SPOT/VEGETATION Collection 3 reprocessed dataset: Surface reflectances and NDVI. Remote Sens. Environ. 2017, 201, 219–233. [Google Scholar] [CrossRef]
- Xu, Z.; Wu, Z.; He, H.; Wu, X.; Zhou, J.; Zhang, Y.; Guo, X. Evaluating the accuracy of MSWEP V2.1 and its performance for drought monitoring over mainland China. Atmos. Res. 2019, 226, 17–31. [Google Scholar] [CrossRef]
- Swain, S.; Patel, P.; Nandi, S. Application of SPI, EDI and PNPI using MSWEP precipitation data over Marathwada, India. In Proceedings of the 2017 IEEE International Geoscience and Remote Sensing Symposium (IGARSS), Fort Worth, TX, USA, 23–28 July 2017; pp. 5505–5507. [Google Scholar]
- Alijanian, M.; Rakhshandehroo, G.R.; Mishra, A.; Dehghani, M. Evaluation of remotely sensed precipitation estimates using PERSIANN-CDR and MSWEP for spatio-temporal drought assessment over Iran. J. Hydrol. 2019, 579, 124189. [Google Scholar] [CrossRef]
- European Drought Observatory. EDO AND GDO INDICATOR FACTSHEET: Standardised Precipitation Index. Copernicus. Available online: https://drought.emergency.copernicus.eu/data/factsheets/factsheet_spi.pdf (accessed on 19 August 2025).
- Papua New Guinea—Subnational Administrative Boundaries. United Nations Office for the Coordination of Humanitarian Affairs. 2025. Available online: https://data.humdata.org/dataset/cod-ab-png (accessed on 28 May 2025).
- Wagner, W.; Lemoine, G.; Rott, H. A Method for Estimating Soil Moisture from ERS Scatterometer and Soil Data. Remote Sens. Environ. 1999, 70, 191–207. [Google Scholar] [CrossRef]
- de Lange, R.; Beck, R.; van de Giesen, N.; Friesen, J.; de Wit, A.; Wagner, W. Scatterometer-Derived Soil Moisture Calibrated for Soil Texture With a One-Dimensional Water-Flow Model. IEEE Trans. Geosci. Remote Sens. 2008, 46, 4041–4049. [Google Scholar] [CrossRef]
- Boken, V.K.; Cracknell, A.P.; Heathcote, R.L. Monitoring and Predicting Agricultural Drought: A Global Study; Oxford University Press: Oxford, UK, 2005. [Google Scholar]
- Wagner, W.; Hahn, S.; Kidd, R.; Melzer, T.; Bartalis, Z.; Hasenauer, S.; Figa-saldaña, J.; Rosnay, P.; Jann, A.; Schneider, S.; et al. The ASCAT Soil Moisture Product: A Review of its Specifications, Validation Results, and Emerging Applications. Meteorol. Z. 2013, 22, 5–33. [Google Scholar] [CrossRef]
- Albergel, C.; Dorigo, W.; Reichle, R.H.; Balsamo, G.; de Rosnay, P.; Muñoz-Sabater, J.; Isaksen, L.; de Jeu, R.; Wagner, W. Skill and Global Trend Analysis of Soil Moisture from Reanalyses and Microwave Remote Sensing. J. Hydrometeorol. 2013, 14, 1259–1277. [Google Scholar] [CrossRef]
- Spinoni, J.; Barbosa, P.; De Jager, A.; McCormick, N.; Naumann, G.; Vogt, J.V.; Magni, D.; Masante, D.; Mazzeschi, M. A new global database of meteorological drought events from 1951 to 2016. J. Hydrol. Reg. Stud. 2019, 22, 100593. [Google Scholar] [CrossRef]
- Sepulcre-Canto, G.; Horion, S.; Singleton, A.; Carrao, H.; Vogt, J. Development of a Combined Drought Indicator to detect agricultural drought in Europe. Nat. Hazards Earth Syst. Sci. 2012, 12, 3519–3531. [Google Scholar] [CrossRef]
- Moussa Kourouma, J.; Emmanuel, E.; Emnet, N.; Darius, P.; Royd, V.; Atkilt, G.; Zenebe, A. Assessing the spatio-temporal variability of NDVI and VCI as indices of crops productivity in Ethiopia: A remote sensing approach. Geomat. Nat. Hazards Risk 2021, 12, 2880–2903. [Google Scholar] [CrossRef]
- Demisse, G.; Hill, S.; Tadesse, T.; Atnafu, S. Using Satellite Images for Drought Monitoring: A Knowledge Discovery Approach. J. Strateg. Innov. Sustain. 2011, 7, 135–152. [Google Scholar]
- Batool, A.; Ruba, S.; Ghufran, M.A.; Rashid, A.; Nadeem, N. Fuzzy comparison of drought vulnerability based on the analytical hierarchy process. Zoo Bot. 2024, 2, 7–26. [Google Scholar] [CrossRef]
- Malik, A.; Kumar, A.; Salih, S.Q.; Kim, S.; Kim, N.W.; Yaseen, Z.M.; Singh, V.P. Drought index prediction using advanced fuzzy logic model: Regional case study over Kumaon in India. PLoS ONE 2020, 15, e0233280. [Google Scholar] [CrossRef]
- Lewis, S.M.; Fitts, G.; Kelly, M.; Dale, L. A fuzzy logic-based spatial suitability model for drought-tolerant switchgrass in the United States. Comput. Electron. Agric. 2014, 103, 39–47. [Google Scholar] [CrossRef]
- Nwazelibe, V.E.; Unigwe, C.O.; Egbueri, J.C. Testing the performances of different fuzzy overlay methods in GIS-based landslide susceptibility mapping of Udi Province, SE Nigeria. CATENA 2023, 220, 106654. [Google Scholar] [CrossRef]
- Tangestani, M.H. Landslide susceptibility mapping using the fuzzy gamma approach in a GIS, Kakan catchment area, southwest Iran. Aust. J. Earth Sci. 2004, 51, 439–450. [Google Scholar] [CrossRef]
- Sehler, R.; Li, J.; Reager, J.; Ye, H. Investigating Relationship Between Soil Moisture and Precipitation Globally Using Remote Sensing Observations. J. Contemp. Water Res. Educ. 2019, 168, 106–118. [Google Scholar] [CrossRef]
- Hansen, M.C.; Potapov, P.V.; Moore, R.; Hancher, M.; Turubanova, S.A.; Tyukavina, A.; Thau, D.; Stehman, S.V.; Goetz, S.J.; Loveland, T.R.; et al. High-Resolution Global Maps of 21st-Century Forest Cover Change. Science 2013, 342, 850–853. [Google Scholar] [CrossRef]
- Nicholson, S.E.; Farrar, T.J. The influence of soil type on the relationships between NDVI, rainfall, and soil moisture in semiarid Botswana. I. NDVI response to rainfall. Remote Sens. Environ. 1994, 50, 107–120. [Google Scholar] [CrossRef]
- Al-hasn, R. Studying Correlation between Precipitation and NDVI/MODIS for Time Series (2012–2022) in Arid Region in Syria. Environ. Sci. Proc. 2024, 29, 58. [Google Scholar] [CrossRef]
- Ghebrezgabher, M.G.; Yang, T.; Yang, X.; Eyassu Sereke, T. Assessment of NDVI variations in responses to climate change in the Horn of Africa. Egypt. J. Remote Sens. Space Sci. 2020, 23, 249–261. [Google Scholar] [CrossRef]
- Zhang, H.; Chang, J.; Zhang, L.; Wang, Y.; Li, Y.; Wang, X. NDVI dynamic changes and their relationship with meteorological factors and soil moisture. Environ. Earth Sci. 2018, 77, 582. [Google Scholar] [CrossRef]
- Santoso, A.; Mcphaden, M.J.; Cai, W. The Defining Characteristics of ENSO Extremes and the Strong 2015/2016 El Niño. Rev. Geophys. 2017, 55, 1079–1129. [Google Scholar] [CrossRef]
- Reddy, P.J.; Perkins-Kirkpatrick, S.E.; Ridder, N.N.; Sharples, J.J. Combined role of ENSO and IOD on compound drought and heatwaves in Australia using two CMIP6 large ensembles. Weather. Clim. Extrem. 2022, 37, 100469. [Google Scholar] [CrossRef]
- Bhardwaj, J.; Kuleshov, Y.; Chua, Z.-W.; Watkins, A.B.; Choy, S.; Sun, Q. Building Capacity for a User-Centred Integrated Early Warning System for Drought in Papua New Guinea. Remote Sens. 2021, 13, 3307. [Google Scholar] [CrossRef]
- Broughton, B. Evaluation of Australia’s Response to El Niño Drought and Frosts in PNG 2015-17. 2017. Available online: https://www.dfat.gov.au/sites/default/files/evaluation-of-australias-response-to-png-el-nino-drought-2015-2017.pdf (accessed on 28 May 2025).
- The Pacific Region: ECHO Factsheet. Press Release. 2016. Available online: https://reliefweb.int/report/world/echo-factsheet-pacific-region-september-2016 (accessed on 28 May 2025).
- Fox, L. Vanuatu Drought: Toddler’s Death Believed to be Country’s First Fatality Linked to Worsening Crisis; Australian Broadcasting Company: Ultimo, Australia, 2015; Available online: https://www.abc.net.au/news/2015-09-23/drought-toddler-dies-from-severe-diarrhoea-in-vanuatu/6796808 (accessed on 28 May 2025).
- Auer Frege, I.; Befus, E.; Ben Bih, K.; Fawwad, M.; Ide, T.; Kiefer, M.; Kienzl, P.; Klüppel, D.; Korte, L.; Kortendieck, M.; et al. World Risk Report; Bündnis Entwicklung Hilft Institute for International Law of Peace and Armed Conflict: Bochum, Germany, 2024; Available online: https://weltrisikobericht.de/worldriskreport/#downloads (accessed on 28 May 2025).
- 2015 El Niño IS Now Well Established: Prepare for Drought; OCHA: New York, NY, USA, 2015; Available online: https://reliefweb.int/report/vanuatu/2015-el-ni-o-now-well-established-prepare-drought#:~:text=The%20Climate%20Division%20of%20the,until%20first%20quarter%20of%202016 (accessed on 28 May 2025).
- ASIA-PACIFIC REGION: Overview of El Niño Impact and Responses(as of June 2016); OCHA: New York, NY, USA, 2016; Available online: https://reliefweb.int/report/mongolia/asia-pacific-region-overview-el-ni-o-impact-and-responses-june-2016 (accessed on 28 May 2025).
- Gan, X.; Fernandez, I.C.; Guo, J.; Wilson, M.; Zhao, Y.; Zhou, B.; Wu, J. When to use what: Methods for weighting and aggregating sustainability indicators. Ecol. Indic. 2017, 81, 491–502. [Google Scholar] [CrossRef]
- Saha, S.; Barnali, K.; Chandra, P.G.; Kaustuv, M.; Biswajeet, P.; Abhirup, D.; Nizam, A.M.K.; Alamri, A.M. Spatial assessment of drought vulnerability using fuzzy-analytical hierarchical process: A case study at the Indian state of Odisha. Geomat. Nat. Hazards Risk 2021, 12, 123–153. [Google Scholar] [CrossRef]
- Oyounalsoud, M.S.; Abdallah, M.; Gokhan Yilmaz, A.; Siddique, M.; Atabay, S. A new meteorological drought index based on fuzzy logic: Development and comparative assessment with conventional drought indices. J. Hydrol. 2023, 619, 129306. [Google Scholar] [CrossRef]
- Liu, X.; Yu, S.; Yang, Z.; Dong, J.; Peng, J. The first global multi-timescale daily SPEI dataset from 1982 to 2021. Sci. Data 2024, 11, 223. [Google Scholar] [CrossRef]
- He, Y.; Xie, Y.; Liu, J.; Hu, Z.; Liu, J.; Cheng, Y.; Zhang, L.; Wang, Z.; Li, M. Generation of 1 km high resolution Standardized precipitation evapotranspiration Index for drought monitoring over China using Google Earth Engine. Int. J. Appl. Earth Obs. Geoinf. 2024, 135, 104296. [Google Scholar] [CrossRef]
- Peters, A.J.; Walter-Shea, E.; Ji, L.; Viña, A.; Hayes, M.; Svoboda, M. Drought monitoring with NDVI-based Standardized Vegetation Index. Photogramm. Eng. Remote Sens. 2002, 68, 71–75. [Google Scholar]
- Kogan, F.N. Application of vegetation index and brightness temperature for drought detection. Adv. Space Res. 1995, 15, 91–100. [Google Scholar] [CrossRef]
- Sannier, C.A.D.; Taylor, J.C.; Du Plessis, W.; Campbell, K. Real-time vegetation monitoring with NOAA-AVHRR in Southern Africa for wildlife management and food security assessment. Int. J. Remote Sens. 1998, 19, 621–639. [Google Scholar] [CrossRef]
- Oyounalsoud, M.S.; Yilmaz, A.G.; Abdallah, M.; Abdeljaber, A. Drought prediction using artificial intelligence models based on climate data and soil moisture. Sci. Rep. 2024, 14, 19700. [Google Scholar] [CrossRef]
- Xu, X.; Chen, F.; Wang, B.; Harrison, M.T.; Chen, Y.; Liu, K.; Zhang, C.; Zhang, M.; Zhang, X.; Feng, P.; et al. Unleashing the power of machine learning and remote sensing for robust seasonal drought monitoring: A stacking ensemble approach. J. Hydrol. 2024, 634, 131102. [Google Scholar] [CrossRef]
- Nwayor, I.J.; Robeson, S.M. Exploring the relationship between SPI and SPEI in a warming world. Theor. Appl. Climatol. 2024, 155, 2559–2569. [Google Scholar] [CrossRef]
- Christian, J.I.; Hobbins, M.; Hoell, A.; Otkin, J.A.; Ford, T.W.; Cravens, A.E.; Powlen, K.A.; Wang, H.; Mishra, V. Flash drought: A state of the science review. WIREs Water 2024, 11, e1714. [Google Scholar] [CrossRef]
Disclaimer/Publisher’s Note: The statements, opinions and data contained in all publications are solely those of the individual author(s) and contributor(s) and not of MDPI and/or the editor(s). MDPI and/or the editor(s) disclaim responsibility for any injury to people or property resulting from any ideas, methods, instructions or products referred to in the content. |
© 2025 by the authors. Licensee MDPI, Basel, Switzerland. This article is an open access article distributed under the terms and conditions of the Creative Commons Attribution (CC BY) license (https://creativecommons.org/licenses/by/4.0/).