Article

Strengthening Agricultural Drought Resilience of Commercial Livestock Farmers in South Africa: An Assessment of Factors Influencing Decisions

1
Department of Agricultural Economics, University of the Free State, 205 Nelson Mandela Drive, Agriculture Building, P.O. Box 39, Internal Box 58, Bloemfontein 9300, South Africa
2
Red Meat Producers Organization, 2 Quintin Brand St, P.O. Box 132, Persequor Park, Pretoria 0020, South Africa
*
Author to whom correspondence should be addressed.
Climate 2025, 13(8), 154; https://doi.org/10.3390/cli13080154
Submission received: 23 May 2025 / Revised: 4 July 2025 / Accepted: 21 July 2025 / Published: 22 July 2025

Abstract

In order to fulfil SDG 13—taking urgent action to combat climate change and its impact—SDG 2—ending hunger and poverty—and the African Union CAADP Strategy and Action Plan: 2026–2035, which’s goal is ending hunger and intensifying sustainable food production, agro-industrialisation, and trade, the resilience of commercial livestock farmers to agricultural droughts needs to be enhanced. Agricultural drought has affected the economies of many sub-Saharan African countries, including South Africa, and still poses a challenge to commercial livestock farming. This study identifies and determines the factors affecting commercial livestock farmers’ level of resilience to agricultural drought. Primary data from 123 commercial livestock farmers was used in a principal component analysis to estimate the agricultural drought resilience index as an outcome variable, and the probit model was used to determine the factors influencing the resilience of commercial livestock farmers in the Northern Cape Province of South Africa. This study provides a valuable contribution towards resilience-building strategies that are critical for sustaining commercial livestock farming in arid regions by developing a formula for calculating the Agricultural Drought Resilience Index for commercial livestock farmers, significantly contributing to the pool of knowledge. The results showed that 67% of commercial livestock farming households were not resilient to agricultural drought, while 33% were resilient. Reliance on sustainable natural water resources, participation in social networks, education, relative support, increasing livestock numbers, and income stability influence the resilience of commercial livestock farmers. It underscores the importance of multidimensional policy interventions to enhance farmer drought resilience through education and livelihood diversification.

1. Introduction

Livestock production is an integral part of agricultural activities globally, and it plays a vital role in nutrition provision by providing 17% of all kilocalorie consumption and 33% of all protein consumption [1]. Livestock production further contributes to the livelihoods of over one billion low-income people globally by providing a source of food, leather and fur, fertiliser, nutrient cycling for soils, traction power, medicine, and other raw materials for different populations [2]. With the world population projected to rise from 7.9 billion to approximately 9.2 billion people by 2050, the livestock industry is constantly under pressure, and the demand for livestock products is increasing quickly [3].
South African livestock production has enormous potential to reduce food insecurity and poverty. Currently, the industry contributes approximately 46% of the overall agricultural output and employs approximately 500,000 people nationwide [4]. The demand for livestock products will also rise due to dietary changes, rising incomes, and urbanisation in developing nations like South Africa [5]. Livestock farmers must satisfy the rising demand for animal products. However, because their production systems depend on several environmental factors, droughts and the intensity of recurrent agricultural droughts limit the farmers’ ability to increase production [6,7].
Agricultural drought, ranked among the worst natural disasters that can happen, affects the livelihood and welfare of most people in developing countries [5,7,8,9,10]. A rough estimate of 590,000 km2 of South African agricultural lands used for livestock production was negatively impacted by agricultural drought, severely harming pastureland and increasing animal mortality in most South African provinces [4].
The agricultural output in South Africa fell by 9.2% in the first half of 2018 due to the severe drought. Over 37% of South Africa’s rural population was affected by the drought, dubbed the worst in 100 years [11]. About 10,000 farms with a capacity of 166,000 livestock units in South Africa’s Northern Cape Province were impacted by this drought [12].
Most (68.6%) of South African agricultural land is used for extensive livestock grazing [4]. In the Northern Cape, about 33.8 million hectares comprise agricultural land, with approximately 86% of the land used for grazing [4]. The province had experienced the worst drought in more than a century. It was declared a disaster region by the National Disaster Management Centre due to the drought that commenced in 2018 [13]. A lack of adoption strategies contributed to the severity of the drought [14,15].
Without appropriate measures, agricultural drought will likely reduce livestock producers’ livelihoods and production in the Northern Cape and throughout South Africa [16]. To minimise the harmful effects of the agricultural drought on commercial livestock farmers and enhance the agribusiness sector, it is crucial to assess agricultural drought resilience and identify and determine the factors affecting commercial livestock farmers’ level of resilience to agricultural drought, which have not yet been the subject of any scientific studies. Resilience is the ability of communities and complex socio-ecological systems to learn, cope, adapt, and transform in the face of shocks and pressures. This is one aspect of social system dynamics that is linked to resilience [17]. The goal of resilience is to increase one’s capacity to carry on down a specific developmental route in the face of change that is both gradual and rapid, anticipated and unexpected. It involves changing, enhancing, and innovating along that course [18].
Existing international and national studies by Lottering et al. [19], Holman et al. [20]. Algur et al. [21], Matlou et al. [22], Mare et al. [23], Chen et al. [24], and Bahta and Myeki [12] have studied the effects of the agricultural drought and the response to it, the effects of the drought on livelihoods, the impacts of the drought on the welfare of smallholder livestock farmers, the effects of the drought on the productivity of smallholder farmers, and the effects of the drought on the livelihoods of smallholder farmers. However, most of the studies focused on smallholder farmers, and those focused on commercial livestock farmers explored only the impact of drought. As far as the author knows, no studies have been conducted on assessing agricultural drought resilience and identifying and determining factors affecting commercial livestock farmers’ level of resilience to agricultural drought and its implications for agribusiness in South Africa. More specifically, this study developed a formula for calculating the Agricultural Drought Resilience Index (ADRI) for commercial livestock farmers, significantly contributing to the pool of knowledge.
This study aims to provide a general answer to the following research questions: “What is the extent to which commercial livestock farmers are resilient or not to agricultural drought?” and “What are the key factors that hinder or enhance the resilience of commercial livestock farmers to agricultural drought in South Africa’s Northern Cape Province?” This study will be instrumental as it will provide input for policymakers in creating effective policy interventions to increase commercial livestock resilience to agricultural drought exposures, which pose a threat to their way of life, their ability to produce food, their agribusiness, and their capacity to survive, learn, cope, adapt, and change in the face of agricultural drought shocks and pressures.

2. Materials and Methods

2.1. Study Area

The study was conducted in a part of the Northern Cape Province, South Africa. The Northern Cape Province is the largest of South Africa’s nine provinces and covers an area of 372,889 km2 with a population of approximately 1,193,780. The province is divided into five district municipalities: Namakwa (126,900 km2), Pixley Ka Seme (103,500 km2), ZF Mgcawu (102,500 km2), John Taolo Gaetsewe (27,300 km2), and Frances Baard (12,800 km2), and is further subdivided into 26 local municipalities.
Namibia and Botswana border the province to the north and the northwest, Free State, Eastern Cape, and Western Cape provinces border it to the east and south. The cold Atlantic Ocean forms the province’s western boundary.
The Vegetation Condition Index (VCI) 2019, compiled using 23 years of data, revealed that the drought was the most severe in the Northern Cape Province’s central, southern, and western parts [25]. Regarding vegetation, three broad areas fall in this region: Namakwa, Great Karoo, and Green Kalahari. The area comprises the Namakwa District Municipality (Namakwa region), part of the ZF Mgcawu District Municipality, or more specifically, the Kai! Garib and Kheis local municipalities (Green Kalahari Region), and part of the Pixley ka Seme District Municipality, or specifically the Siyathemba, Kareeberg, Emthanjeni, and Ubuntu local municipalities (Great Karoo region). Figure 1 shows the study area with the three districts and 12 local municipalities.
The climate of the Northern Cape is typical of desert and semi-arid regions. This is a sizable, arid area with variable topography and temperature. Thunderstorms reverberate throughout the vast plains in the eastern summer rainfall regions, and intense lightning strikes the earth. The average annual precipitation in the province varies between district municipalities and ranges from only 50 mm to 400 mm per year. The midday highs in January typically range from 34 °C to 40 °C. Summertime highs frequently exceed 40 °C, with an all-time high of 47.8 °C registered along the Orange River in 1939 [27].

2.2. Research Approach

A multistage sampling procedure was used for the study. The Northern Cape Province was purposefully selected for the initial stage since it is one of South Africa’s primary livestock-producing provinces and one of South Africa’s most severely drought-impacted areas. The second stage involved random sampling of selected district municipalities using balloting.
According to Stats SA [28], 302 Value Added Tax (VAT)-registered commercial livestock farmers were in the study area. A simple random sampling method was used to determine the statistical population. Of the 302 commercial livestock producers, 123 were chosen using the simple random sampling formula of Cochran [29] and Barlett et al. [30].
The correct sample size was determined using Cochran’s [29] sample size formula (Equation (1)):
S a m p l e   s i z e = q 2 z ( r ) ( w ) 2
where “q” is the level of confidence/alpha level (the value for the selected alpha level indicates the level of risk the researcher is willing to take so that the actual margin of error may exceed the acceptable margin of error); (z) (r): “z” and “r” are the estimate of the variance in the population; the estimate of variance is calculated as = 0.25 (maximum possible proportion (0.5) × 1-maximum possible proportion (0.5) produces maximum possible sample size); and “w” is the acceptable margin of error for the proportion being estimated = 0.05 (5%) (error the researcher is willing to accept).
If this formula was applied to the study and an alpha level of 1.28 (0.20) was obtained, the estimated variance of 0.5 and an error level of 0.05 were used; then, the formula would be as follows (Equation (2)):
S a m p l e   s i z e = 1.28 2 0.5 0.5 0.05 2
Sample size = 164 (resulting in a sample size of 164 respondents)
As mentioned above, there were 302 registered commercial livestock farmers. Applying this formula (Equations (3) and (4)) revealed that a sample size of 164 would represent 54% of the total population and that it requires applying Cochran’s [29] formula.
N 1 = S a m p l e   s i z e 1 + ( N 0 / p o p u l a t i o n )
N 1 = 164 1 + ( 164 / 302 )
N1 = 106
Therefore, the researcher in this study needed to interview 106 commercial livestock farmers. However, the study obtained complete sets of questionnaires from 123 participants, and all the questionnaires were used.
Primary data were collected from these identified commercial farmers using structured questionnaires given to them via various methods, which included going to farmers’ associations and conducting face-to-face interviews. The data was collected from August 2023 until October 2024. The Research Ethics Committee approved ethical clearance for the protocol in accordance with the General/Human Research Ethics (GHREC) guidelines and regulations of the University of the Free State, reference number UFS-HSD2023/0373/3. Participants took part voluntarily after the ethical principles were publicly declared. All participants were informed, and they completed and signed a consent form before actively participating in the study.

2.3. Conceptual Framework

The conceptual framework in Figure 2 models agricultural drought resilience from a socio-ecological system (SES) perspective, based on resilience theory [31,32]. Resilience is defined as the ability of commercial livestock farming systems to withstand disturbances by maintaining their essential functions during drought, adapt to stressors through strategy adjustments to lessen impacts, and innovate to achieve sustainable practices when current systems break down [31]. This framework combines socio-economic, institutional, farm-specific, environmental, and drought response strategies that together influence resilience outcomes for livestock farmers, measured via the Agricultural Drought Resilience Index (ADRI). Guided by Béné et al. [33] and Bahadur et al. [34], the choice of variables was based on their demonstrated roles in enhancing resilience, covering absorptive, adaptive, and transformative capacities. Socio-economic factors like age, education, and marital status affect risk perception, learning, and decision-making flexibility; access to credit and income changes during drought periods serve as financial buffers to absorb shocks, representing human capital for adaptive capacity [8]. Institutional factors such as cooperatives, government support, and farmers’ social networks promote knowledge-sharing, subsidies, collective resource pooling, and social safety nets, embodying governance and networks for adaptive and transformative capacities [12,22]. Farm-specific factors, including livestock numbers and farm experience, indicate production-system resilience, reflecting the ability to buffer losses. Environmental aspects such as access to alternative and sustainability of water sources during droughts underpin the ecological basis for absorptive capacity [22]. Drought response strategies such as feed banks, farm diversification, conservation agriculture adoption, and livestock breed improvement align with resilience-building pathways, demonstrating agency in adaptive and transformative capacities.

2.4. Empirical Model for Estimating Resilience of Commercial Livestock Farmers

2.4.1. Agricultural Drought Resilience Index (ADRI)

ADRI was calculated as an outcome variable. Principal Components Analysis (PCA) was applied to determine factors influencing commercial livestock farmers’ resilience. PCA aggregated four production and financial stability-related indicators into the ADRI. PCA is a method used to reduce a large set of variables to smaller variables, considering the variance of the original data or variables collected through the survey [35]. All statistical analysis was performed using StataSE 17 and SPSS 23. Characterisation of the study variables was performed using descriptive methods, using central tendency and dispersion measures.
The calculation of ADRI was informed by the process adopted by Walsh-Dilley et al. [31]. This was performed in four steps: (i) selecting resilience indicators, (ii) normalising/standardising the selected indicators, (iii) creating weights, and (iv) aggregating the final resilience index where weights were assigned based on PCA according to the proportion of variance explained by each indicator/variable. The four indicators/variables were livestock produced by commercial farmers in a normal year (CPN), livestock produced by commercial farmers with agricultural drought (CPD), the number of months commercial farmers were financially stable in a normal year (CFN), and the number of months commercial farmers were financially stable in a year with agricultural drought (CFD). ADRI was calculated using Equation (5):
A D R I = W n C P N + W d C P D + W n C F N + W d C F D
where W represents the weighted average.

2.4.2. Determining the Factors That Affect Commercial Livestock Farmers’ Resilience

A probit regression procedure was applied to establish the factors that influence the resilience of commercial livestock farmers to agricultural drought in the Northern Cape Province. This analytical method has been utilised by several researchers [8]. According to Walsh-Dilley et al. [36], the Resilience Framework emphasises understanding and enhancing the capacity of local communities to address, negotiate, and transform shocks. This approach aims to prevent disturbances from triggering a downward spiral while potentially creating opportunities for improvement.
The Probit Model is known to be appropriate when the dependent variable is binary, as in this case of agricultural drought resilience (resilient or not resilient, as determined by ADRI being greater than zero or less than zero, respectively). The choice of the model was guided by an underlying assumption that resilience to agricultural drought is influenced by a latent or unobservable variable, representing the propensity of resilience, which depends on various socio-economic, farm-specific, institutional, environmental, and adaptive factors.
Thus, let Y* be an unobservable latent variable representing the agricultural drought resilience of a commercial livestock farmer, where higher values reflect higher resilience. As indicated in Equation (6), the latent variable Y* depends on a vector of explanatory variables X and a random error term ε capturing the unobserved effects. The theoretical/implicit model can be expressed as follows:
Y = X β + ε  
where X is a vector of explanatory variables, β is a vector of estimated coefficients, and ε follows a standard normal distribution. Given Y is latent, the binary outcome variable is Y, and the equation is expressed as follows:
Y = 1   i f   Y > 0 0   i f   Y 0
The probability that Y = 1 (a commercial livestock farmer is resilient) is achieved by the cumulative distribution function of the standard normal distribution ( Φ ).
P Y = 1 X = P Y > 0 X = Φ ( X β )
Assuming an identically and independently distributed (iid) sample of commercial livestock farmers, the joint density or likelihood function used in the estimation is as follows:
L = Π i n f i
Taking the logarithm obtained, the log-likelihood function is as follows:
log L = i log f i = i y i log p i + 1 y i log 1 p i
The explicit empirical model for the Probit model estimation is specified as follows:
P Y i = 1 X i = β 0 + β 1 X 1 + β 2 X 2 + β 3 X 3 + β 4 X 4 + .   β 11 X 11 + ε i
Y i = β 0 + β 1 A g e + β 2 G e n d e r + β 3 M a r i t a l   s t a t u s + β 4 F u n d i n g + β 5 R e l a t i v e   a s s i s t a n c e + β 6 C r e d i t   a c c e s s + β 7 C C L L + β 8 G o v A s s + β 9 T S o u r c e + β 10 N A s s + β 11 S o c i a l   n e t w r k + β 12 C s t r a t e g y + β 13 A S t r a t e g y + β 14 D S t r a t e r g y + β 15 E S u p p + β 16 G O V I + β 17 18 F E X P + β 18 19 E D U C + β 19 20 D R + β 20 21 S u s + β 21 22 H M + β 22 23 R S u p + ε i
Table 1 summarises the variables with descriptions and expected signs.

3. Results

3.1. Descriptive Statistics of Socio-Economic Characteristics of the Respondents

Table 2 presents the socioeconomic characteristics of the respondents. Commercial livestock farming is dominated by males (98.4%), with female household heads only accounting for 1.6%. Most (89%) of commercial livestock farmers were married, 8.9% were single household heads, and only one farmer was widowed or divorced. In terms of education, the majority were graduates, with 49% having a graduate qualification, while 18% had postgraduate qualifications. Otherwise, 26.8% of farming households surveyed completed Grade 12, while only 6.5% did not complete Grade 12. In total, 93.5% indicated that farming is their principal occupation, showing their strong commitment to agriculture and highlighting that it is their primary source of livelihood. Alarming is, however, the fact that 66.7% of farmers indicated that they are also formally employed in a secondary occupation, showing that farming alone is not enough to sustain their livelihoods.
Table 3 presents the descriptive statistics of the respondents. The surveyed farmers were observed to have an average age of 52, with a median age of 54 years, reflecting a slight deviation from the mean. The standard deviation of 12.653 indicates a moderate level of variability in the age of household heads, reflecting a diverse age range. The overall age span is 60 years, with a minimum age of 24 and a maximum age of 84. Having younger and older farmers uncovers varying vulnerability and adaptability to drought.
Household composition shows that the livestock farms had an average of two and a median of three household members. Again, there is some variation given the standard deviation of 1.412 and a range of seven, with some households having only one member and some a maximum of seven members. Large households can add to manpower for farm operations; however, it can also be a downside as it increases consumption/expenditures, thus elevating food security risks during drought periods. Surveyed households were observed to have a median of two female members and one male member.

3.2. Farm Characteristics

Table 4 presents the farm characteristics related to farming experience and the number of livestock owned before and after drought periods for commercial livestock farmers. The table shows that livestock farmers had an average of 27.8 years of experience in farming, with a median of 29.5 years. This reflects that surveyed farmers have accumulated almost three decades of experience in commercial livestock farming on average. The standard deviation of 12 shows considerable variation in experience, with a minimum of three and a maximum of 58 years of accumulated experience. This can contribute significantly to resilience, as experienced farmers are better equipped to manage risks associated with agricultural drought.
Agricultural droughts are known to result in significant livestock losses due to deteriorating pastures, high feed costs, weight loss of animals, and ultimately, livestock sale or even death. In this study, before the onset of the drought, livestock farmers recorded an average sheep flock number of 2041 heads, with a median number of 1300 heads, suggesting that about half of livestock farmers owned less than 1300 heads of sheep, while a few had larger flocks. Sheep are also the most prominent livestock species owned by most commercial livestock farmers in the province. After the drought, the average number of sheep per farm dropped to 1344 heads, with a median of 800 heads. This reflects a significant loss experienced due to drought, elevating commercial livestock farmers’ risks and vulnerability.
Before the drought, about 49 of the surveyed farmers owned an average of 111 goats with a median number of 65 heads, which shows that goats represent a small proportion of the livestock population owned/reared by the livestock farmers. After the drought, the number of goats declined to an average of 97 heads per farm and a median of 40 heads. The standard deviation of 171 shows variability, with some livestock farmers losing all their goats and others maintaining larger herds.
Regarding the cattle herds, before the drought, on average, livestock farmers had 171 cattle per farm, with a median number of 75 heads and a maximum of 1000, reflecting large-scale cattle farming with substantial variation (standard deviation of 238 heads). After the drought, the average number of cattle declined to 99 heads, with a median number of 40 cattle. The standard deviation is lower at 123 heads, indicating that the drought significantly impacted the cattle population.
Drought conditions significantly impacted the livestock populations of small and large game animals. Before the drought, the average number of small game animals per livestock farmer was 123 heads. Still, there was considerable variability among farmers, with some having as many as 1100 small game animals. After the drought, the average number of small game animals declined to 71 heads, with a median of 20 heads and a standard deviation of 147 heads. The maximum number recorded post-drought was 700 heads, indicating a substantial reduction in small game numbers.
In contrast, the average number of large game animals per farm was 56 heads before the drought, with some farmers reporting as many as 500 large game animals. This also showed a high standard deviation of 99 heads, reflecting significant differences among farmers. After the drought, the average number of large game animals fell to 28, with a standard deviation of 39 and a maximum of 100. This data illustrates that many large game farmers suffered substantial losses due to the drought.
Before the drought, the average total livestock population per farm was 3112 animals, with significant variability (a standard deviation of 2335) and a median of 1400. This indicates that while some farmers operated large commercial farms, many had smaller herds. After the drought, the average herd size declined to 1375 animals, with a standard deviation of 1734 and a range from 0 to 10,100. This reflects that some farmers lost all their livestock while others suffered less. It should be noted that none of the farmers could increase their animal numbers or expand their farming operations during the drought. Everyone lost something, and there were no gains.

3.3. Results from the Empirical Model

This subsection presents the results from the empirical analysis of the ADRI and the Probit Model.

3.3.1. Agricultural Drought Resilience Index (ADRI)

Table 5 shows the correlation matrix of variables utilised when constructing ADRI. The highest correlation exists (0.722) between commercial livestock production in a normal year and commercial livestock production in a drought year. A moderate correlation existed between months a farmer is financially stable in a drought year (CFD) and months a farmer is financially stable in a normal year (CFD) (0.343).
Bartlett’s Test of Sphericity was conducted to evaluate the suitability of the data for PCA. This test examines the hypothesis that the variables used in PCA are not intercorrelated. Table 6 presents the results of Bartlett’s Test of Sphericity. The findings indicate an approximated chi-square value of 334.674 with 6 degrees of freedom, with the null hypothesis, stating that the intercorrelation matrix is an identity matrix, rejected. This suggests that the variable reduction is inappropriate, as the intercorrelation matrix does not stem from a population. Since the observed intercorrelations resulted from sampling error, the variables are sufficiently correlated to justify the application of PCA.
Kaiser–Meyer–Olkin’s (KMO) measure of sampling adequacy was also employed to assess the suitability of Principal Component Analysis (PCA). The results indicated a KMO value of 0.5, which meets the threshold for appropriateness. A higher KMO value suggests a significant degree of shared variance among the variables, indicating that PCA will likely yield components that explain a substantial amount of variance. Therefore, the dataset met all the requirements for both the KMO and Bartlett’s Test of Sphericity, confirming its suitability for dimension reduction through PCA.
Table 7 presents the results of the unrotated PCA. Each variable has been standardised to have a mean of zero and a variance of one. The total variance to be explained across the four variables is 4. A variable is helpful if it accounts for more than one unit of variance, corresponding to an eigenvalue greater than one. The first principal component explains approximately 44% of the total variance, while the second, third, and fourth components account for 33%, 16%, and 7%, respectively.
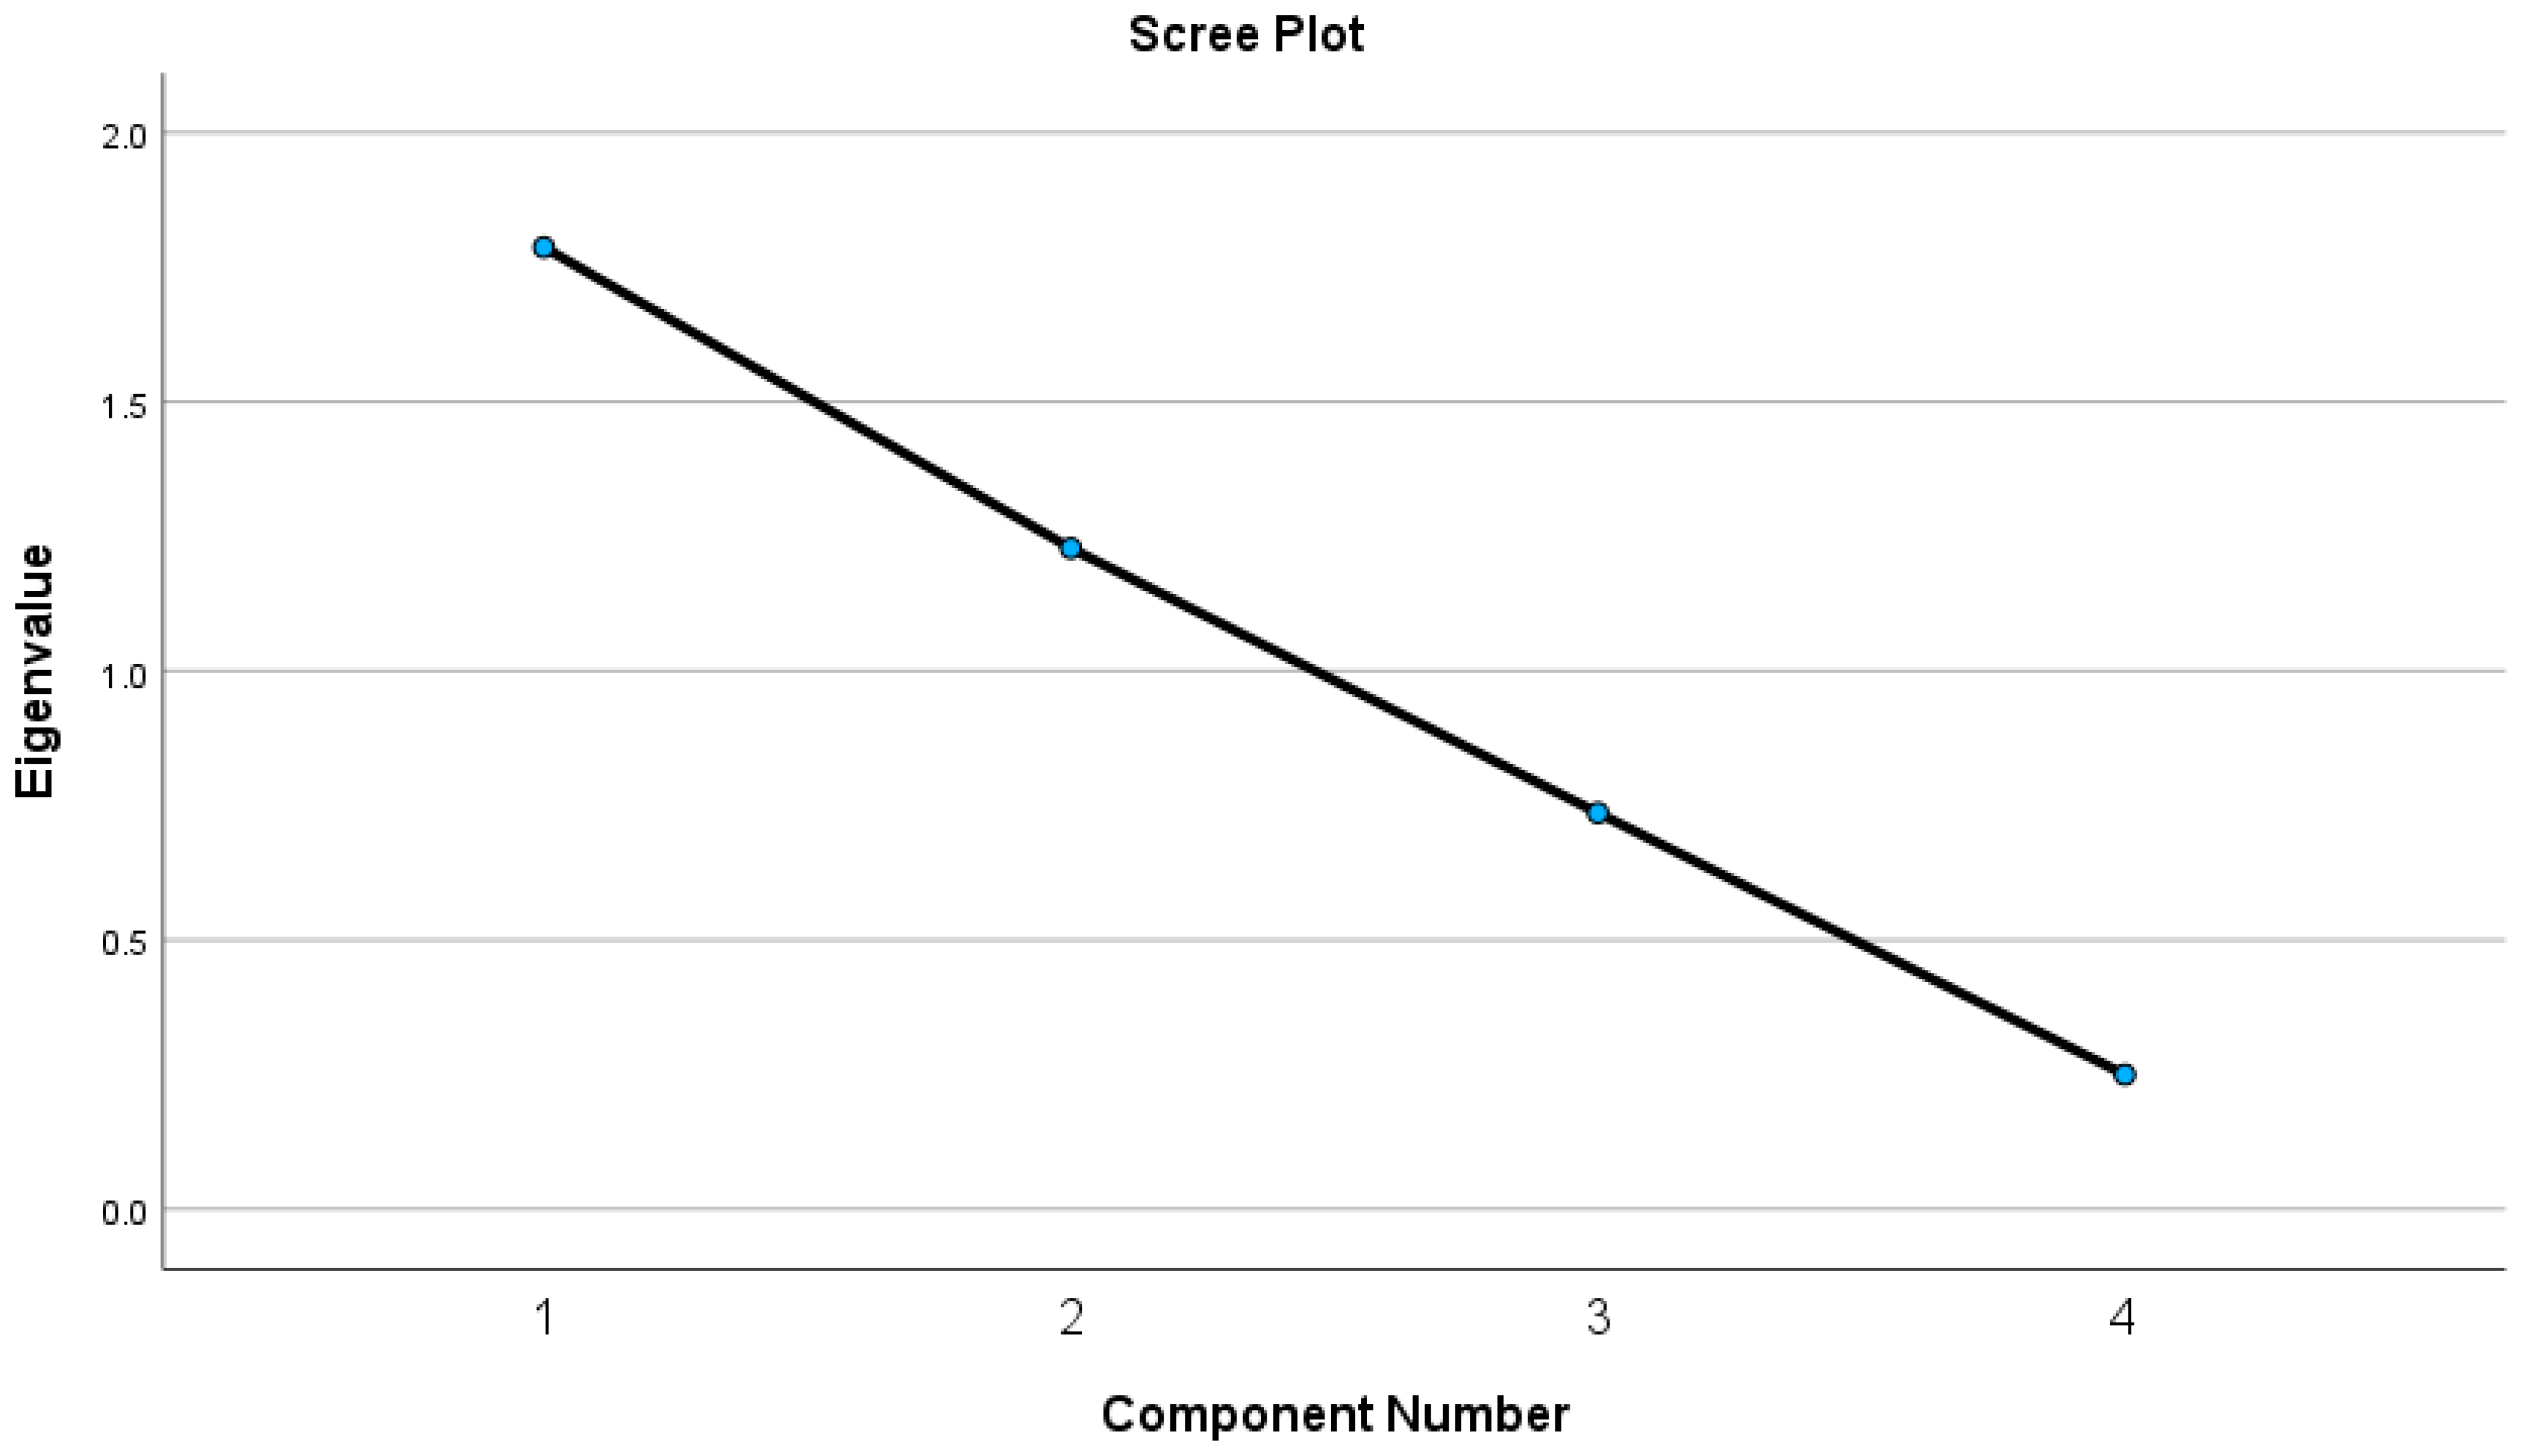
Components were compared to prior expectations to choose the variable for constructing the ADRI. It is imperative to obtain the eigenvectors to select the variable to be used. The study used the Kaiser criterion (eigenvalue > 1) to determine the number of factors to retain. The scree plot in Appendix A, Figure A1, shows the eigenvalues of each component. The communalities for each variable retained in the PCA were obtained based on the first two principal components, which explain over 77% of the total variance (see Table A1 in the Appendix A). Table 8 presents the value for the intersection of each variable and component that represents the eigenvector or component loadings. The first and second principal components were used to construct the ADRI.
Table 9 shows the ADRI for commercial livestock farmers in the study area. The resilience index for the average household was calculated at 0.000016, indicating that commercial livestock farming households in the Northern Cape Province are marginally resilient to agricultural drought. This implies that, on average, commercial livestock farmers have a minimal buffer against agricultural drought impacts, which could be sufficient to avoid significant vulnerability but lacks proactive long-term resilience. The results show that 67% of these households were not resilient to agricultural drought, while the remaining 33% were resilient. These findings suggest that most commercial livestock farmers do not have adequate strategies and resources to help mitigate the adverse effects of agricultural drought. This lack of resilience is concerning, especially considering that drought conditions are expected to continue or worsen due to climate change. The consequences are complex and far-reaching.

3.3.2. Probit Model

The coefficient/parameter estimates of the Probit Model, as presented in Table 10, quantify the effect of each explanatory variable on fluctuations in the dependent variable (ADRI).
P-values were utilised to assess the importance of each explanatory variable’s effect on the response variable. Out of the 21 variables incorporated in the model, only eight explanatory variables proved significant. These include gender, educational attainment of Grade 12, presence of relative support, livestock numbers in normal years, livestock numbers in typical drought years, income fluctuations, capacity to maintain natural resources (indicated by the use of natural water sources during drought), and participation in social networks.
The model had a Pseudo R2 of 0.602, reflecting a high model fit to explain variability in drought resilience among commercial livestock farmers as explained by the regressors included. The Wald chi-square test was also significant at 1% (Prob > chi2 = 0.000), suggesting that at least one of the predictors is associated with resilience to agricultural drought. The results from the Probit Model estimation of factors influencing agricultural resilience among commercial livestock farming households revealed that the gender of the household head has a negative coefficient, significant at the 1% level. Specifically, male-headed households are 59% less likely to be resilient to agricultural drought than female-headed commercial livestock farmers. As authors, however, we believe that the data structure skewed this result. Since only two of the 123 household heads were female, the possibility that half or all of the female farmers were more resilient than half of the male farmers is high. Therefore, although statistically significant, we caution against the correctness of this result.
Education was found to significantly affect the agricultural resilience of commercial livestock farmers, given a coefficient of 1.305 and p < 0.06. Farmers with an education level of Grade 12 were more likely to be resilient to agricultural drought than farmers with less education than Grade 12.
The output for the marginal effect of education attainment represents a 0.165 change in the probability of being resilient, which entails that farmers who completed high school (Grade 12) were 17% more likely to be resilient to agricultural drought, holding other variables constant. Being educated with at least high school qualifications plays a significant role in improving decision-making abilities and accessing relevant farm and climate-related information to deal with drought risks. Farmers with more education are more likely to welcome and prioritise training programmes focused on drought-resistant farming methods.
Receiving support from relatives was found to have a positive coefficient of 1.210, which is significant at the 5% level (p < 0.031). This indicates that relative support significantly increases the likelihood of resilience to agricultural drought among commercial livestock farmers. The marginal effects reveal that farmers who received support from relatives during drought were 17% more likely to demonstrate resilience. This relative support is crucial because it allows farmers to access additional resources, such as financial aid, labour, and supplies, which can help mitigate potential losses during drought periods. Furthermore, it provides a support network for commercial farmers who may lack adequate assistance from the government or other institutions.
The variables representing the number of livestock in a typical year and during a drought year were found to be significant. An increase in livestock numbers was associated with a higher likelihood of resilience to agricultural drought (coefficient = 0.001, p < 0.01 for a normal year, and 0.001, p < 0.1 for a drought year). Furthermore, a significant positive relationship was identified between changes in farm income during normal and drought periods and the resilience of commercial livestock farmers (coefficient = 0.005, p < 0.05). The marginal effect suggests that even a slight increase in the income difference between normal and drought years enhances farmer resilience by 0.07%. This finding highlights that maintaining a substantial number of livestock can serve as an asset, enabling farmers to access additional resources such as financial aid to support adaptive strategies, thereby facilitating recovery during drought periods. The positive association indicates that smaller income fluctuations are indicative of greater resilience. This underscores the importance of income diversification strategies to mitigate the impacts of drought-related income volatility.
Furthermore, the availability of alternative water sources during drought conditions was found to have a statistically significant negative coefficient (coefficient = −3.066, p < 0.01). This indicates that commercial livestock farmers who depend on alternative natural water resources during drought periods exhibit a negative association with resilience. This finding contradicts the general expectation that water accessibility would enhance farmers’ capacity to irrigate pastures and thereby improve resilience. The negative coefficient suggests that agricultural drought compromises the sustainability of these water sources, as they become depleted due to excessive use and reduced water levels. Additionally, participation in social networks was observed to decrease resilience to agricultural drought (coefficient = 1.345, p < 0.05). The marginal effects reveal that commercial livestock farmers involved in social networks during drought were 19% less likely to demonstrate resilience to agricultural drought. This outcome also defies expectations, as engagement in social networks, such as farmer unions and other organised agricultural groups, is typically presumed to bolster resilience. We posit that this result may arise from the tendency of less resilient farmers to actively participate in organised agriculture and seek assistance during challenging times. Consequently, this finding exemplifies the post hoc ergo propter hoc fallacy, suggesting that while the results indicate reduced resilience due to social network involvement, the reality may be that high social network involvement is a consequence of low resilience.

4. Discussion

The socio-economic characteristics are not discussed here in detail because they have not been tested; only the variables tested in the model are included in this section. The farming sector in the Northern Cape is observed to be predominantly male-dominated, which has a potential impact on resource access, decision-making, and strategies for building resilience against agricultural drought. Studies by Mare et al. [23] in South Africa have also found that commercial farming is male-dominated, and this gender dynamic influences adaptive choices during drought conditions.
Most household heads were middle-aged and had accumulated farm experience of three decades on average. This is a critical factor in building resilience, as experienced farmers are better at anticipating and mitigating the effects of agricultural drought via strategies adopted/mastered over a long period, while less experienced farmers may be subject to challenges in adapting to changing drought conditions. These findings are also supported by Holden and Quiggin [37] in Malawi, where older farmers may possess a wealth of knowledge but exhibit greater risk aversion; younger farmers may be more inclined to embrace innovative, drought-resistant technologies and practices.
Agricultural drought has exerted a substantial impact on the herd sizes of commercial livestock farmers. This observation aligns with the findings of Mare et al. [23], who also concluded that drought and its associated consequences, such as diseases, have led to a significant reduction in livestock numbers, affecting numerous commercial livestock farmers in South Africa. Nevertheless, livestock farmers possessing larger herd sizes demonstrate greater resilience to drought conditions, as although they may experience losses, those with more animals exhibit enhanced resilience [38].
Generally, farmers adapt and cope with agricultural drought through various strategies. However, choosing drought-tolerant breeds and selling livestock to lower herd size to a manageable number were the more feasible strategies that farmers mostly adopted. Clements et al. [39] and Aliyar and Collins [40] from Afghanistan had similar results, where adopting drought-tolerant breeds, downsizing the herd, and diversifying income sources were among the common adaptive strategies against agricultural drought.
Most commercial livestock farmers, however, were not resilient, which indicates that most commercial livestock farmers do not have adequate strategies and resources to mitigate the adverse effects of agricultural drought. This is an unfavourable scenario, given that drought conditions are expected to continue or worsen due to climate change and will likely deepen their vulnerabilities to severe drought impacts. The consequences are complex and far-reaching. Matlou et al. [22] in South Africa obtained similar results, stating that most farmers were not resilient, given narrow adaptive and coping pathways.
As deduced by the study, being educated with at least a high school education plays a significant role in improving decision-making abilities and accessing relevant farm and climate-related information to deal with drought risks. Farmers with higher education levels are also more likely to welcome and prioritise training programmes focused on drought-resistant farming methods. This study conforms with Ranjan et al. [41] from South India and Tahernejad et al. [42] from Iran, who found that educational attainment influences perceived drought survival among farmers in India while inviting skills and knowledge acquisition specific to drought management.
Relative support significantly increases the likelihood of resilience to agricultural drought among commercial livestock farmers by allowing farmers to access additional resources, such as financial support, labour, and other inputs, which can help mitigate potential losses during drought periods. It further provides a support network for commercial farmers who may lack adequate assistance from the government or other institutions. These findings agree with Bahta and Lombard [18] from South Africa, who demonstrated that social support received from relatives played a key role in increasing drought resilience and improving the welfare of livestock farmers. In contrast, farmers who lacked safety nets during agricultural droughts were less resilient and more vulnerable and susceptible to the impacts of agricultural drought.
Higher livestock numbers in both normal and drought periods were impactful in enhancing resilience towards agricultural drought, as they underline the fact that maintaining a large number of livestock can be reflected as an asset, which can also enable farmers to access other resources like financial aid to support their adaptive strategies, which will consequently help farmers recover in the drought period, which is aligned with the findings of Tommasino et al. [43] in Uruguay.
Livestock farmers who experience smaller fluctuations in income between normal and drought years tend to be more resilient. This highlights the importance of income diversification strategies to help farmers mitigate the impacts of drought-related income volatility. These findings are consistent with the research of Salmoral et al. [44] and Nelson et al. [45] from the UK and USA, which also showed that income increases contribute to greater farmer resilience. Farmers with minimal income variation are better equipped to cope with drought conditions, as stable income supports their long-term sustainability.
Furthermore, commercial livestock farmers who depend on sustainable natural resources, such as water sources during periods of drought, exhibit a negative correlation with resilience, primarily due to the depletion of these resources. This negative relationship arises from the overutilization of natural water sources for animal and pasture irrigation during droughts, which may lead to their exhaustion. Consequently, farmers become increasingly susceptible to drought risks due to their reliance on these vulnerable natural water sources, potentially diminishing their resilience. It is therefore imperative to advocate for immediate measures to conserve natural resources and water sources to ensure their sustainability, as the resilience of farmers to drought will not be enhanced through their over-exploitation. This aligns with the findings of Meaza et al. [46], who demonstrated that catchment restoration initiatives have had positive effects on water resources and drought resilience in Ethiopia.
Engaging in the social networks of farmer organisations was linked to reduced resilience. These findings contrast with those of Dapilah et al. [47] from northern Ghana and Carrico et al. [48] from Sri Lanka, who argue that social networks promote drought resilience. This fact underscores the complex nature of social networks’ effects on farmers’ resilience to drought. It highlights the necessity for a nuanced understanding of how these dynamics play out across different contexts and among various community members.

5. Conclusions

This study created an agricultural drought resilience index to assess how commercial livestock farmers in the Northern Cape province of South Africa can be resilient or withstand agricultural drought. The research identified several key factors influencing the resilience of commercial livestock farming households to agricultural drought.
The findings suggest that the resilience of farming households to agricultural drought is a multidimensional aspect that requires comprehensive intervention. This calls for immediate attention by the government and policymakers to design interventions to assist commercial livestock farmers in severe agricultural drought. Some use the extension officer network; the local government, with different stakeholders, should focus on enhancing educational opportunities, especially in sustainable agriculture and financial literacy, to provide farmers with crucial knowledge for managing droughts. Investing in vocational training or workshops emphasising resilience strategies would be particularly advantageous for younger and less experienced farmers to enhance their agribusiness.
Policymakers and other stakeholders should also promote income diversification among commercial livestock farmers to broaden their income sources and adapt to potential agricultural drought impacts. Encouraging social networks and cooperatives can facilitate resource-sharing, learning, and collective action. Initiatives that support cooperative farming, farmer organisations, and local networks can enhance community-level resilience and encourage knowledge-sharing.
Furthermore, local, provincial, and national governments and policymakers should advocate for conservation practices that protect natural resources, which are vital for resilience. Supporting water management technologies, sustainable grazing systems, and incentivising other adaptive strategies such as rotational grazing, water storage, and feed banks while maintaining stable herd sizes of drought-tolerant breeds can help farmers sustain productivity even during drought conditions.
This study provided insights into the factors that influence the resilience of commercial livestock farming households and their resilience to agricultural drought. However, it is important to acknowledge several limitations to understand the findings better and guide future research. This study focused on commercial livestock farmers in one province of South Africa. Thus, caution is required when applying the findings to other regions. Several factors, such as technological access, social capital, and psychological resilience indicators, also need to be considered in future research, which could deepen understanding of resilience. This study was also based on cross-sectional data between the 2023 and 2024 farming seasons. This limits temporal patterns in resilience that can change over time, thus calling for caution in interpreting resilience and further scrutiny in the future. Changes in income and livestock size during drought could also raise potential endogeneity due to joint determination, raising concerns about reverse causality. While our analysis identifies associations, it does not establish causality. The absence of suitable instrumental variables to address this endogeneity means that the results should be interpreted with caution. This may be a point for further study. Therefore, further study is called for to examine how individual groups (farmer group participation, church groups, family associations, and informal clubs under social networks) might contribute to resilience, as present results contradict the wider literature.

Author Contributions

All authors made a significant contribution to the preparation of the present manuscript. Y.T.B. was the project leader and administrator. He also conceptualised and analysed data and contributed to drafting the article. F.M. aided in the study design, conceptualization, review, and writing of the final draft of the paper. E.M. helped with constructive comments when writing the paper. All authors have read and agreed to the published version of the manuscript.

Funding

This work has been supported by the University of the Free State.

Informed Consent Statement

Ethical clearance for the protocol was approved by the Research Ethics Committee in accordance with the General/Human Research Ethics (GHREC) guidelines and regulations. Reference number UFS-HSD2023/0373/3. Participants took part voluntarily after the ethical principles were publicly declared. All participants were informed, and they completed and signed a consent form before actively participating in the study.

Data Availability Statement

Data will be available on request from the corresponding author (Y.T.B.).

Conflicts of Interest

The authors declare no conflicts of interest.

Appendix A

Figure A1. The screen plot for eigenvalues for each component.
Climate 13 00154 g0a1

Appendix B

Table A1. Communalities.
InitialExtraction
Commercial livestock production in a normal year (CPN)1.0000.875
Commercial livestock production in a drought year (CPD)1.0000.837
The Months a farmer is financially stable in a normal year (CFN)1.0000.611
The Months a farmer is financially stable in a drought year (CFD)1.0000.692

References

  1. Cheng, M.; McCarl, B.; Fei, C. Climate change and livestock production: A literature review. Atmosphere 2022, 13, 140. [Google Scholar] [CrossRef]
  2. Rojas-Downing, M.M.; Nejadhashemi, P.A.; Harrigan, T.; Woznicki, S.A. Climate change and livestock: Impacts, adaptation, and mitigation. Clim. Risk Manag. 2017, 16, 145–163. [Google Scholar] [CrossRef]
  3. Thornton, P.; van de Steeg, J.; Notenbaert, A.; Herrero, M. The impacts of climate change on livestock and livestock systems in developing countries: A review of what we know and what we need to know. Agric. Syst. 2009, 101, 113–127. [Google Scholar] [CrossRef]
  4. Department of Agriculture, Land Reform and Rural Development (DALRRD). Abstract of Agricultural Statistics; Department of Agriculture, Land Reform and Rural Development: Pretoria, South Africa, 2023.
  5. Escarcha, J.F.; Lessa, J.A.; Zander, K.K. Livestock under climate change: A systematic review of impacts and adaptation. Climate 2018, 3, 54. [Google Scholar] [CrossRef]
  6. Benton, T.; Gallani, B.; Jones, C.; Lewis, K.; Tiffin, R.; Donohoe, T. Severe Weather and UK Food Chain Resilience. Food Research Partnership: Resilience of the UK Food System Subgroup; Global Food Security; UK Government Office for Science: London, UK, 2012.
  7. Chikabvumbwa, S.R.; Salehnia, N.; Gholami, A.; Kolsoumi, S.; Mirzadeh, S.J.; Hoogenboom, G. Characterization of hydro-meteorological droughts based on dynamic future scenarios and effective rainfall over Central Malawi. Theor. Appl. Climatol. 2024, 155, 1959–1975. [Google Scholar] [CrossRef]
  8. Banda, T.F.; Phiri, M.A.R.; Mapemba, L.D.; Maonga, B.B. Household Resilience to Drought: The Case Study of Salima District in Malawi; International Food Policy Research Institute (IFPRI) Working Paper no. 14; The International Food Policy Research Institute (IFPRI): Washington, DC, USA, 2016. [Google Scholar]
  9. Rezai, G.; Shamsudin, M.N.; Mohamed, Z. Urban Agriculture: A Way Forward to Food and Nutrition Security in Malaysia. Procedia-Soc. Behav. Sci. 2016, 216, 39–45. [Google Scholar] [CrossRef]
  10. Bouwer, F.G. Mind the Gap; Department of Basic Education: Pretoria, South Africa, 2014.
  11. Department of Agriculture, Land Reform and Rural Development (DALRRAD), Agri SA, AFASA. Drought Update: Provinces’ State of Readiness for 2019/20 Planting Season; Department of Agriculture, Land Reform and Rural Development Agri South Africa and African Farmers’ Association of South Africa: Pretoria, South Africa, 2019.
  12. Bahta, Y.T.; Myeki, V.A. Adaptation, coping strategies and resilience of agricultural drought in South Africa: Implication for the sustainability of livestock sector. Heliyon 2021, 7, e08280. [Google Scholar] [CrossRef] [PubMed]
  13. Myeki, V.A.; Bahta, Y.T. The impact of agricultural drought on smallholder livestock farmers: Empirical evidence insights from Northern Cape, South Africa. Agriculture 2022, 12, 442. [Google Scholar] [CrossRef]
  14. Mfitumukiza, D.; Barasa, B.; Kiggunda, N.; Nyarwaya, A.; Muzei, J.P. Smallholder farmers’ perceived evaluation of agricultural drought adaptation technologies used in Uganda: Constraints and opportunities. J. Arid Environ. 2020, 177, 104137. [Google Scholar] [CrossRef]
  15. Masupha, T.E.; Moeletsi, M.E.; Tsubo, M. Prospects of an agricultural drought early warning system in South Africa. Int. J. Disaster Risk Reduct. 2021, 66, 102–115. [Google Scholar] [CrossRef]
  16. Tambo, J.A. Maize Innovation for Climate Change Adaptation: Insights from Rural Niggeria; Center for Development Research (ZEF): Hammamet, Tunisia, 2013. [Google Scholar]
  17. Bahta, Y.T. Nexus between Coping Strategies and Households’ Agricultural Drought Resilience to Food Insecurity in South Africa. Land 2022, 11, 893. [Google Scholar] [CrossRef]
  18. Bahta, Y.T.; Lombard, W.A. Nexus between Social Vulnerability and Resilience to Agricultural Drought amongst South African Smallholder Livestock Households. Atmosphere 2023, 14, 900. [Google Scholar] [CrossRef]
  19. Lottering, S.; Mafongoya, P.; Lottering, R. Drought and its impacts on small-scale farmers in sub-Saharan Africa: A review. S. Afr. Geogr. J. 2021, 103, 319–341. [Google Scholar] [CrossRef]
  20. Holman, I.P.; Hess, T.M.; Rey, D.; Knox, J.W. A multi-level framework for adaptation to drought within temperate agriculture. Front. Environ. Sci. 2021, 8, 589871. [Google Scholar] [CrossRef]
  21. Algur, K.D.; Patel, S.K.; Chauhan, S. The impact of drought on the health and livelihoods of women and children in India: A systematic review. Child Youth Serv. Rev. 2021, 122, 105909. [Google Scholar] [CrossRef]
  22. Matlou, R.; Bahta, Y.T.; Owusu-Sekyere, E.; Jordaan, H. Impact of agricultural drought resilience on the welfare of smallholder livestock farming households in the northern Cape province of South Africa. Land 2021, 10, 562. [Google Scholar] [CrossRef]
  23. Mare, F.; Bahta, Y.T.; Van Niekerk, W. The impact of drought on commercial livestock farmers in South Africa. Dev. Pract. 2018, 28, 884–898. [Google Scholar] [CrossRef]
  24. Chen, T.; Werf, G.V.D.; Jeu, R.D.; Wang, G.; Dolman, A.J. A global analysis of the impact of drought on net primary productivity. Hydrol. Earth Syst. Sci. 2013, 17, 3885–3894. [Google Scholar] [CrossRef]
  25. Richaud, B. Vegetation Index NDVI and VCI Indices. UNCCD-Led Drought Toolbox. Un Environment-DHI Centre on Water and Environment, Ankara, Turkey. 2019. Available online: https://www.unccd.int/sites/default/files/inline-files/04_Vegetation_index.pdf (accessed on 1 January 2025).
  26. Municipal Demarcation Board (MDB). Spatial Knowledge Hub. Boundaries of Local and District Municipalities in South Africa. 2018. Available online: https://spatialhub-mdb-sa.opendata.arcgis.com (accessed on 8 February 2025).
  27. Weather and Climate. The Global Historical Weather and Climate Data. Weather and Climate. 2023. Available online: https://weatherandclimate.com/ (accessed on 16 January 2025).
  28. Statistics South Africa (STATS SA). Census of Commercial Agriculture, Northern Cape: Financial and Production Statistics; Statistics South Africa: Pretoria, South Africa, 2017.
  29. Cochran, W.G. Statistical Characteristics of Coverage Optimization Based on Sample Data, Sampling Techniques, 3rd ed.; John Wiley and Sons: New York, NY, USA, 1997. [Google Scholar]
  30. Barlett, J.E.; Kotrlik, J.; Higgins, C. Organizational Research: Determining Appropriate Sample Size in Survey Research. Inf. Technol. Learn. Perform. J. 2001, 19, 43. [Google Scholar]
  31. Folke, C. Resilience: The emergence of a perspective for social–ecological systems analyses. Glob. Environ. Change 2006, 16, 253–267. [Google Scholar] [CrossRef]
  32. Walker, B.; Holling, C.S.; Carpenter, S.R.; Kinzig, A. Resilience, adaptability and transformability in social–ecological systems. Ecol. Soc. 2004, 9, 5. [Google Scholar] [CrossRef]
  33. Béné, C.; Wood, R.G.; Newsham, A.; Davies, M. Resilience: New Utopia or New Tyranny? Reflection about the Potentials and Limits of the Concept of Resilience in Relation to Vulnerability Reduction Programmes. IDS Work. Pap. 2012, 2012, 1–61. [Google Scholar] [CrossRef]
  34. Bahadur, A.V.; Peters, K.; Wilkinson, E.; Pichon, F.; Gray, K.; Tanner, T. The 3As: Tracking Resilience Across BRACED. BRACED Working Paper; Overseas Development Institute (ODI): London, UK, 2015. [Google Scholar]
  35. Beaumont, R. An Introduction to Principal Component Analysis and Factor Analysis Using SPSS 19 and R (Psych Package), Factor Analysis and Principal Component Analysis (PCA). 2012. Available online: https://www.floppybunny.org/robin/web/virtualclassroom/stats/statistics2/pca1.pdf (accessed on 5 March 2025).
  36. Walsh-Dilley, M.; Wolfor, W.; McCarth, J. Rights for Resilience: Bringing Power, Rights and Agency into the Resilience Framework; Oxfam International: Washington, DC, USA, 2013. [Google Scholar]
  37. Holden, S.T.; Quiggin, J. Climate risk and state-contingent technology adoption: Shocks, drought tolerance and preferences. Eur. Rev. Agric. Econ. 2017, 44, 285–308. [Google Scholar] [CrossRef]
  38. Nuvey, F.S.; Addo, K.K.; Addo-Lartey, A.; Bonfoh, B.; Nortey, P.A. Coping with Adversity: Resilience Dynamics of Livestock Farmers in Two Agroecological Zones of Ghana. Int. J. Environ. Res. Public Health 2021, 18, 9008. [Google Scholar] [CrossRef] [PubMed]
  39. Clements, R.; Haggar, J.; Quezada, A.; Torres, J. Technologies for Climate Change Adaptation–Agriculture Sector; Zhu, X., Ed.; Risø Centre: Roskilde, Denmark, 2011. [Google Scholar]
  40. Aliyar, Q.; Collins, N. Changing with the weather: Afghan farmers adapt to drought. Cent. Asian J. Water Res. 2022, 8, 126–142. [Google Scholar] [CrossRef]
  41. Ranjan, R.; Pradhan, D.; Reddy, V.R.; Syme, G.J. Chapter 8-Evaluating the Determinants of Perceived Drought Resilience: An Empirical Analysis of Farmers’ Survival Capabilities in Drought-Prone Regions of South India. In Integrated Assessment of Scale Impacts of Watershed Intervention; Elsevier: Amsterdam, The Netherlands, 2014. [Google Scholar]
  42. Tahernejad, A.; Sohrabizadeh, S.; Mashhadi, A. Exploring factors affecting psychological resilience of farmers living in drought-affected regions in Iran: A qualitative study. Front. Psychol. 2024, 15, 1418361. [Google Scholar] [CrossRef] [PubMed]
  43. Tommasino, A.; Lezama, F.; Gallego, F.; Camba Sans, G.; Paruelo, J.M. Rangeland resilience to droughts: Changes across an intensification gradient. Appl. Veg. Sci. 2023, 26, e12722. [Google Scholar] [CrossRef]
  44. Salmoral, G.; Ababio, B.; Holman, I.P. Drought impacts, coping responses and adaptation in the UK outdoor livestock sector: Insights to increase drought resilience. Land 2020, 9, 202. [Google Scholar] [CrossRef]
  45. Nelson, R.; Goemans, C.; Pritchett, J. Farmer Resiliency Under Drought Conditions; Department of Agricultural and Resource Economics: Fort Collins, CO, USA, 2013. [Google Scholar]
  46. Meaza, H.; Nyssen, J.; Abera, W. Impacts of catchment restoration on water availability and drought resilience in Ethiopia: A meta-analysis. Land Degrad. Dev. 2022, 33, 547–564. [Google Scholar] [CrossRef]
  47. Dapilah, F.; Nielsen, J.Ø.; Friis, C. The role of social networks in building adaptive capacity and resilience to climate change: A case study from northern Ghana. Clim. Dev. 2019, 12, 42–56. [Google Scholar] [CrossRef]
  48. Carrico, A.R.; Williams, N.E.; Truelove, H.B. Social capital and resilience to drought among smallholding farmers in Sri Lanka. Clim. Change 2019, 155, 195–213. [Google Scholar] [CrossRef]
Figure 1. Study area. Source: authors’ compilations using ArcGIS Pro version 7.1 with layers obtained from publicly available GIS datasets and Municipal Demarcation Board of South Africa in 2018 [26].
Climate 13 00154 g001
Figure 2. Conceptual framework. Source: authors.
Climate 13 00154 g002
Table 1. The description of the variables to be employed in the probit model, with their expected signs.
VariableDescriptionExpected Sign
Dependent variable
Agricultural Drought Resilience Index (ADRI)1 if the commercial livestock farmer is resilient and 0 if otherwise
Explanatory variables
Socio-economic variables
AgeNumber of years+
Gender0 if female and 1 if male+
Marital status1 if single, 2 if married, 3 if widowed, 4 if divorced, 5 if other+
Education 1 if primary education, 2 if secondary education, 3 if tertiary education, 4 if post-tertiary education+
Household sizeNumber of members+
Funding1 if the farmer has savings, 0 if otherwise+/−
Credit0 if no, 1 if yes+
Change in Income% change in income after drought+/−
Institutional and social capital support variables
Co-operative0 if yes, 1 if no+
Government assistance0 if no, 1 if yes+
Government interest0 if no, 1 if yes+
Social network1 if a farmer has networks of farmer organisations, church, club, and family, and 0 if otherwise+/−
Relative support1 if received support from relatives during drought, 0 otherwise+
Farm characteristics
Farming experienceExperience in years (number)+
Number of livestock in a normal yearNumber of livestock+/−
Number of livestock in a period with agricultural droughtNumber of livestock
Environmental and resource management variables
Other water sources1 if has access to alternative water sources other than river water and 0 otherwise+/−
Sustaining natural resources1 if has access to sustainable water sources and 0 otherwise+
Agricultural drought response variables
Coping strategy1 if national migration by renting land, 2 if reducing livestock numbers, 3 if building a feed bank, 4 if searching for alternative income, 5 if leasing part of your land, 6 if other+
Farm practice/Adaptive strategy1 if search for better drought coping breeds, 2 if diversifying enterprises, 3 if enough savings for the drought years, 4 if adopting conservation agriculture, 5 if national migration, 6 if international migration, 7 if other+
Drought response1 if selling all animals, 2 if decreasing animal numbers, 3 if obtaining credit to purchase feed, 4 if selling assets to purchase feed, 5 if changing grazing rotation plans, 6 if planting irrigated pastures+
Source: Authors.
Table 2. Socio-economic characteristics of the commercial livestock farmers.
VariableCategoryFrequencyPercent
GenderFemale21.6
Male12198.4
Total123100
Marital statusSingle118.94
Married/Partner11089.44
Widowed10.81
Divorced10.81
Educational Level<Grade 1286.5
Grade 123326.8
Graduate qualification6048.8
Postgraduate qualification2217.9
Main OccupationFarmer11593.5
Formal employment64.9
Business21.6
Secondary occupationBusiness433.3
Formal employment866.7
Source: authors.
Table 3. Descriptive statistics of the farming households.
VariableNMeanMedianStd. DevRangeMinMax
Household’s head Age12352.554.512.653602484
Household size1232.9231.412717
Female household members1141.782.000.870415
Male household members1031.511.000.765314
Source: authors.
Table 4. Descriptive statistics of livestock farmers’ farm characteristics.
VariableCategoryNMeanMedianStd. DevRangeMinMax
Years of farming experience 8627.76229.512.210155358
Number of livestock before the droughtSheep:114204113002164.27510,000010,000
Goats:49111.265149.6628000800
Cattle:84171.4975238.482100001000
Small Game:43123.2660235.116110001100
Large Game:3655.567.599.2025000500
Total herd size1232112.4214002334.94911,170011,170
Number of livestock after the droughtSheep:1131344.838001681.409900009000
Goats:4996.7340171.779100001000
Cattle:8498.9540123.6155000500
Small Game:4471.3620147.3667000700
Large Game:3527.74039.0161000100
Total herd size1231375.038501734.21110,100010,100
Source: Authors.
Table 5. Correlation matrix for a variable used to construct the ADRI.
CorrelationsCPNCPDCFNCFD
Commercial livestock production in a normal year (CPN)1.000
Commercial livestock production in a drought year (CPD)0.7221.000
The Months a farmer is financially stable in a normal year (CFN)0.1410.1171.000
The months a farmer is financially stable in a drought year (CFD)−0.1170.0180.3431.000
Source: authors.
Table 6. Results of Bartlett’s test of sphericity.
Bartlett Test of Sphericity
Chi-square334.674
Degree of freedom6
p-value0.000
Kaiser-Meyer-Olkin measure of sampling adequacy (Determinant of the correlation matrix)0.500
Source: authors.
Table 7. Results of unrotated PCA (N = 123; Component 4).
ComponentEigenvalueDifferenceProportionCumulative
Comp11.7650.4330.4410.441
Comp21.3320.6890.3330.774
Comp30.6440.3850.1610.935
Comp40.259 0.0651.000
No of observations123
Trace4
Rho1
Sources: authors.
Table 8. Principal components (eigenvectors).
VariableComp1Comp2Comp3Comp4
Commercial livestock production in a normal year (CPN)0.6771−0.1830.0450.711
Commercial livestock production in a drought year (CPD)0.6708−0.0720.297−0.676
The Months a farmer is financially stable in a normal year (CFN)0.30210.607−0.730−0.085
The months a farmer is financially stable in a drought year (CFD)−0.01460.7700.6140.173
Sources: Authors.
Table 9. Summary statistics for ADRI.
n%MeanMedianStd. DevRangeMinimumMaximum
ADRI123 0.000016−0.662.43500413.41−4.9268.484
ADRI_ < 08267−1.346−1.1720.9714.830−4.930−0.090
ADRI_ > 041332.6922.6222.2988.4700.0208.480
Sources: authors.
Table 10. Factors that influence the farming household’s resilience to agricultural drought.
VariablesCoeffStd. Errp > zM. EffStd. Errp > z
Social-Economic factors
Age0.0340.0240.1520.0050.0030.114
Gender−4.306 ***1.4080.002−0.5930.1670.000
Education
Grade 121.305 *0.6930.0600.1650.0870.057
Graduate qualification0.7370.6210.2360.0800.0610.189
Postgraduate qualification0.5040.6570.4430.0510.0640.426
Household size0.1120.1660.4990.0150.0230.507
Funding/savings−0.6430.6950.355−0.0890.0940.349
Credit Access0.4450.4460.3180.0610.0620.320
Change in Income0.005 **0.0030.0410.0010.0000.059
Institutional and social capital support variables
Cooperative0.5510.6230.3760.0760.0880.390
Social Network1.345 **0.5860.022−0.1850.0740.013
Relative Support1.210 **0.5620.0310.1670.0660.012
Farm characteristics
Herd size in Normal Year0.001 ***0.0000.0000.0000.0000.000
Herd Size in Drought Year0.001 *0.0000.0650.0000.0000.038
Environmental factors
Sustain Natural Resources−3.066 ***0.8720.000−0.4220.0930.000
Agricultural drought response strategies
Farm practice as an adaptive strategy
Diversify enterprises−0.4460.5740.437−0.0630.0760.407
Enough savings for the drought years0.2980.7450.6890.0490.1280.699
Conservation agriculture−0.8560.7890.278−0.1090.0870.207
Drought response strategies
Decrease animal numbers−0.4390.7380.552−0.0670.1170.568
Obtain credit to purchase feed−1.0250.9870.299−0.1380.1290.286
Change grazing rotation plans−1.4360.9190.118−0.1760.1120.116
Constant−1.8811.6110.243
Number of observations105
Wald chi2 (21)51.800
Prob > chi20.000
Pseudo R20.602
Log pseudolikelihood−25.332
*** = significant at the 1% level; ** = significant at the 5% level; * = significant at the 10%. Source: authors.
Disclaimer/Publisher’s Note: The statements, opinions and data contained in all publications are solely those of the individual author(s) and contributor(s) and not of MDPI and/or the editor(s). MDPI and/or the editor(s) disclaim responsibility for any injury to people or property resulting from any ideas, methods, instructions or products referred to in the content.

