3.1. Frame of Reference Analysis
The Rhine and Meuse are part of the European transport network. We examine whether strategic objectives have been defined by the key organizations that have authority over these waterways, distinguishing the following organizations (from national, via corridor level, to European level)
The Dutch Ministry of Infrastructure and Water Management (I&W) and its executive branch Rijkswaterstaat (RWS),
the Central Commission for the Navigation of the Rhine (CCNR), and
the European Commission.
The strategic objectives of the Ministry of I&W and RWS for inland shipping are described by Rijkswaterstaat [
81]: “
The Dutch economy relies heavily on transport and logistics; the main economic centers must remain accessible. Quickly and safely. By road and by water. Rijkswaterstaat is working on this in its role as manager and developer of the country’s main road and waterway network”. This overall statement is amplified by the ambition that “
The waterways must always be passable and safe, and journey times by water must be reliable”. With these statements Rijkswaterstaat claims responsibility for the construction and improvement of existing waterways, harbors, and moorings, which is proclaimed in its mission statement [
82,
83]: “
to promote safety, mobility and the quality of life in the Netherlands" and “
one of the main tasks of the agency is to manage and develop the main waterway network according a specific service level”.
The CCNR has defined two core objectives [
65], namely (1)
Prosperity of Rhine and European inland navigation and (2)
Ensuring a high safety standard for navigation and its environment. The focus of the first objective is on the competitiveness of the waterway based on reliability, economies of scale, and availability, while the main aim of the second objective is the safety of inland shipping and to reduce the environmental impact, for instance, due to “
all type of pollutant emissions”.
The strategic objectives of the European commission, specified in the TEN-T regulations [
67], are defined as: “
… development of coherent, efficient, multimodal, and high-quality transport infrastructure across the EU”. With respect to this infrastructure, TEN-T states that “
It fosters the efficient transportation of people and goods, ensures access to jobs and services, and enables trade and economic growth.” and “
It also aims to reduce the environmental impact of transport and to increase the safety and the resilience of the network”.
As stated in
Section 1 we contrast the waterway policies with the perspective of the barge operators and logistic service providers. Strategic objectives from this perspective have been specified by the European Commission [
70], which describes the objectives to obtain a competitive transport system, which take into account the growing transport demand and reduction of air pollutants and greenhouse gasses: “
Growing Transport and supporting mobility while reaching the 60% emission reduction target”.
From the barge operators’ perspective, Koninklijke Binnenvaart Nederland [
71] developed a vision of how barge operators deal with low water conditions, considering the implications and the solutions. One of the objectives is stated as “
Transportation by inland shipping serves as a sustainable component within an integrated logistics chain that competes and collaborates with other transportation modes.”
Combining the above statements we can formulate the following encapsulating strategic objective with respect to the state of the inland waterways and inland waterway transport: “To support sustainable economic development waterways must be passable and safe under all conditions, and journey times by water must be reliable”.
The above-described encapsulating strategic objective can be operationalised for the four themes we selected.
Waterway capacity To achieve the desired waterway capacity, Rijkswaterstaat designs the waterways for which it is responsible according to a set of agreed design regulations. An important aspect for the design of the Dutch waterway network is to establish which class designation applies to which corridor. For a long time waterways in the Netherlands were designed according to the CEMT (1992) [
84] classification, which was first proposed in 1954. In 2003 a new and more detailed vessel classification was introduced: the AVV-2002 table [
85]. An important policy starting point is to identify and remove potential bottlenecks that limit passability for the design class vessels. In addition to class considerations, the ‘Richtlijnen vaarwegen’ [
59] provide an approach to optimize the waterway dimensions in order to accommodate anticipated traffic intensities, taking into account environmental considerations, among other factors. Projected increases in traffic intensity can thus be translated into proposals for waterway modification.
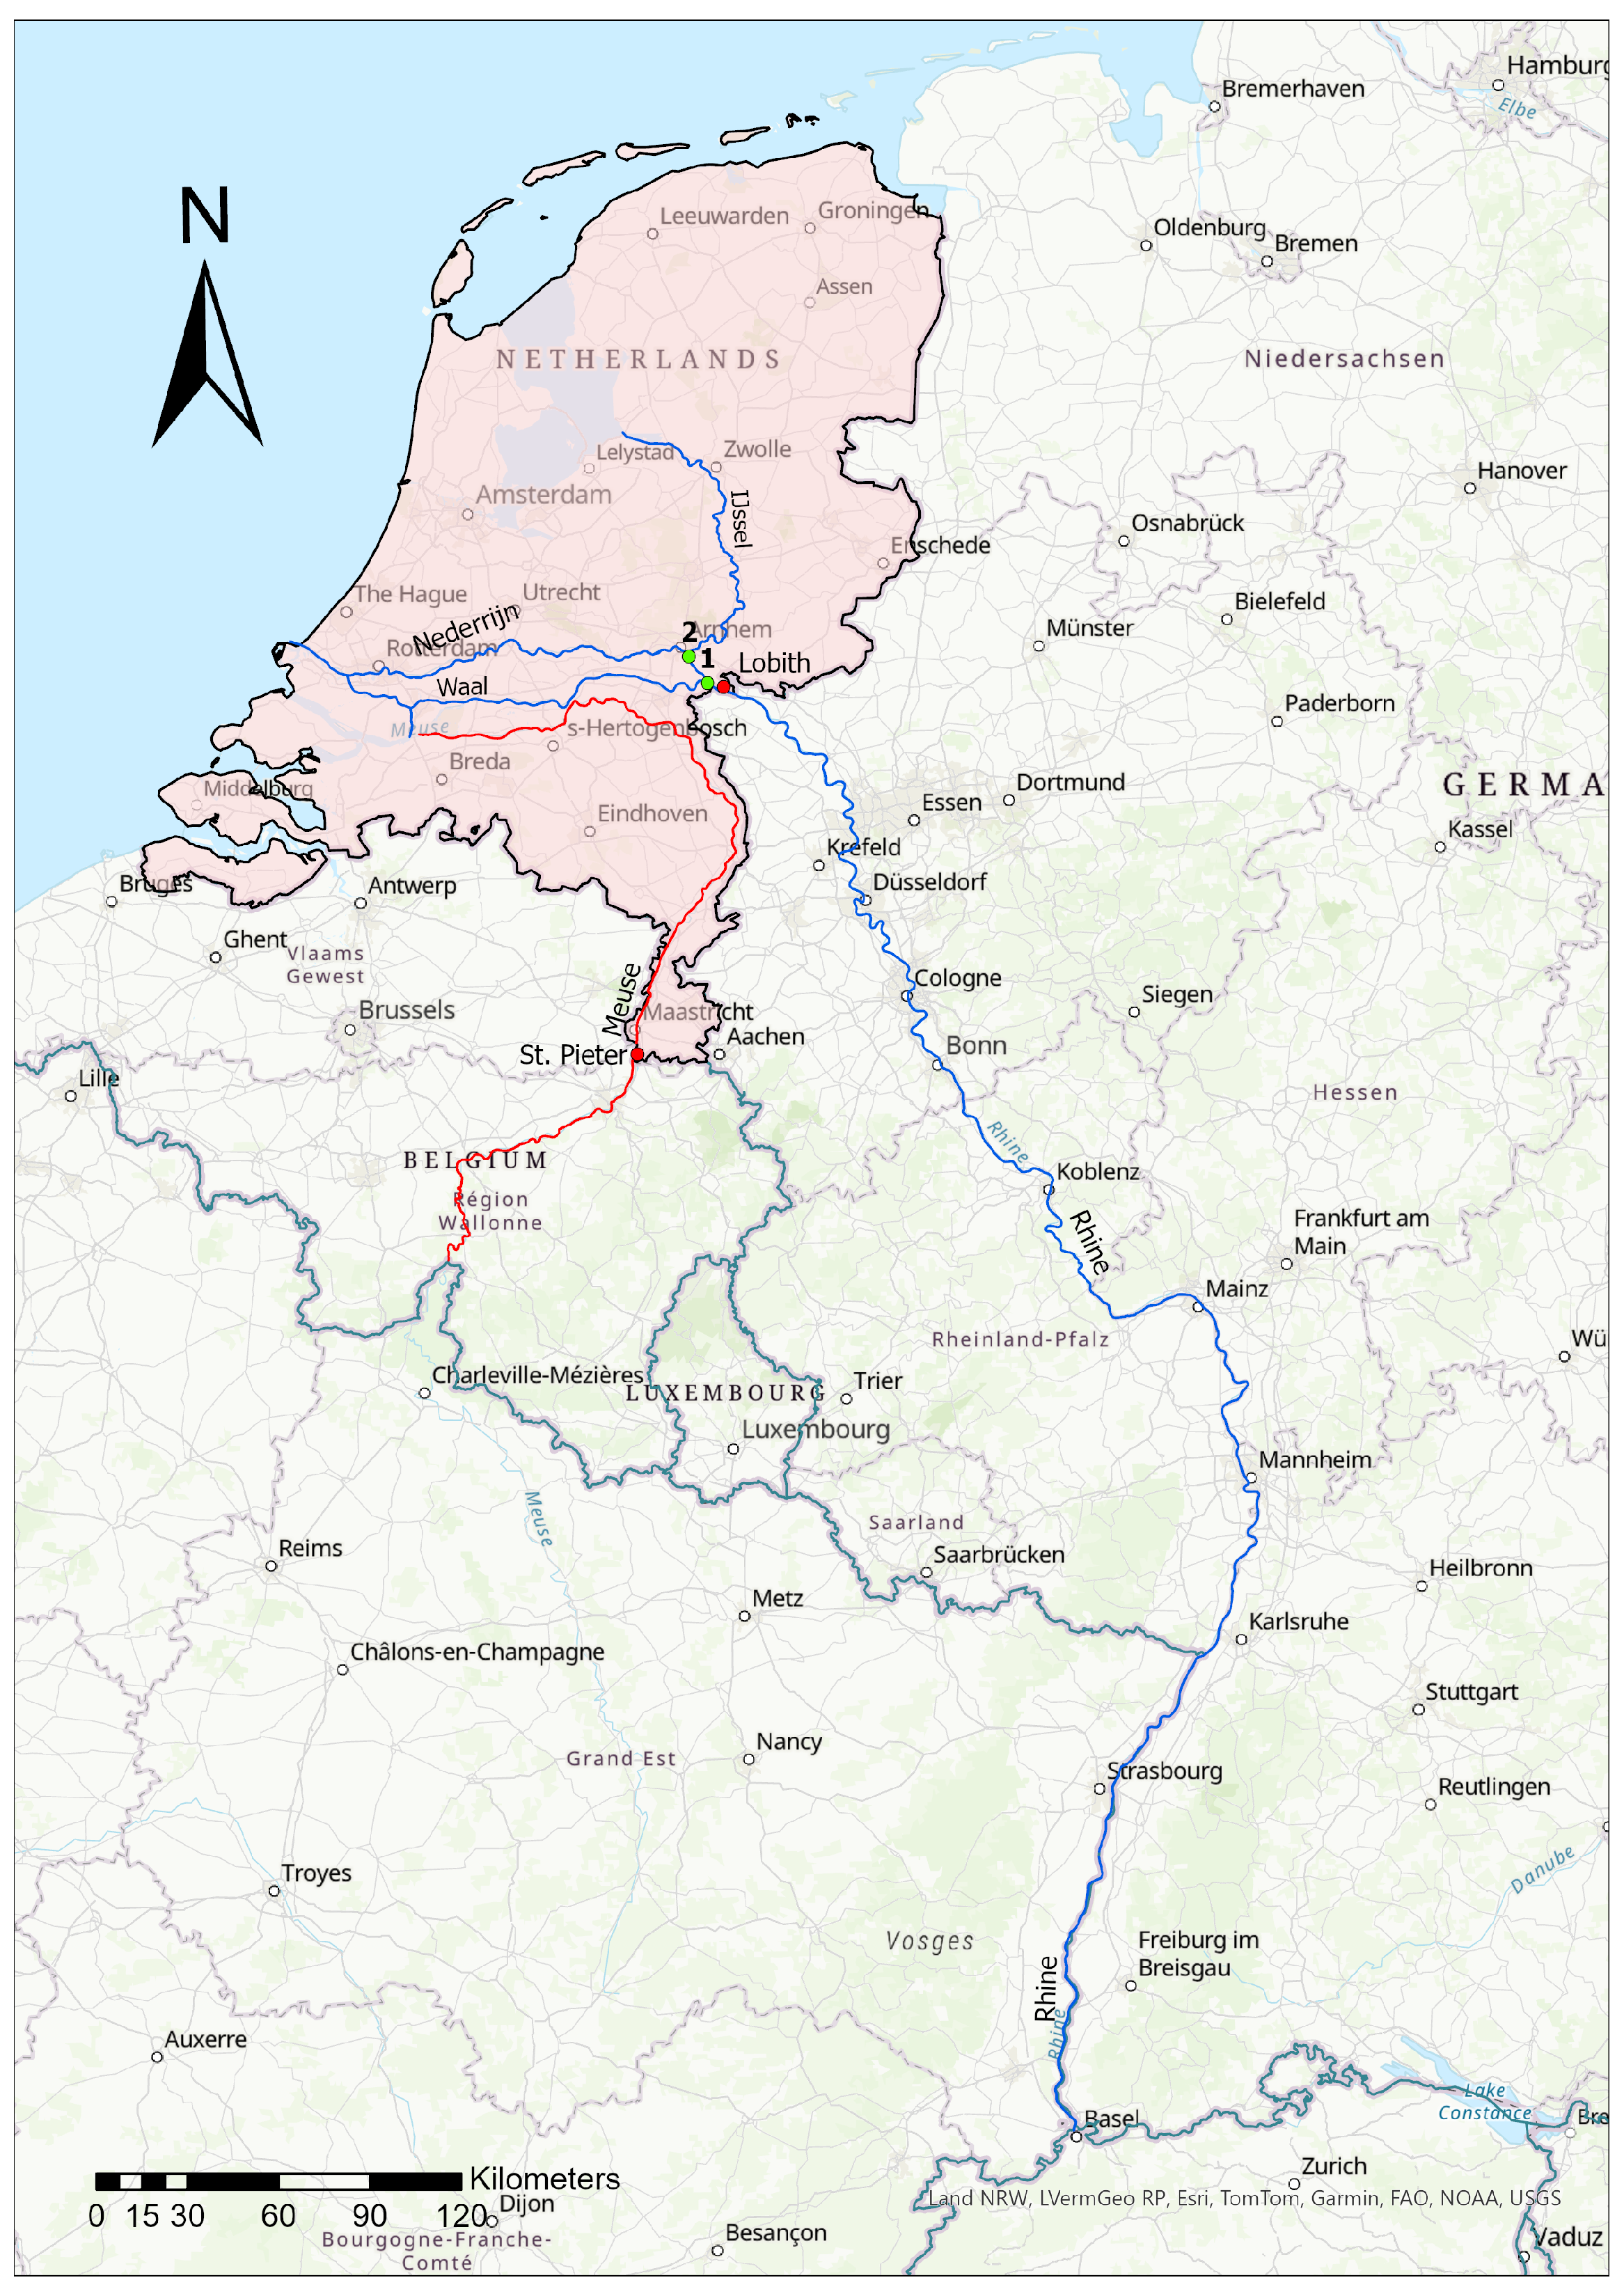
An important design starting point that underlies the aforementioned design considerations is the Agreed Low River discharge (ALR). It is defined as a discharge of 1020 m
3/s (at Lobith) that is expected to be subceeded for no more than 20 days per year based on a 100-year time period. This is a long period of time compared to a 30-year period to determine the climate for a given time horizon and the associated climate change. The international regulations set by the CCNR [
86] state that for discharges larger than or equal to the ALR, a navigable depth of 2.80 m and a width of 150 m should at least be available for IWT on the Dutch part of the Rhine. Simultaneously, the TEN-T-regulations [
67] of the European Commission prescribe that a water depth of 2.50 m should be available for 365 days per year for all the waterways, including the IJssel and Meuse. For high discharges, according to the Central Commission for the Navigation of the Rhine [
87], a minimum head clearance of 9.10 m is supposed to be available for the Hoogste Scheepvaart Waterstand (HSW) along the Rhine, and a minimum of 7 m is demanded for the IJssel and Meuse. The TEN-T-regulations [
67] prescribe a minimum head clearance of 5.5 m for 365 days per year. From a practical perspective it is difficult to monitor or to comply with the TEN-T-regulations.
Combining the above observations we can deduce that Rijkswaterstaat’s operational objective for waterway capacity can be formulated as “To achieve ‘passable’ waterways all waterway elements should conform to the corridors class designation and the waterway dimensions and layout should conform to the ‘Richtlijnen Vaarwegen’ and the ‘Richtlijnen Scheepvaarttekens’ respectively”. Rijkswaterstaat implies that when the waterway dimensions are designed according to these regulations, barge operators can navigate economically efficiently and, as such, will be a competitive mode of transport compared to the road and rail modalities.
We conclude that the management theme ‘waterway capacity’ is well operationalized. All elements of the basic FoR template can be filled in, and the overall policy appears to be coherent. However, during periods of extreme river discharge, be they high or low, it is known that passability comes under pressure. For extremely low river discharges, the water depths may be reduced to an extent that captains have to reduce their loading rates to avoid running aground. During such times Rijkswaterstaat issues important information on the current and predicted state of the waterways so that captains can make informed decisions on loading rates and route selection. Furthermore, regulatory restrictions may be issued, i.e., maximum speeds and distances to the river bank (in Germany, following Mark I and Mark II regulations), overtaking restrictions (for example at the IJssel during extreme low water conditions), etc. In times of extreme water scarcity, Rijkswaterstaat has to decide what amount of water is allocated to which functions, using the ‘sequence of priorities’. Each of these aspects affects the waterway capacity in terms of the total amount of cargo that can be transported. A clear framework on how to make trade-off decisions under such circumstances appears not to be available. This can be seen as a gap in covering the ’under all conditions’ element of the strategic objective mentioned above.
Waterway safety Similar to ‘waterway capacity’, the Richtlijnen Vaarwegen [
59] and Richtlijnen Scheepvaarttekens [
60] also address ‘waterway safety’. This is discussed more implicitly, however, through the assumption that “
Waterway safety is implied when the waterways are designed conform the recommended dimensions and layout”. Consistent implementation of signage ensures that all waterways in the Netherlands have a predictable layout. While this is assumed to contribute to waterway safety, this contribution has not been quantified. Until 2020 the general policy for waterway safety was simply to reduce the number of maritime accidents. A reference level was not given. In 2020 the Minister of I&W expressed her new policy intentions in a letter to the Dutch parliament named ‘Beleidskader maritieme veiligheid: In Veilige Vaart Vooruit’ [
88] (translated: ‘Policy framework maritme safety: In safe speed ahead’). As of that moment the policy objective for safety is that “
Safety levels are to be continuously improved, by knowing the largest risks, analyzing these and managing these to an acceptable level”. Accidents and near misses are recorded in the Shipping Accidents database [
76]. However, what should be considered as ‘an acceptable level’ remains unspecified.
The implied safety that follows from adhering to the Richtlijnen Vaarwegen [
59] and Richtlijnen Scheepvaarttekens [
60], combined with the policy framework to ‘continuously improve safety levels’, appears to focus mainly on regular discharge conditions. When navigable conditions, such as the available water depth or fairway width, change due to discharge extremes, the risk of accidents increases [
89]. Maneuverability and stopping of vessels during low water conditions become difficult. Another safety issue is inexperienced barge operators navigating with extra barges alongside the vessel. Both of these factors lead to hazardous situations for inland navigation.
During extreme droughts barge operators are challenged to maximize their payload to satisfy the increased transport demand. For example, when there is insufficient oversight or enforcement capacity, some shipowners tend to push the limits of minimal underkeel clearance, based on the MGD and water level predictions, which increases the risk of ship groundings and hull and propellor damage [
15]. Also, the width of the waterway decreases during extreme droughts [
90]. The reduced loading rate of vessels increases the number of trips needed to transport the same amount of cargo. To satisfy the overall transport demand, the amount of active vessels may increase to compensate for the capacity loss of individual vessels [
16]. The increased traffic intensity on the narrower waterways reduces the available margins between vessels while encountering or overtaking. This in turn increases the potential risk of collisions and allisions. Similar examples can be provided for high discharge extremes; think of reduced overhead clearance below fixed bridges or reduced vessel control due to large currents.
We conclude that while there is a policy framework that expresses an operational objective for maritime safety, its subsequent decision framework is not yet fully operationalized. This can be considered as a gap. A decision framework that looks at an acceptable number of accidents, compares this to an actual number of incidents, and suggests interventions in case there is a discrepancy is conceivable, but as far as the authors can determine, has not been implemented. Also, there appear to be no additional guidelines for the more extreme discharge ranges, both high and low. Reduced navigability, for example, is not logged as a potential cause of accidents in the Shipping Accident database. This can be seen as a gap in covering the ‘under all conditions’ element of the strategic objective mentioned earlier.
Infrastructure service level To deal with the
’… journey times by water must be reliable’ part of the strategic objective mentioned earlier, the service levels of locks and bridges have to be specified in operational objectives. Rijkswaterstaat estimates the service level of waterway objects like locks and bridges based on the time it takes for vessels to pass such objects [
12,
91]. These operational objectives are specified in Ministerie van Infrastructuur en Waterstaat et al. [
12] for the different waterways. According to this document the operational objectives for a ‘main corridor’ are stated assuming a 24/7 operation system of the objects. Other operation cycles are defined depending on the waterway classification and can be a number of hours per week or by demand. It might also depend on the availability of operators and maintenance of the locks or bridges.
In generalized terms the passage time (T
passage) of a lock consists of the locking time (T
locking), which is object specific, and the waiting time (T
waiting) (see Equation (
1)).
The capacity (
C) of a lock (ships/h) can be determined by dividing the maximum number of vessels that can be included in one lock cycle (
) by the duration of a full lock cycle (
). The intensity (
I) by which a lock is used, expressed as the actual number of vessels that pass the lock per hour, can be derived either from observations or projections. An important quantitative state concept that describes the service level of a lock is the
ratio [
57]. From observations it is known that waiting times increase exponentially when the
ratio approaches unity. Fluctuations in traffic intensity may already result in unacceptable incidental delays, even at lower average
ratios. Rijkswaterstaat [
59] uses the
ratio in its operational objective regarding infrastructure service levels, stating “
that the average total waiting time should not exceed 30 min, and 85% of all passages should be able to be completed within this maximum waiting time” [
92,
93]. In light of the time it takes to implement infrastructure modifications, capacity increases are considered for
ratios as low as 0.5.
During extreme discharges various aspects of infrastructure service levels are affected. During extremely high discharges certain locks and fixed bridges may seize or severely restrict their operations. During extreme droughts locking restrictions may come into play. To avoid fresh water losses, for example, the locking schedule of the locks at the Meuse is optimized by clustering of vessels [
79], leading to an increase of the waiting times. Another example is the operation of the locks at the Amsterdam–Rijn canal. The locking operation is canceled during the night to facilitate fresh water supply from the river Waal via the canal in order to mitigate salt water intrusion at IJmuiden.
We conclude that the management theme ‘infrastructure service level’ is well operationalized. All elements of the basic FoR template can be filled in, and the overall policy appears to be coherent. For this theme as well, however, it is known that service levels come under pressure during periods of extreme river discharge, be they high or low. In times of extreme water scarcity, Rijkswaterstaat has to decide what amount of water is allocated to which functions and does so using the ‘sequence of priorities’. Countering fresh water loss and/or salt intrusion in the operation of sea locks is an important aspect of this responsibility. A clear framework on how to make trade-off decisions under such circumstances appears not to be available. This can be seen as a gap in covering the ‘under all conditions’ element of the strategic objective mentioned above.
Clean and sustainable waterway transport The Dutch operational objective for ‘waterway sustainability’ can be derived from applicable EU legislation. In 2019 the EU adopted the European Green Deal aimed at making Europe’s economy and society climate neutral by 2050. This Green Deal was formalized in the EU Climate Law in 2021. Fit for 55 is the package of measures to reduce the European Union’s greenhouse gas emissions by 55% by 2030. After first being tabled in 2021, the Fit for 55 package was passed in 2023. The Dutch government aligns its ambitions with the EU ‘Fit for 55’ target to “reduce net greenhouse gas emissions by at least 55% by 2030 compared to the 2019 reference, while beyond 2030 the ambition is to achieve net-zero CO2 emissions in 2050, and the goal for NOx and PM emissions is to reduce with 30% in 2050”.
Over the years various EU mechanisms have been developed to achieve the desired emission reductions. One example is the Renewable Energy Directive, which sets targets for the share of renewables in the total EU energy consumption. Its latest version entered into force on 20 November 2023, and also has consequences for inland shipping. Another example is the EU Emissions Trading System (EU ETS). First launched in 2005, it aims to make polluters pay for their Greenhouse Gas (GHG) emissions. The EU ETS works according to the “cap and trade” principle. The ‘cap’ refers to a limit set on the total amount of GHG that can be emitted, reduced annually in line with the EU’s climate ambitions. The ‘trade’ refers to a marketplace where emission allowances may be traded from companies that have more allowances than they emit to companies that emit more than they are allowed. As the cap decreases, so does the supply of allowances to the EU carbon market. As of 2024 the EU ETS covers emissions from maritime transport as well. Other examples are the EU Corporate Sustainability Reporting Directive (CSRD), where companies are required to report how their business affects sustainability, and the EU Taxonomy of sustainable activities, which aims to make clear what activities are sustainable in the context of the European Green Deal. All these mechanisms provide regulatory constraints aimed at achieving the desired emission reductions over time.
Although the ambitions as set by Fit for 55 are clear, how exactly to achieve and quantify these targets for IWT is less clear. PIANC INCom TaskGroup 234 collected mainly European experiences with respect to infrastructure requirements for the decarbonization of IWT [
94]. Their conclusion was that the main challenge for IWT sustainability was not the design of ‘infrastructure hardware’, such as dimensions and standards of bunkering stations, but rather pathways and decision making for the decarbonization of IWT comparable with the CCNR roadmap [
95]. PIANC INCom WorkingGroup 223 presented guidelines for developing air pollutant and carbon emission performance indicators for inland waterways [
96]. They compared the performance of eight different indexes to quantify emission performance for waterways. The conclusion was that existing methods show great variability, both in terms of the resolution that each method could deliver and in terms of accuracy. A validation exercise where each method was applied to the same corridor showed over 300% difference between the lowest and the highest emission estimates. Further study of Dutch policy documents does not provide extra clarity. It seems that no method has as yet been implemented to estimate annual emissions at system scale and to assess potential packages of interventions that will likely be effective to achieve the required emission reductions, even though, from a scientific perspective, Van der Werff et al. [
97] have shown that system-scale emission estimates are feasible.
Current policies lack a focus on the business case for barge operators or owners to become more durable and sustainable. Clear regulations about alternative fuels and the certification of engines are missing, and the necessary equipment or processes need to be developed.
The lack of an agreed upon method to quantify emissions is problematic. On the one hand, this makes it much more difficult to compare the current state of system-scale emissions with the desired state and to assess the potential effectiveness of different packages measures to achieve the 2030 emission targets. On the other hand, this also makes it difficult to quantify how climate effects like extremely low or high discharges cascade through the system and translate to overall emission patterns.
We conclude that for ‘waterway sustainability’ a clear operational objective has been identified, and a clear definition of the desired system state is given. However, a quantification method that shows the current state of emissions in the system and allows for the quantification of carefully designed packages of measures to achieve the required emission reduction appears to be absent. As a consequence it is nearly impossible to assess to what extent IWT as a whole is ‘on track’ to meet the 2030 objectives.
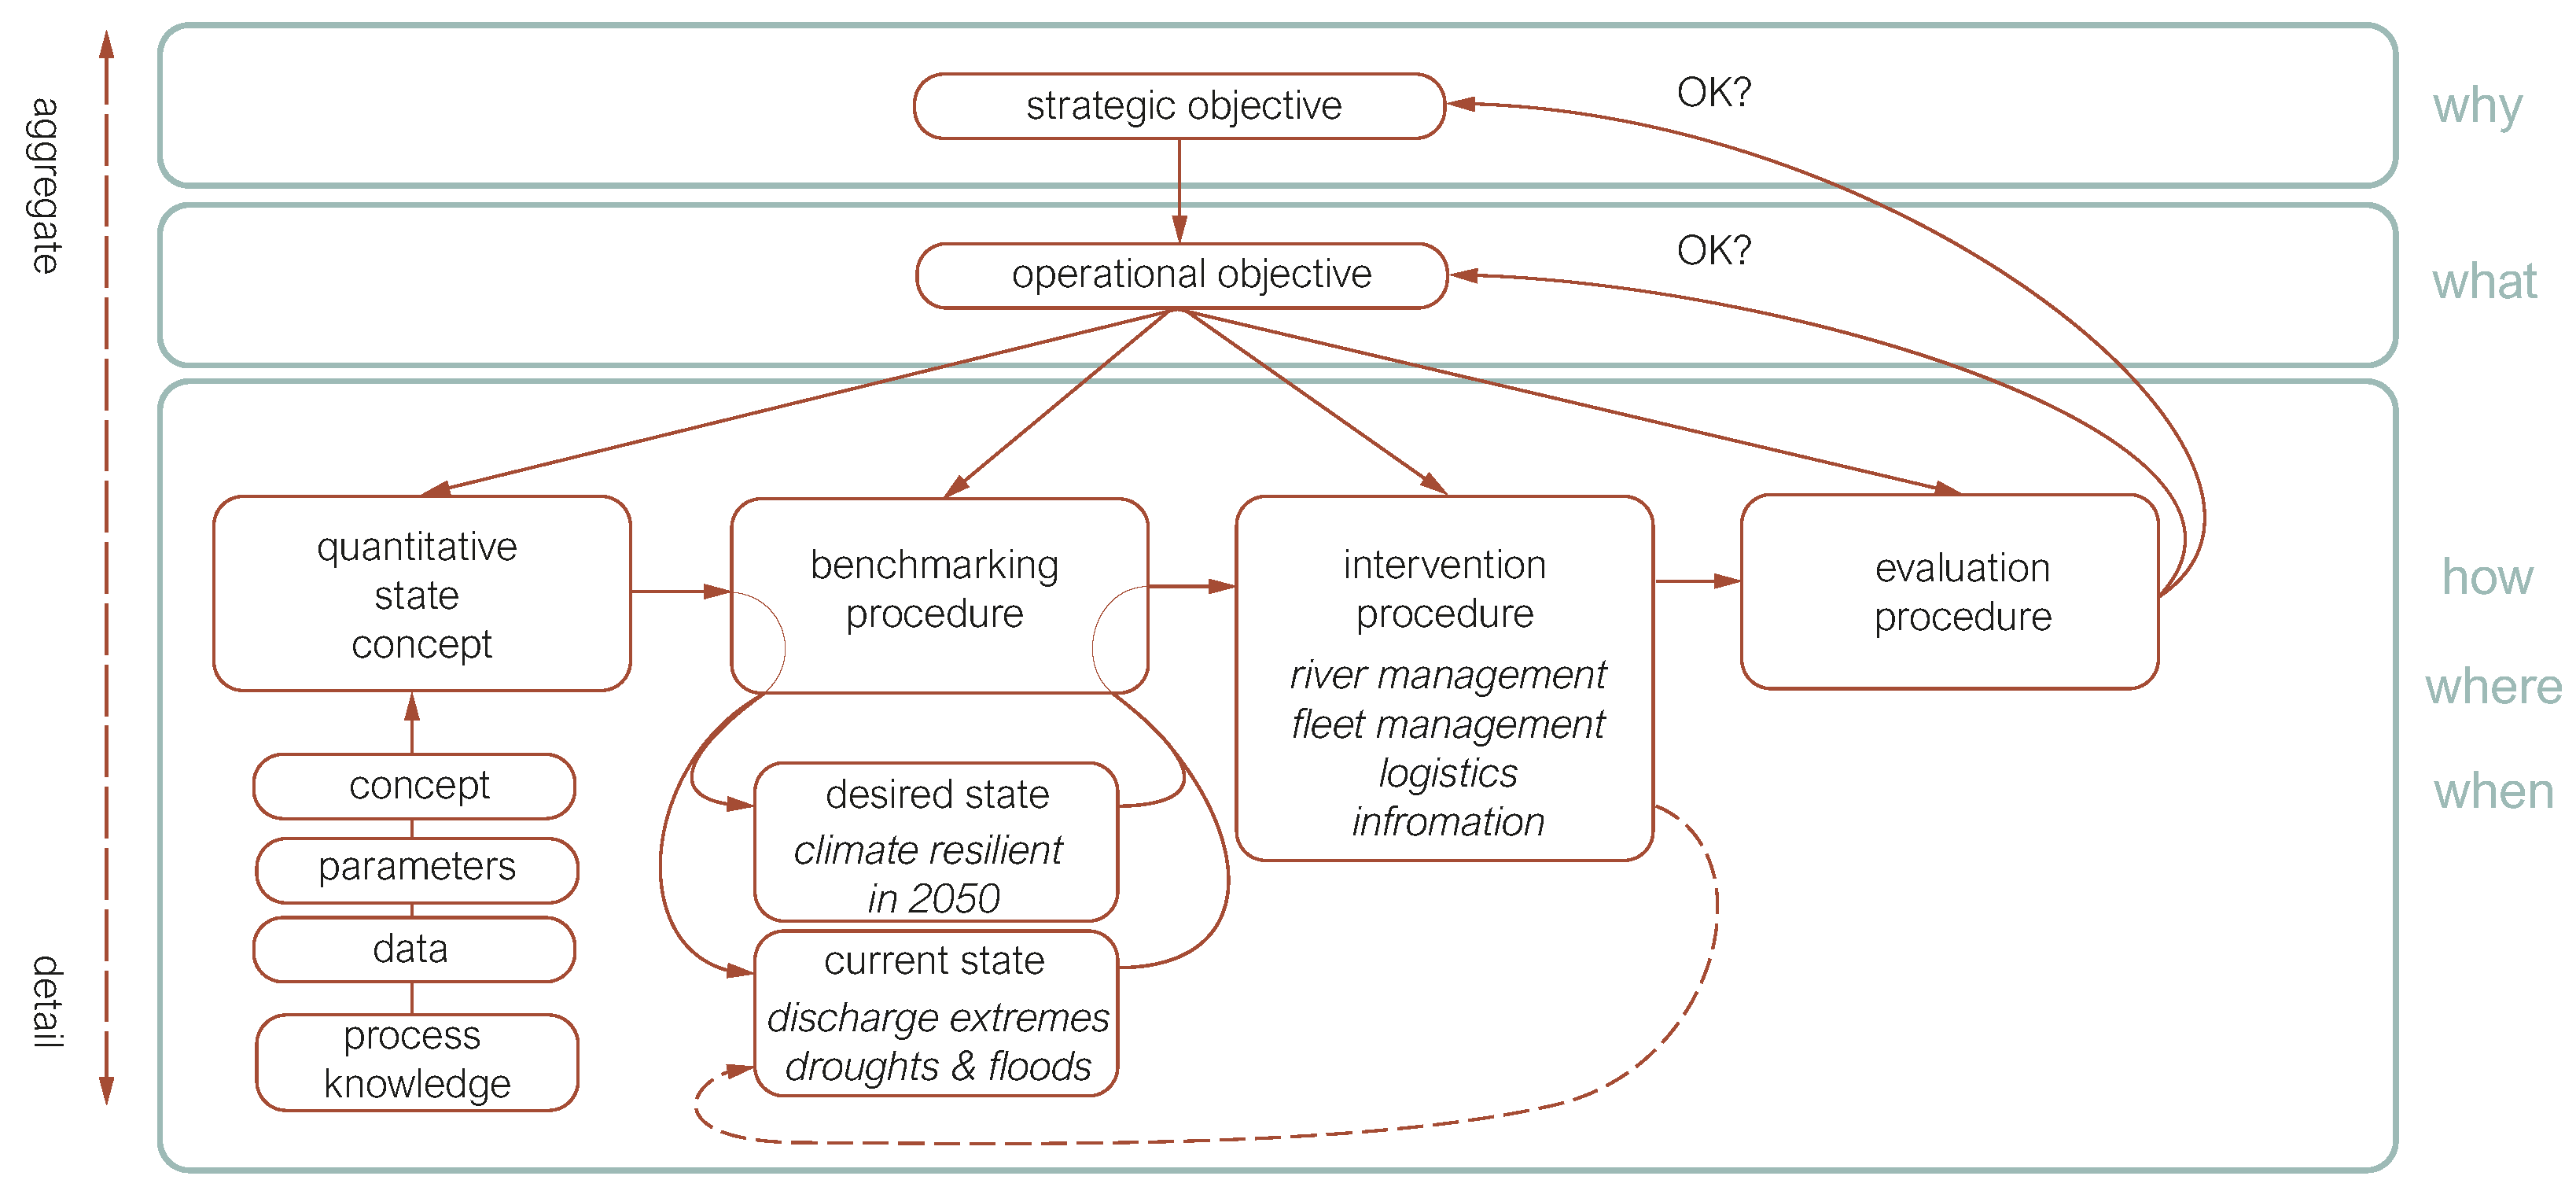
Table 2 summarizes the above findings in one aggregated FoR table, outlining the state of waterway policy in the Netherlands. The rows represent each of the elements of the basic FoR template as shown in
Figure 2. The columns represent the four sub-themes. Those cells for which reasonably explicit information could be found in the source documents have been given a light gray back ground. Cells with a white background were not explicitly defined in the source documents used. Combined
Table 2 visualizes to what extent each sub-theme has been operationalized.
Examination of
Table 2 allows us to make the some key observations following the analysis of source documents:
One overarching strategic objective that captures the essence of waterway policy in the Netherlands can be formulated.
For each of the underlying sub-themes, operational objectives can be defined that explicitly link to this overarching strategic objective.
The sub-themes ‘waterway capacity’ and ‘infrastructure service level’ are fully operationalized in the sense that all elements of the basic FoR template could be made explicit, albeit for regular river discharge conditions.
The sub-theme ‘waterway safety’ is largely assumed to be implied when design guidelines are followed. Other than the operational objective, this policy does not set any specific target. An intervention procedure has been expressed in a policy framework letter sent to the Dutch parliament [
88]. The remaining basic FoR template elements, however, are left unspecified. This makes it very difficult to implement the proposed intervention effectively.
The sub-theme ‘clean and sustainable waterway transport’ has a clear operational objective that follows EU legislation. Also, the desired state of the system is quite clearly defined. The rest of the basic FoR template elements, however, are left unspecified. This makes it very difficult to quantify the current system state and to design packages of measures that help to bring the system towards the desired state and ultimately achieve the operational objective.
All sub-themes fail to explicitly address the ‘all conditions’ element in the overarching strategic objective. Of course this does not imply that no actions are taken under extreme discharge conditions. Rather, this means that such actions, when they are taken, are not embedded in a fully developed policy frame of reference.
In particular the observation in the last bullet links to the issue of the climate resilience of inland shipping that this paper aims to address. The following sub-section explores the implications that this lacking clarity can have.
3.2. IWT Policy Behavior Under Extreme Conditions
The previous sub-section observed that the current waterway policy, as summarized in
Table 2, does not explicitly address the ‘all conditions’ element in the overarching strategic objective. To challenge the performance of the overall policy for extreme conditions, we contrast our document-based ‘IWT policy FoR’ with the assumed FoRs of barge operators [
71].
Table 3,
Table 4,
Table 5 and
Table 6 present the results of this comparison.
Table 3 shows how all FoR elements can be filled for the sub-theme ‘waterway capacity’, both from the perspective of the waterway authority and from the perspective of barge operators. An observable difference between the two perspectives is that the waterway authority mainly focuses on the long-term management of the waterway’s capacity. The policy guidelines mainly focus on waterway dimensions and guaranteeing sufficient capacity under regular conditions. The barge operator experiences these dimensions as boundary conditions and aims to make the best use of the available capacity. As such, the barge operator mainly focuses on the short-term availability of the waterway’s capacity. The differences between both perspectives mainly become visible in the the intervention procedure.
While Rijkswaterstaat’s policy is mainly focused on establishing the long-term boundary conditions for competitive IWT performance, it also acts to improve its performance under more extreme conditions. In the short-term Rijkswaterstaat can, for instance, inform the barge operators about the navigability on the waterway. With better information barge operators can make better decisions, and this is also true under extreme conditions. Furthermore, Rijkswaterstaat decides about water diversion according the ‘sequence of priorities’ in case of extreme water shortage. Decisions to divert water in support of one user function (e.g., drinking water availability, agricultural use, industrial use, etc.) can negatively impact other functions such as IWT. The main effect on waterway capacity is that water diversion to one corridor will lead to lower water levels on another. Especially when water levels are extremely low already, just a few centimeters less water depth will severely impact already sub-optimal loading rates. In the current situation the additional costs for IWT are not estimated, which makes including the interests of IWT in a quantitative trade-off with other user functions impossible.
The long-term river engineering measures, such as bed level improvements or the construction of longitudinal dams, could also be considered to improve navigation conditions under low discharge regimes. Such measures have high investment costs and also impact other functions. Cost–benefit analyses should be performed to investigate whether the cost for improving navigability is reasonable given the achievable benefits. Likewise, barge operators could also implement strategic measures to prepare for extreme discharge conditions. Next to loading rate optimization and route selection, they might also think of temporarily expanding their stocking capabilities or investing in alternative vessels, i.e., making use of lighter materials, different types of propulsion, and different hull shapes. Just like the river engineering measures, these measures also require high investment costs that need to be analyzed for their economic viability. An important factor in these decisions is the expected frequency and duration of these extreme events.
Table 4 shows the results for the sub-theme ‘waterway safety’. In the case that the waterway is designed according the regulations, it is assumed that safe transport is possible. Barge operators can ensure safe transport by applying sufficient underkeel clearance, maneuvering in a safe manner, and acting according the regulations [
63,
64].
During low discharge extremes the navigable conditions deteriorate, and the risk of accidents and groundings increases. From the barge operators’ perspective, safe transport deals with their own crew and the cargo, the other waterway users, the environment, and the built environment.
Regarding the first aspect, the propellers of vessels in these shallow conditions are situated less deeply in the water, so they are more difficult to stop. Additionally, some vessels take barges alongside them to increase the transport capacity per trip. Such combinations are harder to control, and most of the barge operators have less sailing experience with these types of configurations. Training of personnel could improve the operational skills of barge operators. Additional support systems could help staff to reduce the risk on collisions and groundings.
To compensate for the loss of transport capacity per individual vessel, more vessels are deployed, while less space is available on the waterway. This increases the risk of collisions between ships. Furthermore, barge operators are allowed to navigate with smaller keel clearance and draughts up to the MGD. All these aspects increase the risk of accidents and groundings.
To manage these risks Rijkswaterstaat can implement traffic measures, e.g., one-way or one-lane traffic to decrease the risk of accidents. Such measures are intended to improve waterway safety, but they also affect waterway capacity, infrastructure service level, and sustainable waterway transport, and they have the potential to cause cascading effects further in the system.
Table 5 shows the results for the sub-theme ‘infrastructure service level’. In principle both the waterway authority and the barge operator have the objective of minimizing the waiting and operation times to pass locks and bridges in order to reduce the total travel time and safeguard the reliability of IWT. Again there is the difference that Rijkswaterstaat’s policy aims for the long-term and average reliability of such infrastructure, while barge operators typically have a shorter time frame to consider. Of course the long-term service levels that may be expected are an important business case boundary condition, but especially during discharge extremes, the barge operators are dependent on the operation of the infrastructure by Rijkswaterstaat for their more short-term decision making. During prolonged droughts, in order to minimize water losses, the locking schedule at the Meuse was changed, for example, which caused waiting times to increase [
79]. During high discharge events the passage of bridges might become a potential bottleneck [
98]. Fixed bridges affect the maximum loading rate of container vessels. Flexible bridges may be able to operate under extreme discharge conditions as well, but bridge openings may affect other modalities. Rijkswaterstaat communicates about operating regimes, passing restrictions and expected waiting times to allow barge operators to fine tune their operations. Based on this information they can plan their arrival or decide to take another route if that is possible to ensure reliable and timely delivery of goods.
Another issue that causes a drop in the service level of locks and bridges is planned or unplanned operational disruptions. The duration of these incidents can especially affect the estimated time of arrival at the destination, and therefore, the supply of goods becomes more uncertain and less reliable. Also, an insufficient number of operators could endanger the operation of the infrastructure.
Table 6 shows the results of the sub-theme ‘clean and sustainable waterway transport’. While Rijkswaterstaat is responsible for affecting the agreed upon reduction of air pollutant emissions and carbon footprint by 2030 for the waterway system under their control, the barge operators are mainly responsible for the fleet that they operate. Of course both stakeholders are mutually dependent upon each other. Rijkswaterstaat can set boundary conditions to affect change, but it is the barge operator that has to take action to modify their equipment and change the way they operate it. In practice this is difficult due to a lack of regulations to create a viable business case for barge owners. Although the European Renewable Energy Directive and Emissions Trading System are in effect, it is still a challenge to implement and to apply on a national level.
The goals of the waterway sustainability policy are clear, as they follow the EU Green Deal and the Fit for 55 packages of measures. However, the underlying decision framework is less clear. There is no clear waterway network emission estimation tool that quantifies the emissions related to water transport. Tools that are available, such as the Aerius toolkit for NOx emission estimation [
99], are quite coarse and lack a clear link to IWT. The estimation of emissions under varying discharge extremes is especially important. For low water situations, the reduced water depth causes vessel resistance and fuel consumption to increase significantly. Also, the increase in trips leads to an increase in emissions. For high water situations increased currents might positively or negatively impact fuel consumption, depending on whether the vessel sails with or against the current.
Just like with the other sub-themes, any measure that is taken by authorities to manage the waterway under discharge extremes will affect the other waterway sub-themes, other user functions that also rely on the river, and could cause cascading effects in the system. It is clear that with parts of the waterway policy not being fully operationalized, quantifying the effects of policy measures on other sub-themes, user functions, and parts of the system is problematic. With IPCC predictions that river discharge extremes are likely to occur more frequently and to become more severe, addressing these shortcomings should be considered.


