

Key Motivations, Barriers, and Enablers Toward Net-Zero Cities: An Integrated Framework and Large Survey in Japan


Abstract
1. Introduction
2. Materials and Methods
2.1. Analytical Framework
2.1.1. Intrinsic Motivations of Municipalities Toward Net Zero
2.1.2. Barriers and Enablers
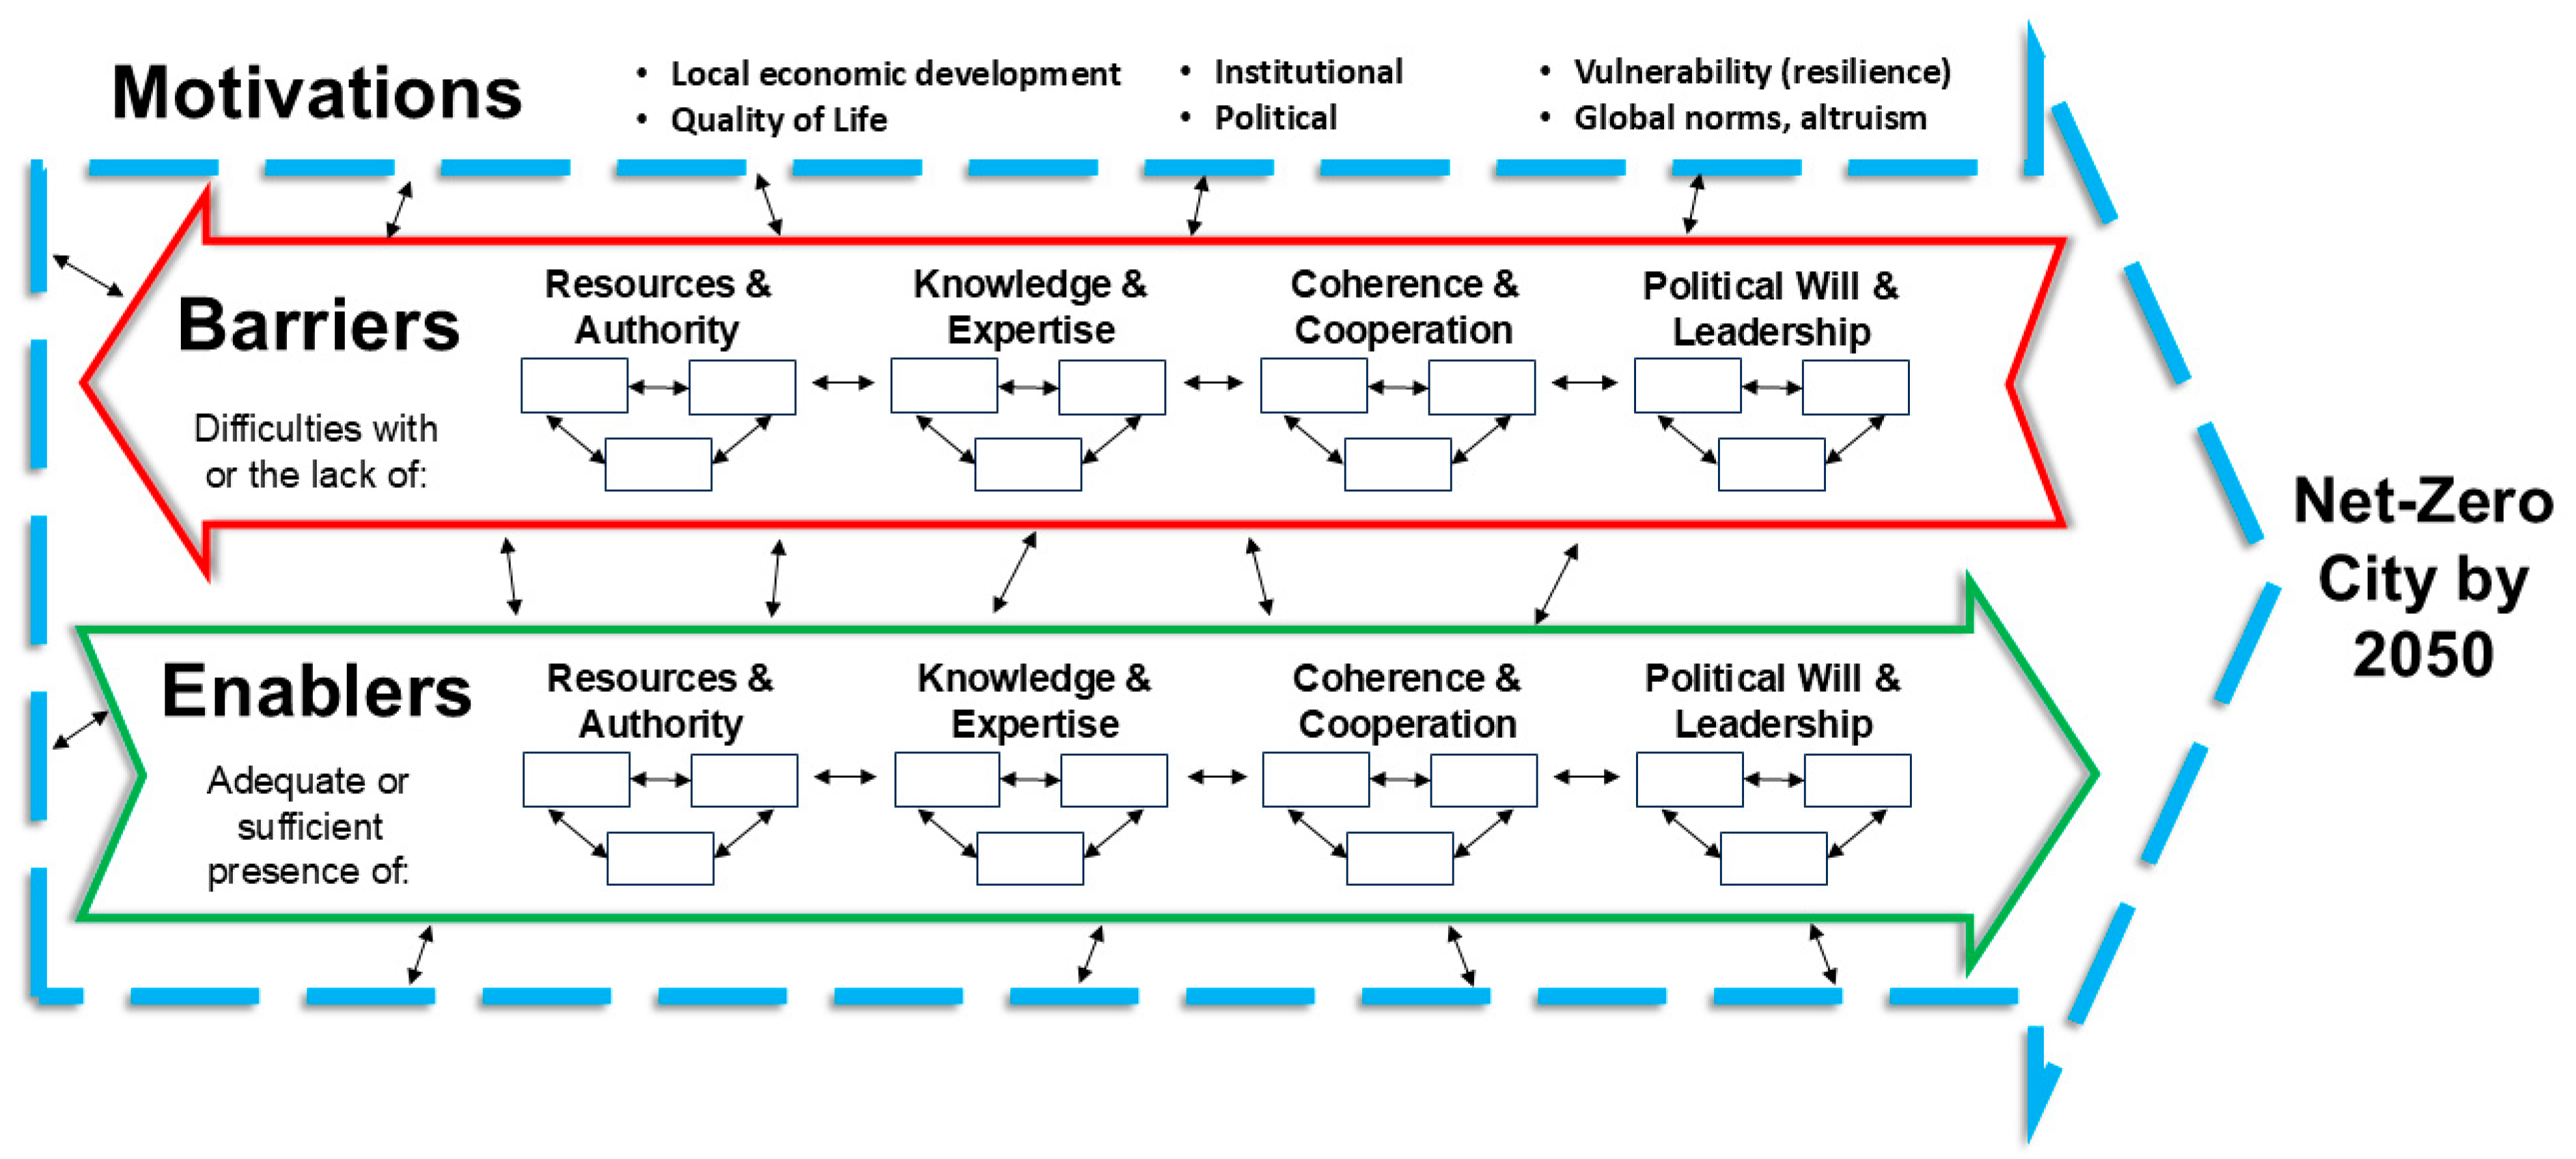
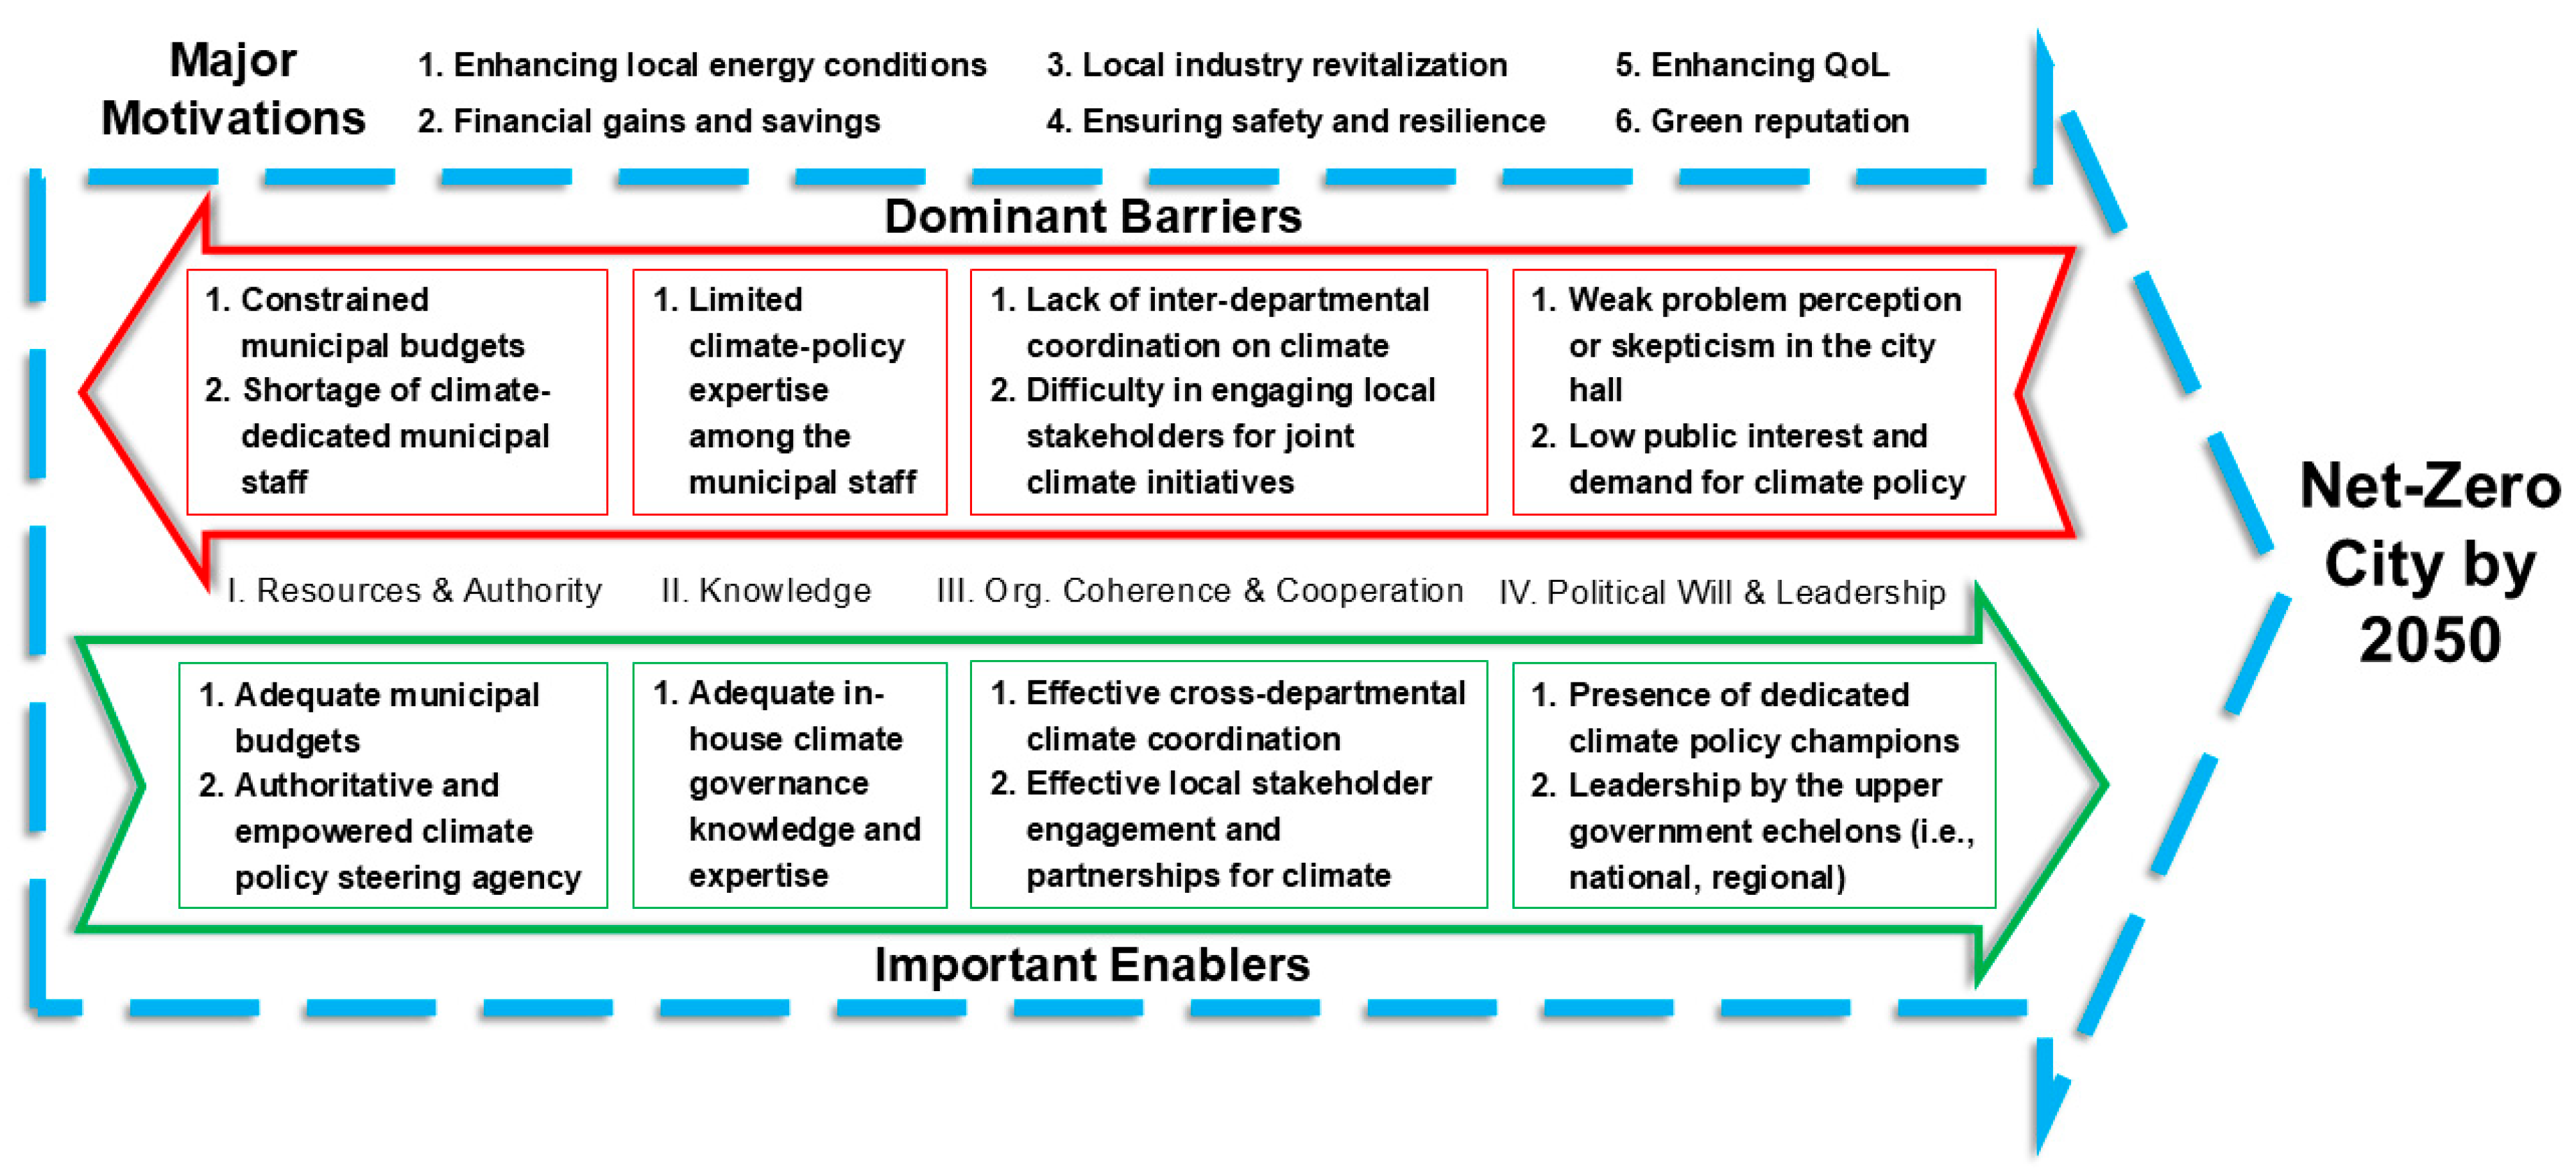
2.1.3. Conceptual Interrelation and Holistic Depiction of MBEs
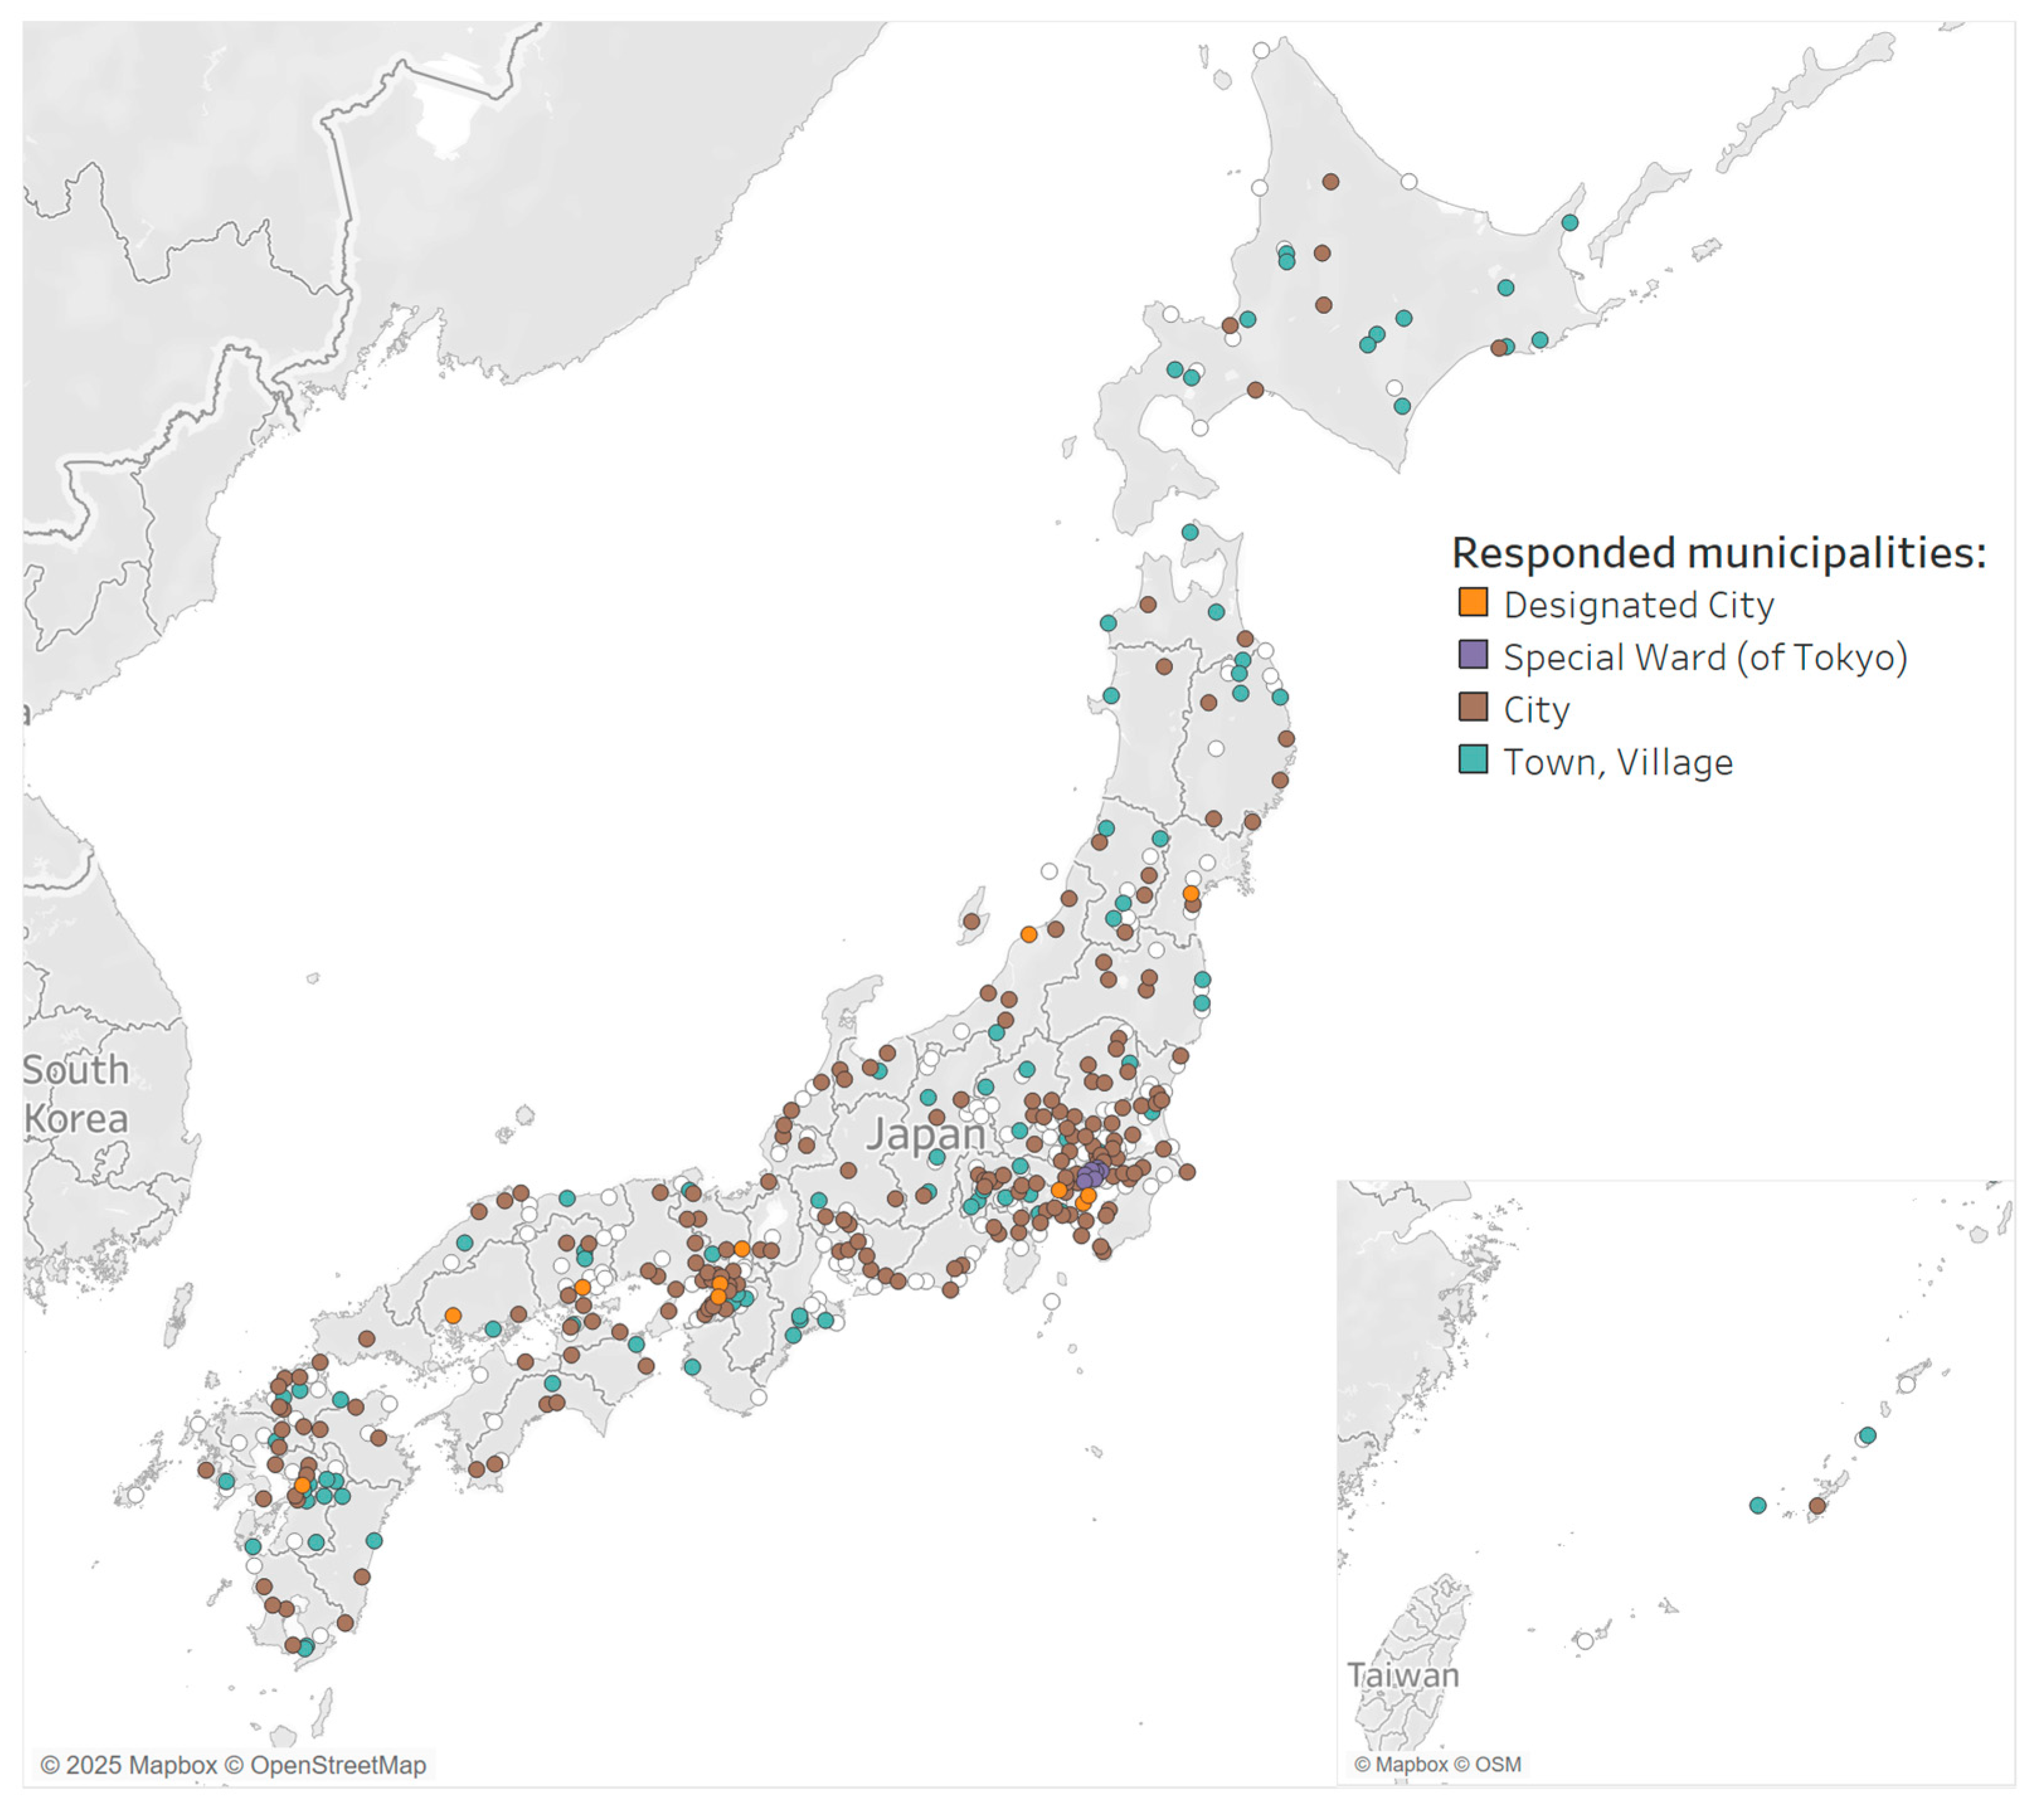
2.2. Survey Design and Implementation
3. Results
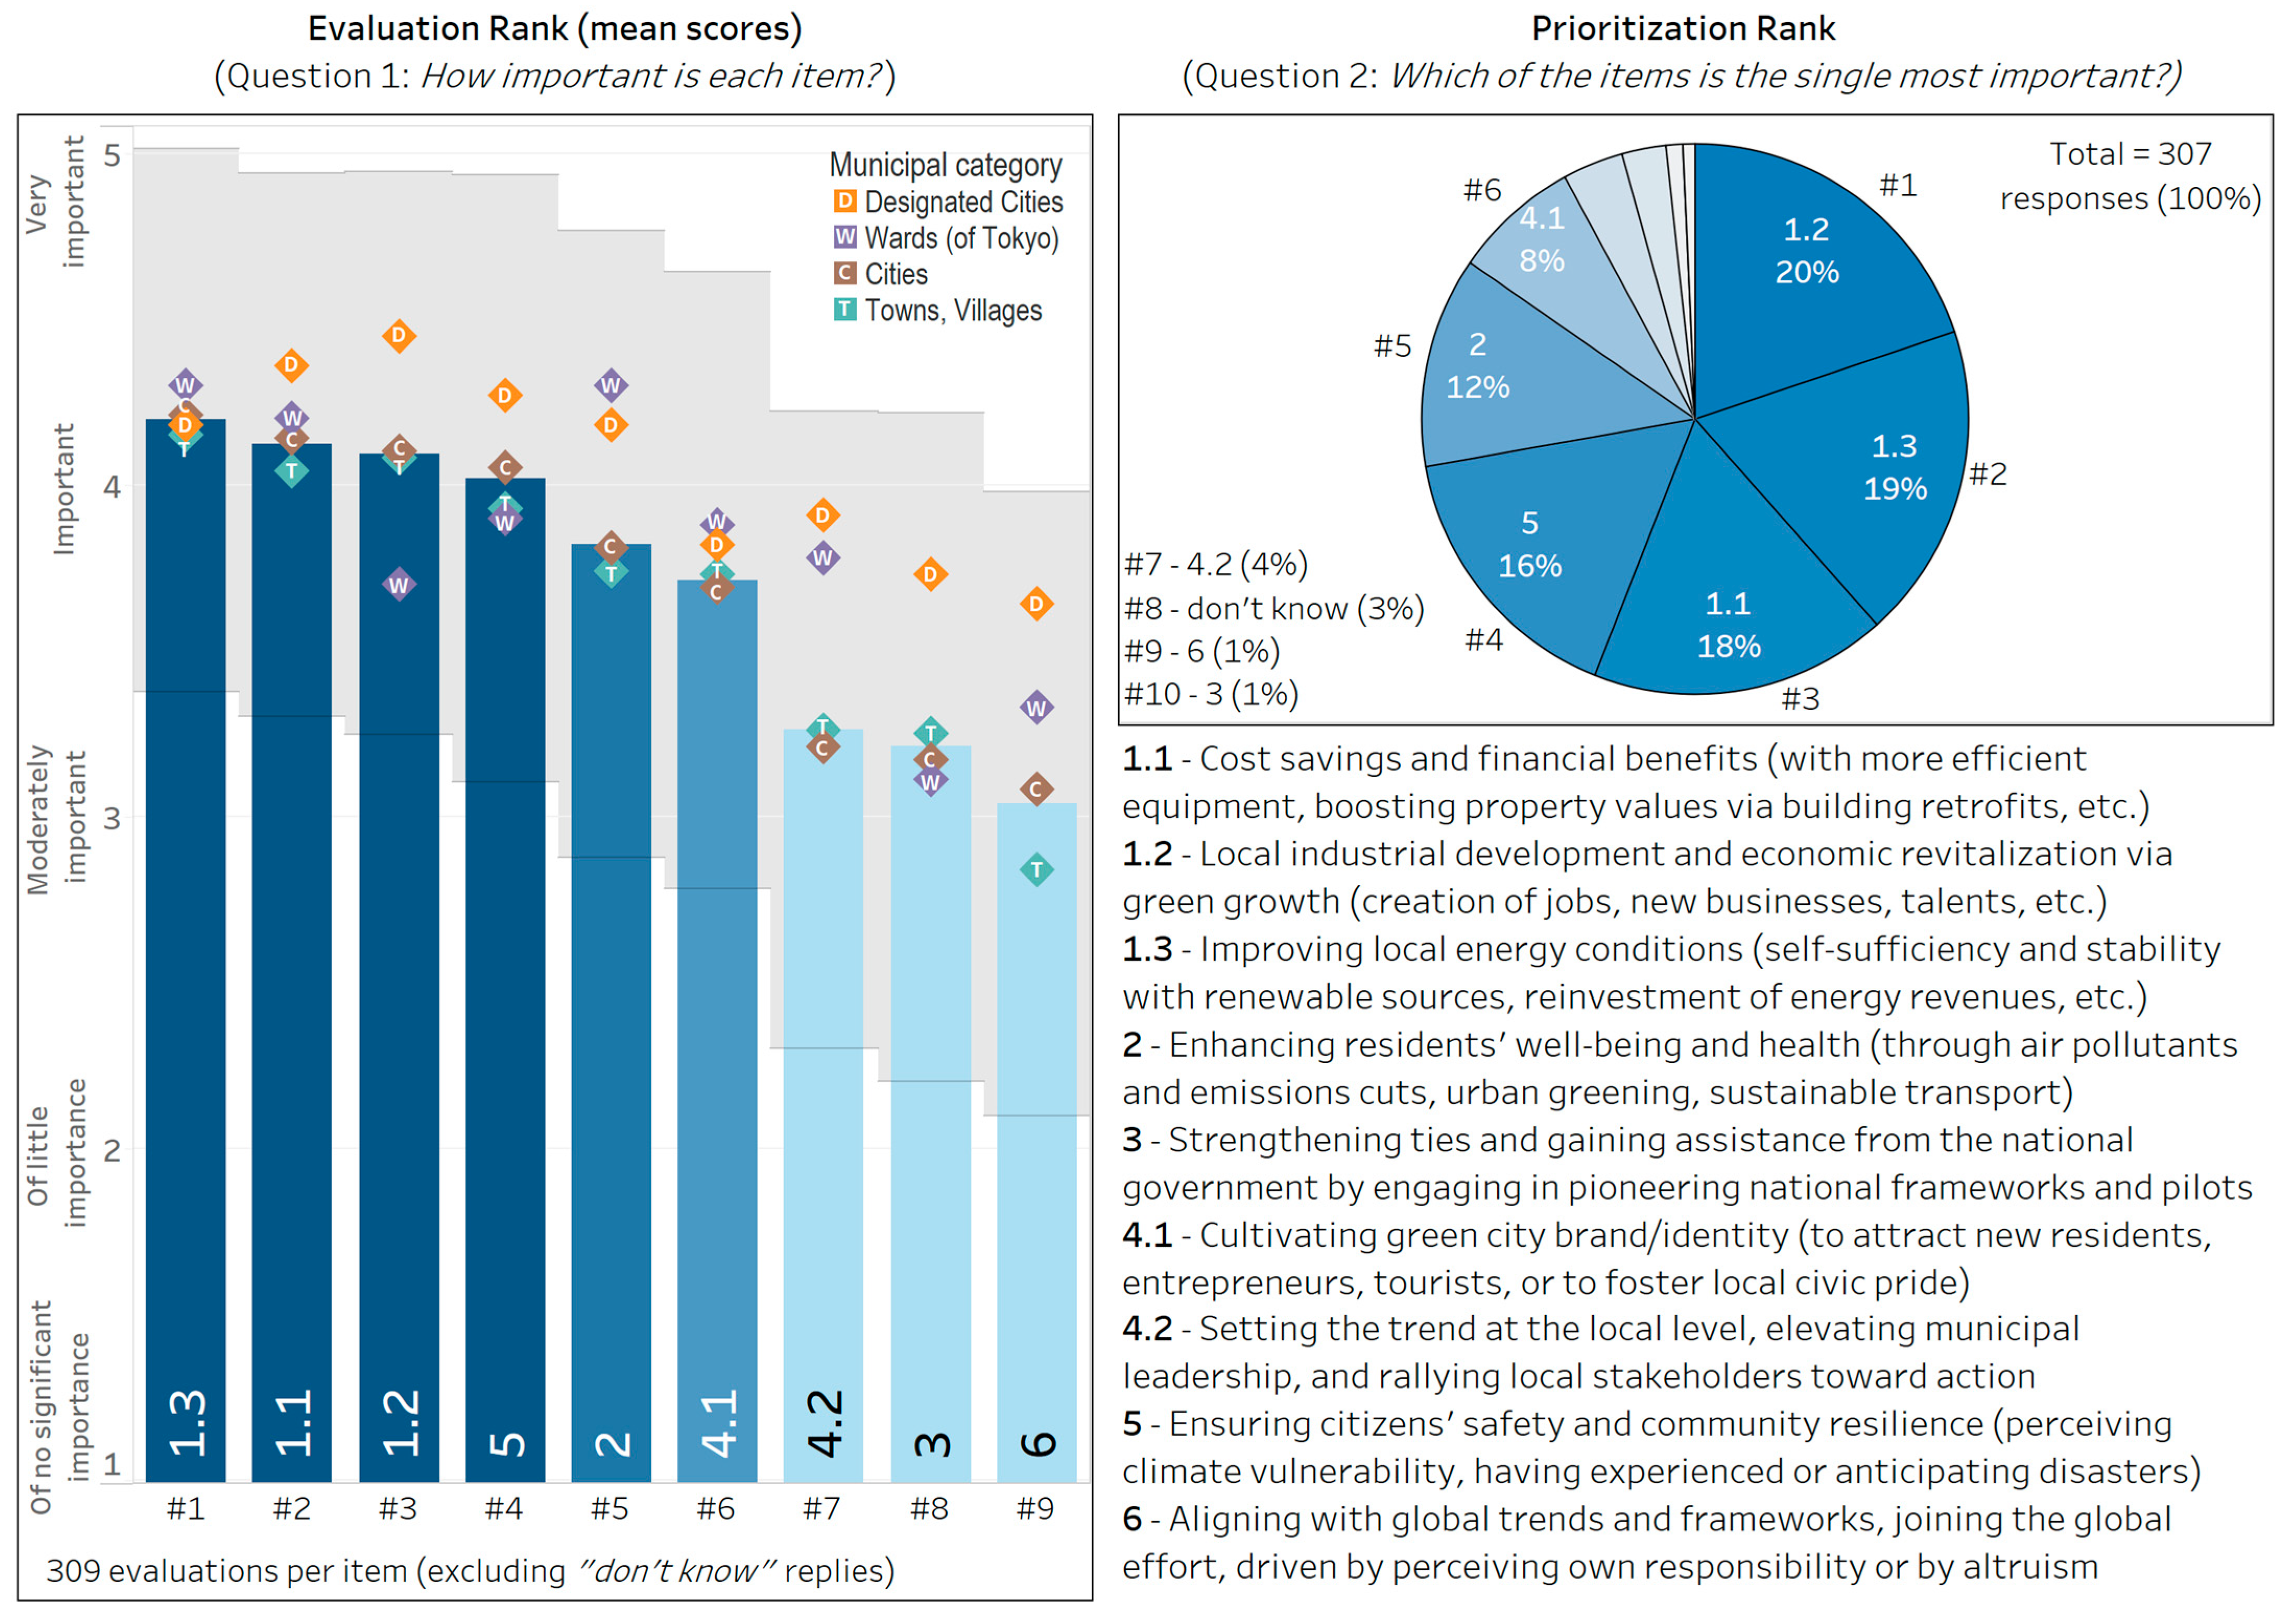
3.1. Motivations
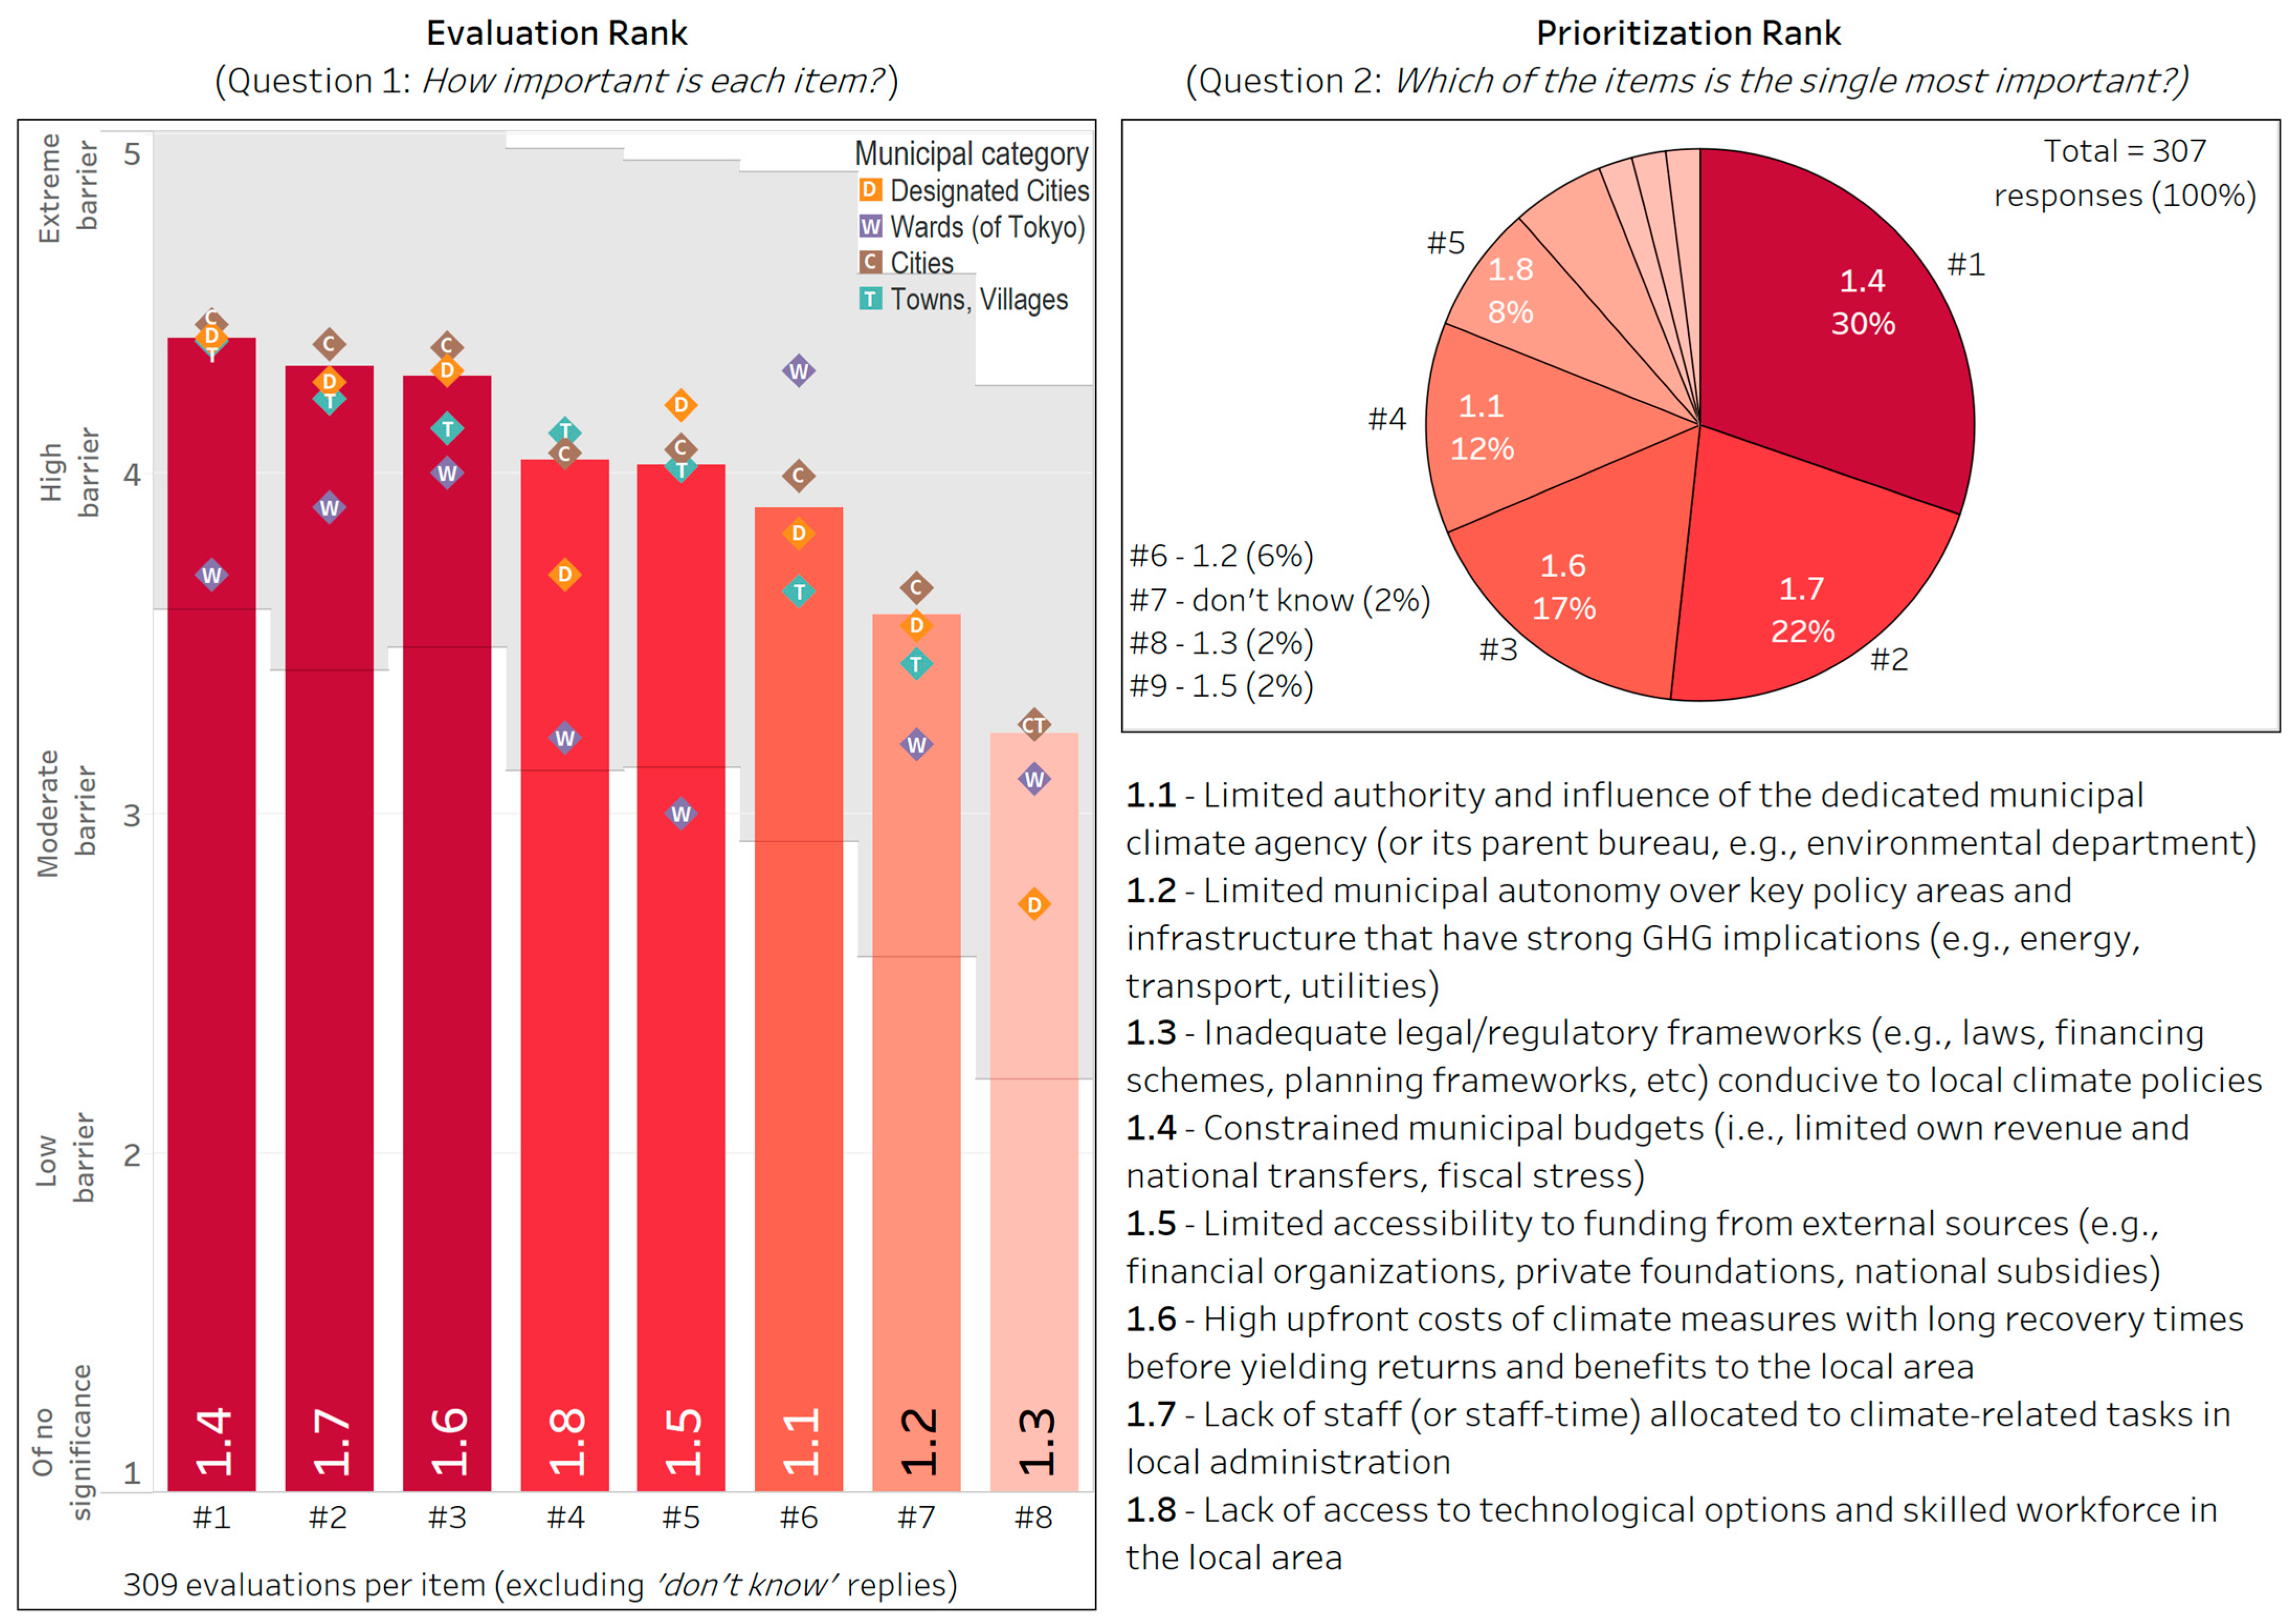
3.2. Barriers
3.2.1. Category I: Municipal Capacity Constraints—Authority and Resources
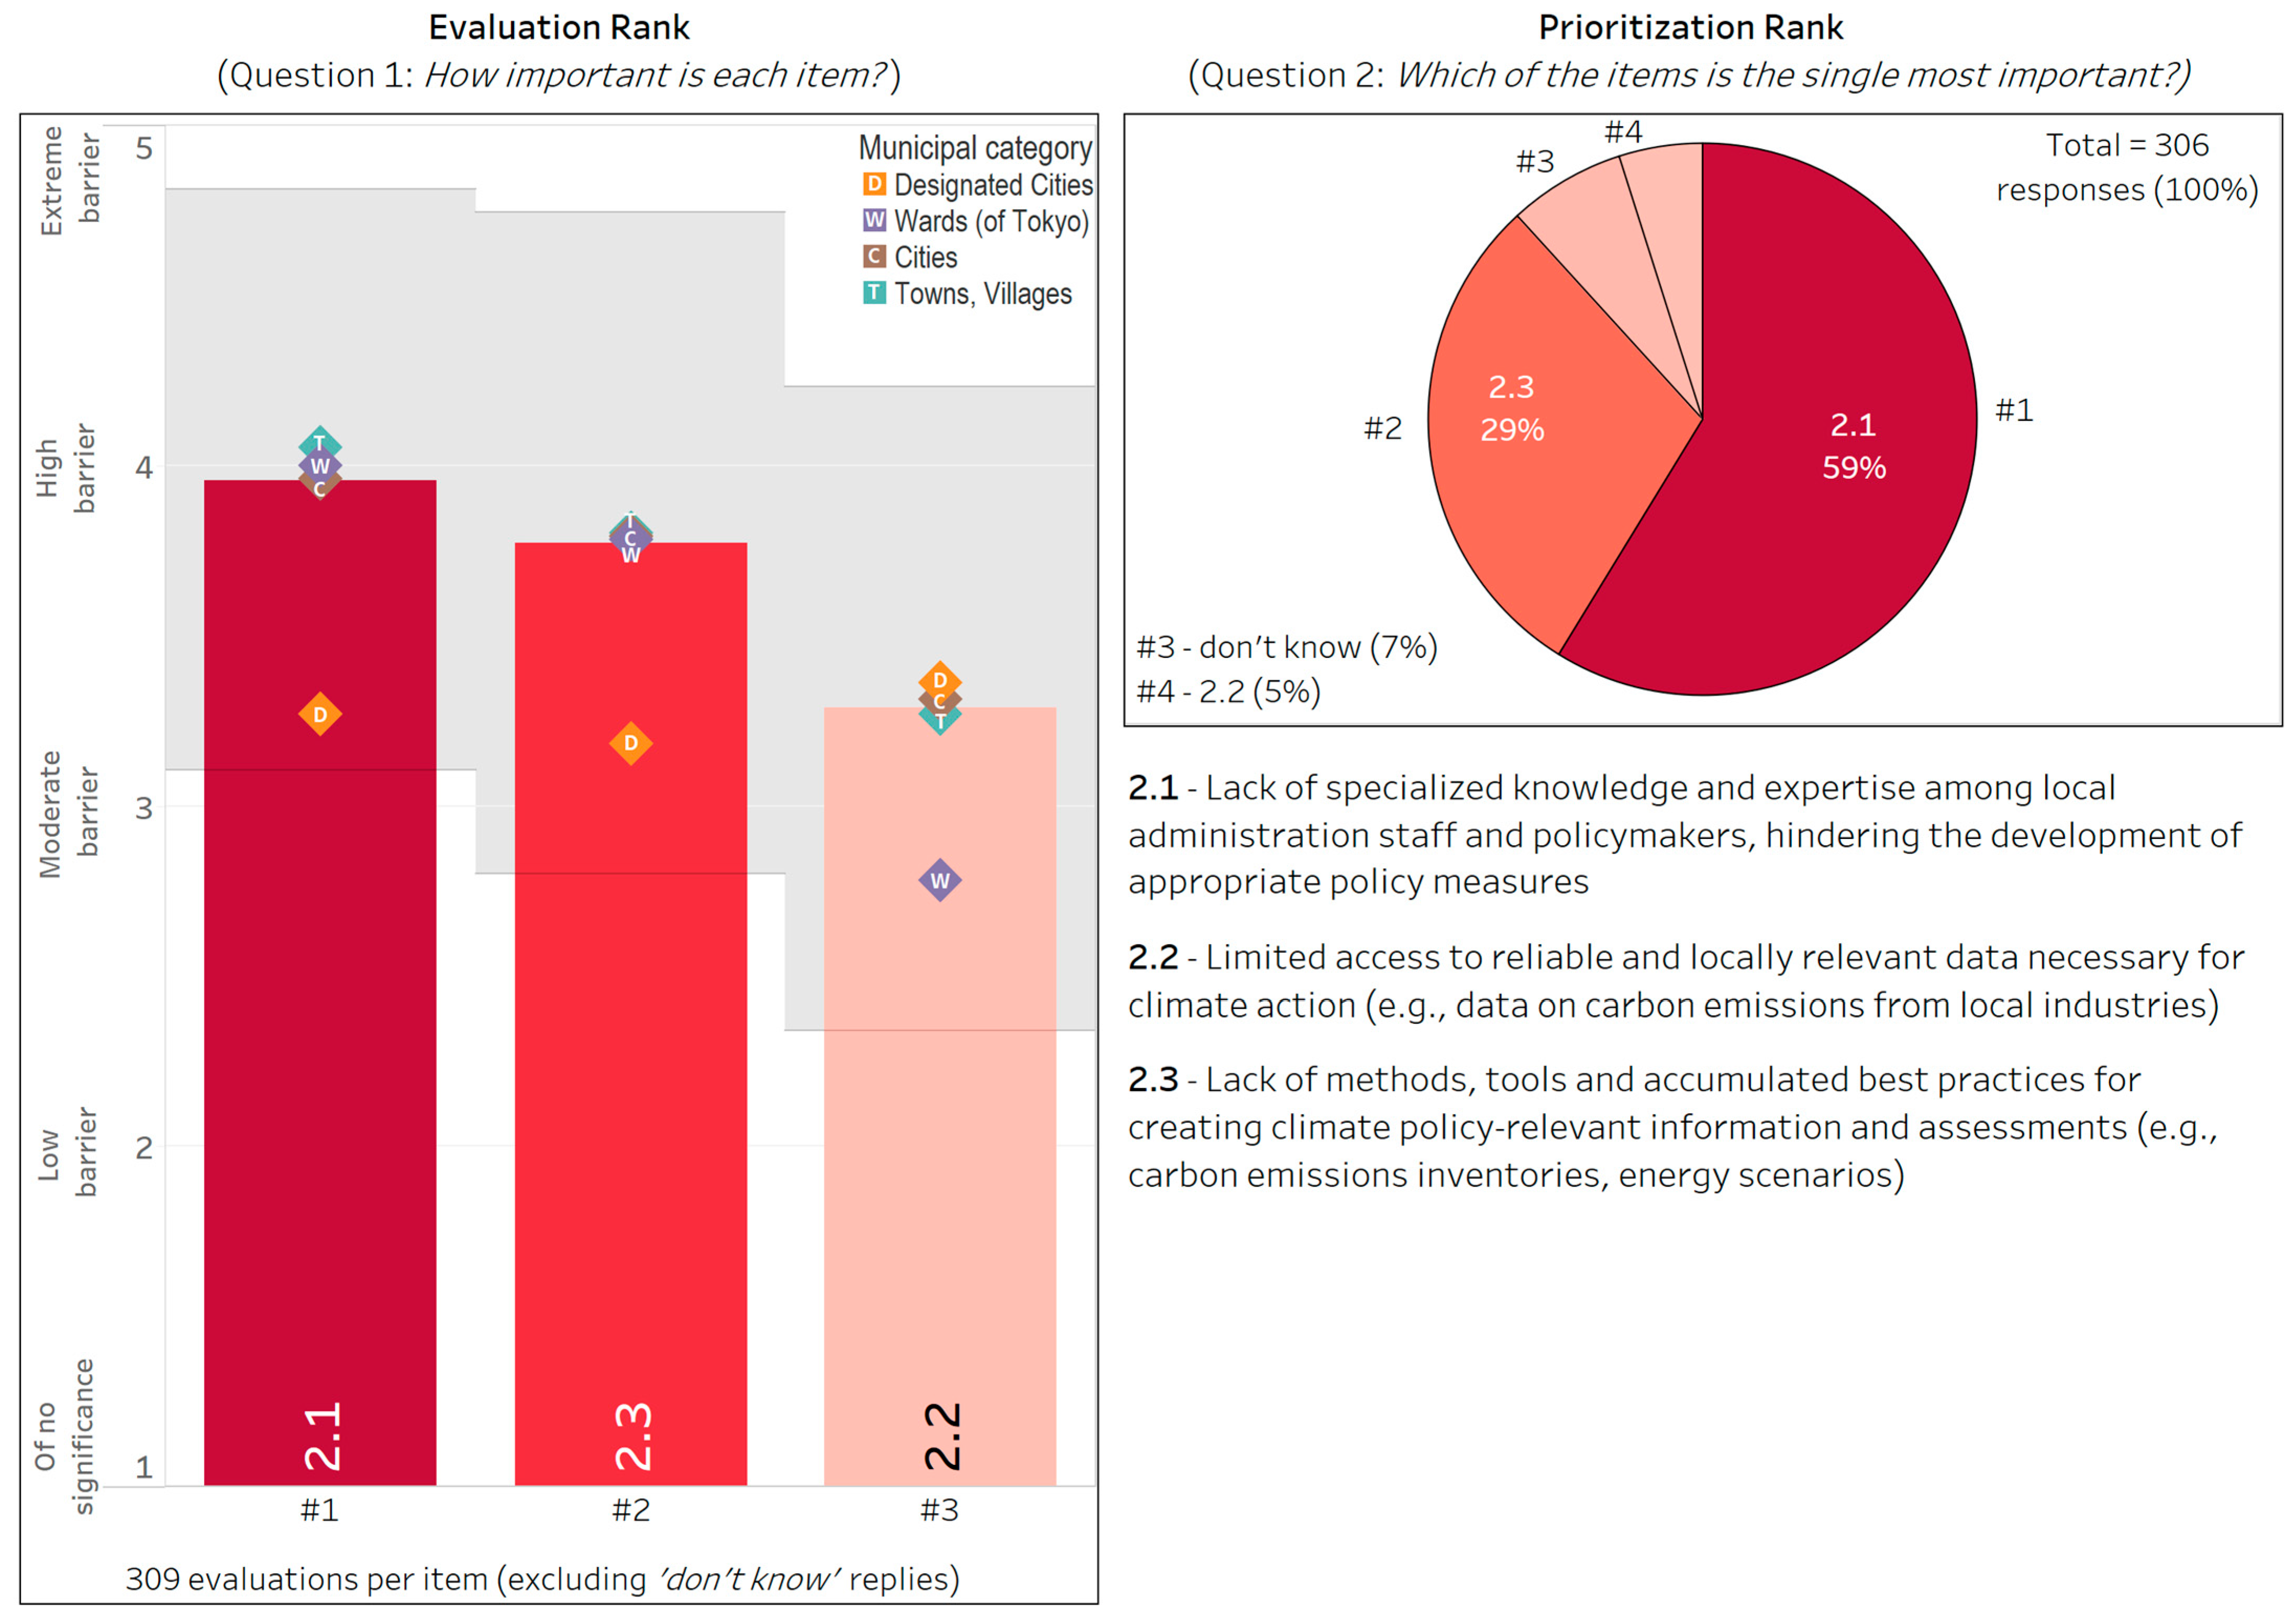
3.2.2. Category II: Municipal Capacity Constraints—Knowledge and Expertise
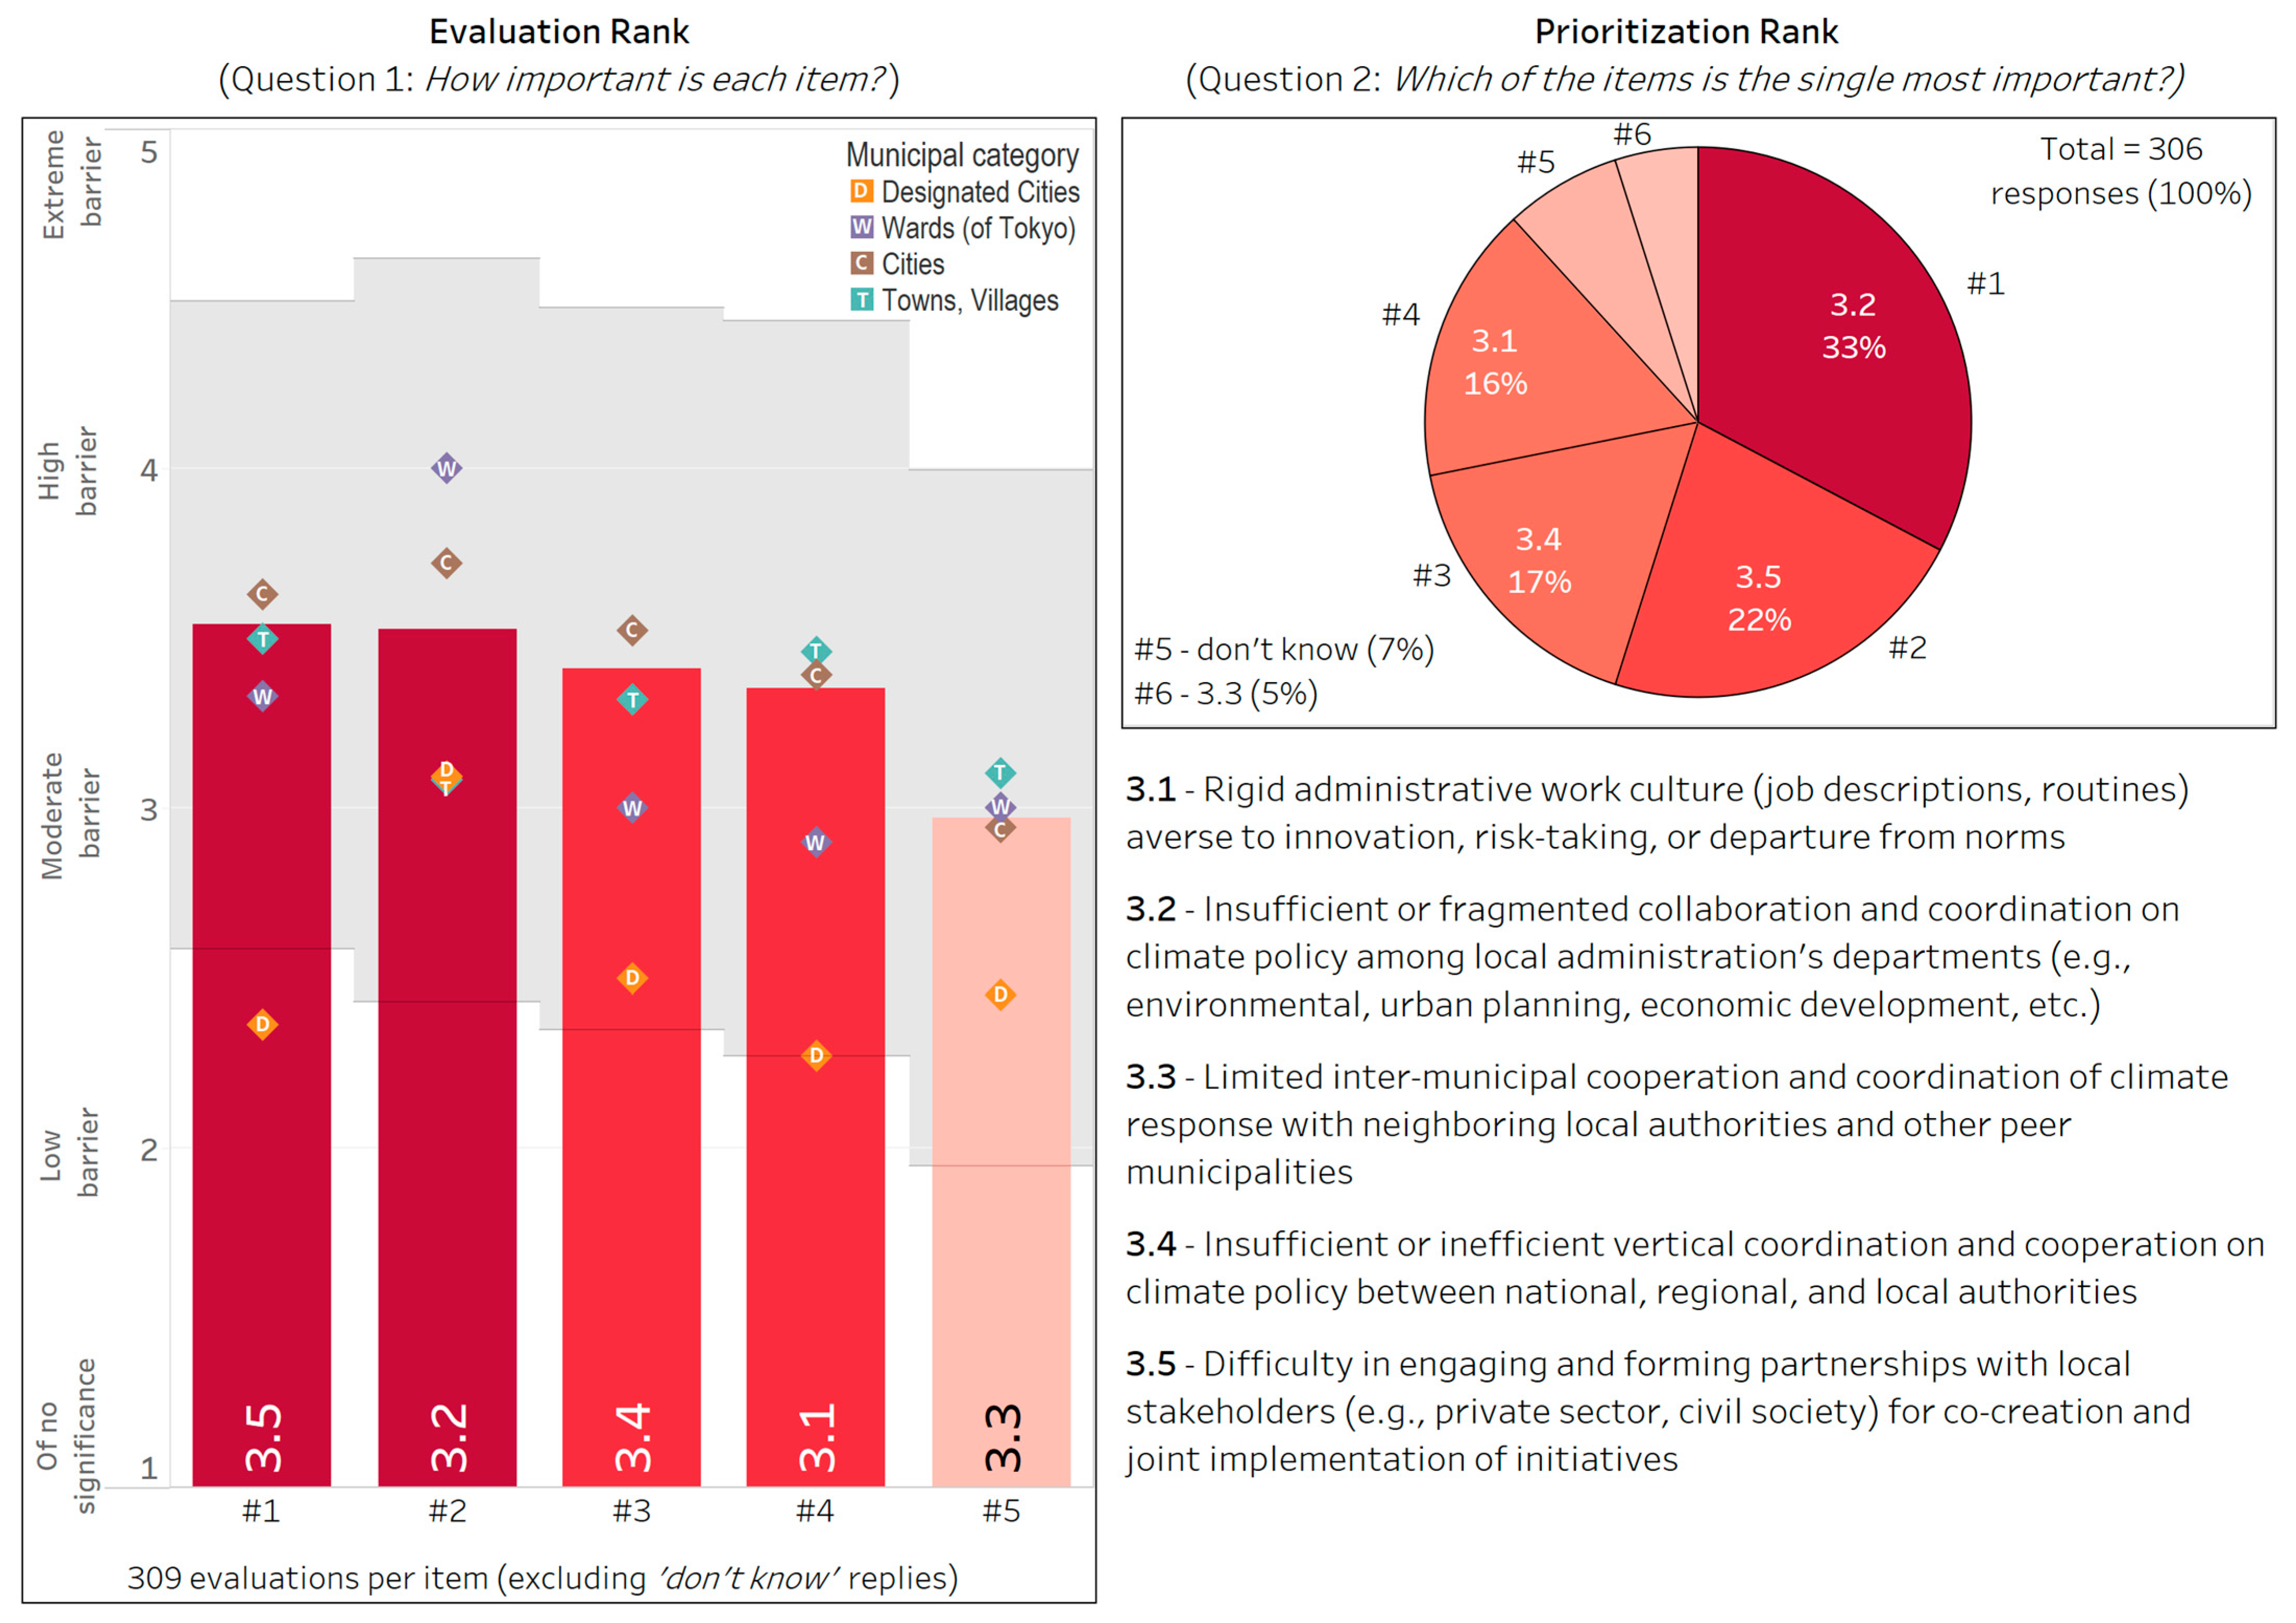
3.2.3. Category III: Institutional Coherence and Coordination Constraints
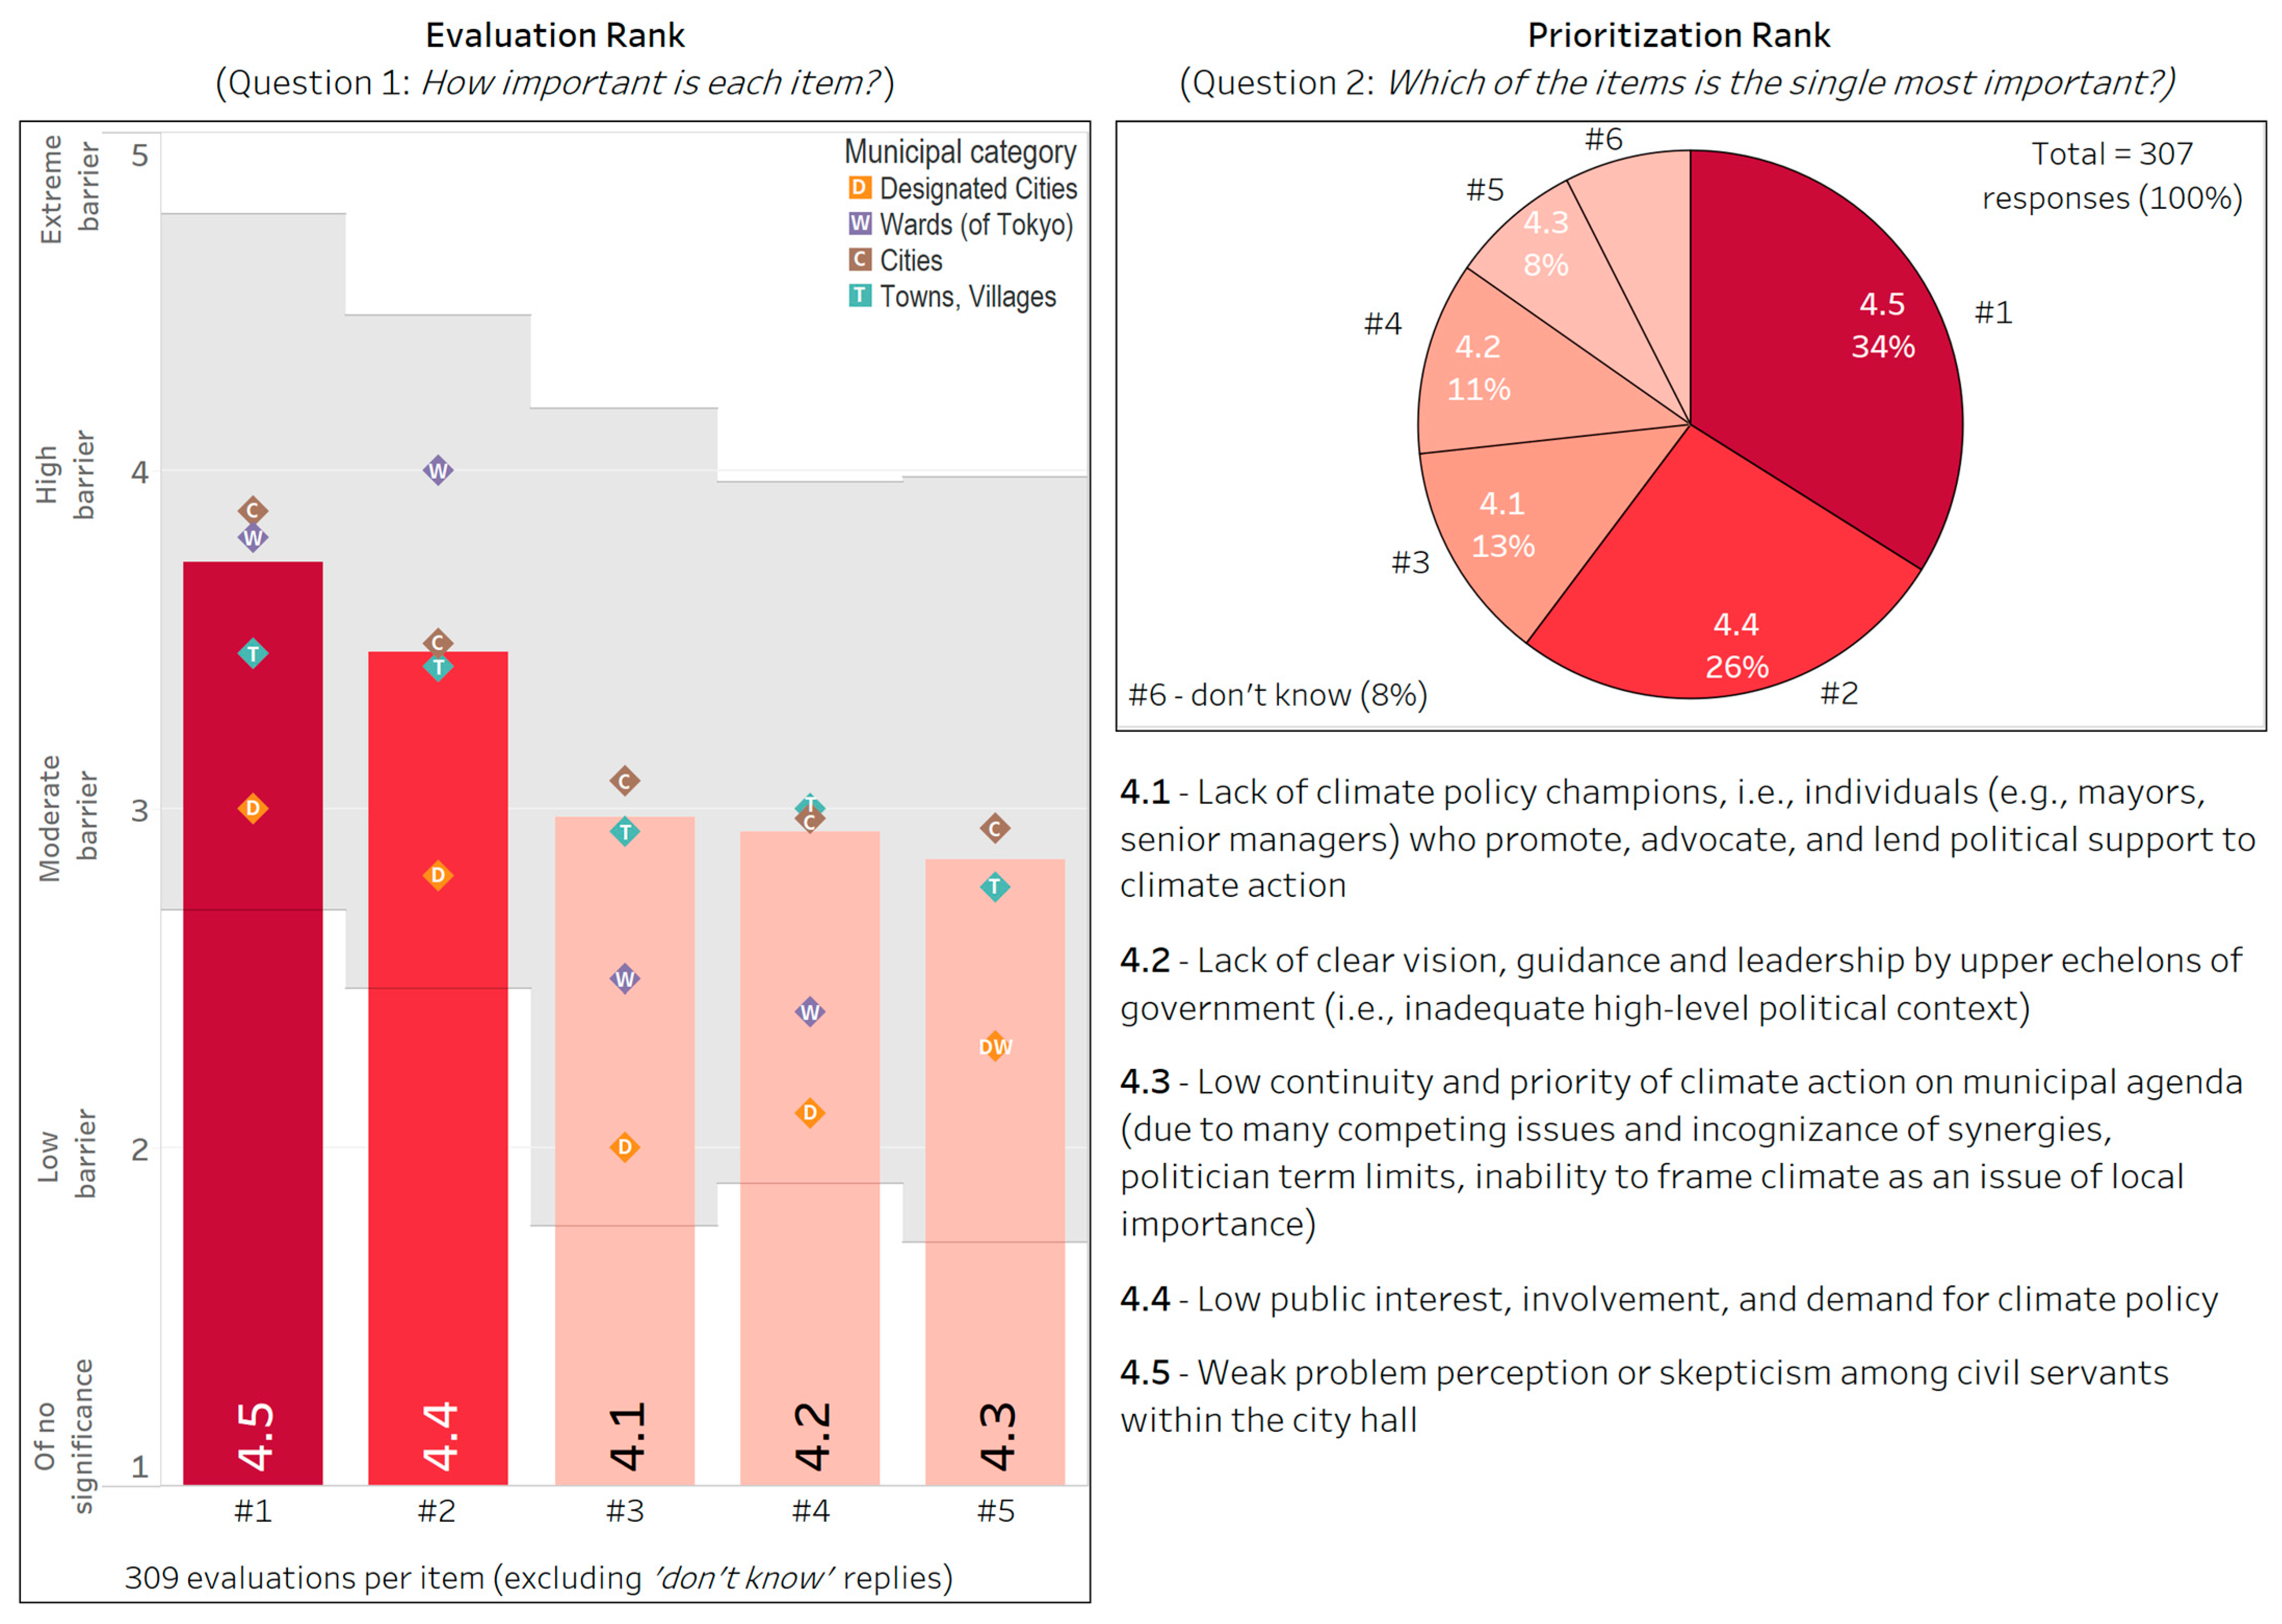
3.2.4. Category IV: Insufficient Leadership and Political Will
3.3. Enablers
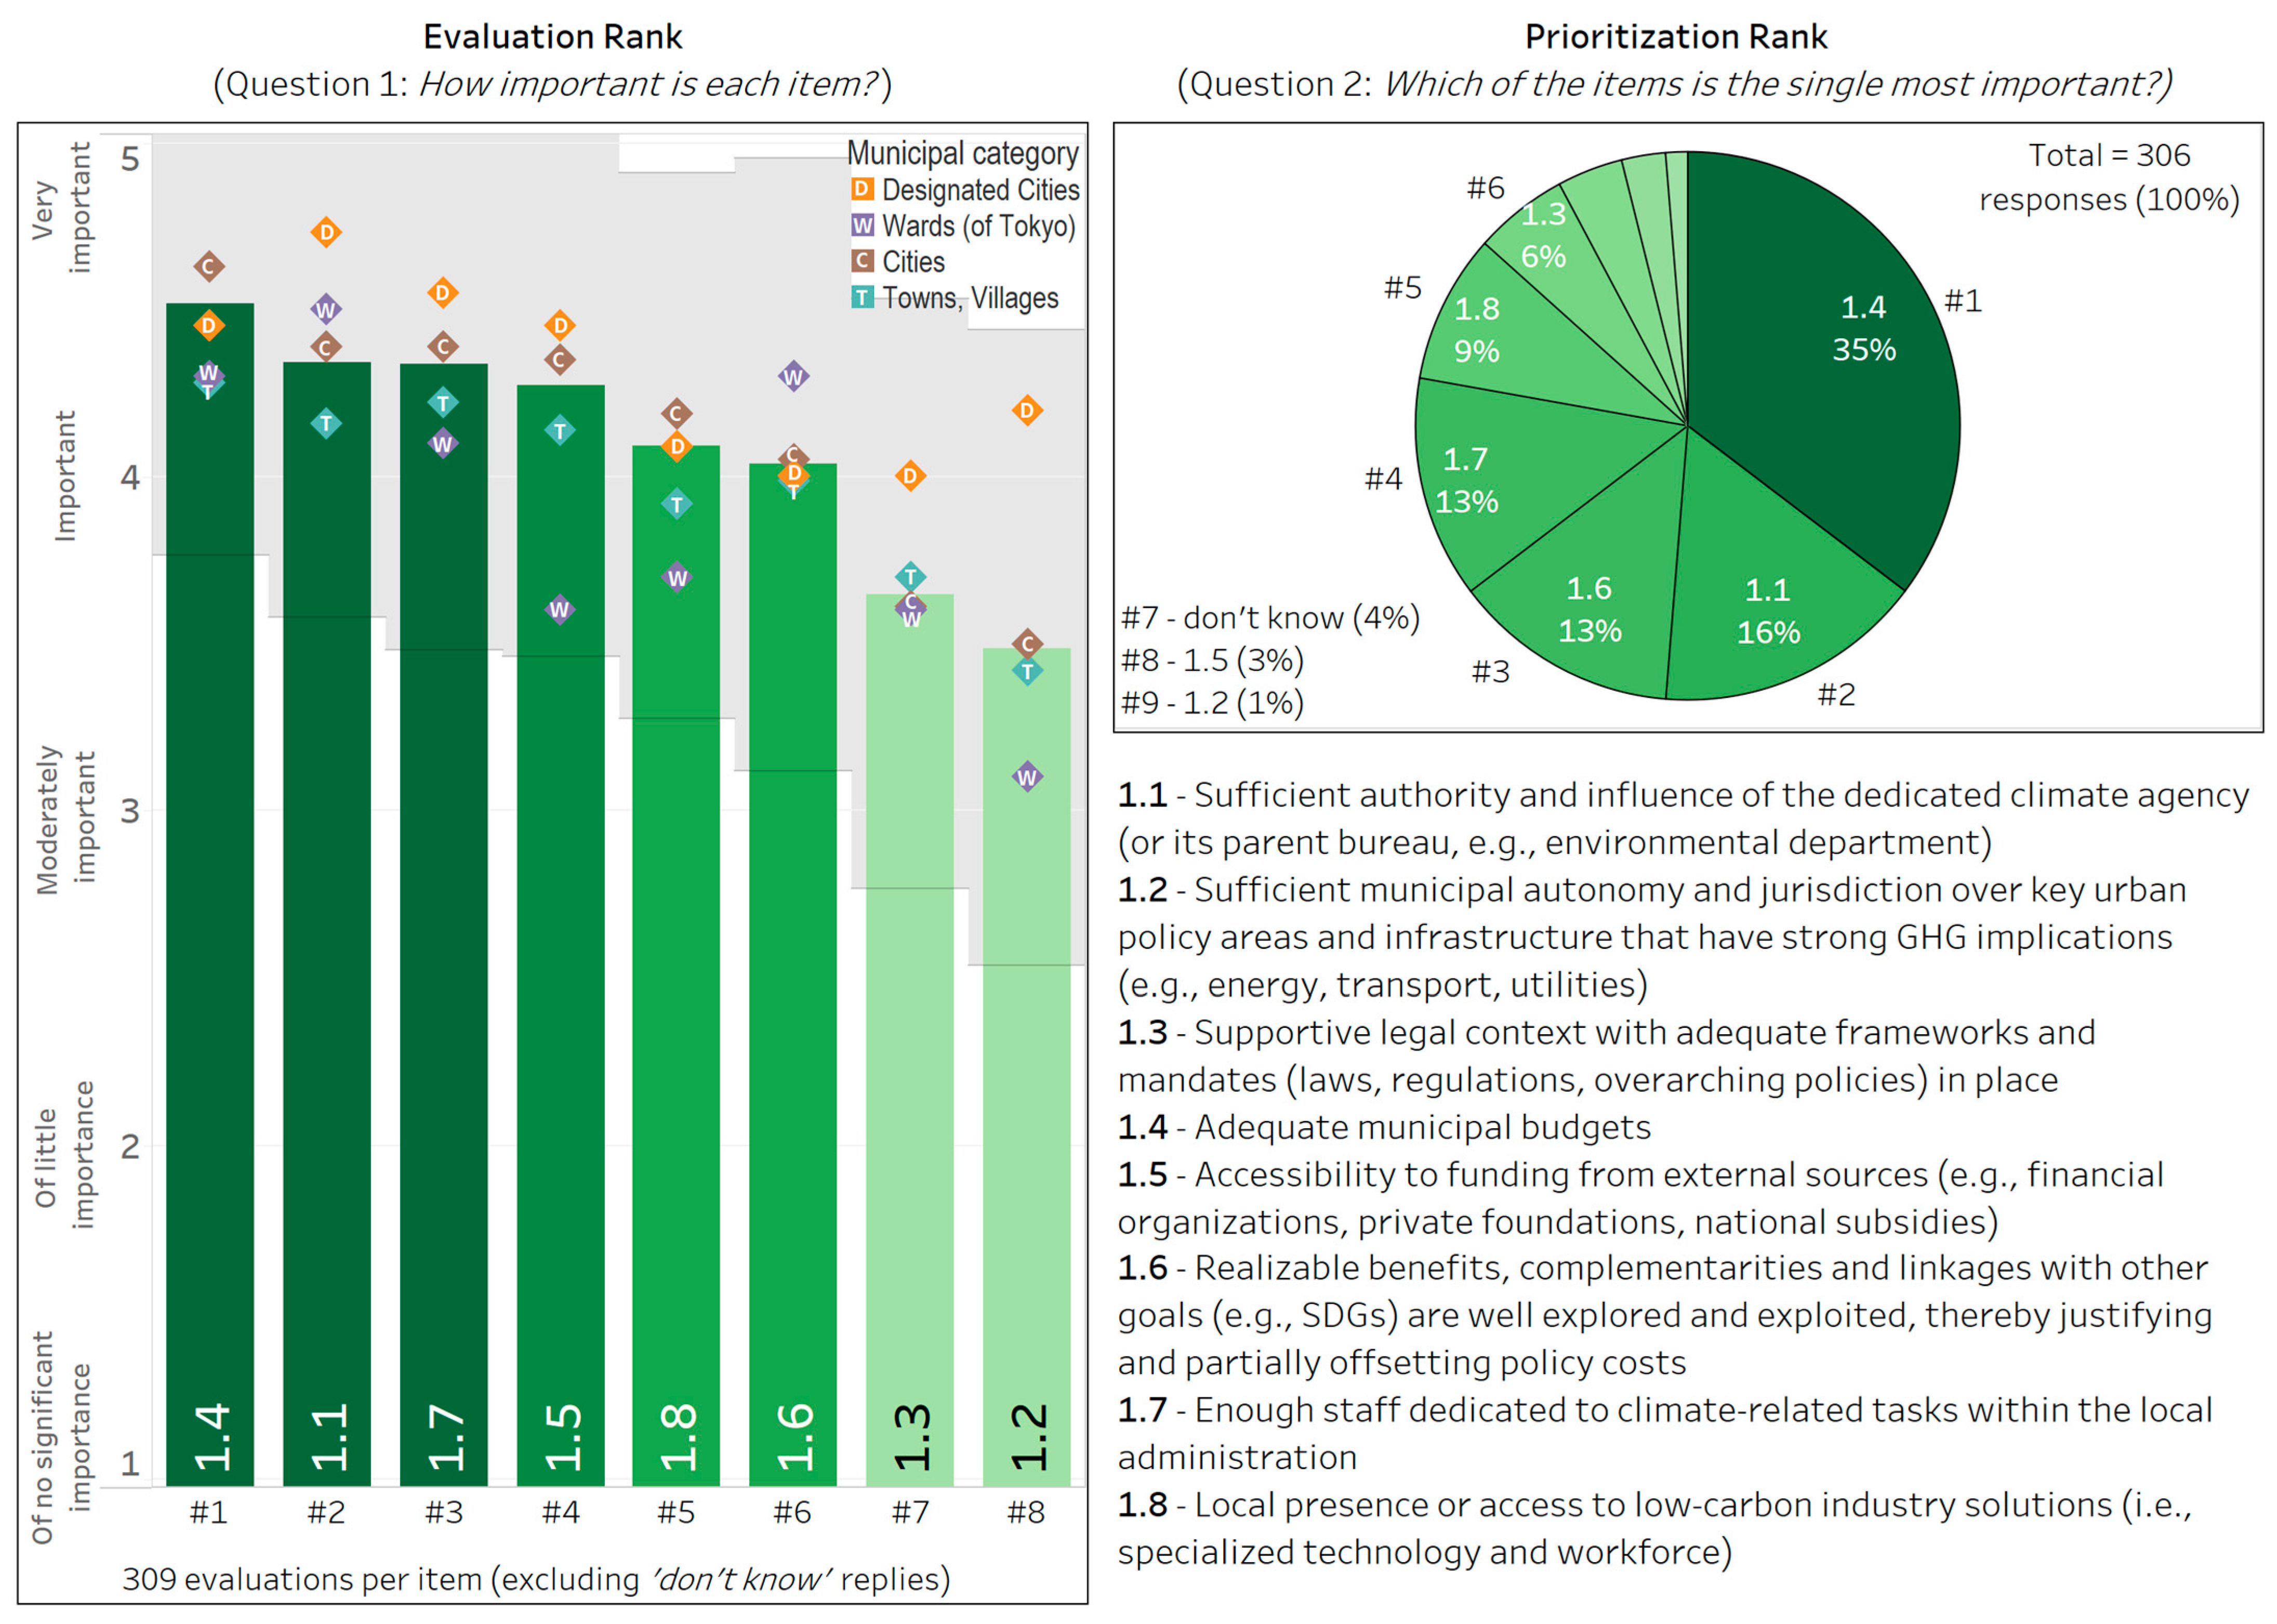
3.3.1. Category I: Municipal Capacity Enablers—Authority and Resources
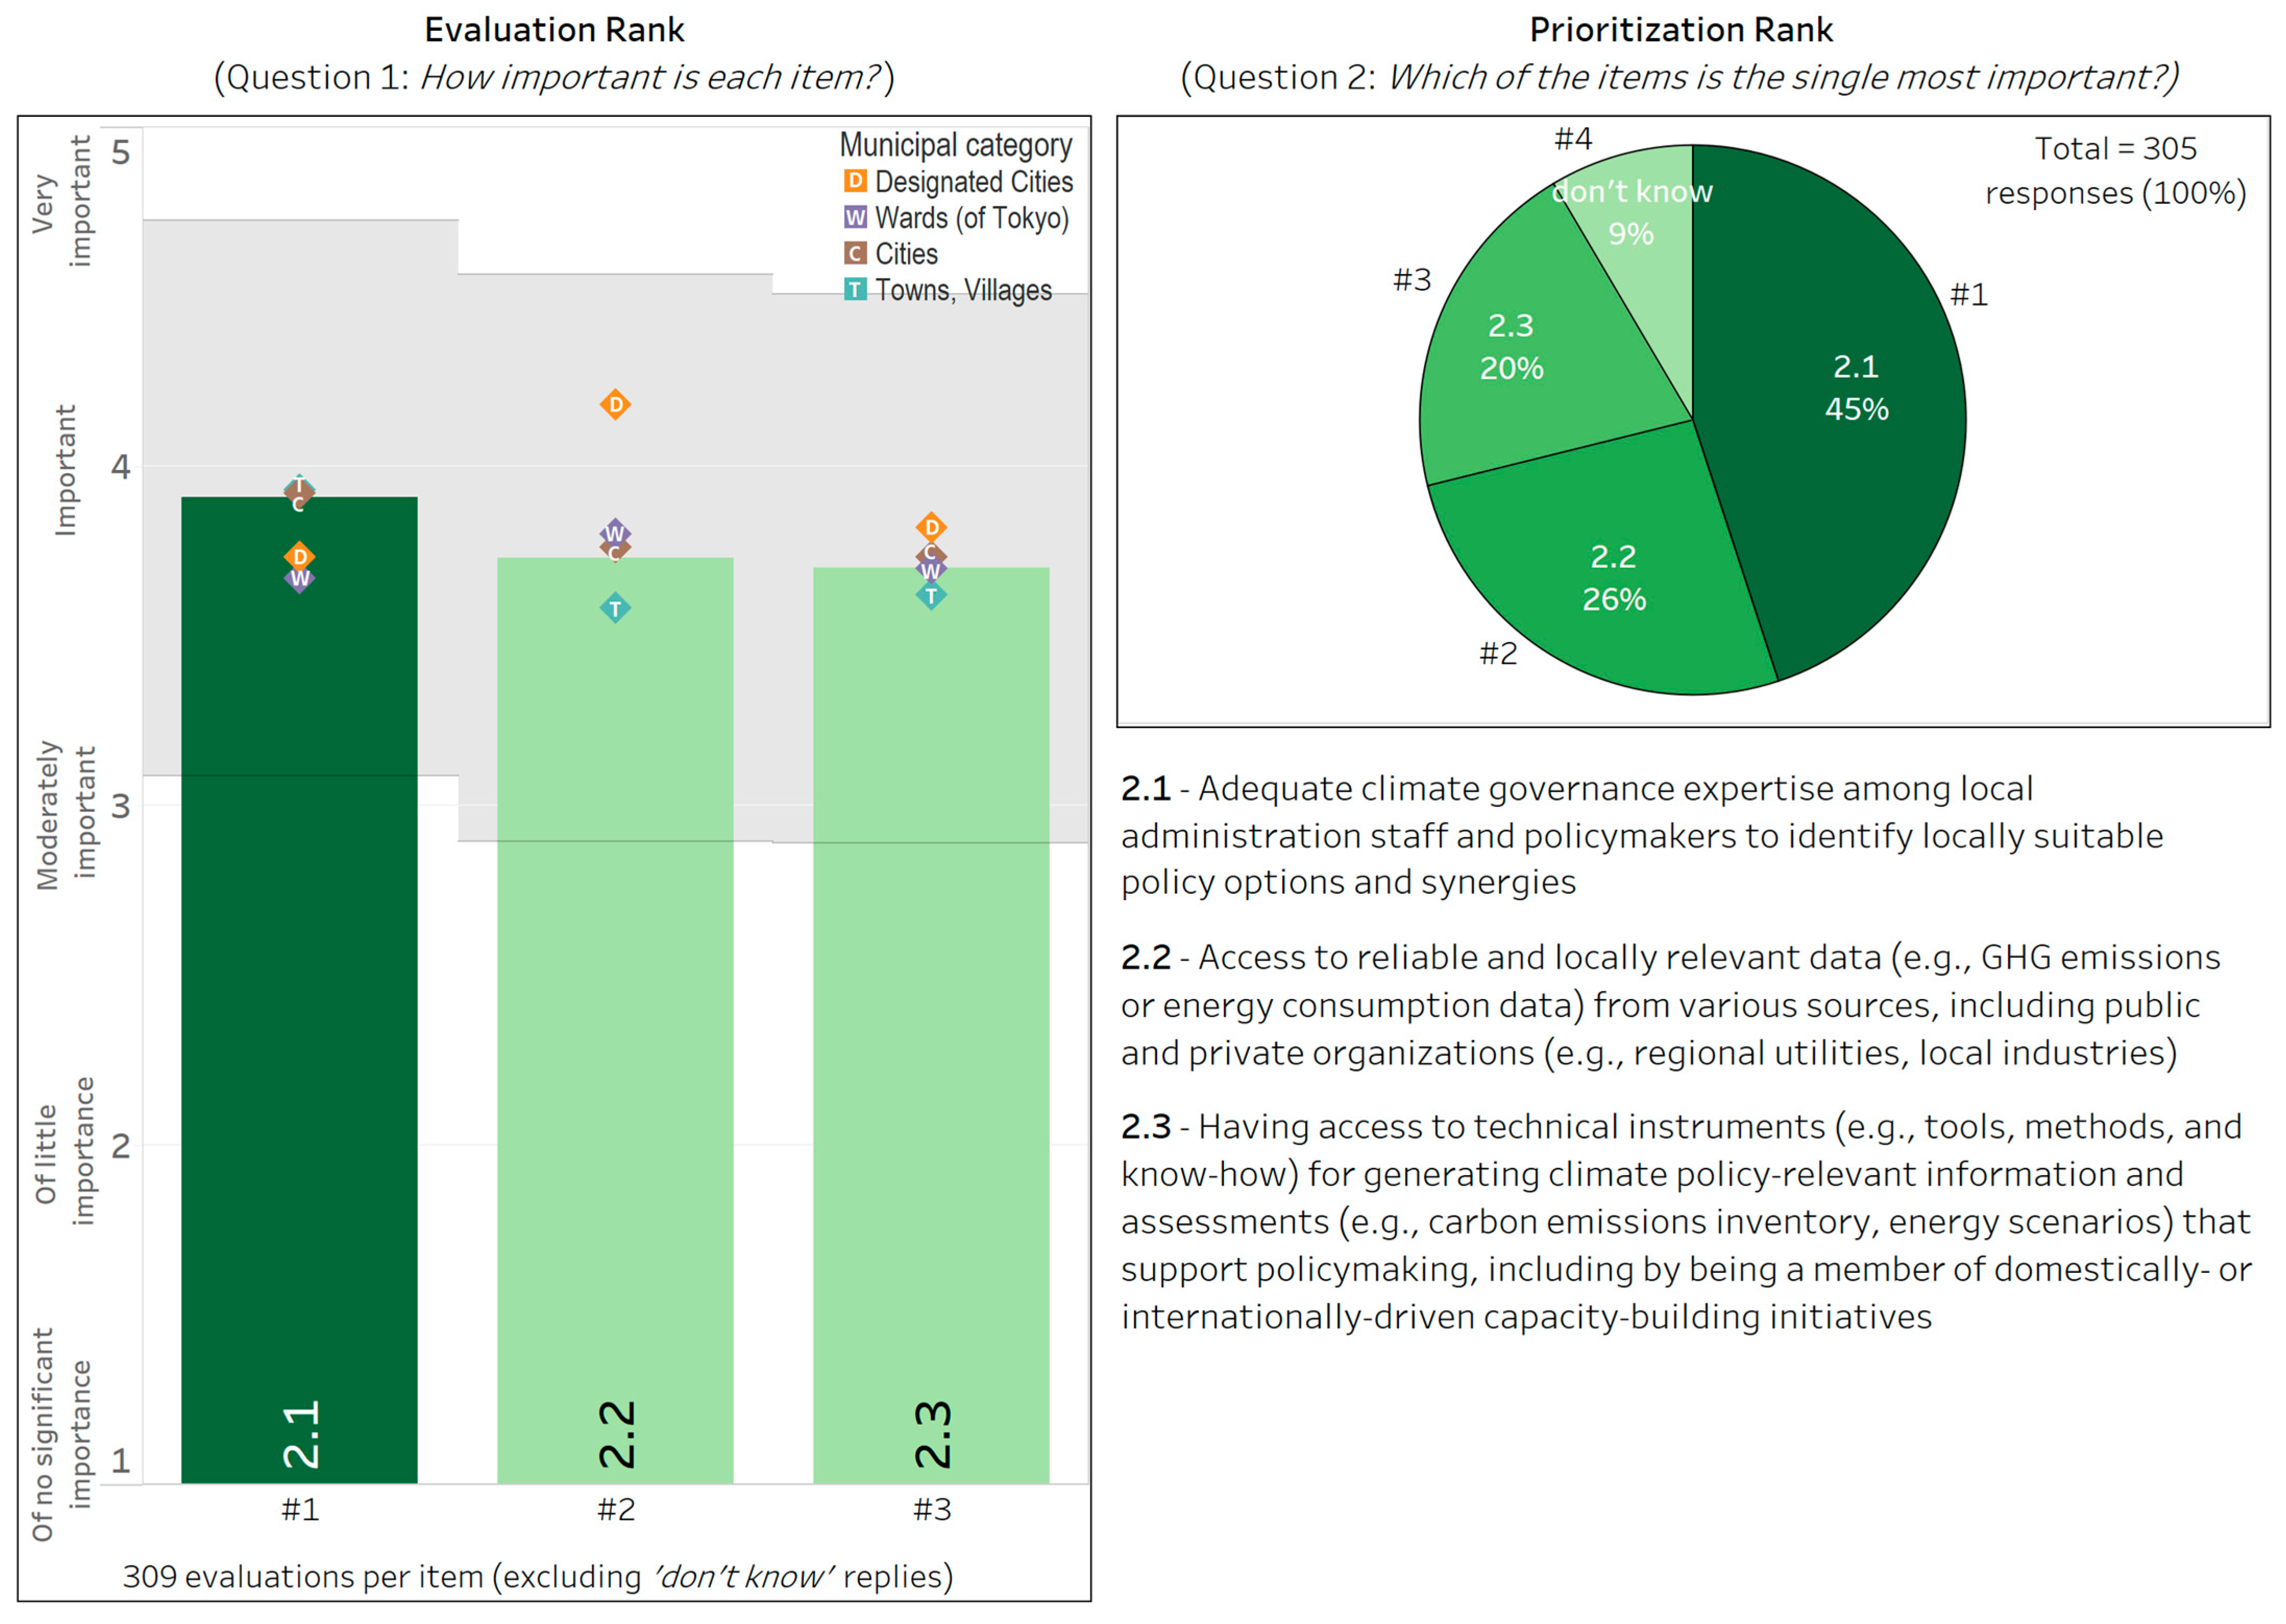
3.3.2. Category II: Municipal Capacity Enablers—Knowledge and Expertise
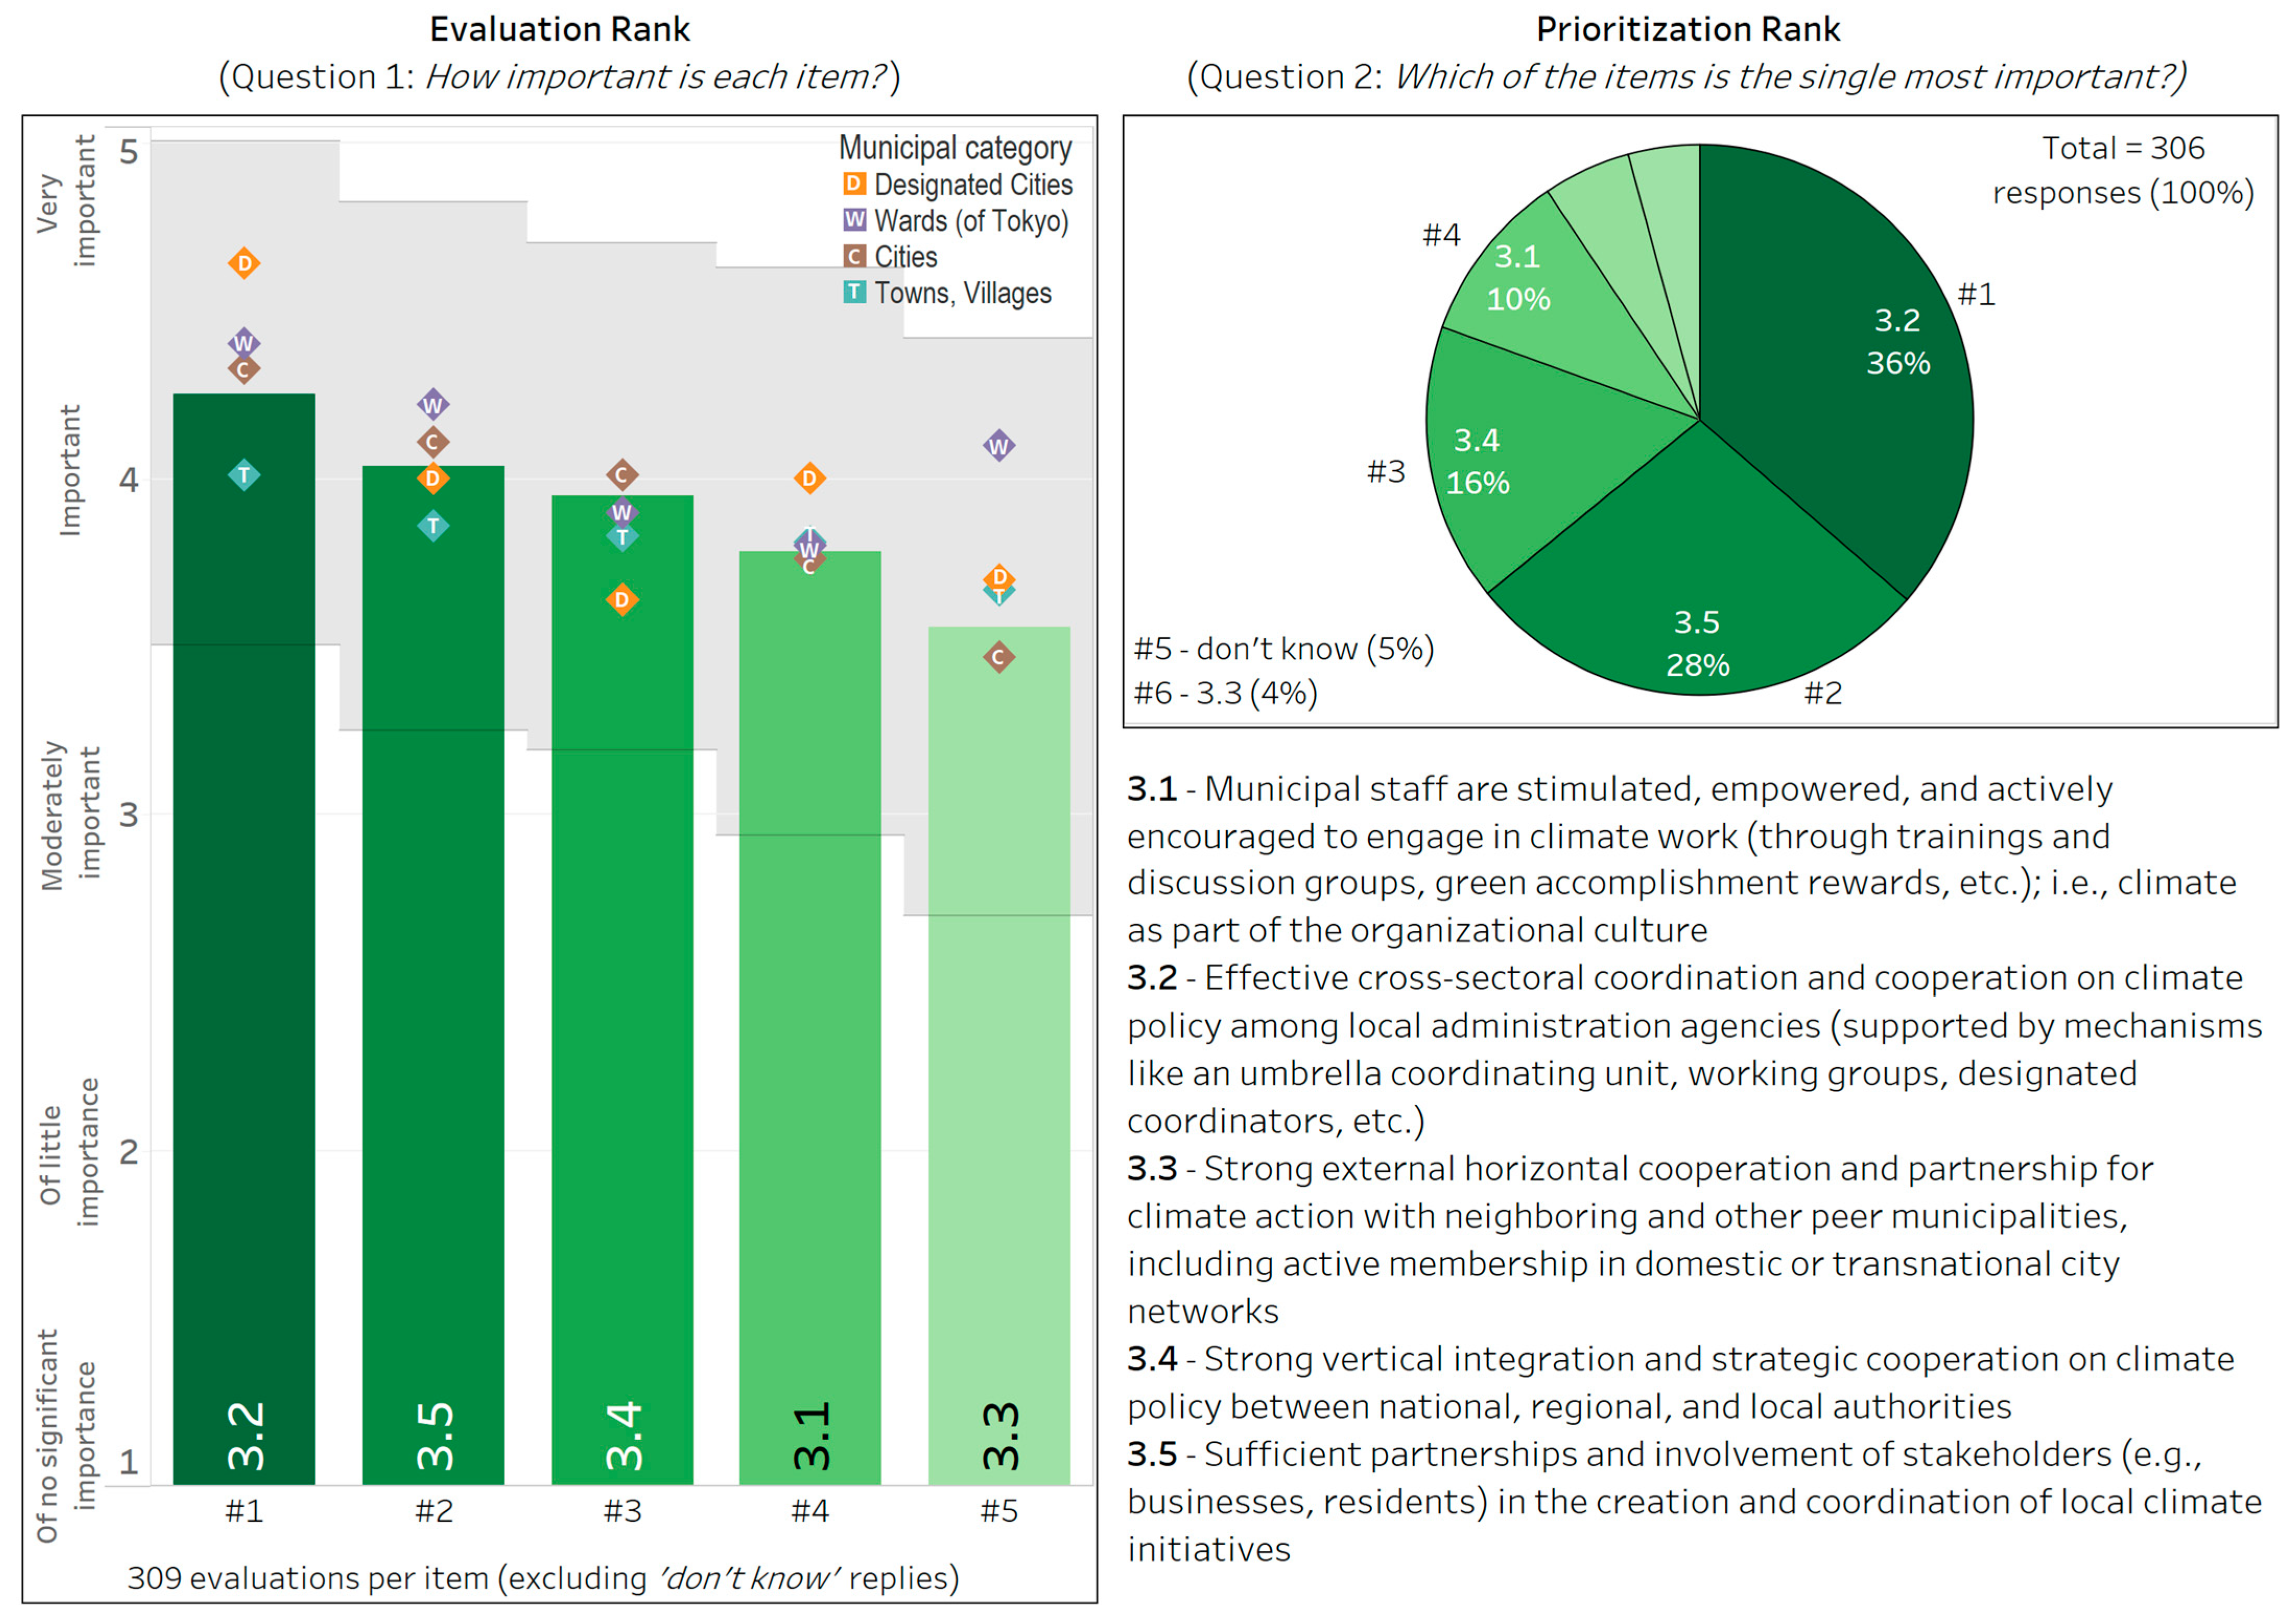
3.3.3. Category III: Institutional Coherence and Coordination
3.3.4. Category IV: Strong Political Will and Leadership
4. Discussion and Implications
4.1. Major Motivations
4.1.1. Dominance of Economic Motivations and Space for Broader Motivational Perspectives
4.1.2. Embracing Local Aspirations
4.2. Major Barriers and Enablers
4.2.1. Municipal Capacity for Net Zero (I): Budgets, Staff, and Climate Teams’ Authority
4.2.2. Municipal Capacity for Net Zero (II): A Critical Human Expertise Factor
4.2.3. Cooperation for Net Zero: City Units’ Collaboration and Stakeholder Involvement
4.2.4. Political Will for Net Zero: Champions, Executive Awareness, and Citizen Support
4.3. Applicability Beyond Japan
5. Conclusions
Supplementary Materials
Author Contributions
Funding
Data Availability Statement
Acknowledgments
Conflicts of Interest
Abbreviations
| MBE | Motivations, barriers, and enablers |
| IPCC | Intergovernmental Panel on Climate Change |
| IGES | Institute for Global Environmental Strategies |
| ICLEI | International Council of Local Environmental Initiatives |
| GHG | Greenhouse gas |
Appendix A
Correlation Analysis

| Factor 1 | Factor 2 | Correlation Values |
|---|---|---|
| B1.2. Limited municipal autonomy over key policy areas and infrastructure | B1.3. Inadequate legal/regulatory frameworks | 0.558 (p < 0.05) n = 294 |
| B1.4. Constrained municipal budgets | B1.5. Limited accessibility to funding from external sources | 0.667 (p < 0.05) n = 295 |
| B2.2. Limited access to reliable and locally relevant data necessary for climate action | B2.3. Lack of methods, tools, and best practices for creating climate policy-relevant information and assessments | 0.518 (p < 0.05) n = 302 |
| B3.2. Insufficient inter-departmental collaboration and coordination on climate policy in the local administration | B4.5. Weak problem perception or skepticism within the city hall | 0.594 (p < 0.05) n = 302 |
| B3.4. Insufficient vertical coordination and cooperation between national, regional, and local authorities | B4.2. Lack of clear vision, guidance, and leadership by the upper echelons of government (high-level political context) | 0.542 (p < 0.05) n = 302 |
| B4.1. Lack of climate policy champions | E4.3. High priority, continuity, and favorability toward environmental action on local agenda | 0.515 (p < 0.05) n = 301 |
| B4.3. Low continuity and priority of climate action on municipal agenda | E4.1. Presence of dedicated climate policy champions among local leaders | 0.544 (p < 0.05) n = 296 |
| E1.1. Sufficient authority and influence of the dedicated climate agency | 1.7. Enough staff dedicated to climate-related tasks within the local administration | 0.517 (p < 0.05) n = 293 |
| E1.5. Accessibility to funding from external sources | E1.4. Adequate municipal budgets | 0.626 (p < 0.05) n = 283 |
| E1.7. Enough staff dedicated to climate-related tasks within the local administration | E1.8. Local access to low-carbon solutions (e.g., technology and workforce) | 0.506 (p < 0.05) n = 304 |
| E3.1. Municipal staff are stimulated, empowered, and actively encouraged to engage in climate work (climate-conducive administrative work culture) | E3.2. Effective cross-sectoral coordination and cooperation on climate policy among local administration agencies | 0.736 (p < 0.05) n = 304 |
| E3.4. Effective vertical climate governance across all government levels (national, regional, local) | E3.5. Strong stakeholder engagement (e.g., businesses, residents) in local climate action | 0.548 (p < 0.05) n = 298 |
| E3.5. Strong stakeholder engagement (e.g., businesses, residents) in local climate action | E4.4. Citizens exhibiting high interest and demand for climate policy | 0.528 (p < 0.05) n = 304 |
| E4.3. High priority, continuity, and favorability toward environmental action on local agenda | E4.4. Citizens exhibiting high interest and demand for climate policy | 0.511 (p < 0.05) n = 300 |
| Barrier–Enabler Pairs (Conceptual Opposites) | Correlation Values |
|---|---|
| B1.1—E1.1 (Limited/Sufficient) authority and influence of the dedicated municipal climate agency | 0.282 (p < 0.05) n = 303 |
| B1.2—E1.2 (Limited/Sufficient) municipal autonomy over key policy areas and infrastructure that have strong GHG implications | 0.277 (p < 0.05) n = 295 |
| B1.3—E1.3 (Inadequate/Supportive) legal/regulatory frameworks | 0.354 (p < 0.05) n = 292 |
| B1.4—E1.4 (Constrained/Adequate) municipal budgets | 0.518 (p < 0.05) n = 302 |
| B1.5—E1.5 (Low/High) accessibility to funding from external sources | 0.483 (p < 0.05) n = 295 |
| B1.6—E1.6 (High upfront/Offset via synergies) policy costs | 0.267 (p < 0.05) n = 294 |
| B1.7—E1.7 (Lack of/Enough) staff or staff-time allocated to climate-related tasks in local administration | 0.594 (p < 0.05) n = 302 |
| B1.8—E1.8 (Limited/Adequate) access to technological options and skilled workforce in the local area | 0.355 (p < 0.05) n = 286 |
| B2.1—E2.1 (Lack of/Adequate) specialized knowledge and expertise among local administration staff | 0.340 (p < 0.05) n = 296 |
| B2.2—E2.2 (Limited/Adequate) access to reliable and locally relevant data necessary for climate action | 0.406 (p < 0.05) n = 299 |
| B2.3—E2.3 (Lack of/Adequate) methods, tools, and best practices for creating climate policy-relevant information and assessments | 0.312 (p < 0.05) n = 299 |
| B3.1—E3.1 (Risk-averse/Innovation-conducive) administrative work culture | 0.214 (p < 0.05) n = 299 |
| B3.2—E3.2 (Insufficient/Effective) inter-departmental collaboration and coordination on climate policy in the local administration | 0.393 (p < 0.05) n = 301 |
| B3.3—E3.3 (Limited/Strong) inter-municipal cooperation and coordination with neighboring and other peer local authorities | 0.190 (p < 0.05) n = 290 |
| B3.4—E3.4 (Insufficient/Effective) vertical coordination and cooperation between national, regional, and local authorities | 0.316 (p < 0.05) n = 298 |
| B3.5—E3.5 (Difficulty in/Strong) engagement and partnerships with local stakeholders for co-creation and joint implementation | 0.204 (p < 0.05) n = 293 |
| B4.1—E4.1 (Lack of/Presence of) climate policy champions | 0.207 (p < 0.05) n = 289 |
| B4.2—E4.2 (Lack of/Strong) vision, guidance, and leadership by the upper echelons of government (high-level political context) | 0.101 (p = 0.0859) n = 291 |
| B4.3—E4.3 (Low/High) continuity and priority of climate action on municipal agenda | 0.213 (p < 0.05) n = 279 |
| B4.4—E4.4 (Strong/Weak) public interest, involvement, and demand for climate policy | 0.228 (p < 0.05) n = 290 |
| N | MBE Item | N of Correlated Factors (ρ > 0.3) |
|---|---|---|
| 1 | E2.1. Adequate climate governance expertise among local administration staff and policymakers | 15 |
| 2 | E3.1. Municipal staff are stimulated, empowered, and actively encouraged to engage in climate work (climate-conducive administrative work culture) | 15 |
| 3 | E3.4. Effective vertical climate governance across all government levels (national, regional, local) | 14 |
| 4 | E1.8. Local access to low-carbon solutions (e.g., technology and workforce) | 13 |
| 5 | E3.2. Effective cross-sectoral coordination and cooperation on climate policy among local administration agencies | 13 |
| 6 | B3.5. Difficulty in engaging and forming partnerships with local stakeholders for co-creation and joint implementation | 13 |
| 7 | E3.5. Strong stakeholder engagement (e.g., businesses, residents) in local climate action | 13 |
| 8 | E1.1. Sufficient authority and influence of the dedicated climate agency | 11 |
| 9 | E2.2. Access to reliable and locally relevant data | 11 |
| 10 | E4.4. Citizens exhibiting high interest and demand for climate policy | 11 |
References
- Bai, X. Make the Upcoming IPCC Cities Special Report Count. Science 2023, 382, eadl1522. [Google Scholar] [CrossRef] [PubMed]
- van der Heijden, J. Studying Urban Climate Governance: Where to Begin, What to Look for, and How to Make a Meaningful Contribution to Scholarship and Practice. Earth Syst. Gov. 2019, 1, 100005. [Google Scholar] [CrossRef]
- UN-Habitat. World Cities Report 2022: Envisaging the Future of Cities; UN-Habitat: Nairobi, Kenya, 2022. [Google Scholar]
- Lwasa, S.; Seto, K.C.; Bai, X.; Blanco, H.; Gurney, K.R.; Kılkış, Ş.; Lucon, O.; Murakami, J.; Pan, J.; Sharifi, A.; et al. Urban Systems and Other Settlements. In Climate Change 2022: Mitigation of Climate Change. Contribution of Working Group III to the Sixth Assessment Report of the Intergovernmental Panel on Climate Change; Shukla, P.R., Skea, J., Slade, R., Al Khourdajie, A., Van Diemen, R., McCollum, D., Pathak, M., Shreya, S., Purvi, V., Roger, F., et al., Eds.; Cambridge University Press: Cambridge, UK, 2022; pp. 861–952. ISBN 9781009157926. [Google Scholar]
- Seth, S.; Srivastava, R.; Osho, Z.; Harper, S. From Planning to Action: Rethinking the Role of Cities in Accelerating Net-Zero Transitions; T20 Policy Brief, Task Force 4: Refuelling Growth: Clean Energy and Green Transitions; Think20 (T20): Mysuru, India, 2023. [Google Scholar]
- Joss, S. Sustainable Cities: Governing for Urban Innovation, 2015th ed.; Planning, Environment, Cities; Red Globe Press: London, UK, 2015; ISBN 9781137006356. [Google Scholar]
- Fuhr, H.; Hickmann, T.; Kern, K. The Role of Cities in Multi-Level Climate Governance: Local Climate Policies and the 1.5 °C Target. Curr. Opin. Environ. Sustain. 2018, 30, 1–6. [Google Scholar] [CrossRef]
- Biggeri, M. Editorial: A “Decade for Action” on SDG Localisation. J. Hum. Dev. Capab. 2021, 22, 706–712. [Google Scholar] [CrossRef]
- Dubash, N.; Mitchell, C.; Lerum, E.; Borbor-Córdova, M.; Fifita, S.; Haites, E.; Jaccard, M.; Jotzo, F.; Naidoo, S.; Romero-Lankao, P.; et al. National and Sub-National Policies and Institutions. In Climate Change 2022: Mitigation of Climate Change. Contribution of Working Group III to the Sixth Assessment Report of the Intergovernmental Panel on Climate Change; Shukla, P.R., Skea, J., Slade, R., Al Khourdajie, A., Van Diemen, R., McCollum, D., Pathak, M., Shreya, S., Purvi, V., Roger, F., et al., Eds.; Cambridge University Press: Cambridge, UK, 2022; pp. 1355–1450. ISBN 9781009157926. [Google Scholar]
- Seto, K.C.; Churkina, G.; Hsu, A.; Keller, M.; Newman, P.W.G.; Qin, B.; Ramaswami, A. From Low- to Net-Zero Carbon Cities: The next Global Agenda. Annu. Rev. Environ. Resour. 2021, 46, 377–415. [Google Scholar] [CrossRef]
- NewClimate Institute. Global Climate Action from Cities, Regions and Businesses: Taking Stock of the Impact of Individual Actors and Cooperative Initiatives on Global Greenhouse Gas Emissions; NewClimate Institute: Cologne/Berlin, Germany, 2021. [Google Scholar]
- UN Climate Change High-Level Champions. Race to Zero: Who’s In. Available online: https://www.climatechampions.net/campaigns/race-to-zero/whos-in/ (accessed on 12 March 2025).
- Davidson, K.; Briggs, J.; Nolan, E.; Bush, J.; Håkansson, I.; Moloney, S. The Making of a Climate Emergency Response: Examining the Attributes of Climate Emergency Plans. Urban Clim. 2020, 33, 100666. [Google Scholar] [CrossRef]
- Gudde, P.; Oakes, J.; Cochrane, P.; Caldwell, N.; Bury, N. The Role of UK Local Government in Delivering on Net Zero Carbon Commitments: You’ve Declared a Climate Emergency, so What’s the Plan? Energy Policy 2021, 154, 112245. [Google Scholar] [CrossRef]
- Ruiz-Campillo, X.; Castán Broto, V.; Westman, L. Motivations and Intended Outcomes in Local Governments’ Declarations of Climate Emergency. Politics Gov. 2021, 9, 17–28. [Google Scholar] [CrossRef]
- UNEP. Executive Summary. In Emissions Gap Report 2024: No More Hot Air … Please! With a Massive Gap Between Rhetoric and Reality, Countries Draft New Climate Commitments; UNEP: Nairobi, Kenya, 2024. [Google Scholar]
- Net Zero Tracker. Net Zero Stocktake 2024: Assessing the Status and Trends of Net Zero Target Setting Across Countries, Subnational Governments, and Companies; Net Zero Tracker: London, UK, 2024. [Google Scholar]
- O’Garra, T.; Kuz, V.; Deneault, A.; Orr, C.; Chan, S. Early Engagement and Co-Benefits Strengthen Cities’ Climate Commitments. Nat. Cities 2024, 1, 315–324. [Google Scholar] [CrossRef]
- Arroyo, V. From Paris to Pittsburgh: U.S. State and Local Leadership in an Era of Trump. The Georgetown Envtl. Law Review 2019, 31, 433–454. [Google Scholar]
- MOE (Ministry of the Environment). Status of Local Governments Declaring Their Intention to Achieve Net-Zero Carbon Dioxide Emissions by 2050. Available online: https://www.env.go.jp/policy/zerocarbon.html (accessed on 12 March 2025).
- Prime Minister of Japan and His Cabinet. Press Conference by the Chief Cabinet Secretary, 26 October 2020. Available online: https://japan.kantei.go.jp/tyoukanpress/202010/26_p.html (accessed on 12 March 2025).
- Ota, J.; Akagi, J. Commitment to Net Zero Carbon Emissions by 2050 by Local Governments in the Kyushu Region of Japan [IGES Issue Brief]; Institute for Global Environmental Strategies (IGES), Kitakyushu Urban Centre: Kitakyushu, Japan, 2021. [Google Scholar] [CrossRef]
- Nakazawa, T.; Satoh, K.; Trencher, G.; Tatsumi, T.; Hasegawa, K. Net-zero Carbon Declarations by Japanese Local Governments: What Caused the Domino-like Diffusion? Rev. Policy Res. 2023. [Google Scholar] [CrossRef]
- NEASPEC. Comparative Study on Low Carbon City Development in China, Japan, and the Republic of Korea; UNESCAP East and North-East Asia Office: Incheon, Republic of Korea, 2021. [Google Scholar]
- ICLEI Network; Park, Y.; Seo, E.; Kang, J. The Crucial Role of Local Governments in South Korea’s Bold Actions Towards Carbon Neutrality by 2050. Available online: https://talkofthecities.iclei.org/the-crucial-role-of-local-governments-in-south-koreas-bold-actions-towards-carbon-neutrality-by-2050/ (accessed on 1 June 2025).
- The Ministry of the Interior and Safety. 2021 P4G Seoul Summit. Press Release.—All 243 Local Governments Nationwide Announce the ‘2050 Carbon Neutrality Joint Declaration’ for the First Time in the World. Available online: https://www.mois.go.kr/eng/bbs/type001/commonSelectBoardArticle.do?bbsId=BBSMSTR_000000000019&nttId=84609 (accessed on 1 June 2025).
- Scanu, E.; Cloutier, G. Why Do Cities Get Involved in Climate Governance? Insights from Canada and Italy. Environ. Urbain 2015, 9, 1–19. [Google Scholar] [CrossRef]
- Bain, P.G.; Milfont, T.L.; Kashima, Y.; Bilewicz, M.; Doron, G.; Garðarsdóttir, R.B.; Gouveia, V.V.; Guan, Y.; Johansson, L.-O.; Pasquali, C.; et al. Co-Benefits of Addressing Climate Change Can Motivate Action around the World. Nat. Clim. Chang. 2016, 6, 154–157. [Google Scholar] [CrossRef]
- Williams, M. Tackling Climate Change: What Is the Impact on Air Pollution? Carbon Manag. 2012, 3, 511–519. [Google Scholar] [CrossRef]
- Lee, T.; Koski, C. Building Green: Local Political Leadership Addressing Climate Change. Rev. Policy Res. 2012, 29, 605–624. [Google Scholar] [CrossRef]
- Floater, G.; Heeckt, C.; Ulterino, M.; Mackie, L.; Rode, P.; Bhardwaj, A.; Carvalho, M.; Gill, D.; Bailey, T.; Huxley, R. Co-Benefits of Urban Climate Action: A Framework for Cities; A working paper by the Economics of Green Cities Programme, LSE Cities; London School of Economics and Political Science: London, UK, 2016. [Google Scholar]
- Aylett, A. Progress and Challenges in the Urban Governance of Climate Change: Results of a Global Survey; MIT Press: Cambridge, MA, USA, 2014. [Google Scholar]
- Bulkeley, H.; Schroeder, H.; Janda, K.; Zhao, J.; Armstrong, A.; Chu, S.Y.; Ghosh, S. Cities and Climate Change—The Role of Institutions, Governance and Urban Planning; Report Prepared for the World Bank Urban Symposium on Climate Change: Marseille, France, 2009. [Google Scholar]
- Jones, S. Cities Responding to Climate Change: Copenhagen, Stockholm and Tokyo; Springer Nature: Cham, Switzerland, 2017; ISBN 9783319648095. [Google Scholar]
- Ryan, D. From Commitment to Action: A Literature Review on Climate Policy Implementation at City Level. Clim. Chang. 2015, 131, 519–529. [Google Scholar] [CrossRef]
- Bulkeley, H. Cities and Subnational Governments. In The Oxford Handbook of Climate Change and Society; Dryzek, J.S., Norgaard, R.B., Schlosberg, D., Eds.; Oxford University Press: Oxford, UK, 2011; pp. 464–478. [Google Scholar]
- Krause, R.M. Symbolic or Substantive Policy? Measuring the Extent of Local Commitment to Climate Protection. Environ. Plan. C Gov. Policy 2011, 29, 46–62. [Google Scholar] [CrossRef]
- Bulkeley, H. Cities and the Governing of Climate Change. Annu. Rev. Environ. Resour. 2010, 35, 229–253. [Google Scholar] [CrossRef]
- Anguelovski, I.; Carmin, J. Something Borrowed, Everything New: Innovation and Institutionalization in Urban Climate Governance. Curr. Opin. Environ. Sustain. 2011, 3, 169–175. [Google Scholar] [CrossRef]
- Romero-Lankao, P.; Burch, S.; Hughes, S.; Auty, K.; Aylett, A.; Krellenberg, K.; Nakano, R.; Simon, D.; Ziervogel, G. Governance and Policy. In ARC3.2 Climate Change and Cities: Second Assessment Report of the Urban Climate Change Research Network; Rosenzweig, C., Solecki, W., Romero-Lankao, P., Mehrotra, S., Dhakal, S., Ibrahim, S.A., Eds.; Cambridge University Press: New York, NY, USA, 2018; pp. 585–606. [Google Scholar]
- Betsill, M.M. Mitigating Climate Change in US Cities: Opportunities and Obstacles. Local Environ. 2001, 6, 393–406. [Google Scholar] [CrossRef]
- Sippel, M.; Jenssen, T. What about Local Climate Governance? A Review of Promise and Problems. MPRA Paper, November 2009. [Google Scholar] [CrossRef]
- Krause, R.M. The Motivations Behind Municipal Climate Engagement: An Empirical Assessment of How Local Objectives Shape the Production of a Public Good. Cityscape 2013, 15, 125–142. [Google Scholar]
- Salon, D.; Murphy, S.; Sciara, G.-C. Local Climate Action: Motives, Enabling Factors and Barriers. Carbon Manag. 2014, 5, 67–79. [Google Scholar] [CrossRef]
- Reckien, D.; Flacke, J.; Olazabal, M.; Heidrich, O. The Influence of Drivers and Barriers on Urban Adaptation and Mitigation Plans-An Empirical Analysis of European Cities. PLoS ONE 2015, 10, e0135597. [Google Scholar] [CrossRef] [PubMed]
- Biesbroek, G.R.; Klostermann, J.E.M.; Termeer, C.J.A.M.; Kabat, P. On the Nature of Barriers to Climate Change Adaptation. Reg. Environ. Change 2013, 13, 1119–1129. [Google Scholar] [CrossRef]
- Eisenack, K.; Moser, S.C.; Hoffmann, E.; Klein, R.J.T.; Oberlack, C.; Pechan, A.; Rotter, M.; Termeer, C.J.A.M. Explaining and Overcoming Barriers to Climate Change Adaptation. Nat. Clim. Chang. 2014, 4, 867–872. [Google Scholar] [CrossRef]
- Castán Broto, V.; Bulkeley, H. A Survey of Urban Climate Change Experiments in 100 Cities. Glob. Environ. Chang. 2013, 23, 92–102. [Google Scholar] [CrossRef]
- van der Heijden, J.; Patterson, J.; Juhola, S.; Wolfram, M. Special Section: Advancing the Role of Cities in Climate Governance—Promise, Limits, Politics. J. Environ. Plan. Manag. 2019, 62, 365–373. [Google Scholar] [CrossRef]
- van der Heijden, J. When Opportunity Backfires: Exploring the Implementation of Urban Climate Governance Alternatives in Three Major US Cities. Policy Soc. 2021, 40, 116–135. [Google Scholar] [CrossRef]
- Blok, A. Urban Climate Risk Communities: East Asian World Cities as Cosmopolitan Spaces of Collective Action? Theory Cult. Soc. 2016, 33, 271–279. [Google Scholar] [CrossRef]
- Beck, U.; Sznaider, N. Unpacking Cosmopolitanism for the Social Sciences: A Research Agenda. Br. J. Sociol. 2006, 57, 1–23. [Google Scholar] [CrossRef]
- Kern, K.; Alber, G. Governing Climate Change in Cities: Modes of Urban Climate Governance in Multi-Level Systems. In Proceedings of the International Conference on Competitive Cities and Climate Change, Milan, Italy, 9–10 October 2009; OECD: Paris, France, 2009; pp. 171–196. [Google Scholar]
- Ryan, R.M.; Deci, E.L. Intrinsic and Extrinsic Motivations: Classic Definitions and New Directions. Contemp. Educ. Psychol. 2000, 25, 54–67. [Google Scholar] [CrossRef] [PubMed]
- Engel, K.H.; Orbach, B. Micro-Motives for State and Local Climate Change Initiatives. Harv. Law Policy Rev. 2008, 2, 119–137. [Google Scholar]
- Bai, X. Integrating Global Environmental Concerns into Urban Management: The Scale and Readiness Arguments. J. Ind. Ecol. 2007, 11, 15–29. [Google Scholar] [CrossRef]
- Engel, K.H. State and Local Climate Change Initiatives: What Is Motivating State and Local Governments to Address a Global Problem and What Does This Say About Federalism and Environmental Law? Urban Lawyer 2006, 38, 1015–1029. [Google Scholar]
- Qi, Y.; Ma, L.; Zhang, H.; Li, H. Translating a Global Issue Into Local Priority: China’s Local Government Response to Climate Change. J. Environ. Dev. 2008, 17, 379–400. [Google Scholar] [CrossRef]
- OECD. Competitive Cities and Climate Change; Kamal-Chaoui, L., Alexis, R., Eds.; OECD: Paris, France, 2009. [Google Scholar]
- Moore, J. Social and Behavioural Aspects of Climate Change; National Economic and Social Council (NESC): Dublin, Ireland, 2012. [Google Scholar] [CrossRef]
- Bulkeley, H.; Betsill, M.M. Revisiting the Urban Politics of Climate Change. Env. Politics 2013, 22, 136–154. [Google Scholar] [CrossRef]
- Aylett, A. Relational Agency and the Local Governance of Climate Change: International Trends and an American Exemplar. In The Urban Climate Challenge: Rethinking the Role of Cities in the Global Climate Regime; Johnson, C., Toly, N., Schroeder, H., Eds.; Routledge: New York, NY, USA, 2015; pp. 156–179. [Google Scholar]
- UN-Habitat; UNESCAP. Climate Change and National Urban Policies in Asia and Pacific: A Regional Guide For Integrating Climate Change Concerns Into Urban-Related Policy, Legislative, Financial And Institutional Frameworks; United Nations: New York, NY, USA, 2018. [Google Scholar]
- CDP; ICLEI. Working Together to Beat the Climate Crisis: Collaborative City, State and Regional Climate Action—Six Country Snapshots; CDP Worldwide: London, UK, 2021. [Google Scholar]
- Steg, L.; Veldstra, J.; de Kleijne, K.; Kılkış, Ş.; Lucena, A.F.P.; Nilsson, L.J.; Sugiyama, M.; Smith, P.; Tavoni, M.; de Coninck, H.; et al. A Method to Identify Barriers to and Enablers of Implementing Climate Change Mitigation Options. One Earth 2022, 5, 1216–1227. [Google Scholar] [CrossRef]
- Zimmer, A.; Jakob, M.; Steckel, J.C. What Motivates Vietnam to Strive for a Low-Carbon Economy?—On the Drivers of Climate Policy in a Developing Country. Energy Sustain. Dev. 2015, 24, 19–32. [Google Scholar] [CrossRef]
- Coulombe, C.; Maya-Drysdale, D.; McCormick, K. Local Municipalities and the Influence of National Networks on City Climate Governance: Small Places with Big Possibilities. Front. Sustain. Cities 2022, 4, 970968. [Google Scholar] [CrossRef]
- Bunsell, P.; Cooper, A.; UNESCAP; UN-Habitat. The Future of Asian and Pacific Cities 2023: Crisis Resilient Urban Futures; ESCAP: Bangkok, Thailand, 2023. [Google Scholar]
- UN Climate Change High-Level Champions. Race to Zero & Race to Resilience Progress Report: Taking Stock of Progress—September 2022; Climate Champions: Odisha, India, 2022. [Google Scholar]
- Kuromizu, K. Challenge of Megacity against Climate Change Countermeasures [Note of JICA Expert]; Japan International Cooperation Agency (JICA): Tokyo, Japan, 2024. [Google Scholar]
- De Gregorio Hurtado, S.; Olazabal, M.; Salvia, M.; Pietrapertosa, F.; Olazabal, E.; Geneletti, D.; D’Alonzo, V.; Di Leo, S.; Reckien, D. Understanding How and Why Cities Engage with Climate Policy: An Analysis of Local Climate Action in Spain and Italy. Tema J. Land Use Mobil. Environ. 2015, 8, 23–46. [Google Scholar] [CrossRef]
- Myasoedov, F.; Ota, J. Pathway to a Zero Carbon City: Island of Energy, Goto City, Japan [IGES Fact Sheet]; Institute for Global Environmental Strategies (IGES), Kitakyushu Urban Centre: Kitakyushu, Japan, 2021. [Google Scholar] [CrossRef]
- Ohta, H.; Barrett, B.F.D. Politics of Climate Change and Energy Policy in Japan: Is Green Transformation Likely? Earth Syst. Gov. 2023, 17, 100187. [Google Scholar] [CrossRef]
- Denton, F.; Halsnæs, K.; Akimoto, K.; Burch, S.; Morejon, C.D.; Farias, F.; Jupesta, J.; Shareef, A.; Schweizer-Ries, P.; Teng, F.; et al. Accelerating the Transition in the Context of Sustainable Development. In Climate Change 2022: Mitigation of Climate Change. Contribution of Working Group III to the Sixth Assessment Report of the Intergovernmental Panel on Climate Change; Shukla, P.R., Skea, J., Slade, R., Al Khourdajie, A., Van Diemen, R., McCollum, D., Pathak, M., Shreya, S., Purvi, V., Roger, F., et al., Eds.; Cambridge University Press: Cambridge, UK, 2022; pp. 1727–1790. ISBN 9781009157926. [Google Scholar]
- Mendizabal, M.; Feliu, E.; Tapia, C.; Rajaeifar, M.A.; Tiwary, A.; Sepúlveda, J.; Heidrich, O. Triggers of Change to Achieve Sustainable, Resilient, and Adaptive Cities. City Environ. Interact. 2021, 12, 100071. [Google Scholar] [CrossRef]
- Wurzel, R.K.W.; Andersen, M.S.; Tobin, P. Introduction. In Climate Governance Across the Globe: Pioneers, Leaders and Followers; Wurzel, R.K.W., Andersen, M.S., Tobin, P., Eds.; Routledge: New York, NY, USA, 2020; ISBN 9781003014249. [Google Scholar]
- Acuto, M. The New Climate Leaders? Rev. Int. Stud. 2013, 39, 835–857. [Google Scholar] [CrossRef]
- Romero-Lankao, P. Governing Carbon and Climate in the Cities: An Overview of Policy and Planning Challenges and Options. Eur. Plan. Stud. 2012, 20, 7–26. [Google Scholar] [CrossRef]
- Okereke, C. An Exploration of Motivations, Drivers and Barriers to Carbon Management:. The UK FTSE 100. Eur. Manag. J. 2007, 24, 475–486. [Google Scholar] [CrossRef]
- Burch, S. In Pursuit of Resilient, Low Carbon Communities: An Examination of Barriers to Action in Three Canadian Cities. Energy Policy 2010, 38, 7575–7585. [Google Scholar] [CrossRef]
- Burch, S. Transforming Barriers into Enablers of Action on Climate Change: Insights from Three Municipal Case Studies in British Columbia, Canada. Glob. Environ. Chang. 2010, 20, 287–297. [Google Scholar] [CrossRef]
- Rincón, C.A.R.; Santos, J.; Volker, L.; Rouwenhorst, R. Identifying Institutional Barriers and Enablers for Sustainable Urban Planning from a Municipal Perspective. Sustainability 2021, 13, 11231. [Google Scholar] [CrossRef]
- Moser, S.C.; Ekstrom, J.A. A Framework to Diagnose Barriers to Climate Change Adaptation. Proc. Natl. Acad. Sci. USA 2010, 107, 22026–22031. [Google Scholar] [CrossRef]
- Klein, R.J.T.; Midgley, G.F.; Preston, B.L.; Alam, M.; Berkhout, F.G.H.; Dow, K.; Rebecca Shaw, M. Adaptation Opportunities, Constraints, and Limits. In Climate Change 2014: Impacts, Adaptation, and Vulnerability Part A: Global and Sectoral Aspects Contribution of Working Group II to the Fifth Assessment Report of the Intergovernmental Panel on Climate Change; Field, C.B., Barros, V.R., Dokken, D.J., Mach, K.J., Mastrandrea, M.D., Eren Bilir, T., Chatterjee, M., Ebi, K.L., Estrada, Y.O., Genova, R.C., et al., Eds.; Cambridge University Press: Cambridge, UK, 2014; pp. 899–943. [Google Scholar]
- Conklin, J.; Basadur, M.; VanPatter, G.K. Rethinking Wicked Problems–Unpacking Paradigms, Bridging Universes. NexD J. 2007, 10, 1–30. [Google Scholar]
- Domorenok, E.; Graziano, P.; Polverari, L. Introduction: Policy Integration and Institutional Capacity: Theoretical, Conceptual and Empirical Challenges. Policy Soc. 2021, 40, 1–18. [Google Scholar] [CrossRef]
- Aylett, A. Municipal Bureaucracies and Integrated Urban Transitions to a Low Carbon Future. In Cities and Low Carbon Transitions; Bulkeley, H., Castán Broto, V., Hodson, M., Marvin, S., Eds.; Routledge: New York, NY, USA, 2010; pp. 142–158. [Google Scholar]
- Sippel, M.; Shaw, C.; Marshall, G. Ten Key Principles: How to Communicate Climate Change for Effective Public Engagement. Climate Outreach Working Paper; Climate Outreach: Oxford, UK, 2022. [Google Scholar]
- United Nations Department of Economic and Social Affairs (UN DESA). Effective National to Local Governance for Climate Change Mitigation and Adaptation; United Nations: New York, NY, USA, 2023. [Google Scholar]
- Betsill, M.; Bulkeley, H. Looking Back and Thinking Ahead: A Decade of Cities and Climate Change Research. Local Environ. 2007, 12, 447–456. [Google Scholar] [CrossRef]
- United Nations. New Urban Agenda; United Nations: Quito, Ecuador, 2017. [Google Scholar]
- UN-Habitat. The New Urban Agenda Illustrated, 2020; UN-Habitat: Nairobi, Kenya, 2020. [Google Scholar]
- The Global Taskforce of Local and Regional Governments; UCLG. Towards the Localization of the SDGs: Sustainable and Resilient Recovery Driven by Cities and Territories. Local and Regional Governments’ Report to the 2021 HLPF; UCLG: Barcelona, Spain, 2021. [Google Scholar]
- International Labour Organization (ILO). Guidelines for a Just Transition towards Environmentally Sustainable Economies and Societies for All; ILO: Geneva, Switzerland, 2015. [Google Scholar]
- Göpfert, C.; Wamsler, C.; Lang, W. Institutionalizing Climate Change Mitigation and Adaptation through City Advisory Committees: Lessons Learned and Policy Futures. City Environ. Interact. 2019, 1, 100004. [Google Scholar] [CrossRef]
- Charles, A.; The New Urban Agenda Has Been Formally Adopted. So What Happens Next? Available online: https://www.weforum.org/stories/2016/11/last-month-a-new-global-agreement-to-drive-sustainable-urban-development-was-reached-so-what-is-it-and-happens-next (accessed on 11 March 2025).
- Van Bennekom, F. The Importance of Measuring Importance—Correctly—On Customer Surveys. Available online: https://greatbrook.com/the-importance-of-measuring-importance-correctly-on-customer-surveys/ (accessed on 12 March 2025).
- Kameyama, Y. Climate Change Policy in Japan: From the 1980s to 2015; Routledge: New York, NY, USA, 2016; ISBN 9781317559429. [Google Scholar]
- Climate Mayors. Statement: Climate Mayors to Uphold Paris Agreement Commitment and Accelerate U.S. Subnational Climate Ambition and Global Economic Competitiveness. Available online: https://www.climatemayors.org/post/paris-agreement (accessed on 24 April 2025).
- Climate Mayors. Press Release: Mayors Highlight Programs in Their Cities That Lower Costs, Boost Local Economies, and Fight Climate Change. Available online: https://www.climatemayors.org/post/climate-action-improves-public-safety-p2dw3 (accessed on 24 April 2025).
- Climate Mayors. Statement: Climate Mayors Chair Mayor Kate Gallego Responds to White House Attempt to Hamper Local Climate Action. Available online: https://www.climatemayors.org/post/statement-white-house-attempt-to-hamper-local-climate-action (accessed on 24 April 2025).
- Jaglom, W.; Frisch, C.; Kennedy, K.; Clarke, L.; Hultman, N.; Cyrs, T.; Lund, J.; Saha, D.; Feldmann, J.; Bowman, C.; et al. Delivering on America’s Pledge: Achieving Climate Progress in 2020; Bloomberg Philanthropies with Rocky Mountain Institute, University of Maryland Center for Global Sustainability, and World Resources Institute: New York, NY, USA, 2020. [Google Scholar]
- Jordan, A.; Huitema, D.; Schoenefeld, J.; van Asselt, H.; Forster, J. Setting the Scene. In Governing Climate Change: Polycentricity in Action? Jordan, A., Huitema, D., van Asselt, H., Forster, J., Eds.; Cambridge University Press: Cambridge, UK, 2018; ISBN 9781108284646. [Google Scholar]
- Ostrom, E. Polycentric Systems for Coping with Collective Action and Global Environmental Change. Glob. Environ. Chang. 2010, 20, 550–557. [Google Scholar] [CrossRef]
- Rhodes, E.; Krawchenko, T.; Pearce, K.; Shaw, K. Scaling up Local Climate Action: A Survey of Climate Policy Priorities in the Vancouver Island and Coastal Communities Region. Can. Plan. Policy/Aménagement Et Polit. Au Can. 2021, 2021, 36–69. [Google Scholar] [CrossRef]
- Samuels, R.J. 3.11: Disaster and Change in Japan; Cornell University Press: Ithaca, NY, USA, 2013; ISBN 9780801452000. [Google Scholar]
- Irvin, R.A.; Stansbury, J. Citizen Participation in Decision Making: Is It Worth the Effort? Public Adm. Rev. 2004, 64, 55–65. [Google Scholar] [CrossRef]
- Climate Assembly UK. The Path to Net Zero. Available online: https://www.climateassembly.uk (accessed on 11 March 2025).
- Citizens Assembly Japan. Climate Assembly Sapporo 2020: Japan’s First Citizens’ Assembly on Climate Change. Available online: https://citizensassembly.jp/project/ca_kaken/en (accessed on 11 March 2025).
- DESIS Network. Public and Collaborative: Exploring the Intersection of Design, Social Innovation and Public Policy; Manzini, E., Staszowski, E., Eds.; DESIS Network: Seoul, Republic of Korea, 2013. [Google Scholar]
- Voytenko, Y.; McCormick, K.; Evans, J.; Schliwa, G. Urban Living Labs for Sustainability and Low Carbon Cities in Europe: Towards a Research Agenda. J. Clean. Prod. 2016, 123, 45–54. [Google Scholar] [CrossRef]
- Kingdon, J.W. Agendas, Alternatives, and Public Policies, Updated ed.; Pearson Education: London, UK, 2013; ISBN 9781292053875. [Google Scholar]
- UNCRD; Japanese Administrative System; UNCRD/AIT-VN. Training Course on Management and Administration of Local Government Institutions for Bangladesh. UNCRD: Nagoya, Japan, 2014.
- Hsu, A.; Weinfurter, A.J.; Xu, K. Aligning Subnational Climate Actions for the New Post-Paris Climate Regime. Clim. Chang. 2017, 142, 419–432. [Google Scholar] [CrossRef]
- JICA. Handbook for Utilization of Regional Revitalization Resources. For Regional Management in Developing Countries; Japan International Cooperation Agency (JICA): Tokyo, Japan, 2017. [Google Scholar]

| Category | N | Motivations | Direct High-Level Overviews | Broader Supporting Literature |
|---|---|---|---|---|
| Local Economic Development | 1.1 | Cost savings and financial benefits: Achieving savings with more efficient equipment, boosting property value (e.g., via building retrofits, presence of green/blue infrastructure), revenue from specific policies (e.g., traffic tolls and congestion taxes), and other direct financial benefits | [42,43] | [4,30,33,34,40,41,56,57,58,59,60,61,62,63,64,65] |
| 1.2 | Local industry development and economic revitalization (via green growth/circular economy): Enhancing the local economy’s competitiveness with job creation, increased productivity, new investments, and attracting businesses and talent through the promotion of the innovative green economy sector | [32,42] | [4,7,15,36,41,55,57,59,60,63,64,65,66,67,68,69,70] | |
| 1.3 | Improving local energy conditions: Developing local renewable energy to enhance self-sufficiency, independence, and stability of energy supply while reinvesting the energy revenues into the local economy and community (i.e., “local production, local consumption”) | - | [33,36,57,58,61,65,66,71,72,73] | |
| Quality of Life | 2 | Enhancing residents’ well-being and health: Mitigating air pollution, traffic congestion, and urban heat islands through emission reductions, urban greening, sustainable transport, and other synergistic initiatives that improve public health and quality of life | [32,42,43] | [3,4,5,15,33,38,41,56,59,60,63,64,65,69,74] |
| Institutional | 3 | Strengthening ties and gaining assistance from the national government by engaging in pioneering nationally designated urban frameworks (e.g., Eco City, Smart City) or other pilot programs for low-carbon development | [32,43] | [15,58,69,73,75] |
| Political | 4.1 | Green city brand/identity: Cultivating an appealing city image (to attract new residents, entrepreneurs, tourists) and community pride in the city’s environmental achievements, as well as securing other benefits from an enhanced reputation | [32,42,43] | [15,34,55,57,76] |
| 4.2 | Trend-setting and elevating municipal leadership: Highlighting the local government’s role in the global climate agenda to gain political capital, setting the trend for climate action at local, national, and international levels, and mobilizing stakeholders toward action | [32,42,43] | [3,4,7,15,33,36,38,53,55,57,58,67,77] | |
| Vulnerability | 5 | Ensuring safety and resilience: Perceiving vulnerability to climate impacts or having experienced past calamities and striving to safeguard residents and increase resilience (including future-proofing the energy system) through climate action | [32,42,43] | [15,59,63,66,78] |
| Global Norms, Altruism | 6 | Aligning with global norms and contributing to global betterment: Inspired by key international climate reports, conventions, and peers’ best practice; driven by self-determined responsibility or altruism to contribute to global efforts | [42,43] | [15,33,34,55,56,67,79] |
| Category | N | Barriers | Direct High-Level Overviews | Wider Supporting Literature |
|---|---|---|---|---|
| I. Municipal Capacity: Authority and Resources | 1.1 | Limited authority and influence of the dedicated municipal climate agency (or its parent bureau, e.g., environmental department) | [2,33,40,42] | [38,53,62,80,81] |
| 1.2 | Limited municipal control over key policy areas and infrastructure that have strong GHG implications (e.g., energy, transport, utilities) | [2,32,33,35,42] | [3,5,7,34,38,41,50,56,62,64,80,81] | |
| 1.3 | Inadequate (or lacking) legal and regulatory frameworks (e.g., laws, financing schemes, planning frameworks, and other provisions) conducive to local climate policies | [2,33,40,42] | [30,36,53,64,78,80,81] | |
| 1.4 | Constrained municipal budgets (i.e., limited own revenue or national transfers, fiscal stress) | [32,33,35,42] | [3,4,9,34,41,45,53,61,63,70,81] | |
| 1.5 | Limited accessibility to funding from external sources (e.g., financial organizations, private foundations, national or international grants and subsidies) | [2,32,33,35,42] | [3,4,5,34,36,38,56,64,78] | |
| 1.6 | High upfront costs of climate measures, coupled with long recovery times prior to yielding benefits and return on investment | [40,42] | [4,41,45] | |
| 1.7 | Lack of staff (or staff-time) dedicated to climate-related tasks within the local administration | [32,33,35,42] | [38,41,63,81] | |
| 1.8 | Lack of access to technological options and specialized workforce in the local area | [32,33] | [5,64,66,70,80] | |
| II. Municipal Capacity: Knowledge and Expertise | 2.1 | Lack of specialized knowledge and expertise among local administration staff and policymakers, hindering the development of appropriate policy measures | [32,33,40,42] | [3,38,41,50,74,81] |
| 2.2 | Limited access to reliable, locally relevant data, necessary for policymaking and climate action (e.g., data on GHG emissions or energy consumption by local industries, infrastructure, households, etc.) | [32,33,35,40,42] | [3,4,34,38,41] | |
| 2.3 | Lack of methods, tools, or best-practice portfolios for creating climate policy-relevant information and assessments (e.g., GHG inventories, energy scenarios) that support policymaking | [32,33,35,40,42] | [3,4,34,71,81] | |
| III. Institutional Coherence and Coordination | 3.1 | Administrative work culture (i.e., municipal staff job descriptions, work practices, and routines) is overly rigid and conservative, leaving little space to take risks, try new ideas, or depart from “normal” | [32,33,40,42] | [3,34,36,41,62,74,80,81,85,86] |
| 3.2 | Insufficient or fragmented collaboration and coordination on climate policy among local administration’s departments (e.g., environmental, urban planning, economic development, etc.) | [2,32,33,40,42] | [4,34,36,38,39,50,62,63,74,80,81,85,86] | |
| 3.3 | Limited inter-municipal cooperation and coordination of climate response with neighboring local authorities and other peer municipalities | [33,35,40,42] | [3,41,64] | |
| 3.4 | Insufficient or inefficient vertical coordination and cooperation on climate policy between national, regional, and local authorities | [2,33,35,40,42] | [3,7,9,36,38,39,49,50,53,60,63,64,74,80,81] | |
| 3.5 | Difficulty in engaging and forming partnerships with local stakeholders (e.g., private sector, civil society) for co-creation and joint implementation of initiatives | [2,33,40,42] | [3,4,34,39,50,62,64,74,87,88,89] | |
| IV. Political Will and Leadership | 4.1 | Lack of climate policy champions, i.e., individuals who promote, advocate, and lend political support to climate action (e.g., mayors, senior managers) | [2,32,33,40,42] | [30,34,36,39,64,81,86] |
| 4.2 | Lack of clear vision, guidance, and leadership by the upper echelons of government (i.e., inadequate high-level political context) | [2,32,33] | [3,30,39,64,71,86] | |
| 4.3 | Low continuity and priority of climate action on municipal agenda (due to many competing issues and incognizance of synergies, politician term limits, inability to frame climate as an issue of local importance) | [32,33,40,42] | [3,34,36,41,53,56,74,78,80,81,86,90] | |
| 4.4 | Low public interest, involvement, and demand for climate policy | [33,35,40,42] | [34,56,80] | |
| 4.5 | Weak problem perception or skepticism among civil servants within the city hall | [32,42] | [41,56,58,74,81] |
| Category | N | Enablers | Direct High-Level Overviews | Wider Supporting Literature |
|---|---|---|---|---|
| I. Municipal Capacity: Authority and Resources | 1.1 | Sufficient authority and influence of the dedicated climate agency (or its parent bureau, e.g., environmental department) | [2,33,40,42] | [53,62,81] |
| 1.2 | Sufficient municipal autonomy and jurisdiction over key urban policy areas and infrastructure that have strong GHG implications (e.g., energy, transport, utilities) | [2,32,33,35,42] | [9,34,38,41,56,64,78] | |
| 1.3 | Supportive legal context with adequate frameworks and mandates (e.g., laws, regulations, overarching policies) in place | [2,32,33,40,42] | [7,30,36,39,49,57,63,64,68,74,78,81,89,91,92] | |
| 1.4 | Adequate municipal budget | [2,32,33,35,42] | [4,5,9,34,36,39,44,63,64] | |
| 1.5 | Accessibility to funding from external sources (e.g., financial organizations, private foundations, national subsidies) | [2,32,33,35,42] | [3,4,5,36,64,78,92,93] | |
| 1.6 | Realizable benefits, complementarities and linkages with other goals (e.g., SDGs) are well explored and exploited, thereby justifying and partially offsetting policy costs | [32,42] | [4,9,34,38,59,60,65,74] | |
| 1.7 | Enough staff dedicated to climate-related tasks within the local administration | [32,33,35,42] | [38,81] | |
| 1.8 | Local presence or access to low-carbon industry solutions (i.e., specialized technology and workforce) | [32,33] | [5,80] | |
| II. Municipal Capacity: Knowledge and Expertise | 2.1 | Adequate climate governance expertise among local administration staff and policymakers to identify locally suitable policy options and synergies | [32,33,42] | [5,7,34,75,81] |
| 2.2 | Access to reliable and locally relevant data (e.g., GHG emissions or energy consumption data) from various sources, including public and private organizations (e.g., regional utilities, local industries) | [32,33,35,42] | [3,64,75] | |
| 2.3 | Having access to technical instruments (e.g., tools, methods, and know-how) for generating policy-relevant information and assessments (e.g., carbon emissions inventory, energy scenarios) that support policymaking, including by being a member of domestically or internationally driven capacity-building initiatives | [2,32,33,35,42] | [4,5,34,71,78,90] | |
| III. Institutional Coherence and Coordination | 3.1 | Municipal staff are stimulated, empowered, and actively encouraged to engage in climate work (through trainings and discussion groups, green accomplishment rewards, etc.); i.e., climate as part of the organizational culture | [32,33,42] | [34,81,85,86,87] |
| 3.2 | Effective cross-sectoral coordination and cooperation on climate policy among local administration agencies (supported by mechanisms like an umbrella coordinating unit, working groups, designated coordinators, etc.) | [2,33,42] | [4,34,38,41,53,59,62,63,70,74,81,86] | |
| 3.3 | Strong external horizontal cooperation and partnership for climate action with neighboring and other peer municipalities, including active membership in domestic or transnational city networks | [32,33,35,40,42] | [3,4,5,7,34,45,53,59,64,68,71] | |
| 3.4 | Strong vertical alignment, strategic cooperation, and coordination of climate policy between national, regional, and local authorities | [2,33,35,42] | [3,4,7,36,44,45,49,53,59,63,64,89,91] | |
| 3.5 | Sufficient partnerships and involvement of stakeholders (e.g., businesses, residents) in the creation and coordination of local climate initiatives | [2,33,40,42] | [3,4,5,9,34,50,59,62,63,64,68,75,86,87,88,89,94,95] | |
| IV. Political Will and Leadership * | 4.1 | Presence of dedicated climate policy champions among local leaders (e.g., mayors, village chiefs), strongly advocating and steering local climate efforts | [2,32,33,35,40,42] | [7,30,34,36,37,39,41,44,58,78,81,86] |
| 4.2 | Strong vision, enthusiasm and leadership by the upper echelons of government (national, provincial) and the major political party, advocating carbon neutrality on a sustained high-level policy agenda | [2,33,35] | [5,30,39,44,60,64,71,74,81,86,92,96] | |
| 4.3 | High priority, continuity, and favorability toward environmental action on local agenda (e.g., city history of environmental action/struggle, consecutive re-elections of pro-environment mayors/politicians, forward-looking local declarations/commitments and political vision, climate successfully framed as “local” issue synergistic with local priorities) | [32,33,35,42] | [9,36,38,60,62,71,74,75,81,86,90] | |
| 4.4 | Citizens exhibiting high interest and demand for climate policy (e.g., high public climate awareness, civic pride of living in a “green city,” active pro-environment civil society organizations) | [32,33,35] | [9,34,57,60,67,75,80,88] |
| Administrative Category | Total Municipalities in Japan | Contacts (Zero-Carbon Cities as of January 2022) | Responses (Response Rate, %) | Mean Population of Responded Jurisdictions |
|---|---|---|---|---|
| Designated City 1 | 20 | 19 | 11 (58%) | 1,421,257 |
| Special wards (Tokyo) 2 | 23 | 15 | 10 (67%) | 410,162 |
| City | 772 | 296 | 202 (68%) | 141,090 |
| Town, Village | 926 | 159 | 86 (54%) | 11,908 |
| Total | 1740 | 489 | 309 (63%) | 159,416 |
Disclaimer/Publisher’s Note: The statements, opinions and data contained in all publications are solely those of the individual author(s) and contributor(s) and not of MDPI and/or the editor(s). MDPI and/or the editor(s) disclaim responsibility for any injury to people or property resulting from any ideas, methods, instructions or products referred to in the content. |
© 2025 by the authors. Licensee MDPI, Basel, Switzerland. This article is an open access article distributed under the terms and conditions of the Creative Commons Attribution (CC BY) license (https://creativecommons.org/licenses/by/4.0/).
Share and Cite
Myasoedov, F.; Ialnazov, D.S. Key Motivations, Barriers, and Enablers Toward Net-Zero Cities: An Integrated Framework and Large Survey in Japan. Climate 2025, 13, 134. https://doi.org/10.3390/cli13070134
Myasoedov F, Ialnazov DS. Key Motivations, Barriers, and Enablers Toward Net-Zero Cities: An Integrated Framework and Large Survey in Japan. Climate. 2025; 13(7):134. https://doi.org/10.3390/cli13070134
Chicago/Turabian StyleMyasoedov, Fedor, and Dimiter Savov Ialnazov. 2025. "Key Motivations, Barriers, and Enablers Toward Net-Zero Cities: An Integrated Framework and Large Survey in Japan" Climate 13, no. 7: 134. https://doi.org/10.3390/cli13070134
APA StyleMyasoedov, F., & Ialnazov, D. S. (2025). Key Motivations, Barriers, and Enablers Toward Net-Zero Cities: An Integrated Framework and Large Survey in Japan. Climate, 13(7), 134. https://doi.org/10.3390/cli13070134