Article

Developing Early Warning Systems in Vanuatu: The Influence of Climate Variables on Malaria Incidence and Cattle Heat Stress

1
Science Advanced-Global Challenges Program, Monash University, Melbourne 3800, Australia
2
Climate Risk and Early Warning Systems (CREWS), Science and Innovation Group, Bureau of Meteorology, Melbourne 3008, Australia
3
School of Earth, Atmosphere and Environment, Monash University, Melbourne 3800, Australia
4
School of Science, Royal Melbourne Institute of Technology (RMIT) University, Melbourne 3000, Australia
*
Author to whom correspondence should be addressed.
Climate 2025, 13(6), 118; https://doi.org/10.3390/cli13060118
Submission received: 21 March 2025 / Revised: 23 May 2025 / Accepted: 29 May 2025 / Published: 3 June 2025

Abstract

:
In the South Pacific, an increase in the frequency of climate hazards has resulted in worsened human and animal health outcomes, revealing the need for strengthened early warning to increase hazard preparedness. As Vanuatu is one of the most at-risk countries to natural disasters, an early warning system (EWS) for climate hazards is essential to support industries and communities. Notably, climate variability has been found to exacerbate communicable disease burden and compromise livestock health and productivity; however, forecasting of such hazards and their compounding effects has not been developed in Vanuatu. Therefore, our study aims to explore EWSs that monitor and predict the impact of climate variables on malaria incidence and cattle heat stress in Vanuatu. Using monthly precipitation and temperature, a Bayesian model was developed to predict provincial malaria case burden in Vanuatu. Additionally, this study developed a weekly forecasting model to predict periods of cattle heat stress. This model used the Heat Load Index (HLI) as a proxy for heat stress to identify periods of increased heat load and antecedent conditions for cattle heat stress across the provinces. This study was successful in establishing proof-of-concept risk forecasts during selected case study periods: January 2020 and January 2016 for malaria transmission and cattle heat stress, respectively. To contribute towards a future multi-hazard EWS framework for climate hazards in Vanuatu, bulletins for predicted climate-based malaria transmission and cattle heat stress risk were developed to inform key decision makers. Intended to enhance preparedness for malaria outbreaks and cattle heat stress events, this study’s exploration of EWSs can support the resilience of Vanuatu’s public health and agricultural sectors in the face of escalating climate challenges.

1. Introduction

Anthropogenic climate change is increasing the frequency and severity of extreme climate events which harm global ecosystems and communities [1]. To increase resilience to weather and climate hazards, global attention has been directed to building the capacity of Small Island Developing States (SIDSs) to prepare and respond to climate variability and change. Due to their geography, SIDSs are highly vulnerable to both the harmful effects of rapid-onset and slow-onset climate hazards, a condition that can be further compounded by limited institutional capacity and a high degree of exposure to systemic shocks [1].
Vanuatu, a SIDS in the Southwest Pacific region, is one of several Pacific Island countries (PICs) that face slow-onset climate hazards such as increasing atmospheric and sea surface temperatures and sea level rise, as well as frequently occurring extreme weather and climate events (EWCEs), namely tropical cyclones, floods and drought [2]. These climate risks cascade into significant sectoral and livelihood impacts, threatening Vanuatu’s long-term economic and social welfare. To minimise the social, environmental and economic impacts of natural hazards and EWCEs, it is crucial that communities and industries are informed about upcoming risks and possible mitigation measures.
Early warning systems (EWSs) are key elements in improving community preparedness and response to climate hazards, promoting timely action. On a global scale, the evolution of EWSs from single- to multi-hazard systems has been accelerated by intergovernmental institutions, multilateral organisations and international frameworks. These systems can address and warn stakeholders of multiple hazards and their interconnected impacts [3]. In this way, an effective multi-hazard EWS (MHEWS) enables coordinated efforts to be directed towards hazard identification, monitoring and response. The World Meteorological Organization’s (WMO) Early Warnings for All Initiative is the most current program targeted at enhancing EWSs globally [4]. The WMO emphasises the need for end-to-end and people-centred systems that enable communities, businesses and governments to prepare and respond to hazard risk and events [4]. The initiative outlines several pillars as key to an effective EWS: risk knowledge, detection and forecasting of hazards, preparedness capabilities and warning communication.
Although Vanuatu’s natural hazard monitoring is relatively strong, a gap remains between predicting concurrent climate events and their real-world impacts. To address this, impact-based forecasting can provide actionable early warning information and promote proactive mitigation efforts [5]. Impact-based forecasting emphasises the importance of EWSs that integrate predicted weather conditions and their impacts [6,7]. Operationalising impact-based forecasting in EWSs can therefore drive early response, enhance preparedness and minimise damage [7]. The effectiveness of merging impact-based forecasting and EWSs has already been evidenced in PICs such as the Philippines, Papua New Guinea, Samoa and Tonga [8,9,10]. Key features of these impact-based EWSs include translating the forecasting data and modelling into risk maps, risk matrices, key figures and simple key messages. Given that Vanuatu has a similar socio-economic profile and climate landscape to these countries, example systems from other PICs can serve as a precedent for developing impact-based forecasting EWSs in Vanuatu.
Of particular concern to Vanuatu is the risk of climate change to the public health and agriculture sectors. Predicting and mitigating the climate-related impacts on agriculture and health are key priorities for Vanuatu, sectors that are highly susceptible to increased climate variability [11,12]. Climate hazards and change have been seen to drive health challenges related to heat-related illnesses, food and water security and non-communicable and vector-borne diseases [12]. These indirect effects increase the burden on healthcare facilities, a threat growing particularly from challenges related to food security and vector-borne disease [13]. Environmental stressors often result in worsened animal health outcomes, through hazards such as heat stress, malnutrition and mortality. These stressors can compromise food security and human health, with many people in Vanuatu relying on livestock, cattle in particular, as a primary source of food and income [14]. Climate change and EWCEs can further pose a risk to Vanuatu’s progress to eliminate vector-borne diseases, particularly malaria [15]. Heat stress in agriculture and malaria transmission in public health are two distinct but compelling climate-related hazards to human health that remain relevant in Vanuatu. The dual focus on malaria transmission and cattle heat stress is highly relevant to the region’s public health and agricultural sectors, which are increasingly vulnerable to climate-related risks.
Given the far-reaching impacts of climate hazards in Vanuatu, EWSs that provide sector-specific warnings can present a targeted framework for optimising overall community health. Specifically, an agricultural EWS developed for cattle heat stress can enhance agricultural production and food-related health outcomes by indicating the potential impacts of climate conditions on cattle, supporting timely preparedness and response. In parallel, a health sector EWS targeting malaria transmission can prepare healthcare services and communities in the event of an outbreak. Together, climate-based EWSs targeting different key sectors in Vanuatu can have an enhanced impact on health outcomes and in future be integrated into an MHEWS.

1.1. Malaria in Vanuatu

Malaria transmission and outbreaks are a pressing public health challenge in Vanuatu. Malaria is endemic to Vanuatu, with the parasite Plasmodium vivax being transmitted by the mosquito vector Anopheles farauti [16,17]. In 2023, Vanuatu reported an incidence of 7.14 cases per 1000 population, a number that is potentially underrepresented due to asymptomatic transmission and limited access to health facilities and diagnostics [15,18]. Vanuatu is a participant in global malaria elimination initiatives, with the Ministry of Health (MoH) also directing national and subnational campaigns. In particular, these campaigns focus on the distribution and coverage of insecticide-treated nets and diagnostic materials [15].
As Vanuatu’s control measures progress, malaria distribution is increasingly concentrated in isolated locations. Provinces Tafea and Torba have been a particular focus for elimination programs, with Tafea being declared malaria free in 2017 [19]. Torba was similarly progressing towards elimination, but in 2022, experienced increases in malaria cases that have been associated with COVID-19 outbreaks competing as a national health challenge [15]. In 2023, tropical cyclones Kevin and Judy further impacted health services [15]. These compounding health challenges, social factors of transmission and An. farauti presence can threaten provincial and national elimination progress [20,21].
The National Strategic Plan for Malaria Elimination 2021–2026 highlights the need for strengthened elimination-related knowledge and practices, and the promotion of sophisticated surveillance systems [21]. Currently, Vanuatu reports and collates malaria data using a rapid electronic notification system, initially implemented in response to COVID-19’s presence in the country, supplementing weekly reporting of diseases through the Pacific Public Health Surveillance Network [22]. Additionally, the 7-1-7 tool used to strengthen outbreak response is being trialled in Vanuatu, setting goals to identify outbreaks in less than seven days, report them in one and take action to control the outbreak in a further seven days [23]. Both approaches aid in strengthening disease and outbreak management but could further be supported by a climate-based system that predicts high-risk periods. Drawing on the established influence between climate factors and malaria incidence, a predictive system can enhance sector knowledge and awareness of malaria dynamics and encourage proactive mitigation.
Like many vector-borne diseases, malaria has a sensitivity to climate variables—a relationship that has been explored in the South Pacific region [24,25,26,27,28]. Stages of the transmission cycle can be influenced by climate conditions, such as the rate of parasite development within the mosquito and the biting rates and aggressiveness of adult females [24,26,29]. While these climate–malaria relationships vary depending on region-specific factors such as topography and infrastructure, studies in PICs often find a strong, positive influence from temperature, over time contributing to greater numbers of infectious adult mosquitoes [26,27,28,30]. Precipitation is also influential in malaria spread, with its effect largely modulated by the regional environmental conditions and influencing the habitat availability of An. farauti breeding [27,31]. In areas with few existing larval habitats, or vegetation and topography that are not conducive to larval habitat permanence, rainfall tends to have a positive association with malaria incidence, though this relationship varies seasonally and between regions [25,27,32]. Like temperature, the influence that rainfall may have on malaria incidence tends to be lagged [25,30].
The predictive relationship between climate variables and disease incidence can form the basis of a climate-based malaria EWS, such as was developed for the Solomon Islands using six-month rainfall outlooks [25]. An EWS built to effectively predict malaria risk should incorporate region-specific climate conditions and supplement existing healthcare infrastructure. Using climate models to forecast periods of high malaria risk before outbreaks occur can provide vital lead times for public health interventions, allowing for enhanced risk communication and distribution of resources [18].

1.2. Cattle Heat Stress in Vanuatu

Cattle are an essential aspect of Vanuatu’s agricultural systems and food security, with the sustainability of the industry being vital to population health and livelihoods [33,34]. Over 80% of Vanuatu’s population is involved in some form of agriculture for subsistence, livelihood or income [14]. In 2011, beef was the nation’s fourth-largest exported commodity, and its production continues to constitute a significant portion of Vanuatu’s agricultural industry income [35]. The beef herd in Vanuatu currently consists of approximately 90,000 head of cattle, 40% of which are owned by smallholders [14,36]. Half of all rural households in Vanuatu raise cattle, making them a central aspect of the country’s culture and lifestyle, with cattle playing a crucial role in local ceremonies, traditions and the generation of rural incomes [14]. Vanuatu’s beef sector has significant potential for growth, supported by export-accredited abattoirs and Ministry of Agriculture, Livestock, Forestry, Fisheries and Biosecurity (MALFFB) plans to expand the national herd to 500,000 by 2025 [34,37]. Given the importance of cattle to farmers, rural households and the Vanuatu economy, monitoring the impact of climate variability and change on cattle health and production is critical [38].
Heat stress in cattle can arise from a combination of environmental and internal factors, impacting cattle health, welfare and productivity [39]. The condition is typically triggered by the surrounding thermal environment when high ambient temperatures and humidity combine with decreased wind speeds and cloud cover. This can lead to reduced evapotranspiration rates, hindering the physiological cooling mechanisms of cattle, limiting their ability to offload heat [40,41]. The main impacts of heat stress on cattle include decreased nutrient absorption efficiencies, feed intake and weight gain [42]. Further physiological impacts include impaired reproductive cycling, decreased milk production, fertility, embryonic development, pregnancy rates and neonatal calf survival rates [40,43]. Severe or prolonged exposure to heat stress conditions can eventually result in cattle death. In Vanuatu, elevated temperatures and humidity during the wet season impede effective heat dissipation in cattle, resulting in frequent, and often daily, exposure to heat stress conditions [44,45].
Predicting and quantifying the effect of climate variables on cattle is essential to managing and maintaining their health, welfare and productivity. The Heat Load Index (HLI), which incorporates temperature, humidity, wind speed and solar radiation, serves as a reliable instantaneous indicator of cattle heat stress [46]. Cattle can often avoid the worst effects of daily heat stress if the climatic conditions at night allow sufficient cooling for recovery from the heat stress experienced during the day. However, when cattle experience heat stress over consecutive days or if nighttime conditions are inadequate for cooling, cattle can begin to accumulate a ‘heat load’. An Accumulated Heat Load (AHL) refers to the ‘carry over’ of heat load from previous hours or days and can exacerbate the impacts of heat stress over time. An AHL leads to more severe and persistent physiological issues, compounding the impacts of heat stress on cattle health, productivity and mortality [40]. The impact of an AHL on cattle is measured using the AHL index, a measurement calculated using the HLI and HLI thresholds determined in earlier research by Gaughan et al. [46].
While cattle are often able to recover from days with an intense (high) HLI, this resilience is impaired if cattle are exposed to prolonged periods of heat stress, characterised by high AHL values [47]. These periods can have severe and long-lasting impacts on cattle health, with cattle unlikely to return to their peak performance potential after experiencing such an event. As an AHL is calculated using climate conditions, the development of an EWS for cattle heat stress with the predictive capacity to forecast when and to what extent the AHL will increase is both plausible and valuable. Early warning prior to periods of prolonged or severe heat stress conditions can enhance feedlot operator and farmer preparedness, supporting agricultural and food security [48].
To date, EWSs in Vanuatu have monitored and forecasted single climate hazards and meteorological scenarios. However, with the growing impact of increased climate variability and change, hazards are likely to occur concurrently, creating cumulative stressors for communities and industries. Improving understanding of the function of EWSs in Vanuatu can enhance current management and preparedness measures at a regional and local level. This study aims to develop two components that could contribute to a climate-based MHEWS in Vanuatu, applying a framework for producing an EWS bulletin to two distinct hazards: malaria transmission and cattle heat stress. This study further aims to explore the influence of climate variables on malaria transmission and cattle heat stress to develop forecasting models, the results of which are presented through the bulletins.
By providing accessible climate hazard information, the two EWS frameworks explored in this study can assist industries and stakeholders in taking measures in preparedness for malaria outbreaks and cattle heat stress events. Given the predicted increase in climate variability and in the intensity and frequency of EWCEs, this information is crucial to support the long-term resilience of Vanuatu’s public and animal health sectors.

2. Materials and Methods

2.1. Study Area

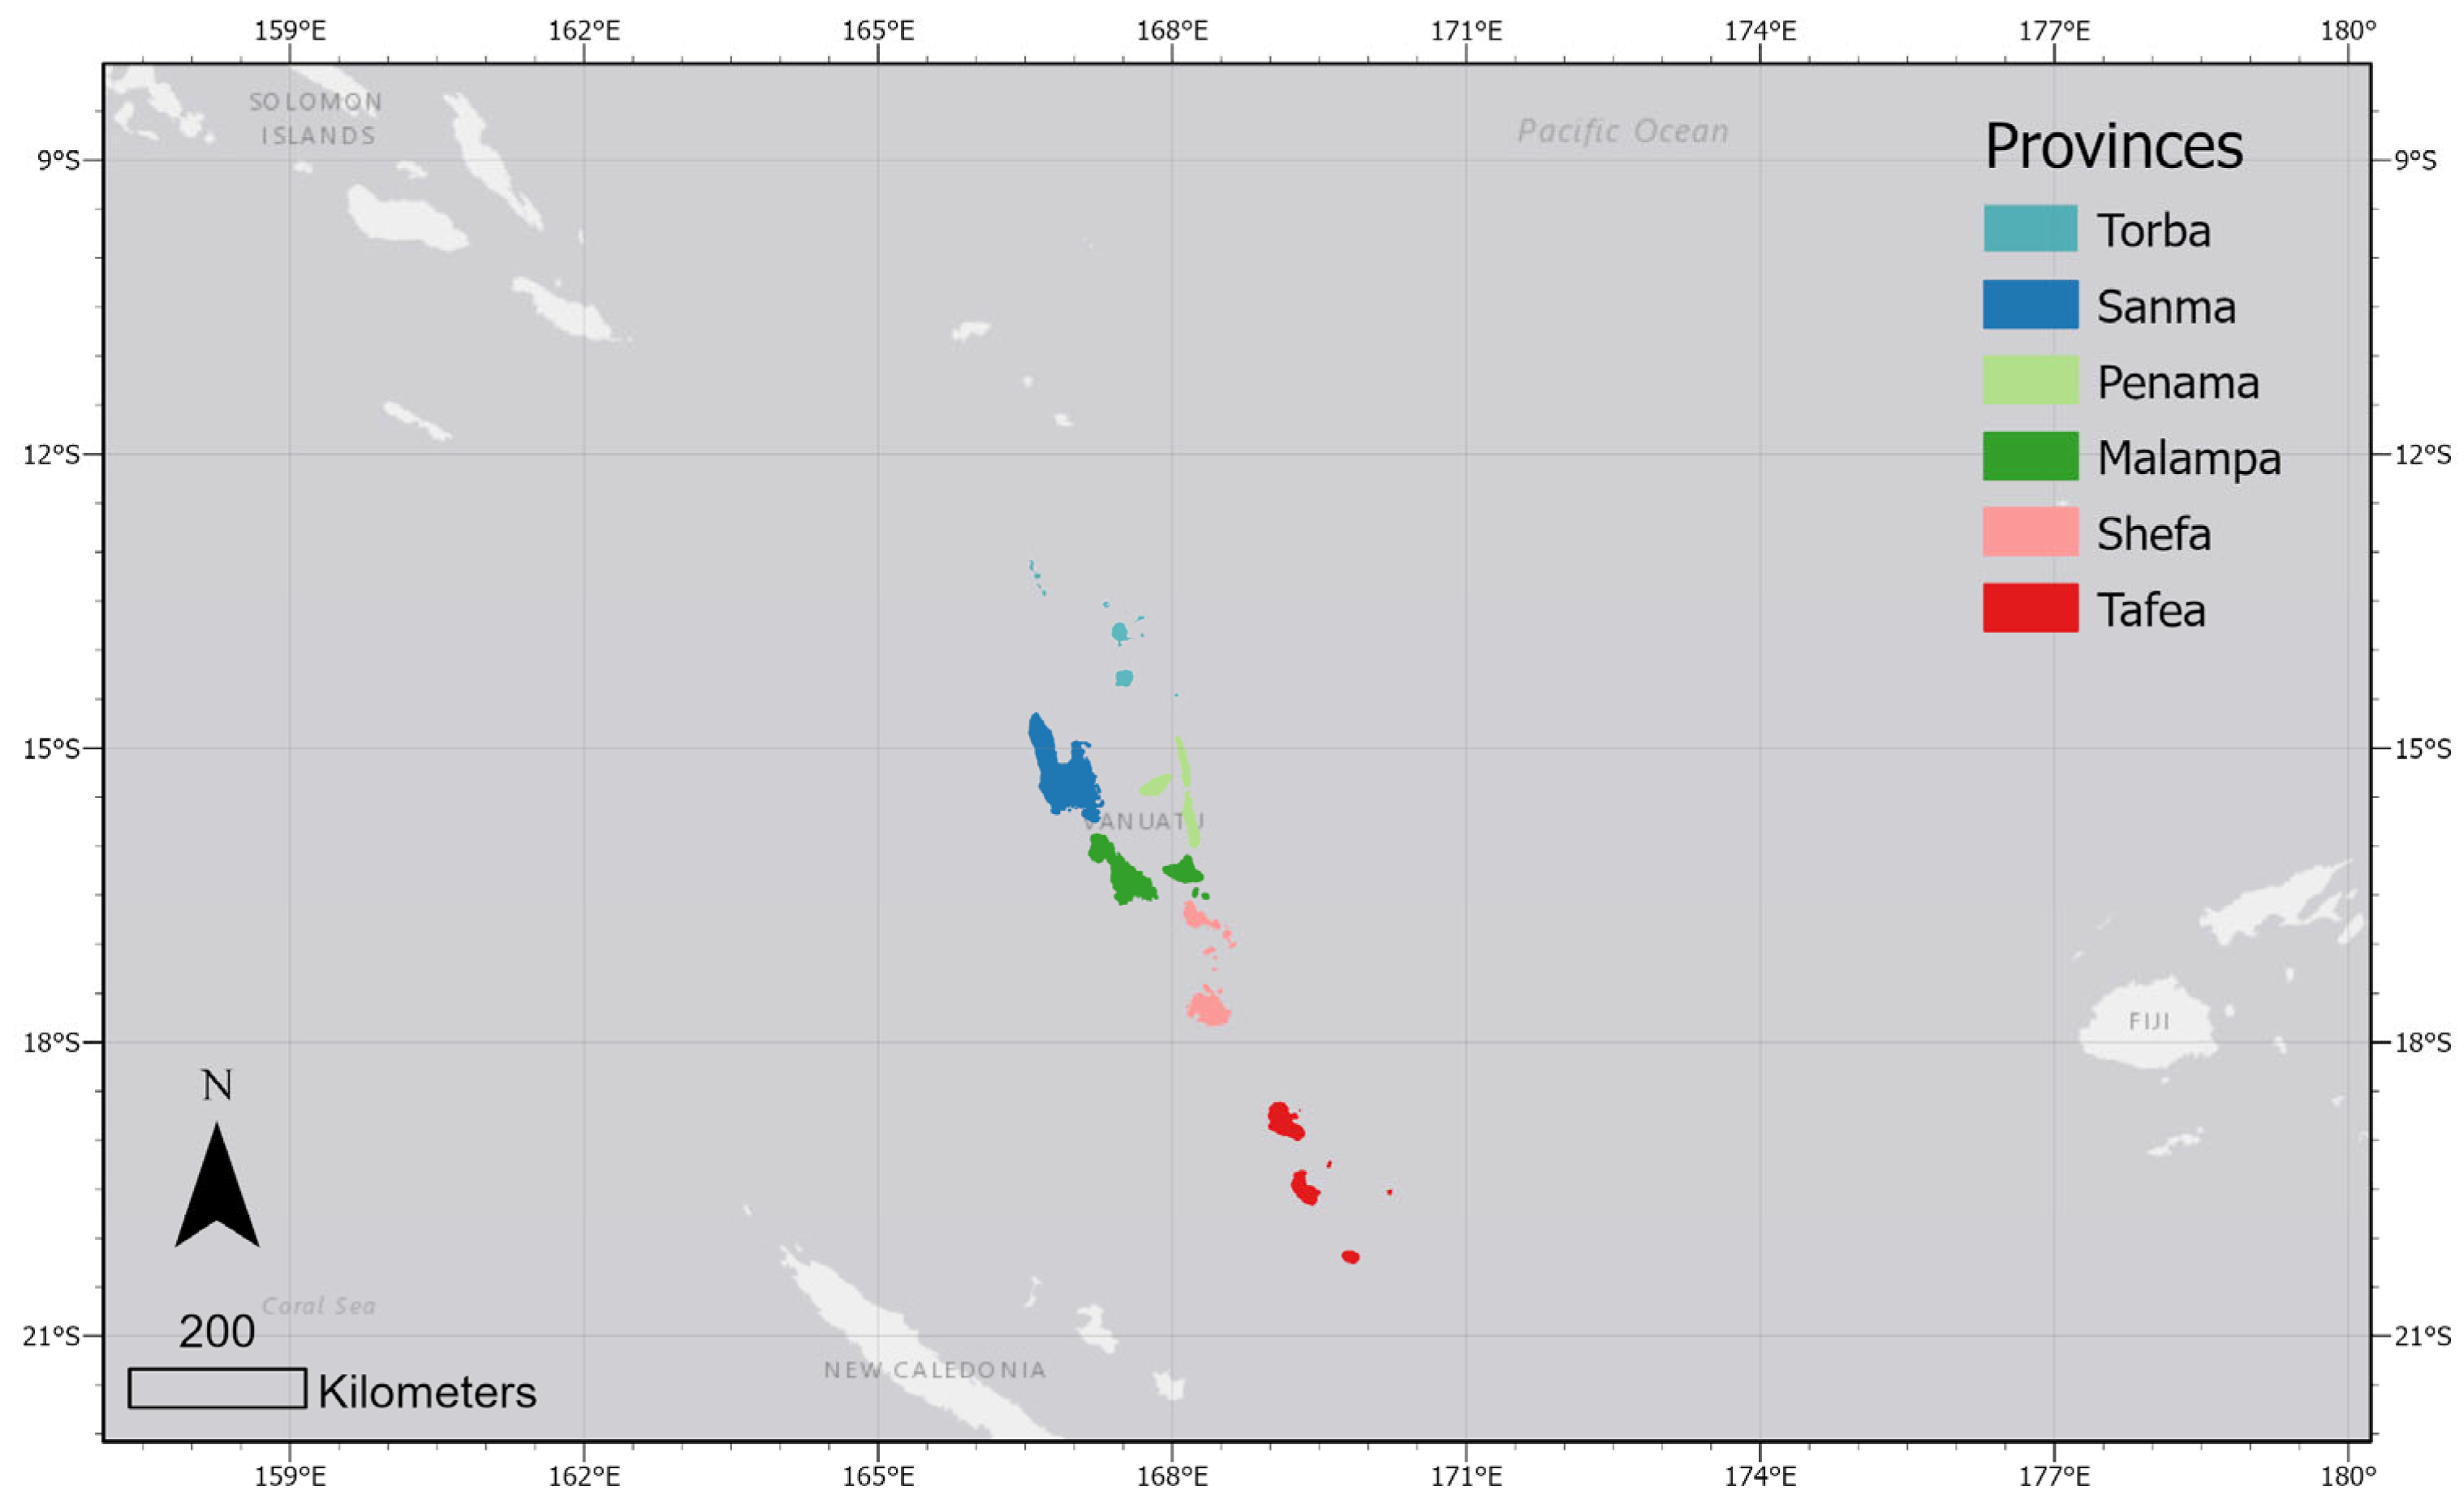
Located in the Southwest Pacific, Vanuatu is an archipelago of 83 islands, with a population of approximately 326,000 people and spanning over 1000 km from about 12° S to 22° S (Figure 1). Vanuatu’s climate is strongly influenced by the El Niño–Southern Oscillation (ENSO) and the South Pacific Convergence Zone [49]. While Vanuatu experiences low seasonal variation in temperature, the country experiences high seasonal variability in precipitation. The range in monthly maximum air temperature throughout the year is approximately 4 °C for Port Vila and 5 °C for Aneityum [2]. Annual precipitation typically ranges from 1000 to 3800 mm in Aneityum, and from 900 to 3500 mm in Port Vila, influenced interannually by ENSO and other large-scale climate drivers [2]. This further varies over two distinct seasons: a wet season (November–April) and a dry season (May–October). The study area includes all islands of Vanuatu and is bounded by the latitude and longitude range of 13° S to 21° S and 166° E to 171° E, respectively. Data were aggregated based on Vanuatu’s six provinces: Malampa, Penama, Sanma, Shefa, Tafea and Torba (Figure 1). Geographical data detailing the latitudinal and longitudinal bounds of each island and province were downloaded from the Humanitarian Data Exchange [50].

2.2. Case Studies

The study period used in the malaria forecasting model was 2014–2023. The cattle heat stress model drew data from a 30-year study period spanning from 1994– to 2023, established in an earlier study conducted by Reeve et al. (2024), which formed the basis of the monitoring component of the forecasting model [45].
Case study periods were selected to demonstrate periods of variable hazard risk and to provide example risk maps for the malaria transmission EWS bulletin and the cattle heat stress EWS bulletin. In this study, the malaria forecasting model, developed on a monthly timescale, used January 2020 as a case study period for further analysis due to observed malaria case spikes during this month. The cattle heat stress forecasting model, developed on a weekly timescale, used the first week of February 2016 as a case study period, due to hot and humid conditions characteristic of Vanuatu’s wet season. The 2015–2016 El Niño contributed to high global temperatures worldwide, making 2016 one of the warmest years on record. Vanuatu was significantly impacted by this record-breaking El Niño event which caused widespread drought and affected food security in the country [51]. This case study period was selected to demonstrate the effectiveness of the model during a period of high heat load and heat stress for cattle.

2.3. Data

Variable selection for this study was based on prior research, particularly earlier studies conducted by Reeve et al. (2024) and Sorenson et al. (2025) [30,45]. All climate variables, described in Table 1, were aggregated to Vanuatu provinces using Python (3.11.7) libraries Geopandas (0.14.4) and Matplotlib (3.6.3). For observed temperature variables, the European Centre for Medium-Range Weather Forecasts Reanalysis Version 5 (ERA5) data were used [52]. For observed precipitation data used in the malaria model, gauge-adjusted reanalysis precipitation products were sourced from Multi-Source Weighted-Ensemble Precipitation (MSWEP V2) [53]. To validate the forecasting aspect of the cattle heat stress model, climate data from ECMWF’s seasonal sub-daily forecast was used. Ensemble methods are used across all timescales to account for uncertainties and assess the likelihood of hazardous weather or climate extremes, and an average of these ensembles was used in this study [54].
The Health Information Systems unit of the Vanuatu Ministry of Health (MoH) manages and stores health data on various spatial scales. The MoH provided anonymised malaria case data for the period of 2014–2023 inclusive. Cases were reported by individual health facilities, recorded from the date treatment began.

2.4. Malaria Model

2.4.1. Malaria Model Data Handling

This study used the following climate variables: observed one-month lagged maximum temperature and one-month lagged total precipitation, chosen to be explored in this study due to previous studies showing an influence on mosquito and parasite lifecycle factors and larval habitat availability, respectively [26,27,31]. The temperature variable was aggregated to monthly maximum values and sampled at a one-month time lag. The observed precipitation variable was aggregated to monthly total values and sampled at a one-month time lag. The one-month lag was intended to capture the period where climate parameters are likely to have an influence on malaria transmission [30]. The summarised values were paired with provincial monthly malaria cases and histograms were produced to analyse skew and data distributions.

2.4.2. Malaria Model Production and Validation

Bayesian models were produced for each province to predict malaria cases depending on climate factors using PyMC (5.15.1), and further developed from previous national models produced by Sorenson et al. (2025) [30]. Malaria cases were modelled using a negative binomial distribution to account for overdispersed non-zero count data. Precipitation variables were modelled with a gamma distribution, to suit continuous and positively skewed data. Temperature variables were modelled using a normal distribution.
Bayesian modelling allows for different parameters to be considered under different distributions or priors, informing the model based on unique characteristics, such as skew or scale [55]. Model fit and uncertainty were evaluated using highest density intervals (HDIs) leave-one-out (LOO) cross-validation and posterior predictive checks. Models with the best performance in these criteria for each province were selected. A model was not produced for Tafea due to declared elimination and minimal case burden. The modelled Equation (1) is as follows:
Ypm ~ Negative binomial (µ, α)
µpm = intercept + β1× maximum temperature + β2 × total precipitation
where Y is the number of malaria cases for the month m and province p, and β1 and β2 are the coefficients for maximum temperature and total precipitation, respectively.

2.4.3. Malaria Risk Map

Risk maps were produced for each province using the predicted output and coloured according to performance against a risk matrix. Provincial climate data were used in the five models (excluding Tafea), providing a predicted case value for each province. The Pacific Public Health Surveillance Network defines a malaria risk threshold, or number of linked cases required to initiate an investigation, as “many” in endemic areas [56]. Given this broad definition, thresholds were developed for each province based on the 10th, 25th, 50th and 75th percentiles of observed cases over the study period, though this could be adapted if outbreak thresholds are identified [57]. Tafea was assigned values of zero to indicate its elimination status.

2.5. Cattle Heat Stress Model

2.5.1. Thermal Indices

The HLI developed by Gaughan et al. (2008) integrates multiple climatic factors—temperature, humidity, solar radiation and wind speed—into an equation that produces a score capable of reliably predicting cattle heat stress conditions [48]. Utilising various established thresholds, the HLI can be adapted for different environmental contexts, recognising that multiple factors, such as genotype and environment, can influence cattle’s susceptibility to heat stress [58,59]. This approach makes the HLI particularly suitable for Vanuatu, given the country’s diverse environmental contexts and the variety of cattle breeds present across the region [34]. Calculated on an hourly basis, the HLI serves as the foundation for the calculation of the AHL, which quantifies the cumulative heat load experienced by cattle during prolonged heat stress events. The AHL is a measure of the intensity and duration of cattle heat stress and provides valuable insight into the potential severity and effect of heat accumulation, which may not be apparent when looking at the HLI alone [60]. Together, these indices enabled a comprehensive evaluation of both immediate and long-term heat stress impacts on cattle, which is crucial for forecasting potentially dangerous heat stress periods in Vanuatu.

2.5.2. Calculation of the Heat Load Index

The HLI was calculated on a six-hourly basis for the forecasted week, using ECMWF forecast data (Table 1). Its calculation was contingent on the black globe temperature (BGT), the measurement of the temperature inside a thin, hollow black copper sphere [61]. If BGT readings are not available, they can be approximated using the formula provided in Equation (2):
BGT = 1.33T − 2.65√T + 3.21 log10 (SR + 1) + 3.5
where T is the ambient air temperature (°C) and SR is the solar radiation (W m−2) [48].
If the BGT ≥ 25 °C, the HLI is calculated using Equation (3):
HLIHI = 8.62 + (0.38 × RH) + (1.55 × BGT) + e(−WS + 2.4) − (0.5 × WS)
where RH is the relative humidity (%), e = the base of the natural logarithm (approximate value of e = 2.71828), and WS is the wind speed (m s−1) [46].
If the BGT is < 25 °C, the HLI can be calculated using Equation (4):
HLILO = 10.66 + (0.28 × RH) + (1.3 × BGT) − WS
A ‘blended’ function for the calculation of the BGT (BGTbl) was formulated by Gaughan et al. (2019) to account for the transition across the BGT threshold of 25 °C, using Equation (5) [48]:
BGTbl = 1/(1 + (e[-(BGT − 25)/2.25])
Applying Equations (2)–(4), a blended HLI (HLIbl) can be calculated for this transition following Equation (6):
HLIbl = BGTbl × HLIHI + (1 − BGTbl) × HLILO

2.5.3. Heat Load Index Thresholds

The susceptibility of cattle to heat stress is contingent on both the individual characteristics of cattle, such as their age, coat colour, breed and physiological condition, as well as the conditions of their surrounding living environment [62]. As a result, multiple HLI thresholds have been established to reflect how these different factors, quantified in the HLI by Gaughan et al. (2008), can influence the heat stress experienced by cattle [46]. This approach can allow farmers to determine when their cattle may become heat stressed, depending on their local environmental conditions and the specific characteristics of their cattle.

2.5.4. Calculation of Accumulated Heat Load

AHL offers a more comprehensive measure of cattle heat stress by capturing both the intensity and duration of exposure to heat stress conditions. While the HLI provides an instantaneous measurement of heat stress, the AHL tracks the accumulation of a heat load, caused by heat stress, over time [46]. Following the methodology outlined in Reeve et al. (2024), the heat load balance was calculated based on hourly HLI values, depending on whether the actual HLI exceeded or fell below certain thresholds [45]. Based on this prior research, an upper HLI threshold of 93 was selected for the calculation of the AHL in this study, representing the threshold for a B. indicus (50%) × B. taurus (50%) steer, determined to be the most probable genetic composition and environmental adaptation of cattle in Vanuatu [45,63].
Cattle can typically recover from short periods of high HLI values if they are allowed sufficient time to dissipate a heat load during the night or between heat events. However, extended periods of high AHL indicate severe heat stress, which can have lasting physiological impacts and increase mortality rates [40]. If cattle enter heat stress periods with a high AHL, even lower HLI values can exacerbate the experienced heat stress [46]. To better understand the heat stress risk leading into the forecasted week, this study categorised the AHL values of the previous week as: ‘zero’ (<1), ‘mild’ (1–10), ‘moderate’ (10–20), ‘hot’ (20–50) and ‘extreme’ (>50) [48]. These categories enabled identification of the potential severity of heat stress in the coming forecasted week.

2.5.5. Cattle Heat Stress Model Data Handling

To ensure consistent temporal resolution across all datasets, the 24 h solar radiation data were approximated to six-hourly measurements. This was achieved by distributing the 24 h total based on sunlight availability throughout the day: 0% between 11 pm and 5 am, 25% between 5 am and 11 am, 50% between 11 am and 5 pm, and 25% between 5 pm and 11 pm. These proportions were then divided by six to derive an hourly estimate for each interval. For the previous week’s observational data, HLI values were calculated on an hourly basis, which were then used to compute the AHL for the same period. For the forecast week, HLI values were calculated at six-hour intervals using forecast data. Spatial data were aggregated by province by averaging the values from each raster cell corresponding to that province, allowing for a province-level analysis across Vanuatu.

2.5.6. Cattle Heat Stress Risk Maps

Daily heatmaps depicting the daily maximum HLI values across Vanuatu were created for the forecasted week. A time series graph, depicting the six-hourly forecast HLI values for each province across the forecasted week, was also developed, allowing for the identification of potential heat stress and cooling off periods. Based on the AHL of the previous week and the HLI values of the forecasted week, a risk matrix was developed using the AHL categories and HLI thresholds. This matrix was used to develop a weekly risk map depicting the potential impact of heat accumulation in cattle for each province within Vanuatu within the forecast period.

2.6. Early Warning Bulletin Production

A literature review was undertaken to inform the development and design of the EWS bulletins for malaria transmission and cattle heat stress. The review included an examination of academic peer-reviewed articles and the grey literature from relevant industry organisations. Key terms utilised in the literature search were categorised into Population, Exposure and Outcome, and are displayed in Table 2. The literature search was conducted via electronic databases including Scopus, PubMed and Google Scholar. This search further informed the selection of the response strategies presented in the EWS bulletins.
Adapted from Dash (2024) and Taylor et al. (2023), this study used a Risk–Response matrix to communicate the outputs from the malaria and cattle heat stress forecast models [64,65]. The Risk–Response matrix was designed to indicate the likelihood and potential impact of environmental hazards and clearly convey the different levels of warning associated with increasing risk. The corresponding ‘Risk Level’ and ‘Response’ tables ensure appropriate action is linked to the relevant risk level [66]. In this study, the Risk–Response matrix provided a precedent for communicating the model forecast outputs as simple warning messages. Furthermore, it provided the basis for risk maps and risk assessment visualisation in the EWS bulletins.

3. Results

3.1. Monthly Predictive Malaria Model

3.1.1. Malaria Descriptive Analysis

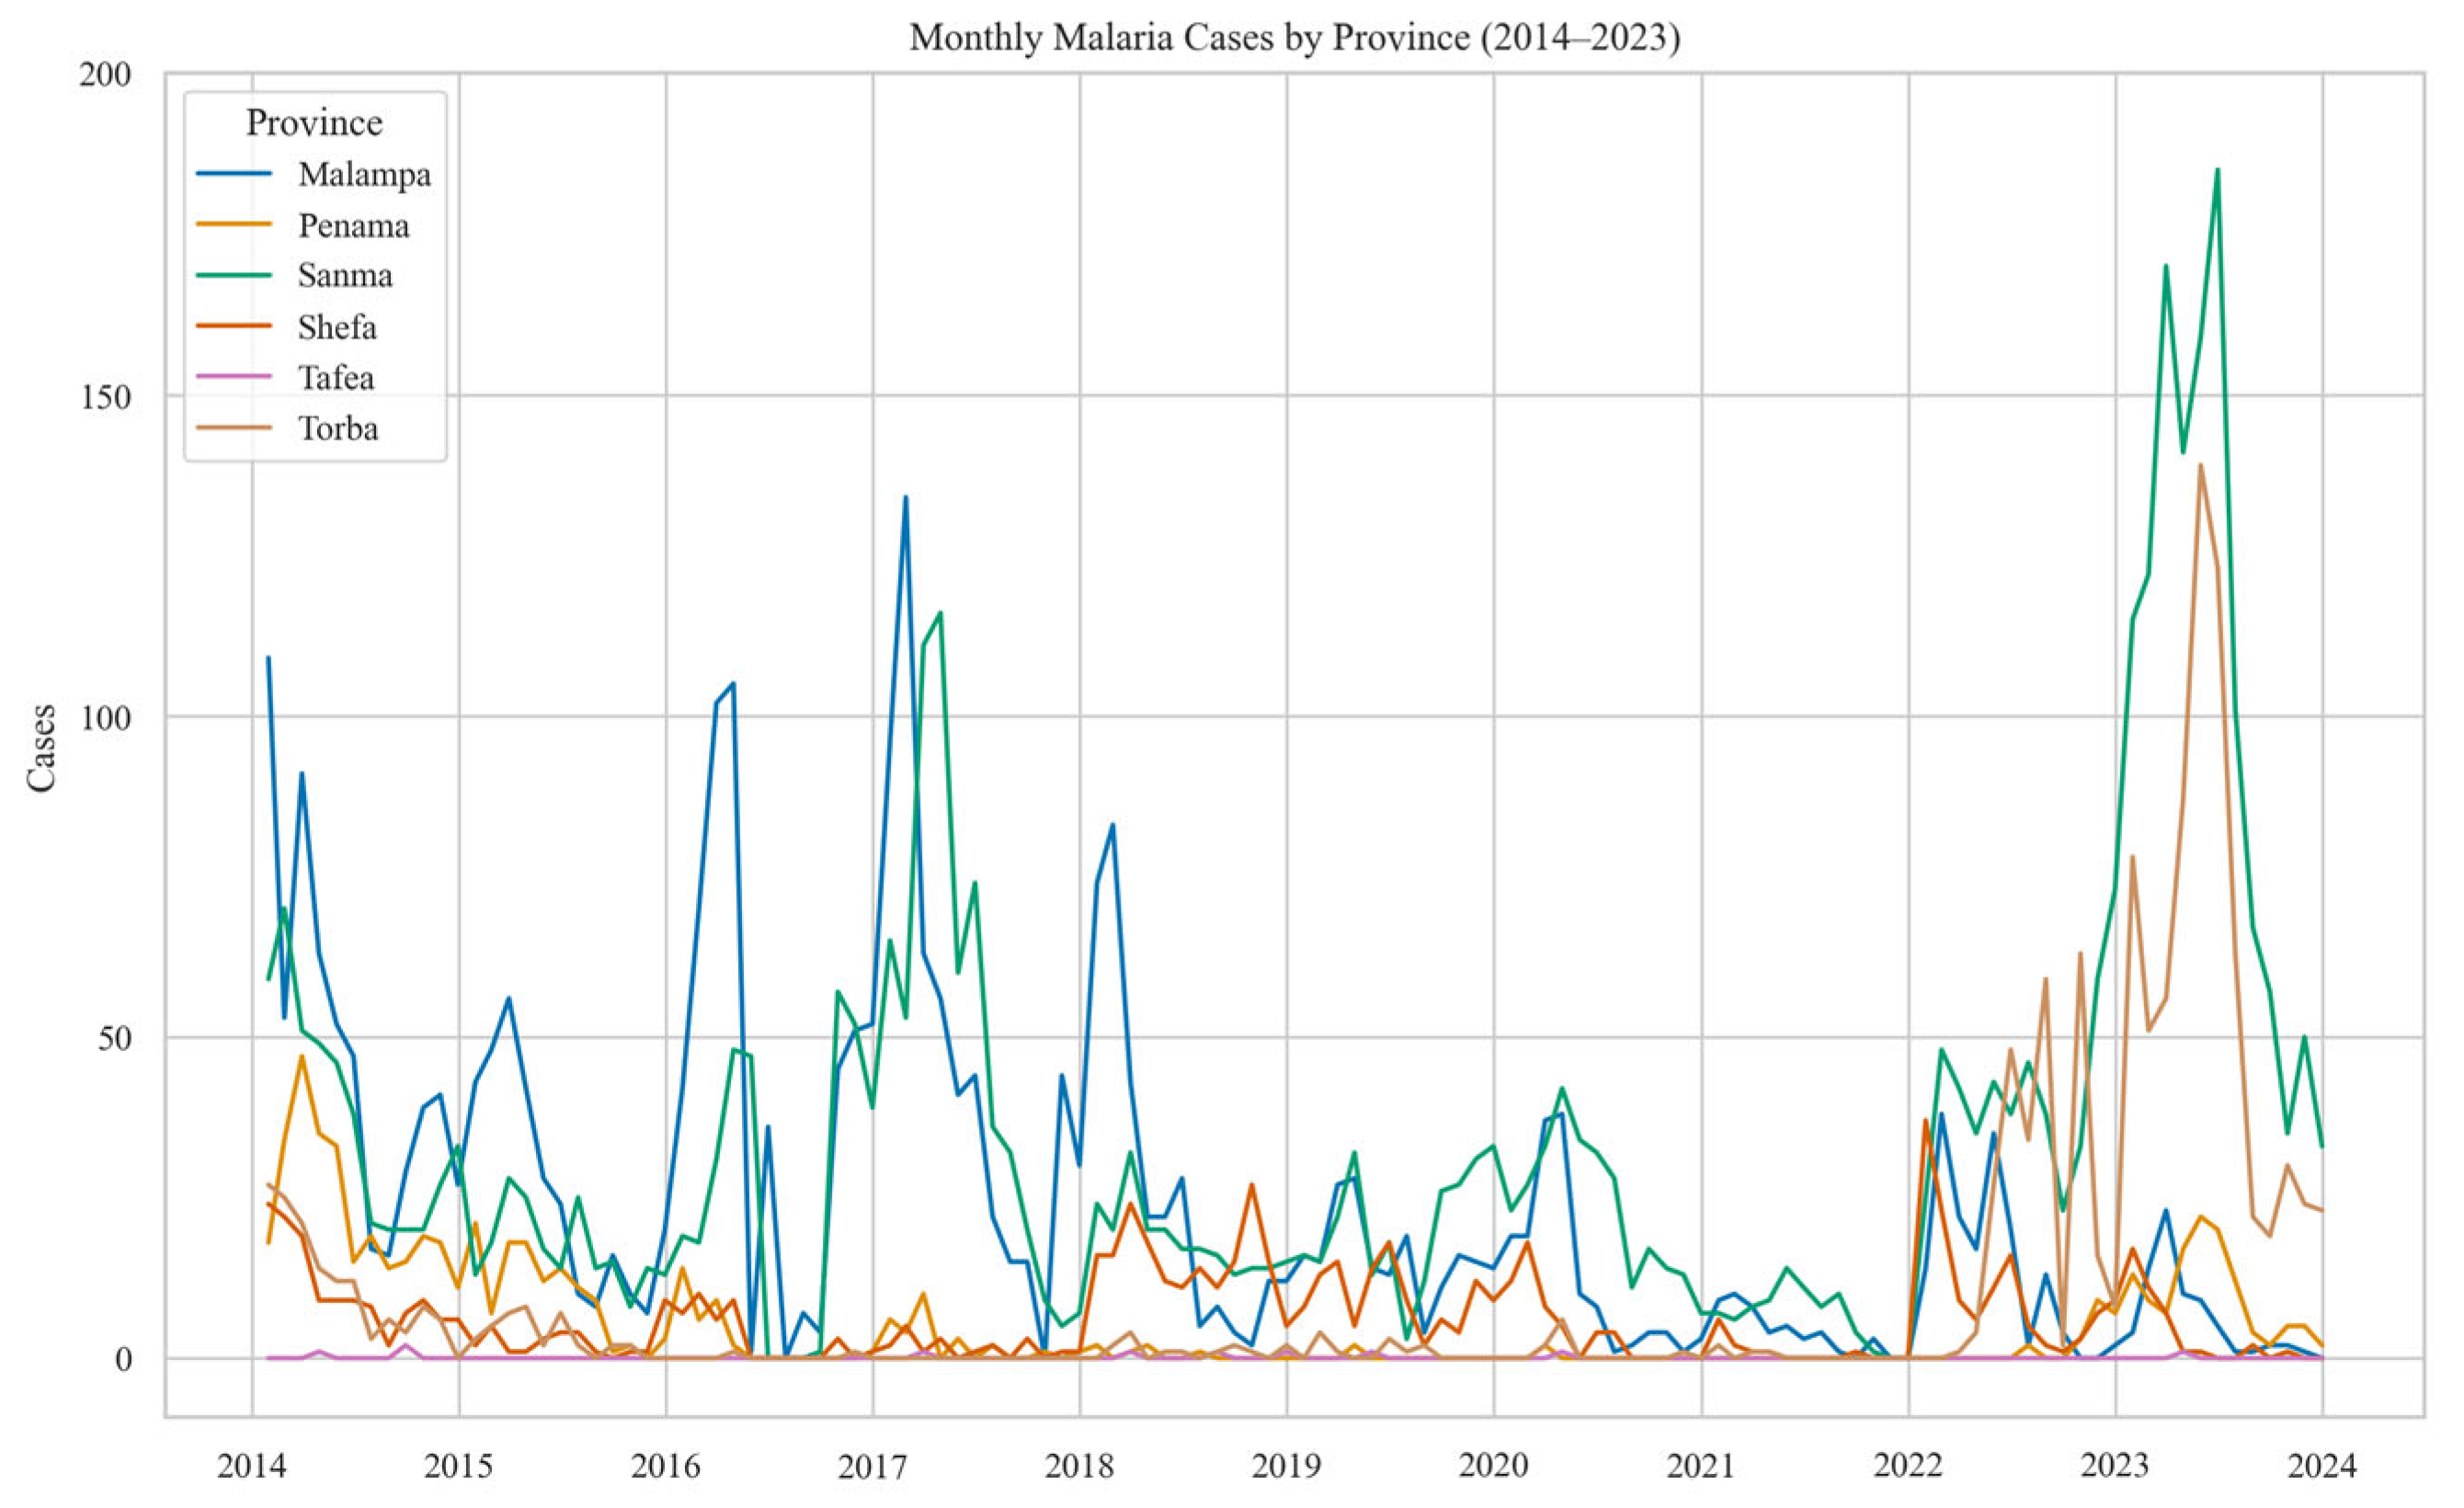
All provinces in Vanuatu experience varying rates and burdens of malaria, showing some seasonality, typically peaking around the middle of the wet season. There was an overall decline in case numbers over the study period until spikes in 2022 (Figure 2). Over the study period of 2014–2023, Sanma displayed consistently higher case numbers than the other provinces yet followed a similar downward trend until large spikes in 2017 and 2022. Torba had few cases trending towards zero until outbreaks in 2022, increasing prevalence to over 100 cases per month, and Penama showed a similar trend, though showing smaller peaks in cases. Malampa showed a downward trend in cases that was maintained from 2019 onwards. Tafea showed consistent maintenance of elimination. Sanma, Malampa and Torba displayed varied trends in malaria case burden (moderate, decreasing and increasing, respectively) and were thus chosen as case studies for subsequent modelling and mapping.

3.1.2. Malaria Bayesian Modelling

For all provinces, models using maximum temperature and total precipitation at a one-month lag showed the best performance. Models for Malampa, Sanma and Torba, provinces with varied historical case distribution, show model convergence and fit (Table 3). All provincial models showed that a unit increase in maximum temperature (°C) and total precipitation (mm) was associated with increased malaria cases, though this impact was greater in the Malampa and Sanma models. The mean effect of maximum temperature on malaria in the model was 0.59 (94% HDI 0.36, 0.86) in Malampa and 0.65 (94% HDI 0.34, 1.03) in Sanma, compared to 0.23 (94% HDI 0.08, 0.37) in Torba. These wide HDIs indicate uncertainty in the likely effect that maximum temperature has on malaria risk in the model. In contrast, the effect of precipitation is much less influential on malaria risk in the model and shows narrower HDIs, being 0.04 (94% HDI 0.00, 0.07), 0.07 (94% HDI 0.02, 0.11) and 0.02 (94% HDI 0.00, 0.03) for Malampa, Sanma and Torba, respectively.
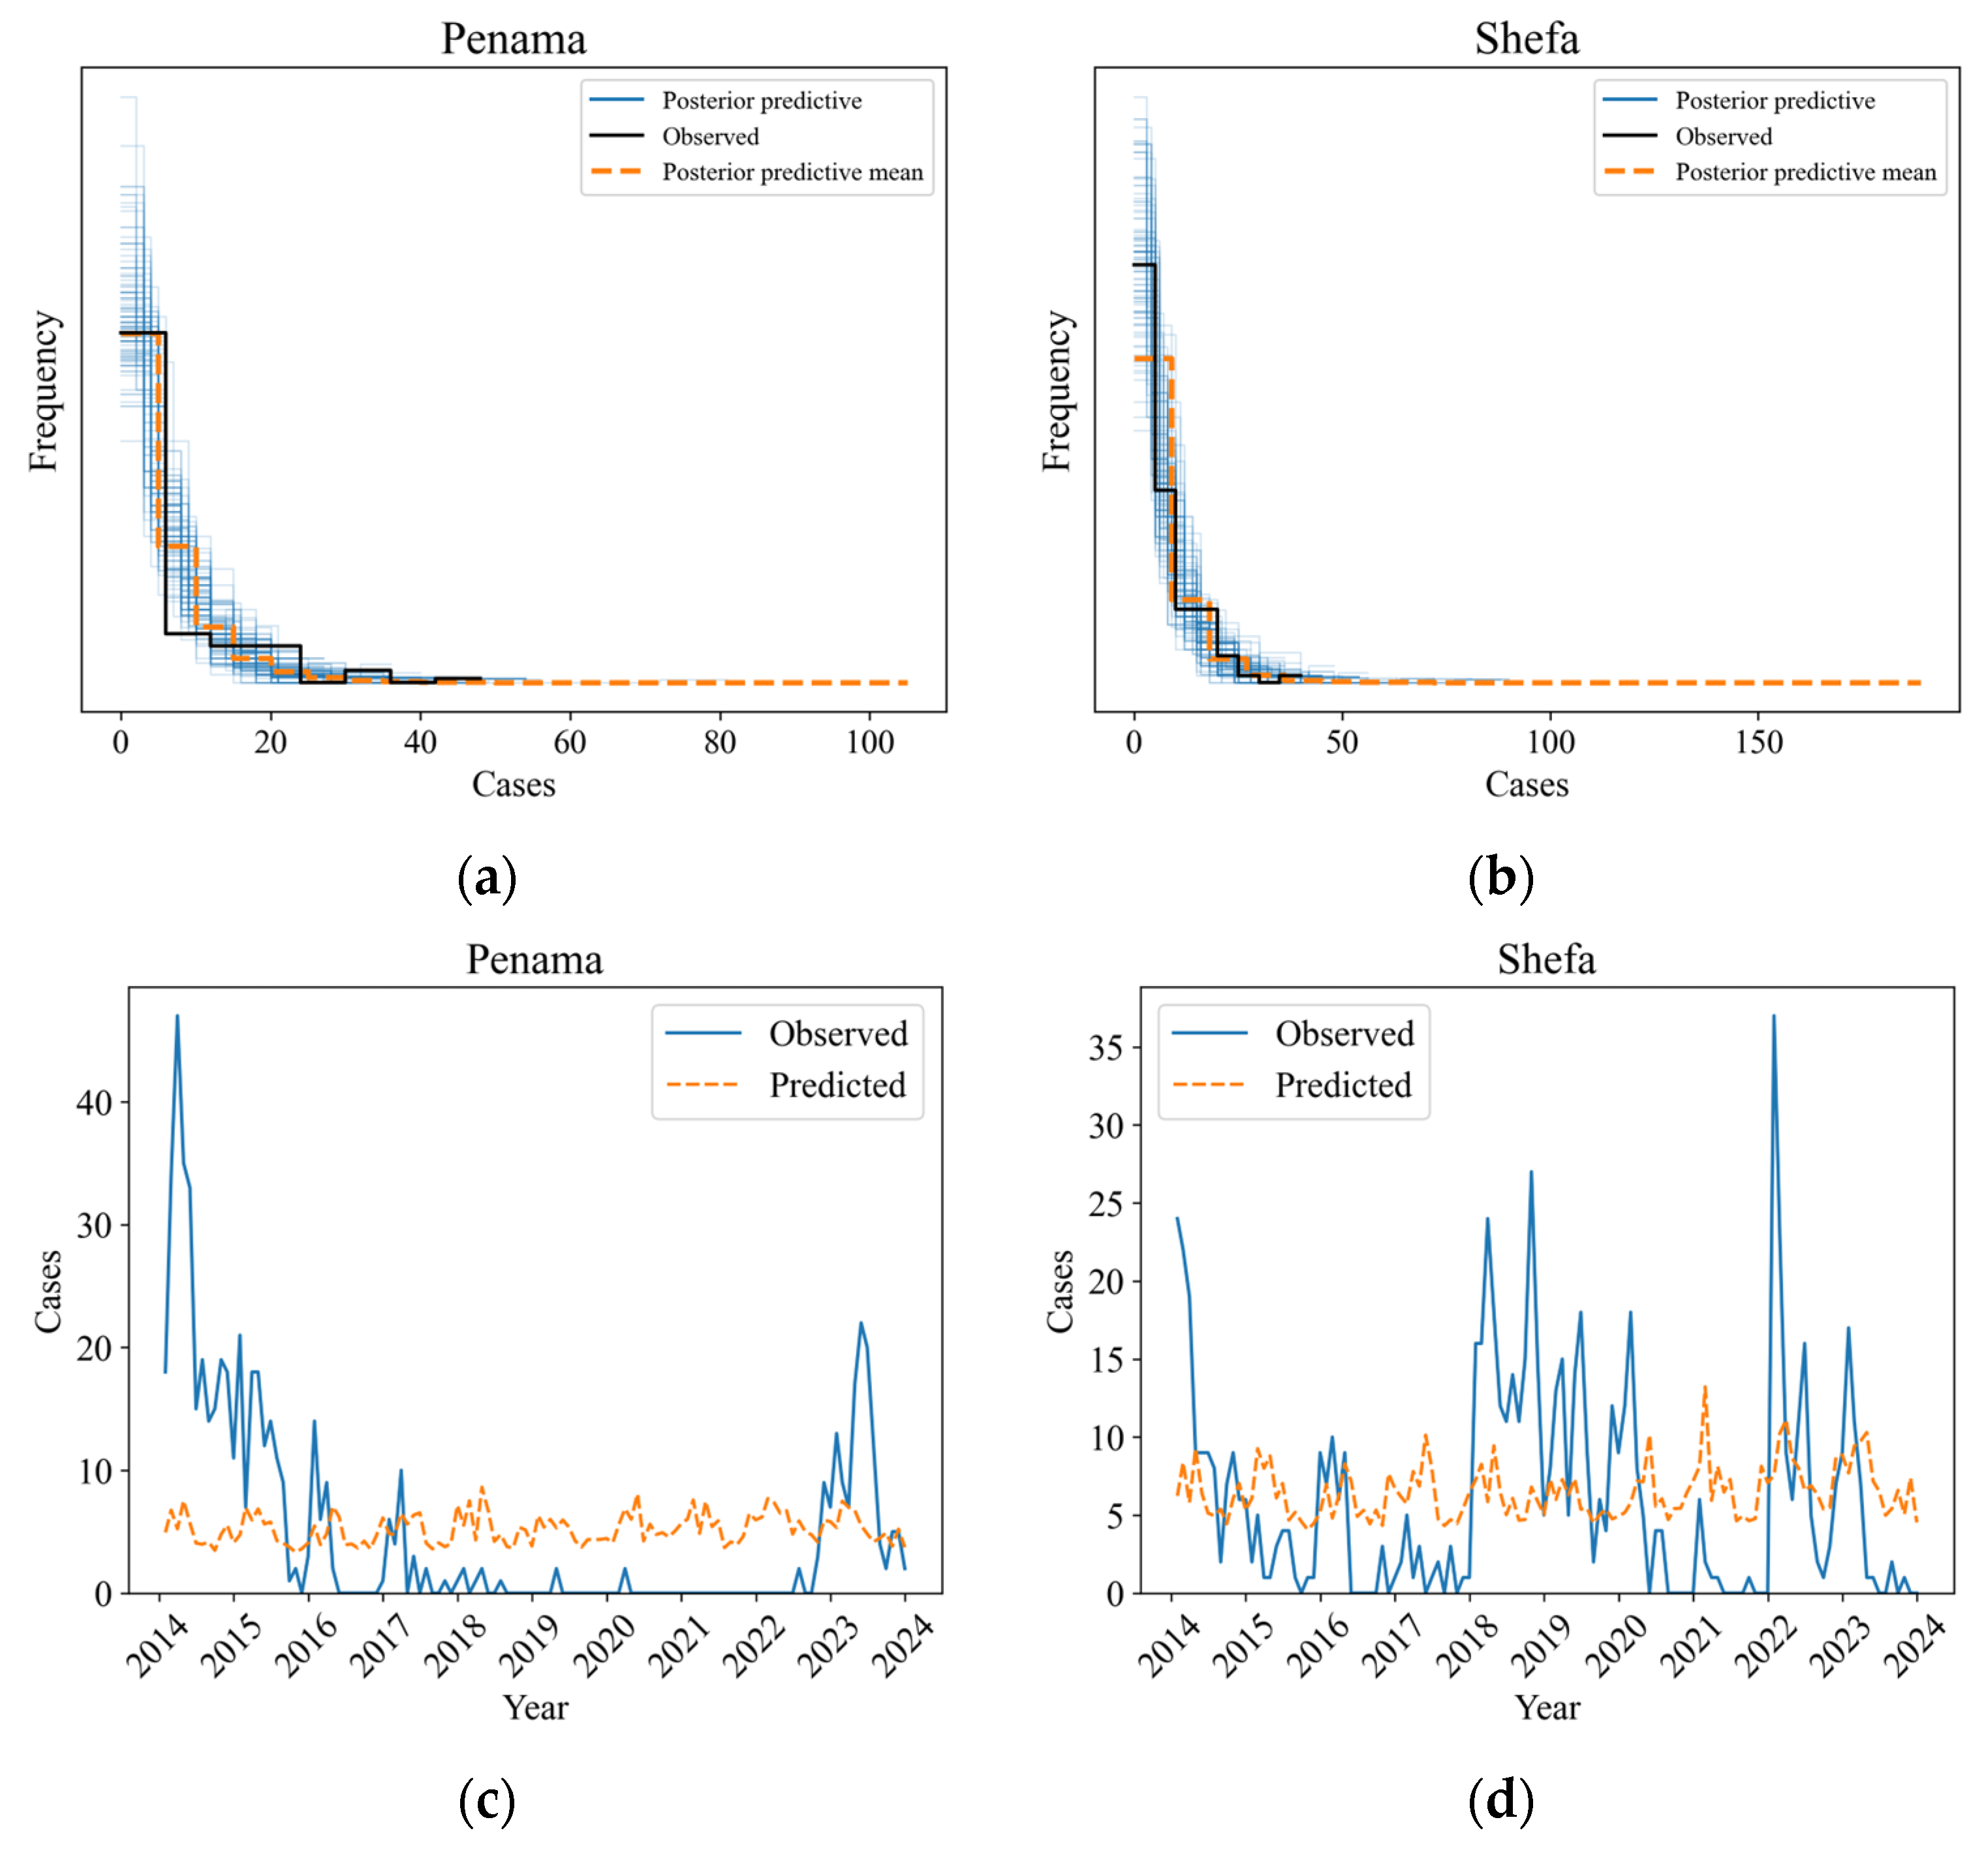
All models had an R-hat value of 1.0, indicating model convergence and the reliability of the estimated HDIs. The essential sample size values for the tail for the Torba model are relatively low (964.0 for temperature and 905.0 for precipitation), modelled using Torba monthly cases that are strongly positively skewed. Penama and Shefa values are described in Appendix A.
Qualitatively, posterior predictive plots for all provinces indicated good model fit (Figure 3). The posterior predictive mean (orange line) aligned with the observed case numbers over the study period, particularly when predicting moderate case numbers. Torba showed less convergence between the predicted cases and observed cases from the model and is a province that has a high proportion of months with zero observed cases until surges in 2022. Penama and Shefa’s plots are shown in Appendix B. The posterior predictive mean from each province model was then used to produce predicted case outputs for each province in Vanuatu. This was then compared to the observed malaria cases for each province.
The climate-based predictions indicated case seasonality across all provinces, peaking at similar patterns throughout the study period, though there is still misalignment in magnitude and timing of outbreaks (Figure 4). Malampa and Sanma showed similar peaks between observed and predicted cases, though the magnitude of these peaks varied more in the observed cases. Downward trends or spikes in observed cases were not typically captured by the model, particularly in the Malampa model. In comparison, the model predicted a stable case trend for Torba, though these predictions overestimated case burden for a province that largely had zero cases until 2022, based on climate conditions conducive to malaria transmission. Penama and Shefa’s line plots are shown in Appendix B.

3.1.3. Malaria Risk Map for January 2020

For the case study period of January 2020, the climate parameters used in the forecast model (total precipitation and maximum temperature) are mapped in Figure 5. The conditions leading up to the case study period showed low precipitation for December 2019 across all provinces, particularly during the wet season. Temperatures across all provinces showed an increase leading into January 2020. This climate context informed model predictions for January 2020.
The malaria risk matrix combines climate monthly antecedent conditions (total precipitation and maximum temperature). Predicted cases, determined by this interaction, were converted to a percentile that corresponds to a risk category, calculated specifically to each province’s historical malaria case burdens. Each colour on the risk matrix indicates an increasing risk level and associated response level (Figure 6).
Based on the malaria risk matrix, a risk map was produced for January 2020, comparing observed to predicted cases (Figure 7). The risk categories were based on percentiles of provincial cases. In provinces with lower case burden, such as Torba, Penama and Shefa, percentiles were skewed towards lower case values, which is represented by a lower threshold for what is categorised as high risk. Sanma and Malampa are provinces with more instances of non-zero case months, which have been appropriately flagged as low and medium risk, respectively. In comparison, the observed malaria cases in Shefa (Figure 7a) were lower than what was predicted by the model (Figure 7b). An additional map for a low-risk period during August 2017 is shown in Appendix C.

3.2. Weekly Predictive Cattle Heat Stress Model

3.2.1. Heat Load Index Forecast

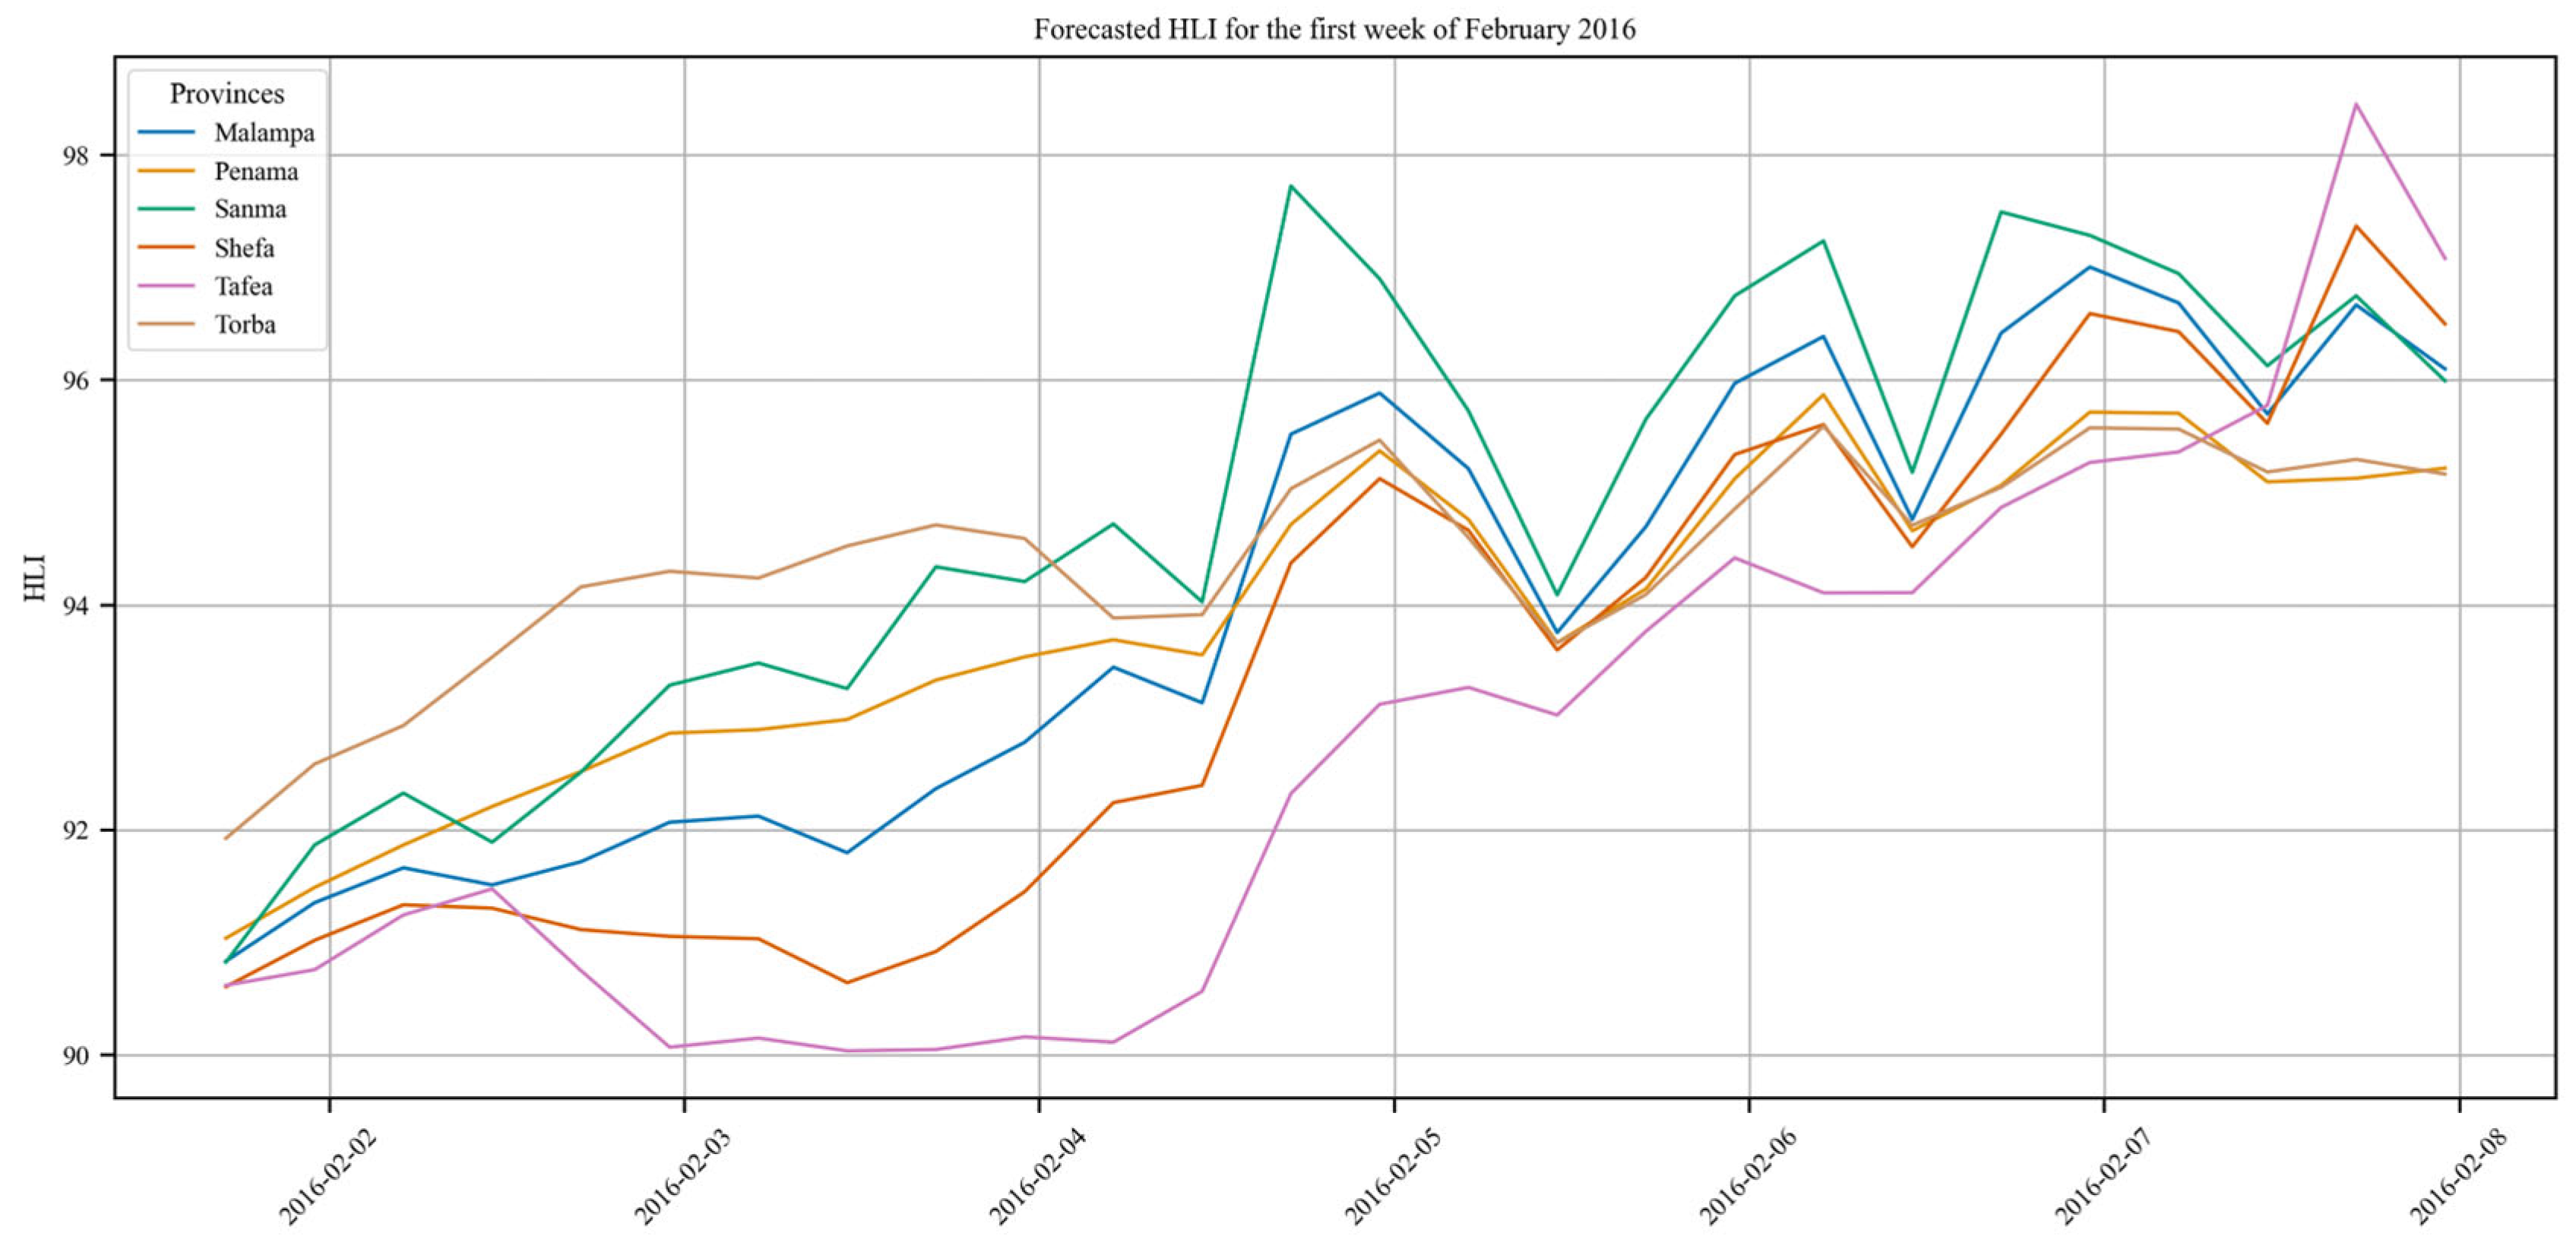
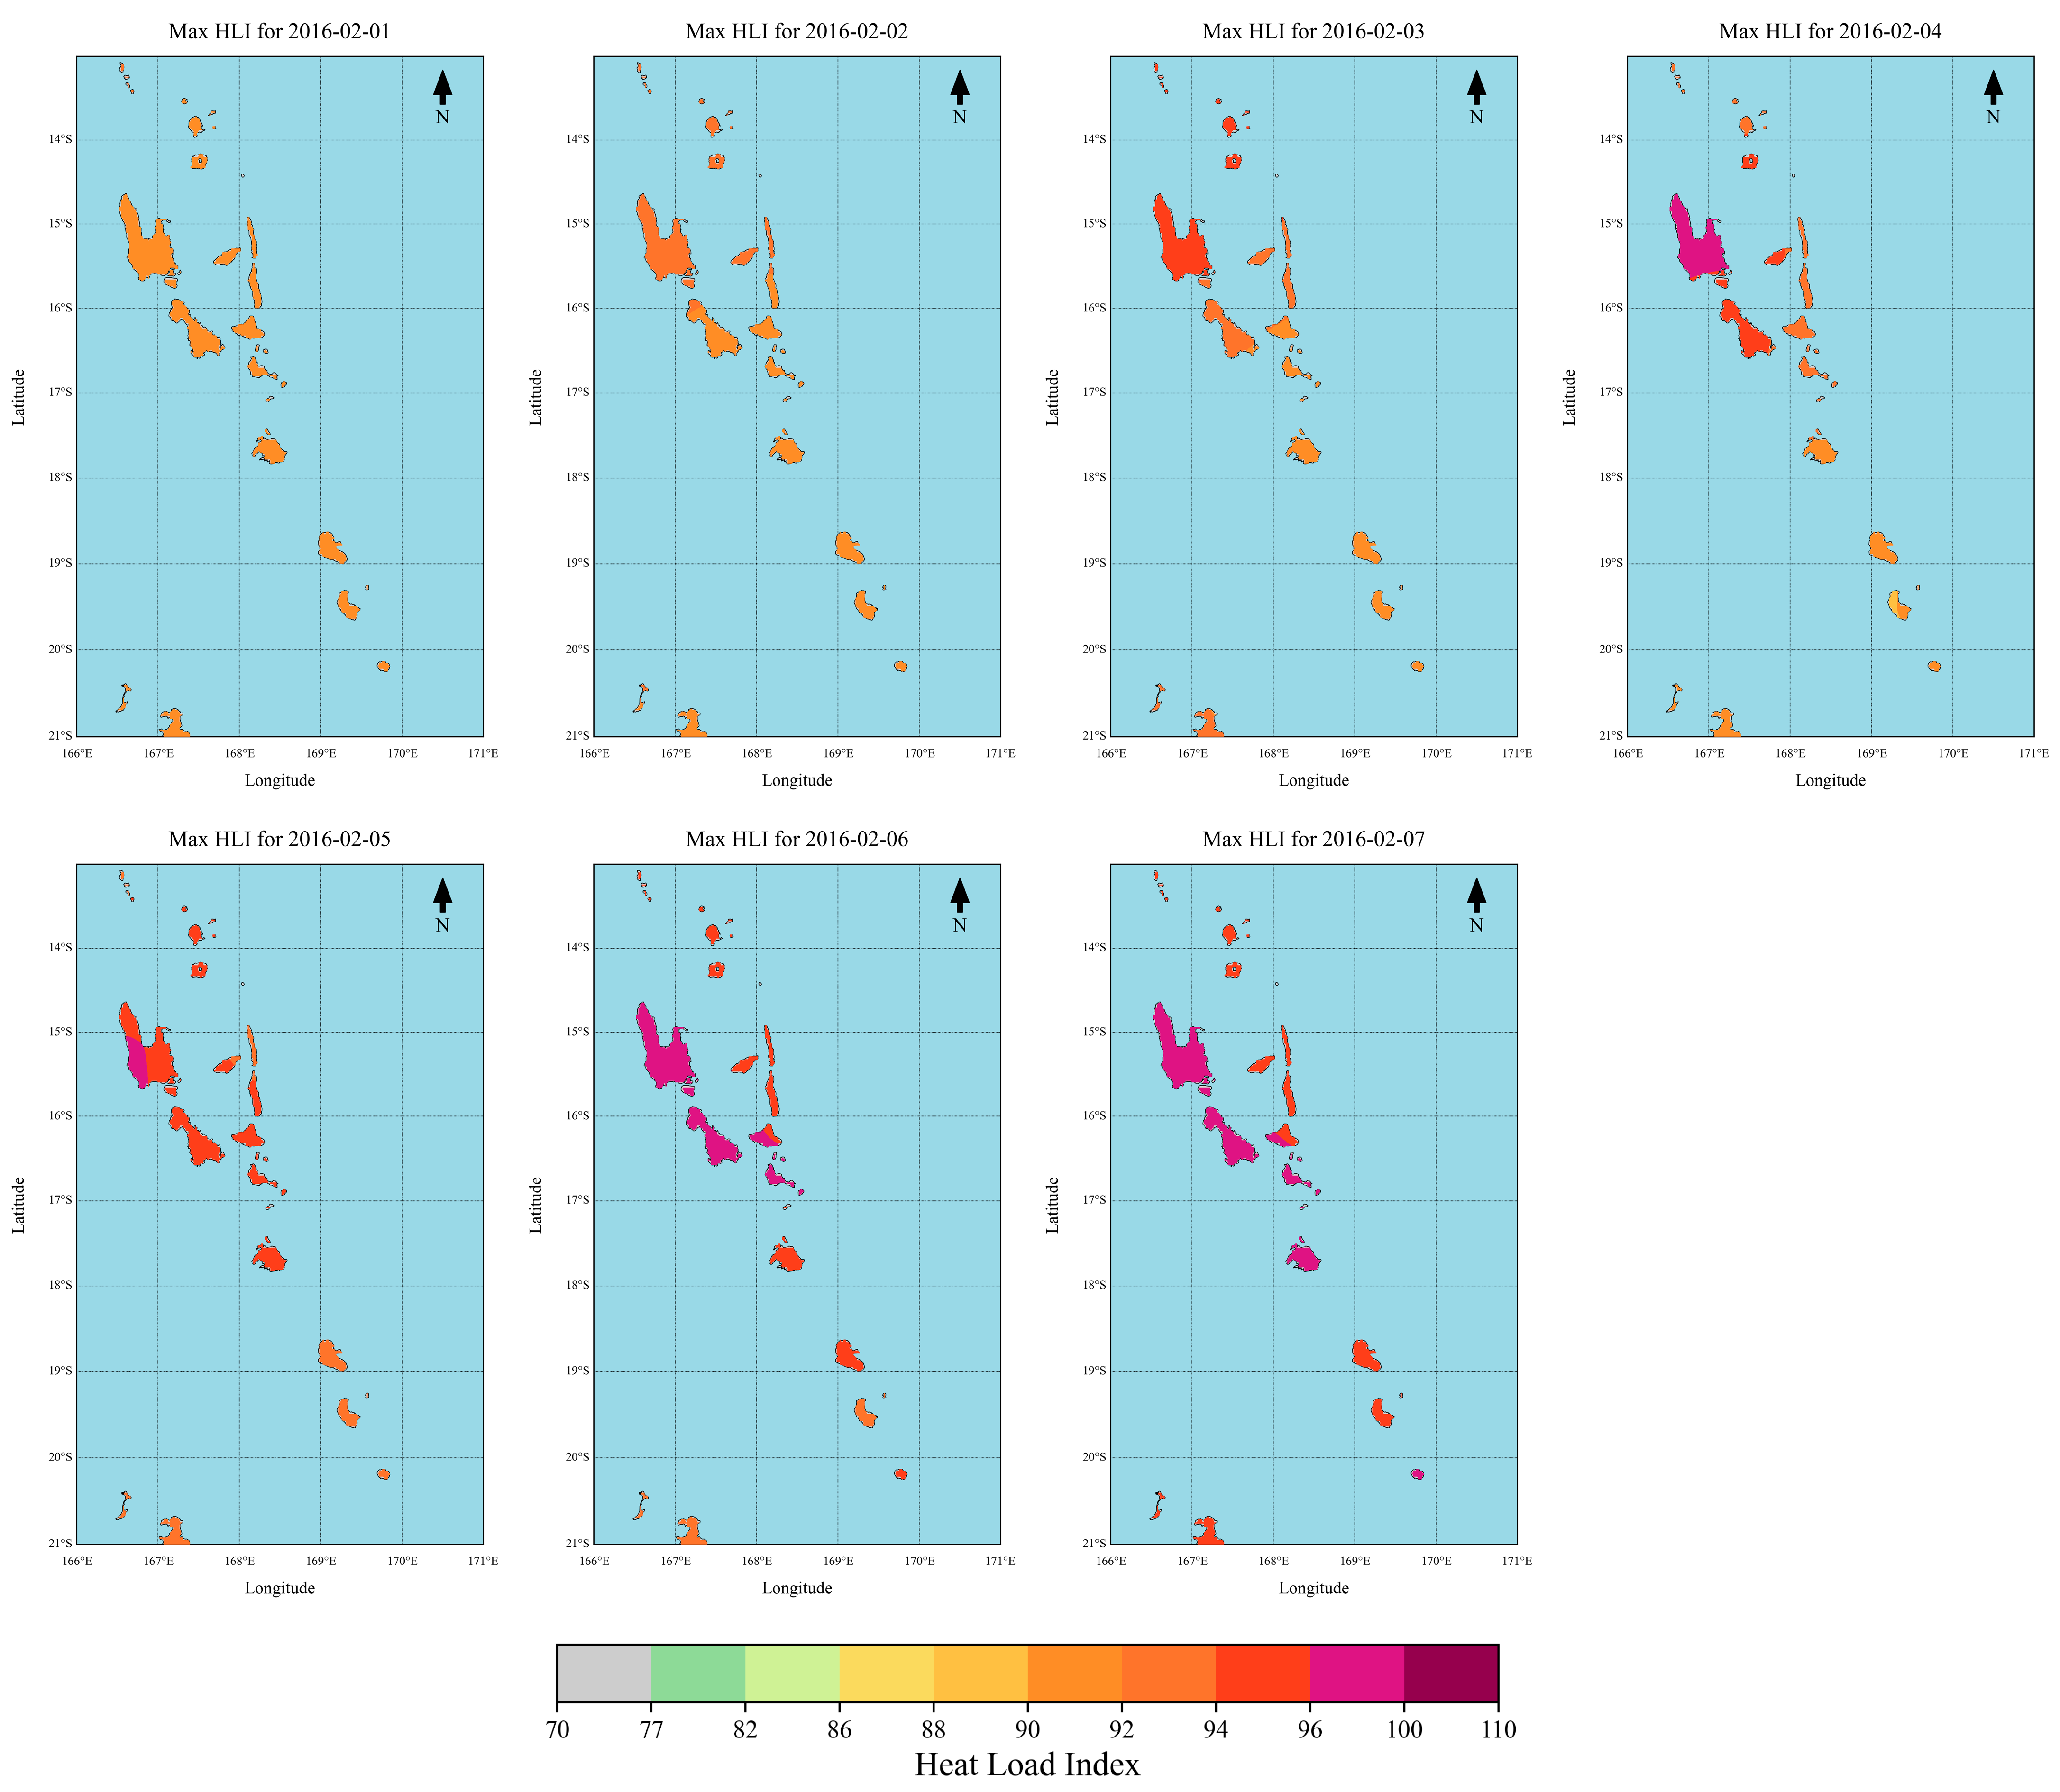
The case study period of the 1st–7th of February 2016 was used to assess the cattle heat stress model’s ability to predict heat stress conditions and the risk of an AHL over a forecasted week, using the HLI and AHL as proxies. Based on the weekly forecast model, an upward trend in HLI was observed across Vanuatu during the first week of February 2016 (Figure 8). In comparison to southern provinces such as Tafea and Shefa, northern provinces such as Torba and Sanma exhibited higher HLI values throughout the week. The visualisations of daily maximum HLI use different colours to represent HLI thresholds, making it easier to identify periods of heat stress for various cattle breeds and environmental contexts across Vanuatu (Figure 9).
Overall, the forecasted HLI values for the first week of February were notably elevated, particularly during the mid and later parts of the week. While elevated HLI values are typical for the peak of the wet season, this forecast suggested particularly severe heat stress conditions [45]. Midweek, HLI values exceeded 93 across all provinces and continued to fluctuate between 93 and 98 as the week progressed (Figure 8 and Figure 9). This indicates that all breeds of cattle in Vanuatu were likely to experience significant physiological impacts from this heat stress period. Furthermore, the absence of any low HLI values (below 77) indicates that cattle would not have experienced respite from the stressful conditions, making it challenging for them to dissipate a heat load during this time.

3.2.2. Accumulated Heat Load Risk Map for February 2016

The cattle heat stress risk matrix combines the previous week’s AHL with the number of days during the forecasted week when the HLI exceeded or fell below key thresholds (Figure 10). The matrix illustrates how HLI values influence changes in AHL. For instance, when the HLI exceeds 93, heat stress intensifies, leading to a heat load buildup. Conversely, when the HLI drops below 77, heat dissipation occurs, reducing the AHL. Days with HLI values between 77 and 93 are considered neutral, where little change in AHL is expected. In the instance that a single day forecasted both ‘hot’ (HLI > 93) and ‘cool’ (HLI < 77) conditions, it was classed as a ‘neutral’ day. The risk matrix assigns risk levels and associated responses by integrating both the starting AHL from the previous week and the likelihood of it increasing, decreasing or remaining stable based on the forecasted HLI values. For example, if the AHL is low at the start of the week but several ‘hot days’ are expected, there is a higher risk that a heat load will accumulate, which will escalate the impact of a heat stress event. Conversely, if the AHL is high and several ‘cool days’ are forecasted, the risk of a more severe or prolonged heat stress event decreases as the heat load is expected to dissipate.
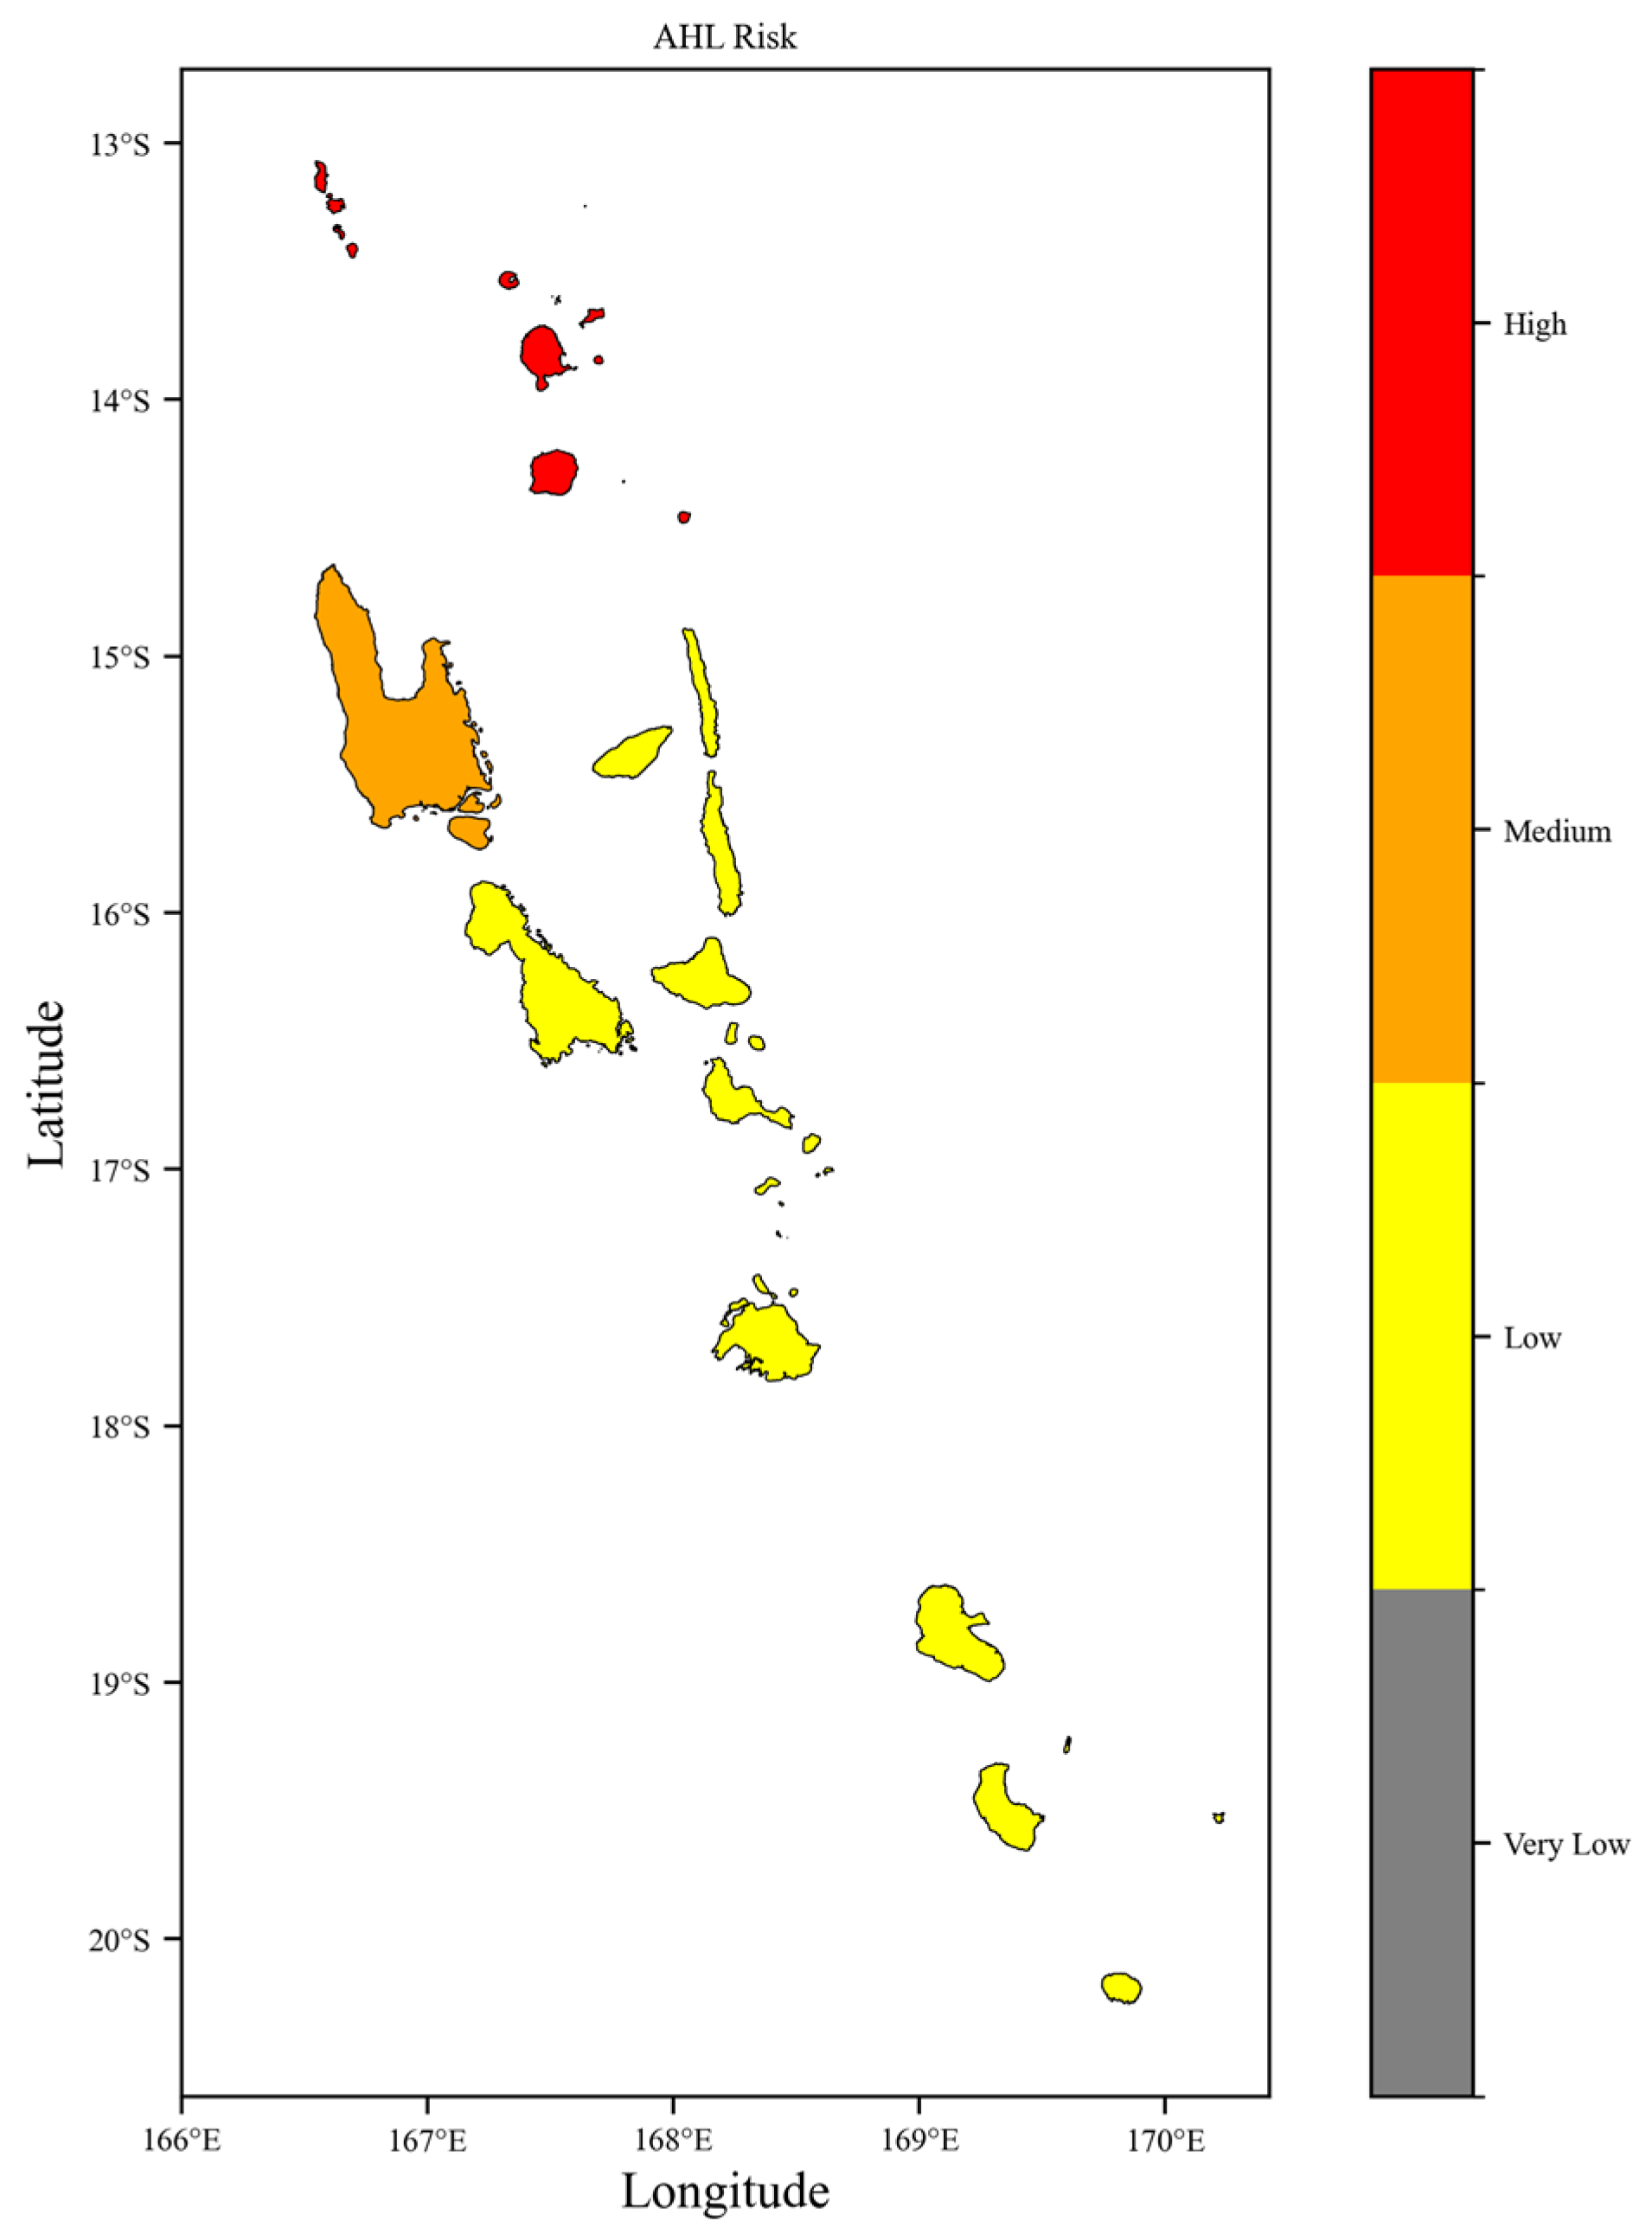
By combining these two dimensions, the matrix offers an assessment of how AHL may evolve over time, highlighting the potential severity of heat stress during the forecasted week. This matrix was applied to the results from the February 2016 forecast period to produce the AHL risk map in Figure 11.
The risk map generated for this week indicates an elevated risk of heat load accumulation across most provinces, particularly in the northern regions. The province of Torba showed a high risk of experiencing extreme AHL, while Sanma was classified as medium risk, likely to encounter severe AHL that may escalate to extreme levels. These conditions could significantly exacerbate the impact of the severe heat stress conditions forecasted for this week through the HLI values (Figure 8 and Figure 9). This elevated risk was primarily attributed to high starting AHL values at the beginning of the week, as shown in Table 4. Furthermore, the forecast predicted numerous ’hot days’ (where HLI exceeds 93) for most provinces, contributing further to the heightened risk, as shown in Table 5.
The model generated a detailed heatmap that illustrated the risk of an AHL across the provinces, highlighting the varying risk levels influenced by the unique conditions in each region. This visualisation indicates the subtle differences in risk, demonstrating how local factors affect the overall potential for heat load accumulation. The risk model performed as expected, accurately capturing the variations across provinces and reflecting the heightened risk scenario. For comparison, a risk map for a low-risk scenario (first week of January 2023) was also developed (Appendix D). The model was not validated against observational data, as it is based on the proven methodologies established by Gaughan et al. (2008), and any discrepancies may be attributed to the accuracy of the forecast climate data used [46].

4. Discussion

4.1. Malaria Early Warning System

4.1.1. Malaria Early Warning System Delivery and End-Users

Vanuatu’s healthcare sector is characterised by a complex web of multidisciplinary stakeholders. While the malaria EWS bulletin is targeted at the MoH, it is beneficial to understand how the early warning information would be distributed throughout the healthcare sector and reach end-users. Engagement in malaria elimination has been found to be greater when influential community members encourage the wider community to engage with malaria prevention initiatives [67]. Atkinson et al. (2010) found that, across provinces, the flow of health information cascaded forward from health officers, campaign teams and village health workers to other community leaders such as chiefs, church leaders and teachers [68]. Harnessing this flow of information, adopting clear and standardised messaging that reinforces the importance of consistent use of malaria prevention measures was found to be most effective in promoting community action. Such findings provide a framework for the MoH to identify which stakeholders can be engaged when malaria risk increases and response strategies need to be actioned.

4.1.2. Malaria Response Strategies

It is critical that knowledge and awareness of malaria risk is combined with safe and effective behavioural practices [69]. The EWS bulletins combine the model’s predicted malaria risk with response strategies to indicate to the MoH how communities and sectors can adequately respond to increases in malaria transmission, with a particular focus on surveillance and vector control. As a health priority nationally, surveillance is targeted at all provinces with active malaria loci [21]. In Vanuatu, malaria case surveillance includes active case detection (ACD), which can be either proactive or reactive, as well as passive case detection (PCD). ACD detects cases through screening in communities and households located in high-risk areas, increasing early detection of cases, while PCD refers to case detection among patients seeking treatment in a health centre [21,70]. Key vector control methods in Vanuatu include long-lasting insecticide nets (LLINs) and indoor residual spraying (IRS). In 2023, over 50,000 LLINs were distributed nationally, achieving 92% of the target amount [15]. IRS is primarily targeted in houses and neighbouring areas in response to suspected or confirmed cases, and was a key action conducted in 2023 responding to Torba and Sanma outbreaks [15,71].
Table 6 outlines response strategies intended to show MoH decision makers how communities and industries can reduce malaria transmission based on their month-to-month risk levels. Corresponding to the malaria risk matrix (Figure 6), the evidence-based response strategies inform the ‘Responses’ section in the malaria EWS bulletin.

4.1.3. Malaria Model Performance

The model showed better predictive ability for provinces with consistently high malaria cases between 2014 and 2023, shown in Sanma and Malampa. This may be associated with the distribution of health facilities across Vanuatu, where major health centres are in Sanma and Malampa [20,21]. In contrast, the model for Torba, a province with low case burden until spikes in 2022, predicted higher case numbers than were observed. However, a key increase in cases not captured in the Torba model overlaps with the sharp jump in COVID-19 presence in Vanuatu [80]. These unexpected events can impede individuals’ ability to seek healthcare, further contributing to outbreak vulnerability and worsened health outcomes [15,81,82].
The malaria EWS, based on prior climate conditions, accounted for the general influence of climate on mosquito and parasite development. This ensured that model predictions remained in an appropriate time frame in relation to diagnosed cases, where mosquito habitat availability (influenced by precipitation), lifecycle rates and biting aggression (influenced by temperature) exert influence in the weeks leading up to an individual presenting malaria symptoms, not months [25,26,27,29,31]. All climate variables in the model showed positive relationships with malaria incidence of varied strengths, with total lagged precipitation having a weaker influence than temperature. Maximum lagged temperature had the strongest influence on cases, a relationship that has been explored previously in the South Pacific region [26,27,30].
The wide HDIs shown in multiple provincial models indicated uncertainty that should be considered in predictions, likely due to extraneous variables. A predictive malaria model is limited by using only climate data, and its accuracy and adaptability to changing epidemiological contexts could be improved by incorporating external factors. Climate data do not account for aspects of social and infrastructural aspects of transmission, such as elimination progress, population movement and access to healthcare services, all of which have been previously associated with variable malaria transmission in Vanuatu [15,20,21]. In particular, access to and by healthcare services is a significant factor in malaria risk in Vanuatu, where malaria burden is increasingly concentrated in hard-to-reach areas [74,82]. Further, competing outbreaks and EWCEs are likely to be influential, and future modelling would benefit from exploring these factors.
Evaluation of the model’s tendency to over- or underestimate risk is crucial when considering its usefulness as an operational system. The climate-based model produced different periods of over- and underestimated risk, predictions that may reduce user trust. When malaria risk is overestimated, nonessential implementation of the response strategies may have financial or infrastructural implications [70]. While periods of underestimated risk occurred less frequently, in an operationalised EWS, these would likely have more severe implications for community health. Underestimating malaria risk may reduce risk perception and limit opportunities to prevent or treat cases, and outbreaks may go undetected. Climate models and predictions should be supplemented with non-climate risk information and expert knowledge, and uncertainty should be communicated.
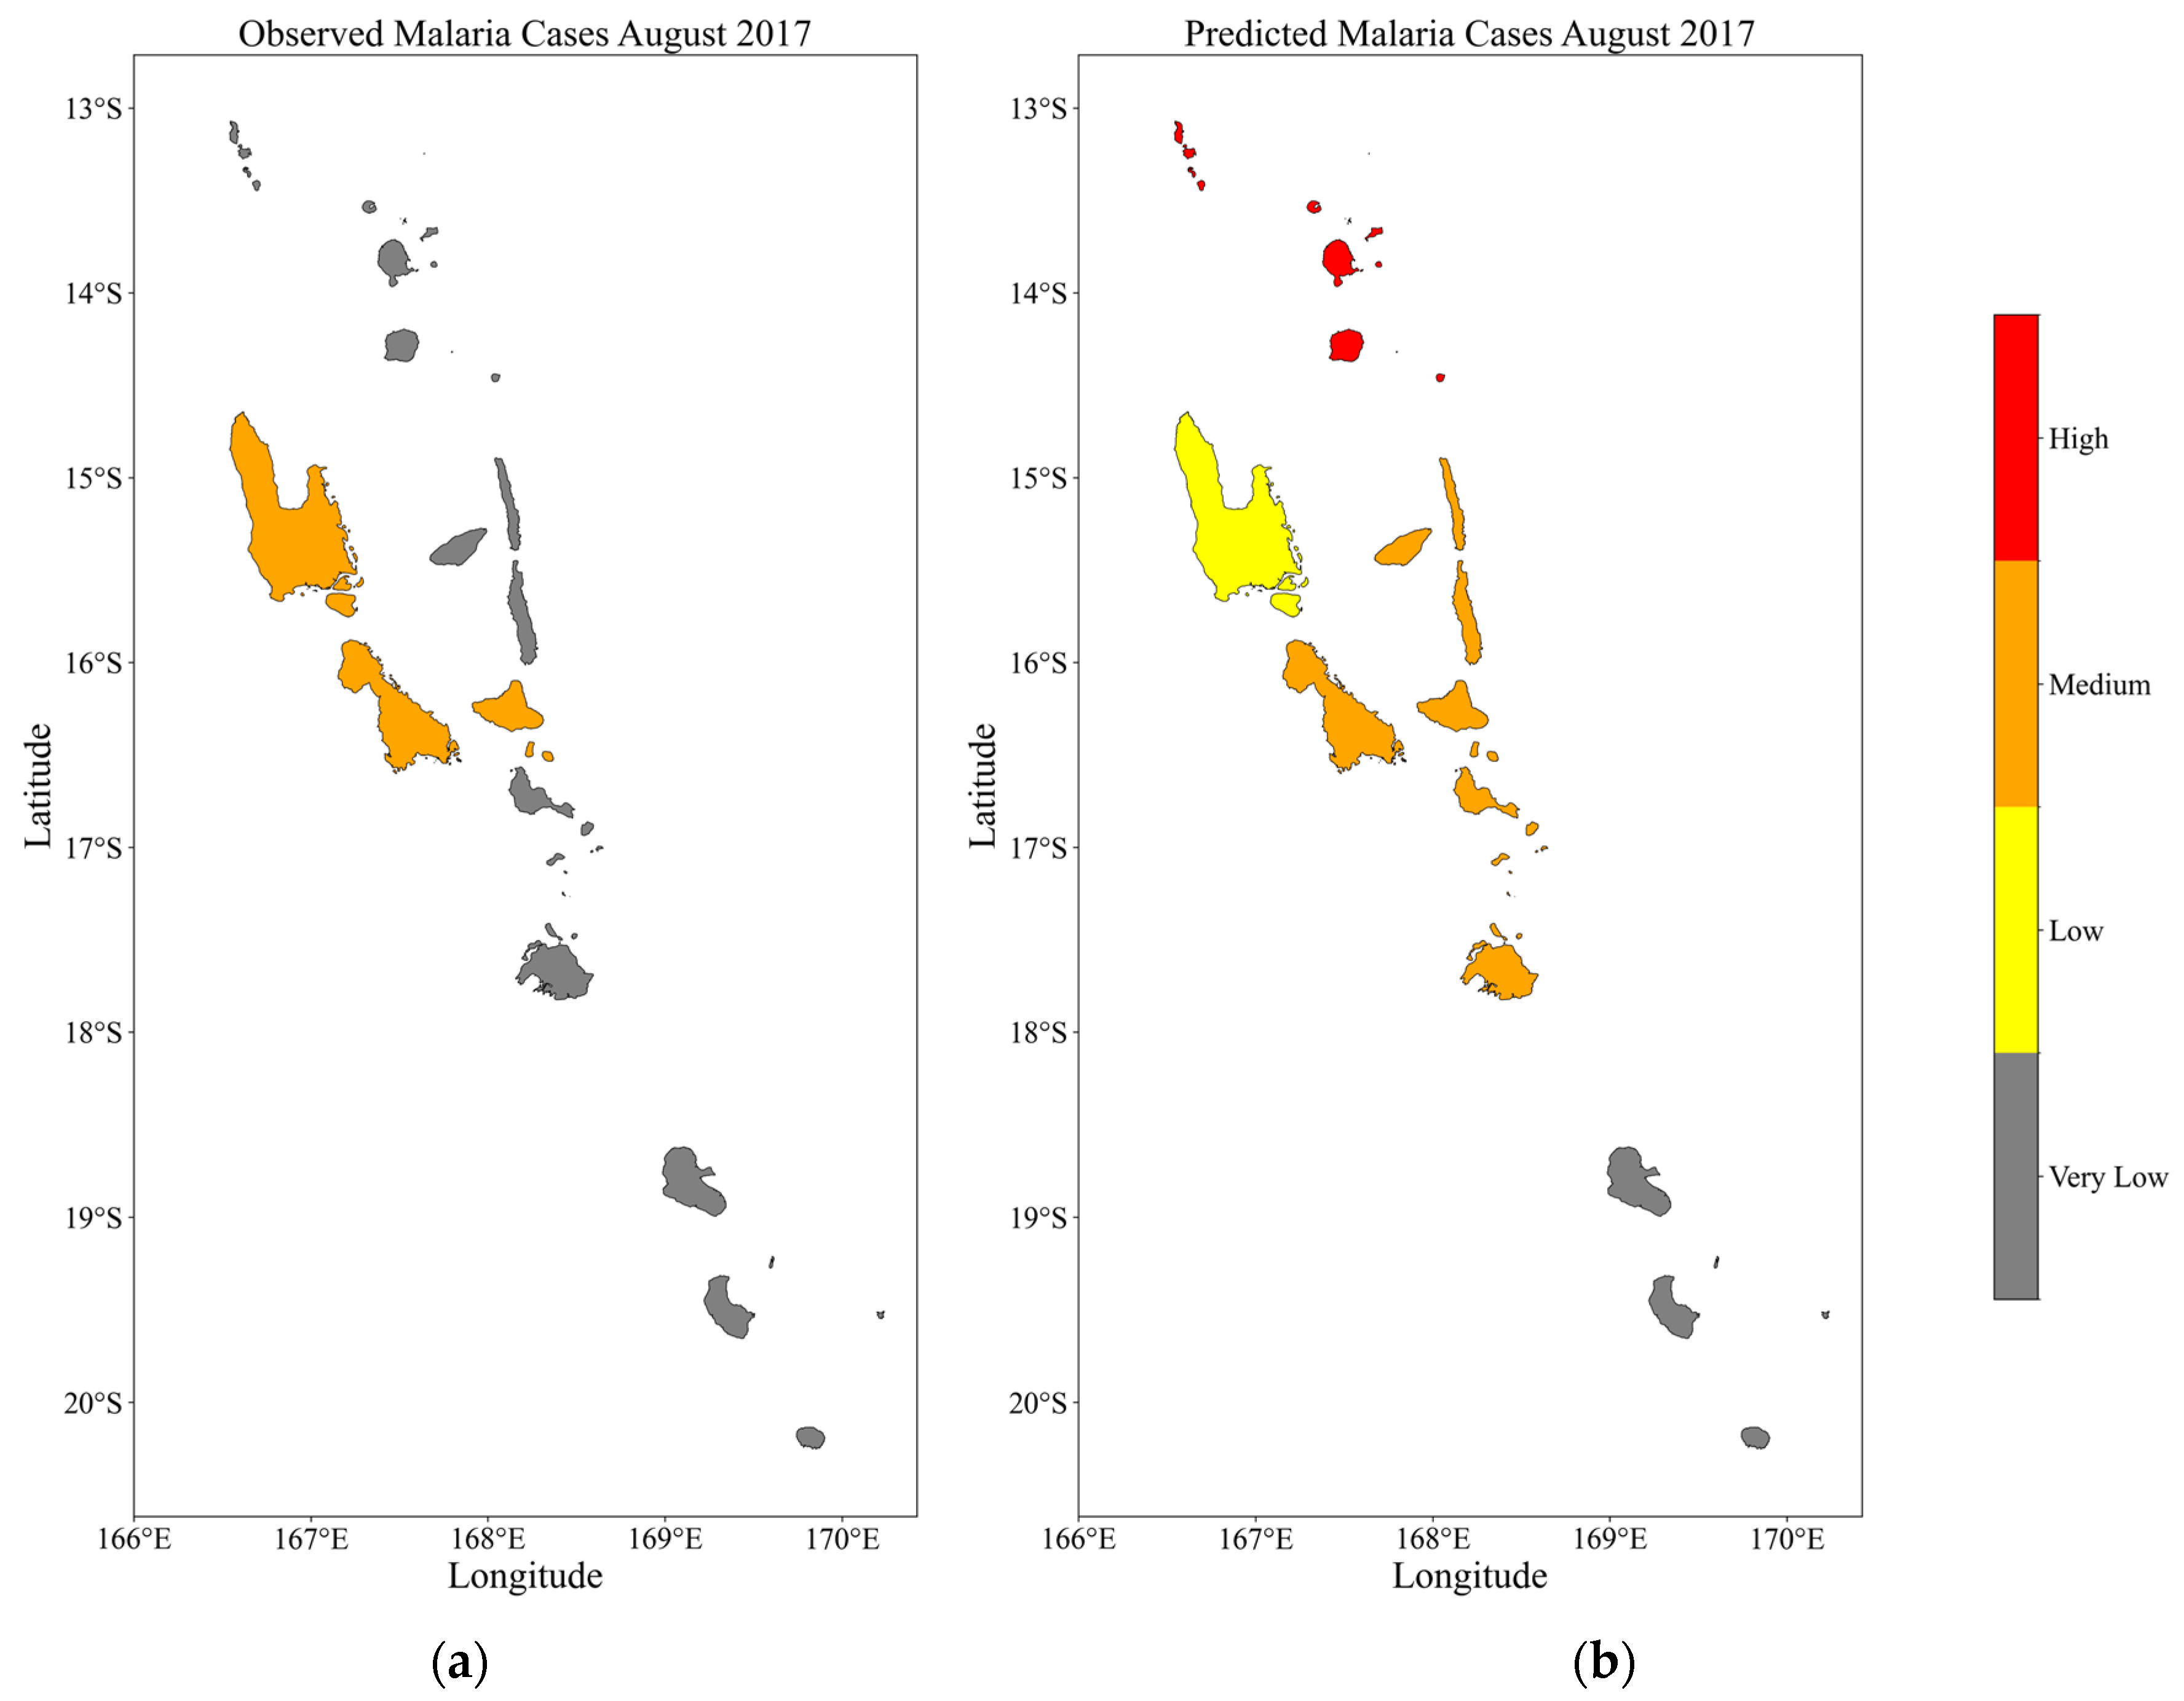
The climate-based predictions help indicate ‘receptive’ areas to malaria transmission, where the environmental conditions are likely suitable for transmission and increased vectorial capacity [83]. This climate suitability of a province for malaria transmission is then supplemented by bulletin information and decision-maker knowledge. In the process of developing the case study bulletin, a malaria risk was mapped for a low-risk period (August 2017) and found promising performance of the methodology to indicate risk in variable conditions (Appendix C).

4.2. Cattle Heat Stress Early Warning System

4.2.1. Cattle Heat Stress Early Warning System Delivery and End-Users

In Vanuatu, the authority over livestock health and productivity is primarily held by the MALFFB, with the Department of Livestock specifically responsible for overseeing the country’s beef industry [37]. There is limited information regarding the broader stakeholders involved in cattle farming; however, the Vanuatu National Livestock Policy 2015–2030 mentions the role of commercial farmers, smallholder and subsistence livestock farmers and feedlot operators in sustaining the country’s beef industry [37]. To this end, the cattle heat stress EWS is targeted at the MALFBB with the assumption that its contents and warnings will be disseminated to the broader livestock sector.
In this study, the weekly EWS bulletin allows for greater accuracy of warning information, providing a more realistic depiction of the climate and weather conditions conducive to worsening cattle heat stress. Unlike a weekly average forecast, daily HLI and daily maximum HLI measurements use granular climate and weather data to indicate to farmers when and where during the week cattle may be exposed to heat stress conditions. This early warning information can provide these end-users with adequate time to adopt appropriate actions to mitigate heat stress during adverse conditions [48]. The EWS model developed in this study displays the full range of HLI values for each province on all days within the forecasted week, rather than focusing on average HLI measurements or instances when the HLI exceeds a predetermined threshold. Since HLI thresholds can vary due to intrinsic and extrinsic factors, based on earlier research by Gaughan et al. (2008), this approach provides farmers and feedlot operators with the flexibility to establish and use customised HLI thresholds that are specific to their circumstances [46]. This specification will enable farmers to better interpret the relative risk of the forecasted heat stress conditions.
Recognising that farmers and end-users operate under unique conditions, with individual cattle factors that will exert varied influences, the full display of HLI values across the bulletin ensures the provision of comprehensive and targeted information. As a result, farmers operating in different contexts can analyse the same national data and draw useful conclusions tailored to their own unique circumstances. The information provided in the EWS allows them to better manage their livestock during heat stress periods by interpreting the forecasted HLI data according to the specific tolerance levels of the cattle in their farming environment. Acknowledging this, the cattle heat stress EWS bulletin has been designed to support Vanuatu’s animal agriculture sector with relevant, accessible and feasible management strategies tied to HLI thresholds and heat load risk. The bulletin equips farmers with information that enables timely action to mitigate the effects of heat stress, helping them protect their livestock and livelihoods amidst climate variability.

4.2.2. Cattle Heat Stress Response Strategies

The animal agriculture sector is increasingly dependent on technological solutions to prepare for and respond to the challenges posed by a warming climate, though this is not always feasible [62]. Therefore, it is critical to develop context-specific approaches for managing cattle heat stress, ensuring solutions are both practical and effective given local contexts and potential barriers. However, effective mitigation strategies specific to Vanuatu’s agriculture industry remain limited [84]. As such, the following response strategies have been informed by reports and research into cattle heat stress in other regions such as Australia, North America and Europe [61,85,86,87]. Given that multiple breeds of cattle are present in Vanuatu, the following response strategies provide more general guidance to the MALFFB, which can then be passed on to farmers and feedlot operators.
Table 7 presents the response strategies for each risk level and response level that corresponds to the cattle heat stress risk matrix (Figure 10). The evidence-based management strategies will vary week to week as informed by the seven-day HLI threshold and AHL risk map. Due to different climate profiles, provinces can be categorised with varying risk levels. Therefore, response strategies for each risk level will be presented on the bulletin.

4.2.3. Cattle Heat Stress Model Performance

The risk model demonstrated strong performance, capturing the varied heightened risk scenarios across provinces during periods of elevated HLI values (Figure 11). It effectively highlighted provinces with the greatest risk, such as Torba and Sanma, exhibiting the model’s ability to predict severe heat stress conditions. This high-risk scenario validation reinforces the robustness of the risk matrix, which successfully integrates forecasted HLI thresholds and AHL trends. Additionally, the model’s effectiveness in depicting a low-risk scenario during the 1st–7th of January 2023 (as shown in Appendix D) further supports its reliability across varying levels of heat stress risk.
The accuracy performance of the cattle heat stress model is primarily determined by the accuracy of the climate forecast data used within the model, as the HLI is a well-established and reliable method for assessing heat stress in cattle. To enhance the model’s accuracy and specificity to each province, future expansion of the model can incorporate observations from local weather stations in Vanuatu. Additionally, more frequent readings from these stations would provide a higher resolution of forecast information, offering greater insight into the timing and intensity of heat stress events.

4.3. Malaria Transmission and Cattle Heat Stress Bulletins

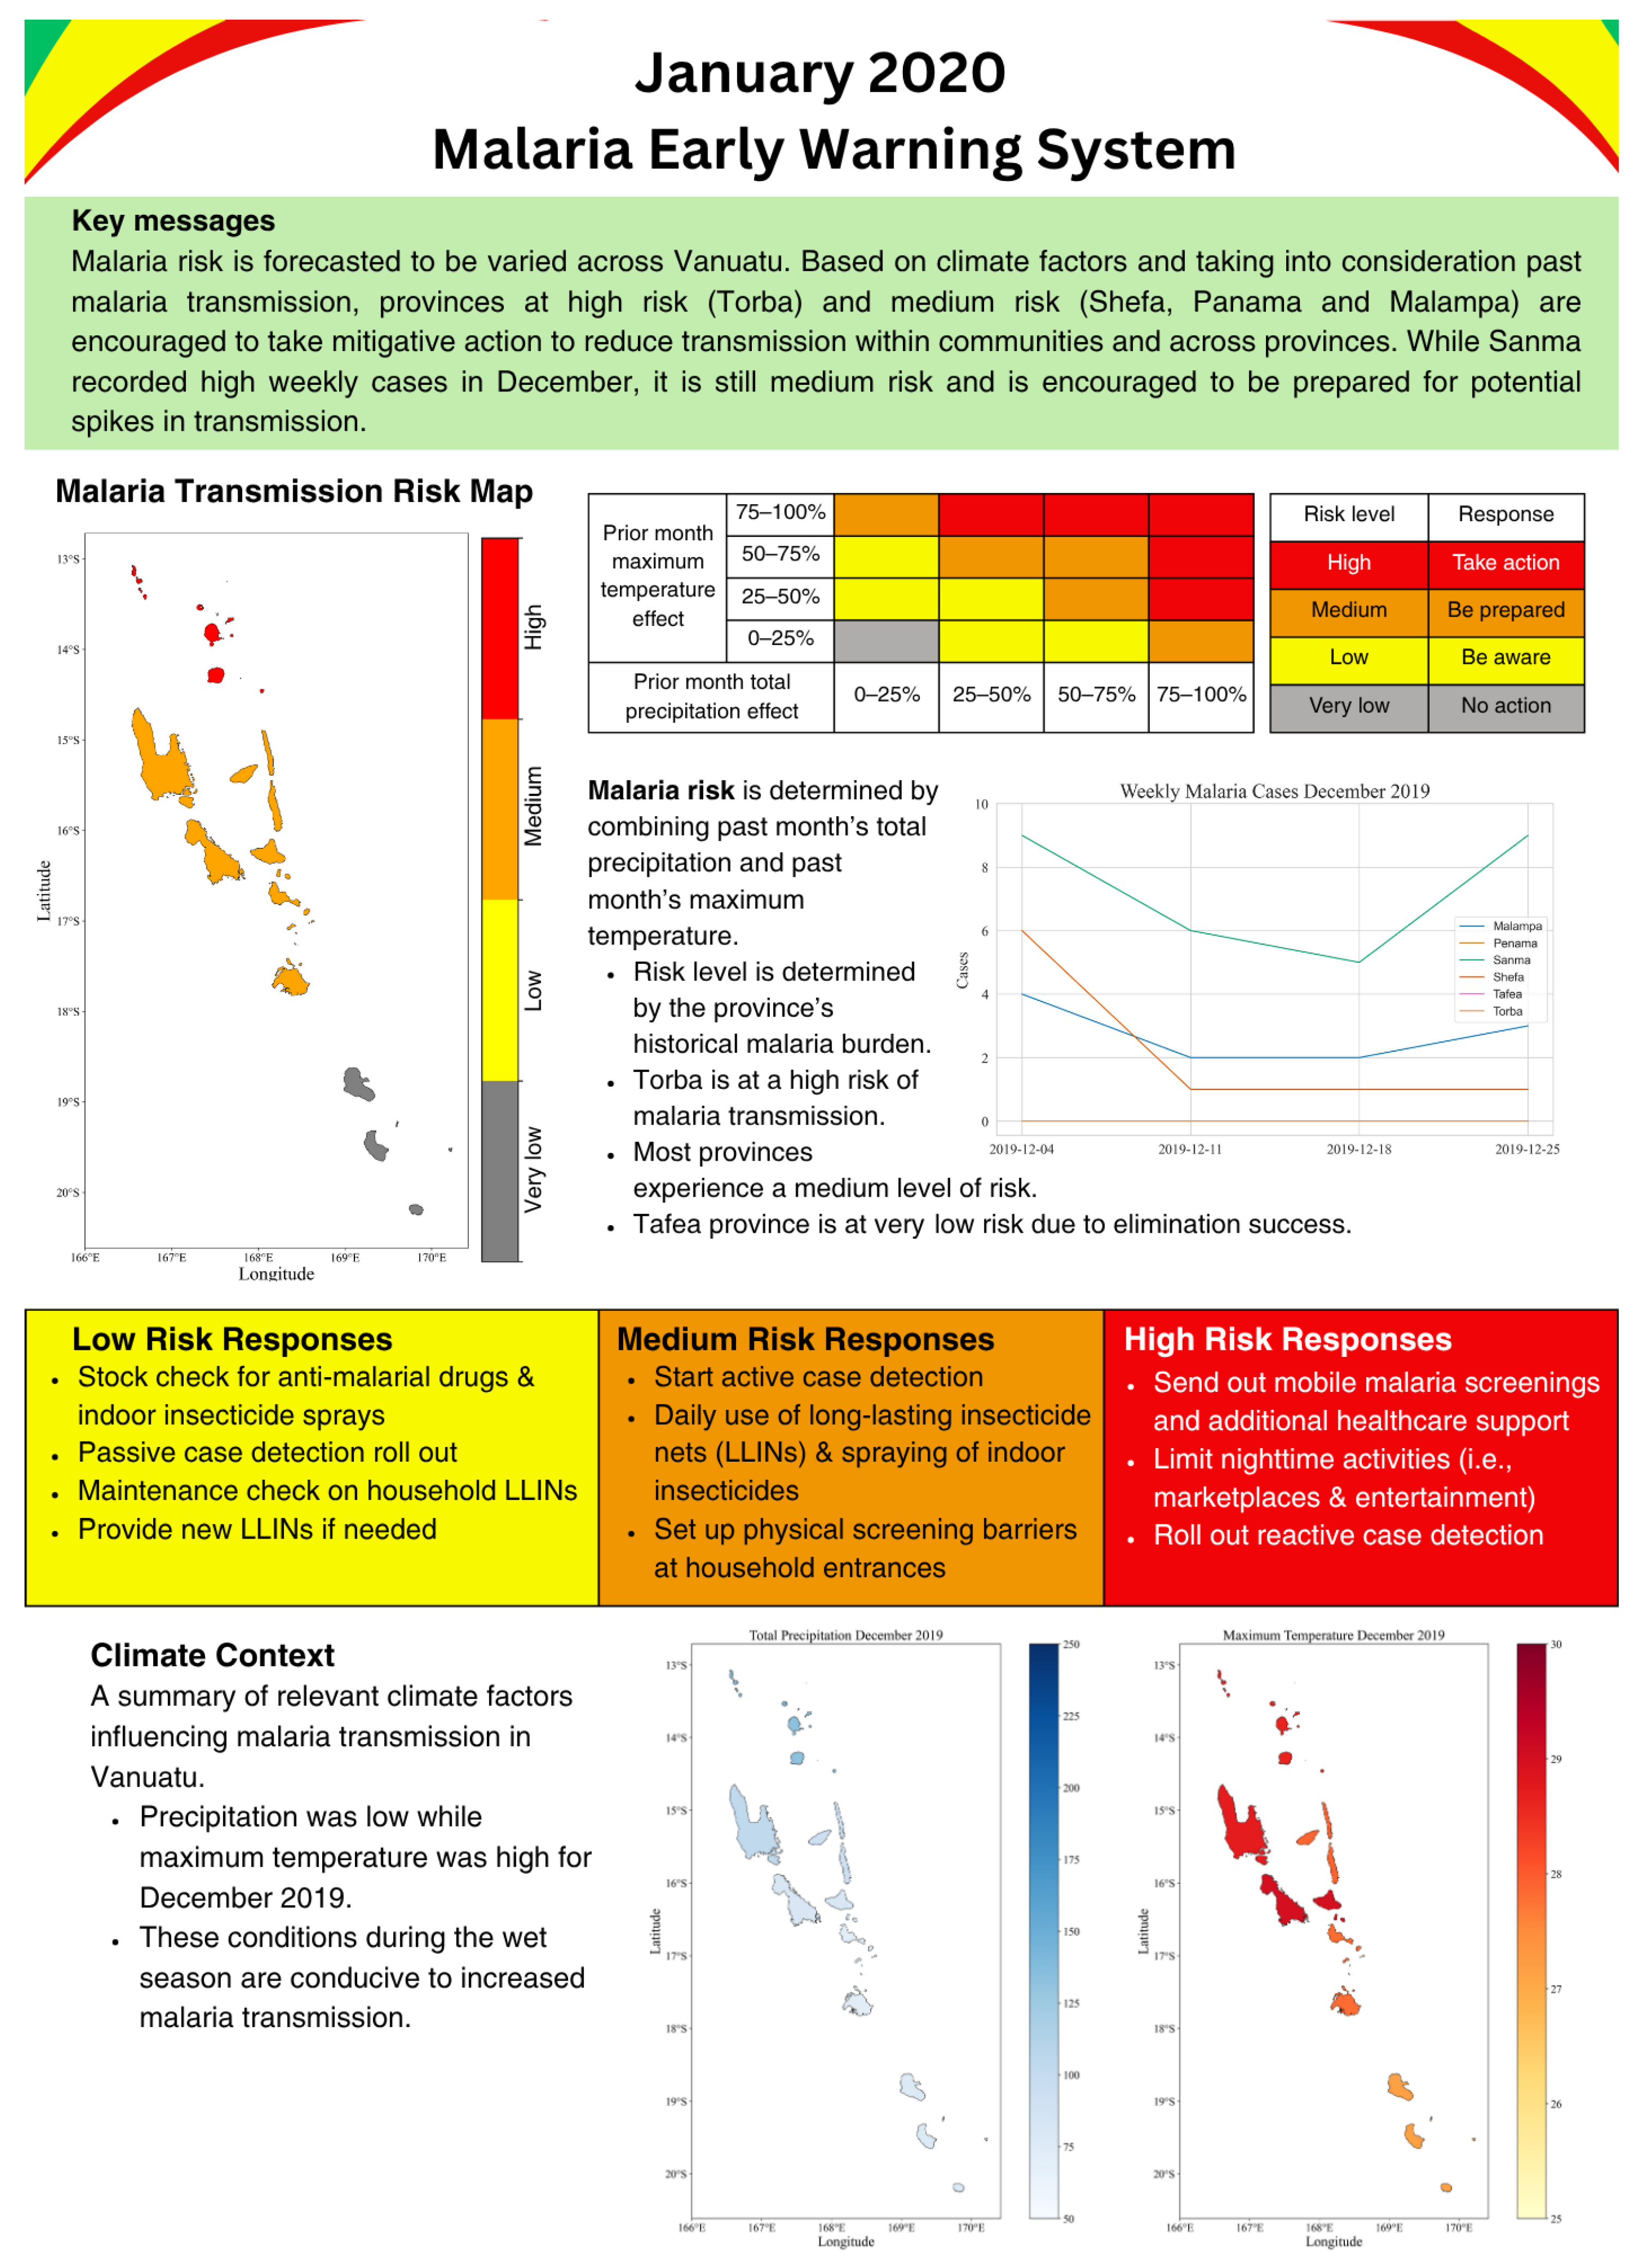
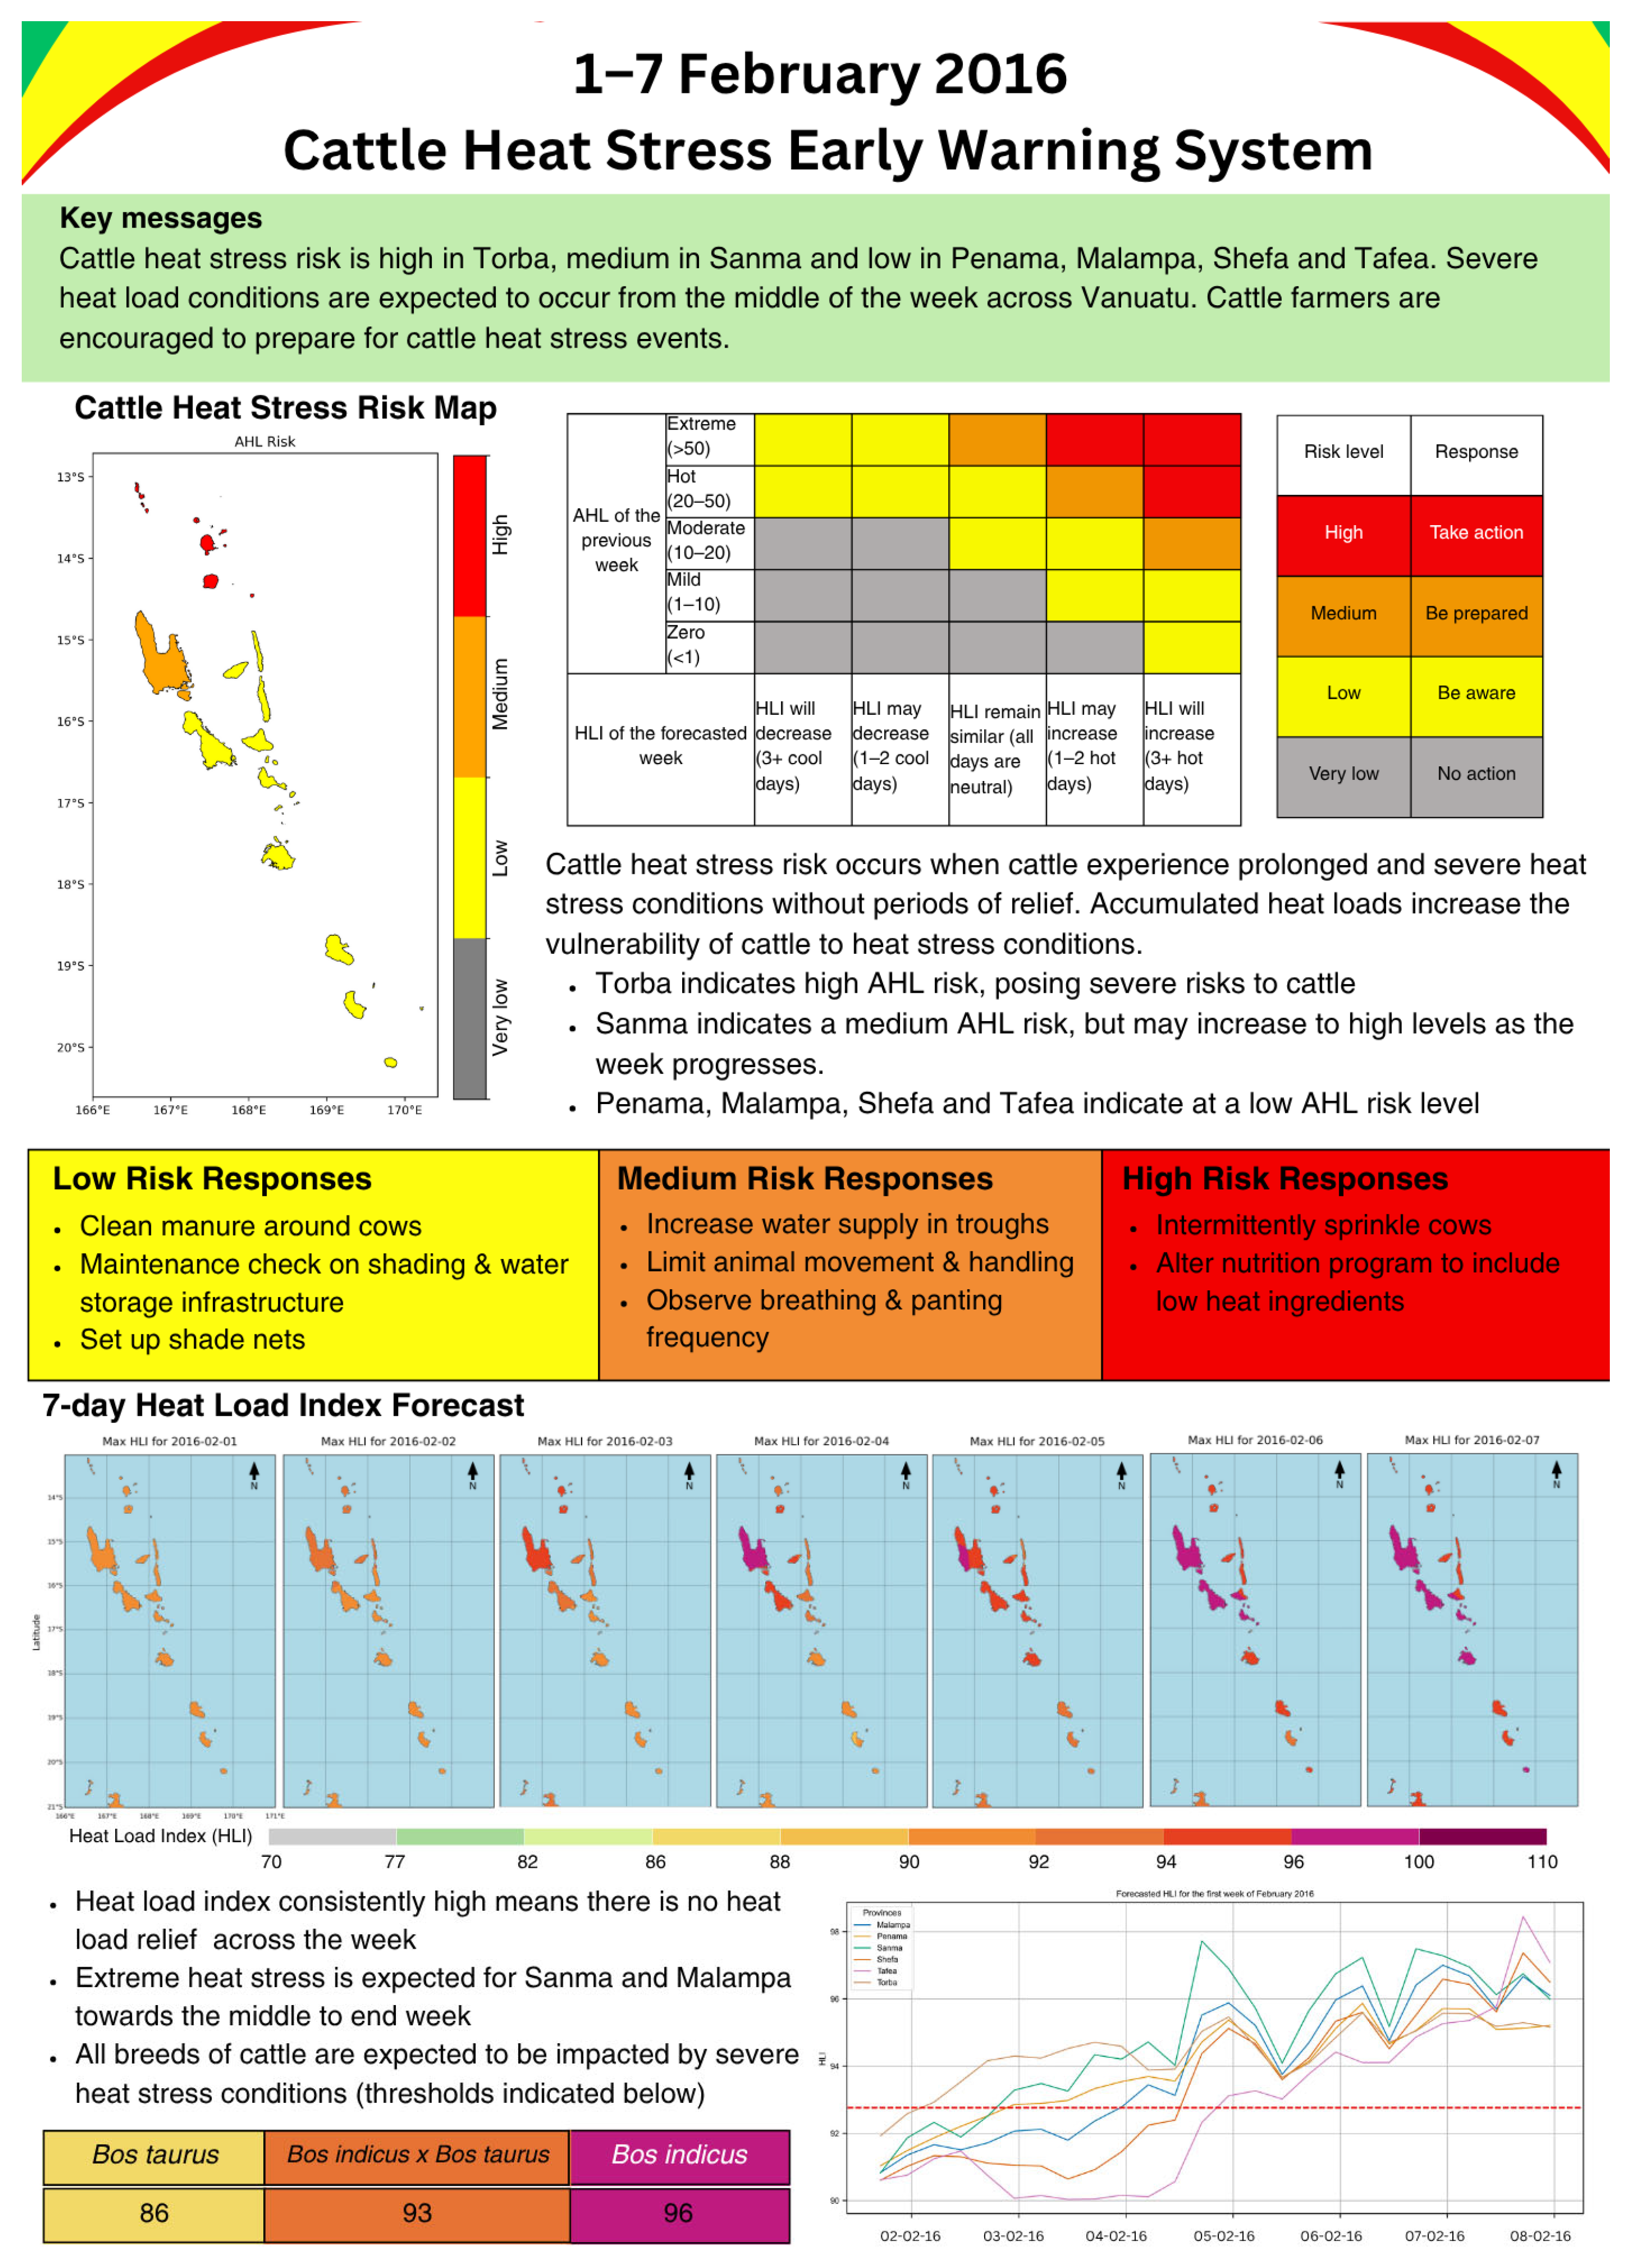
Effective early warning messages are characterised as containing three key components: the characteristics of the risk, predicted impact and recommended actions that individuals should adopt considering the risk and/or threat [93,94,95]. In this study, the design of the EWSs was informed by the WMO Early Warnings for All Initiative, which emphasises the need for greater coordination between monitoring, preparedness and response, and warning dissemination and communication. An additional document referenced during the design of the EWS bulletins was the WMO’s MHEWS checklist which was created as a reference tool for EWS development [96]. Together, these key sources provided a framework within which one-page bulletins were developed for the MoH and MALFFB. The malaria EWS bulletin and cattle heat stress EWS bulletin are displayed in Figure 12 and Figure 13.

4.3.1. Design Considerations

The malaria transmission and cattle heat stress EWS bulletins integrate insights from the forecast models and risk maps with findings from the literature review on EWS design, communication strategies and mitigation responses. The January 2020 and February 2016 case studies for malaria and cattle heat stress each demonstrate the bulletins’ ability to warn stakeholders of high-risk periods and provide guidance for efficient preparation and effective response. Foundational to the design of the EWS bulletins in this study was the Papua New Guinea drought bulletin created by the Climate Risk and Early Warning Systems (CREWS) team [97]. Adopting the CREWS design, the malaria and cattle heat stress bulletins comprise of three key components that are prioritised in ordering: key messages, risk maps and associated responses, and climate context. This format considers that decision makers from the MoH and MALFFB may only read the beginning of the document so the most critical information—key messages and risk maps with associated responses—is presented first. The bulletins include climate context through temperature and precipitation maps in the malaria EWS and the seven-day HLI forecast in the cattle heat stress EWS. This provides additional information on the climate factors considered in the respective forecasting models.
To ensure the EWS bulletins are accessible and user-centred, this study combined the thresholds used in the risk matrices (Figure 6 and Figure 10) to communicate the predicted impact on public health and animal health sectors. Given that there are no consistent risk categories used in malaria and cattle heat stress EWSs, this study prioritised simple and accessible language as emphasised in the WMO’s Early Warnings for All Initiative [4]. The categories ‘Very Low’, ‘Low’, ‘Medium’ and ‘High’ and respective colour schemes grey, yellow, orange and red were used to communicate increasing risk in the bulletins. Diverging from Dash (2024) and Taylor et al. (2024), this study opted for grey instead of green to represent ‘Very Low’ in the bulletins to consider possible colour vision deficiency in some end-users [64,65].
A key tenet of an effective EWS bulletin is that it is user-centred and relevant for the designated target audience [98,99]. Historically, EWSs have been limited by their inability to communicate outputs in a user-friendly, accessible format [100,101]. As a result, the system itself may fail to adequately incite timely responses, ultimately leading to reduced protective actions [102]. In this study, a user-centred approach was adopted when designing the bulletins to ensure that the technical model information was practical and understandable. A key consideration in the EWS bulletins was providing response strategies that are evidence-based and specific to Vanuatu’s geographic and socio-economic context (Table 6 and Table 7). Furthermore, since the target audience is the MoH and MALFFB rather than local communities, the bulletins use more technical language and references when listing response strategies to align with assumed baseline knowledge of experts and decision makers in the relevant Ministries. It is intended that the bulletins provide the MoH and MALFFB with information and adaptation strategies that are practical for end-users, thus ensuring long-term sustainability of the EWSs.

4.3.2. The Role of Risk Perception in the Malaria Transmission Bulletin

The effectiveness of an EWS not only depends on the presentation of the information but also on complex social factors such as personal experience, risk evaluation and traditional risk management [93]. The increase in monitoring and surveillance of malaria alongside increased preventive strategies is likely going to lead to the decreased prevalence or even absence of malaria in communities, to the extent that most provinces may be recording risk levels of ‘Very Low’ and ‘Low’. While rare reporting of cases indicates positive progress towards Vanuatu’s national elimination goal, it can also render malaria prevention a low priority for health workers and communities. This may lower risk perception and prioritisation of malaria and prevention practices, potentially increasing a community’s susceptibility to outbreaks.
Risk perception is a key determinant of malaria response and mitigation [68,78,103,104,105]. Focusing on elimination efforts in the Tafea region, Atkinson et al. (2010) reported that risk perception was a key barrier to the decision to use bed nets and the consistency of their use within a given period [68]. Their study found that individuals who perceived themselves or close family members to be at risk of malaria transmission were more likely to use bed nets. It was further found that the perceived presence of mosquitoes was a key determinant of bed net use, i.e., if low mosquito presence was observed, bed net use would decrease. Similarly, Watanabe et al. (2014) found that communities located in the Ambae Island of the Penama region were opting not to use bed nets when there was a perceived absence of malaria transmission and mosquito presence [72].
While mitigation strategies are crucial to eliminating malaria, the motivation to do so is shaped by intrinsic individual factors and extrinsic social factors such as inter- and intra-community characteristics, cultural contexts and environmental conditions [68,106]. For instance, in contrast to Watanabe et al.’s (2014) findings for Ambae, the island of Aneityum reported sustained bed net use irrespective of the wet/dry season and malaria presence [72]. This was attributed to collective and community-based action and individual motivation. Reports from interviews and group discussions revealed a positive feedback loop among community members; sustained motivation increased risk knowledge which encouraged healthy habits and mitigation action, which, when combined, amplified motivation. It is here that the malaria EWS bulletin can catalyse a similar feedback loop in other provinces. As the malaria EWS bulletin is intended to identify and warn the MoH of at-risk populations, this can cascade forward into increased alerts to at-risk communities, generating greater risk knowledge, motivation and intervention.

4.4. Future Directions

It is intended that these proof-of-concept forecast models and corresponding EWS bulletins are expanded upon by the MoH and MALFFB. It is anticipated that the response strategies will largely stay consistent. In comparison, the key messages and graph interpretations on the bulletins will require alteration each month (malaria EWS bulletin) and week (cattle heat stress EWS bulletin). For EWSs, and a future MHEWS, to be operationalised and user-centred, co-design with ministries focusing on local knowledge, capacity assessments and program evaluation must be integrated. It is expected that the bulletins will undergo several iterations upon further feedback and evaluation from the MoH and MALFFB, ensuring that the bulletins are practical and relevant to target users. For example, this may involve greater incorporation of traditional knowledge (TK) and translation of the bulletins into Bislama. Local knowledges have been shown to be effective in malaria suppression and response, building climate resilient communities and facilitating collective action [100,107,108,109]. Facets of TK can be integrated into the MHEWS bulletins, prompting greater community engagement in risk management behaviours. To do so, iterative feedback with the MoH, MALFFB, community leaders and individuals can provide a more comprehensive overview of TK surrounding public and animal health; incorporating TK and translating the bulletins can help broaden their reach and improve their accessibility.
For an operational EWS, an assessment of the implementation pathway would be crucial, evaluating ministry capacity and potential financial or technical barriers, and further improving both models’ accuracy and usability. Further, as research into climate-based EWSs continues, particularly in other PICs, the proof-of-concept EWSs developed in this study should be kept current and aligned with regional best practices.
These EWSs were developed with the aim to explore aspects of a future MHEWS for Vanuatu, responding to climate impacts with a shared methodology to produce EWS bulletins. To develop an MHEWS, these separate outputs of malaria and cattle heat stress bulletins could be further integrated to present interconnected risks and support decision making. An effective MHEWS for Vanuatu would benefit from a common risk communication strategy, which was explored through the bulletin design considerations but could be presented in a risk dashboard, providing a comprehensive resource for decision making and prioritising. The approach to modelling and bulletin design may require revision if the categorisation of risk changes due to changes in malaria burden and/or worsened heat conditions in Vanuatu. In the malaria forecast model, risk percentiles and the relevant risk categories may need to be adapted based on ongoing case burden or outbreaks. Similarly, if re-establishment of cases occurs in Tafea, this province will need to be added into the forecast model. While the thresholds for the cattle heat stress indices are unlikely to change, climate change and variability are predicted to increase atmospheric temperatures, resulting in more frequent surpassing of the HLI and AHL thresholds. As a result, more cattle are likely to be more heat stressed within a given week, so much so that the risk categories may need to be adjusted to account for this.
The provincial spatial scale used in both models may limit the accuracy of predictions, simplifying geographical features like altitude or vegetation, or for local concentrations of malaria burden. These smaller-scale factors are likely to influence the climate variables used in the models, particularly in larger provinces. Expanding on these models with higher-resolution data would likely improve predictions, particularly the influence of altitude on rainfall and temperature, and existing malaria burden within a specific community in the malaria model, and through coastal effects and vegetation in the cattle heat stress model. However, a malaria model focused on a finer spatial resolution than a provincial scale would further reduce the sample size of monthly cases, particularly if the model is refined to a health zone scale. In the cattle heat stress model, due to the spatial and temporal limitations of ECMWF’s seasonal forecasting data, future research should explore using local weather station data from Vanuatu into the forecasting models. This data could better capture the microclimates and specific conditions unique to different regions. On a temporal scale, the lack of available hourly forecasting data meant that the weekly AHL forecast could not be calculated. This was addressed through the inclusion of an AHL risk matrix and map; however, future studies could explore the possibility of directly incorporating a calculated AHL into models, further informing more specific mitigation strategies.
Both models could be supplemented using observational data to improve Vanuatu-specific predictions and mitigation strategies. For malaria, predictions could be compared to compounding events like other disease outbreaks or EWCEs, elimination progress or vector surveillance data. Further research should prioritise increasing the accuracy of province-specific predictions, validating its use as a decision-making tool used by experts in the Vanuatu MoH. The cattle heat stress model can be expanded upon using the physical impacts of heat stress on cattle in Vanuatu, such as mortality rates or panting scores. This approach could establish links between HLI and AHL values and the physical responses of cattle. This approach would expand on the correlations between heat stress indices and the physical responses of cattle in a Vanuatu-specific context. Future research investigating this could develop the model from prototypical predictions to more actionable insights based on observed impacts. These hazard prediction models and resulting bulletins can contribute towards building an MHEWS framework for Vanuatu, providing a methodology to produce actionable bulletins from climate-based model results. This can support decision making in cattle heat stress and malaria strategies, supporting adaptation towards climate-related hazards in Vanuatu.

5. Conclusions

This study aimed to contribute towards a multi-hazard early warning system (MHEWS) framework for climate impacts on the public health and livestock sectors in Vanuatu, exploring climate-based forecast models for malaria transmission and cattle heat stress. Case study results from these models were presented in early warning bulletins, intended to inform decision makers in the Ministry of Health and Ministry of Agriculture, Livestock, Forestry, Fisheries and Biosecurity.
The climate-based malaria model found that monthly precipitation and temperature variables were successful indicators of provincial malaria risk. This approach captured risk thresholds for provinces at different extents of endemicity, contextualising malaria case predictions with historic provincial case burden. The development of a forecasting model for cattle heat stress integrated climate data with pre-established indices to predict the occurrence and severity of heat stress conditions in Vanuatu. This model was able to predict the risk of an Accumulated Heat Load intensifying these conditions, providing clear identification of dangerous heat stress conditions for cattle. The outputs from these forecasting models were presented as risk maps with distinct colour-coded risk categories to accessibly convey the technical results. The communication of this early warning information was coupled with evidence-based and context-specific response strategies, contributing to climate-based early warning in Vanuatu using two distinct hazards to community health.
Early warning systems are crucial in sustaining climate and hazard adaptation. This study not only contributes to Vanuatu’s early warning infrastructure but also explores promising aspects vital to future research into MHEWSs. Continued research into climate early warning systems is critical to promoting informed decision making and effective action, in turn supporting the safeguarding of Vanuatu’s industries and communities in the face of increasing climate challenges.
Author Contributions

Conceptualization, J.S., E.R., H.W., A.B.W. and Y.K.; methodology, J.S. and E.R.; software, J.S. and E.R.; validation, J.S. and E.R.; formal analysis, J.S. and E.R.; investigation, J.S. and E.R.; resources, Y.K.; data curation, J.S. and E.R.; writing—original draft preparation, J.S., E.R. and H.W.; writing—review and editing, J.S, E.R., H.W., A.B.W. and Y.K.; visualisation, J.S. and E.R.; supervision, A.B.W. and Y.K.; project administration, Y.K.; funding acquisition, Y.K. All authors have read and agreed to the published version of the manuscript.

Funding

This research received no external funding.

Data Availability Statement

The original data presented in the study are openly available at https://cds.climate.copernicus.eu/ for ERA5 and https://www.gloh2o.org/mswep/ for MSWEP v2 accessed on 7 April 2025.

Acknowledgments

We thank the Vanuatu MoH (Ministry of Health) for providing national malaria case data and the Vanuatu Health Research Ethics Committee for approving this research. We thank colleagues from the CREWS (Climate Risk and Early Warning Systems) team at BoM (Bureau of Meteorology), VMGD (Vanuatu Meteorology and Geo-Hazards Department) and the Van-CIS-RDP (Climate Information Services for Resilient Development in Vanuatu) for their valuable advice on this research.

Conflicts of Interest

The authors declare no conflicts of interest.

Appendix A

Table A1. Summary table of the coefficients, 94% highest density intervals, Markov Chain Monte Carlo performance and model performance for Bayesian models at each time lag for Penama and Shefa.
ProvinceVariableMean94% HDI *ESS ** BulkESS TailLOO ***
Intercept−0.14(−1.95, 1.61)1387.01664.0
PenamaTemperature0.13(0.03, 0.21)1084.01501.0−325.60
Precipitation0.01(0.00, 0.01)1035.0699.0
Intercept−0.13(−2.09, 1.69)1289.01660.0
ShefaTemperature0.16(0.07, 0.26)1009.01463.0−347.90
Precipitation0.01(0.00, 0.02)1037.0842.0
* 94% highest density interval; ** essential sample size; *** leave-one-out cross-validation.

Appendix B

Figure A1. Posterior plots showing observed cases and model-predicted cases for (a) Penama and (b) Shefa, and line plots comparing observed cases and model-predicted cases for (c) Penama and (d) Shefa.
Climate 13 00118 g0a1

Appendix C

Figure A2. Malaria risk map for Vanuatu in August 2017 using (a) observed cases and (b) predicted cases using a climate-based model. Risk categories are based on percentiles of historical case burden for each province.
Climate 13 00118 g0a2

Appendix D

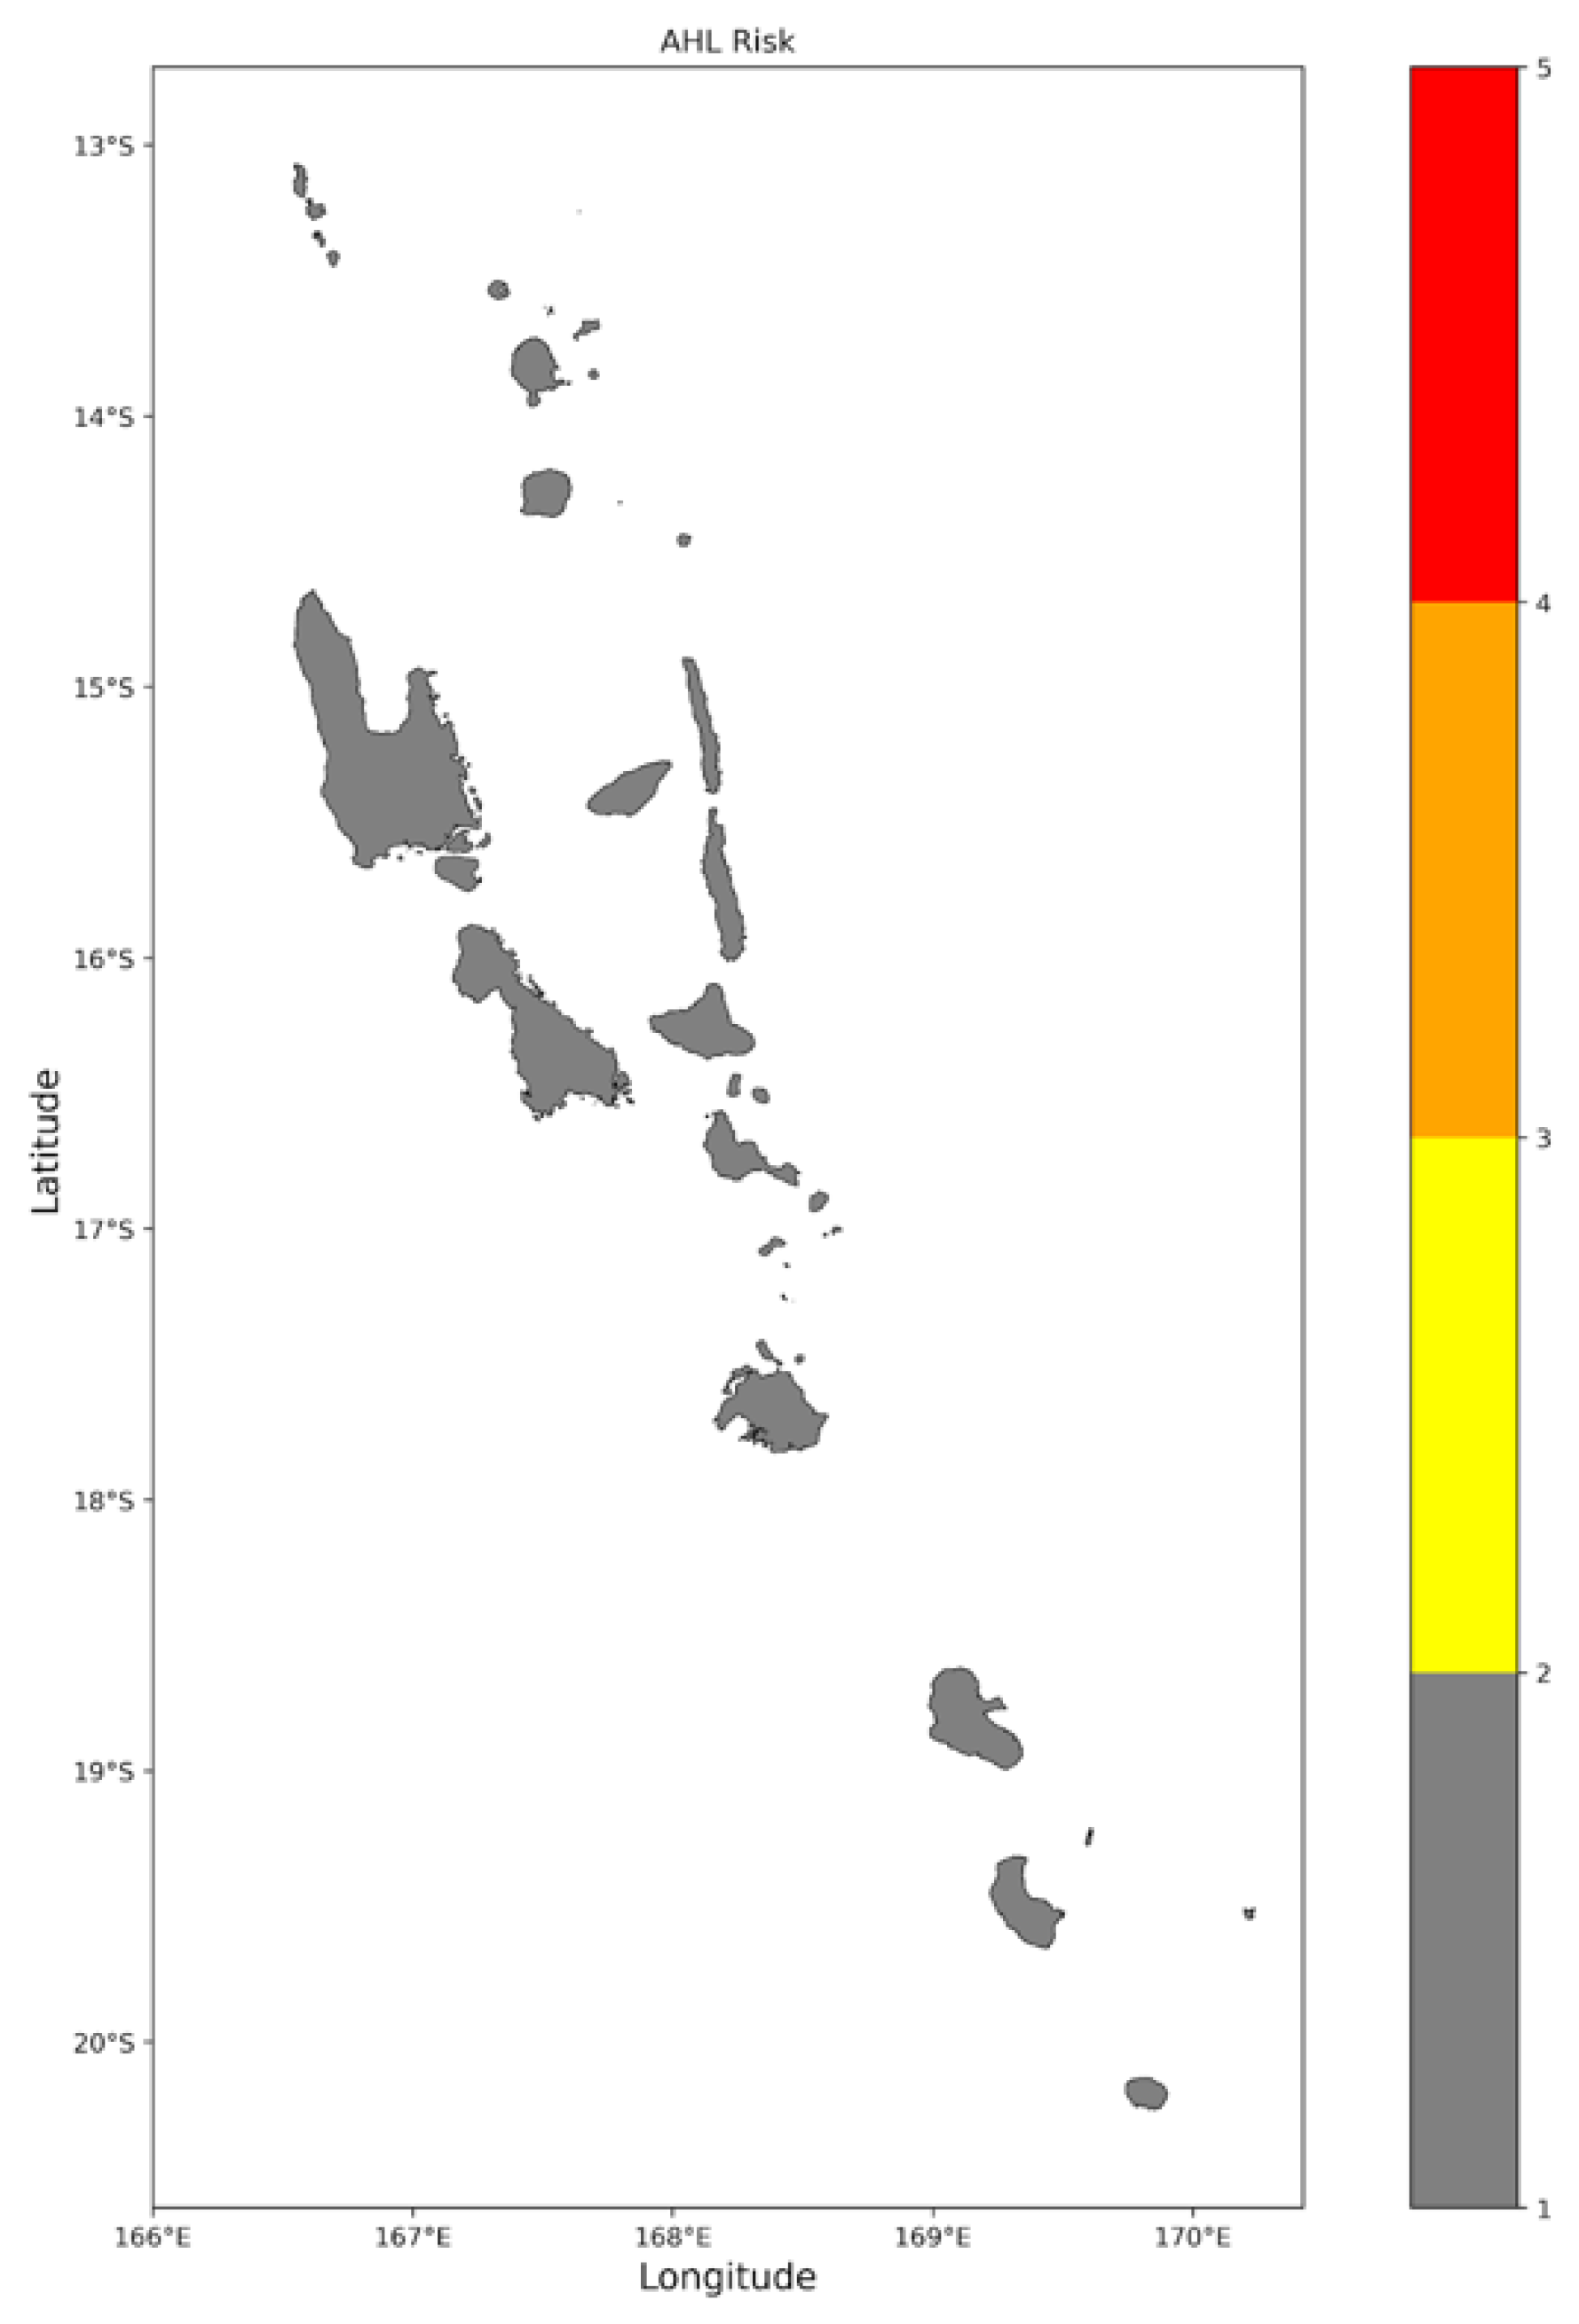
Figure A3. Accumulated Heat Load (AHL) risk map for the first week of January 2023, grey corresponding to very low risk, yellow to low risk, orange to medium risk and red to a high risk of the existence or development of an elevated AHL in cattle within the forecasted week.
Climate 13 00118 g0a3
Table A2. Accumulated Heat Load of each province on 31 December 2022, at the beginning of the forecasted week, calculated using observational climate data.
ProvinceStarting AHL *
Malampa0.00
Penama0.00
Sanma0.16
Shefa0.00
Tafea0.17
Torba0.20
* Accumulated Heat Load.
Table A3. Forecasted number of ‘hot’ (Heat Load Index (HLI) > 93), ‘cool’ (HLI < 77) and ‘neutral’ (77 < HLI < 93) days within the first week of January 2023.
ProvinceHot Days (HLI * > 93)Neutral Days (77 < HLI < 93)Cool Days (HLI < 77)
Malampa070
Penama070
Sanma070
Shefa070
Tafea250
Torba070
* Heat Load Index.

References

  1. Calvin, K.; Dasgupta, D.; Krinner, G.; Mukherji, A.; Thorne, P.W.; Trisos, C.; Romero, J.; Aldunce, P.; Barrett, K.; Blanco, G.; et al. IPCC, 2023: Climate Change 2023: Synthesis Report. Contribution of Working Groups I, II and III to the Sixth Assessment Report of the Intergovernmental Panel on Climate Change; Core Writing Team, Lee, H., Romero, J., Eds.; Intergovernmental Panel on Climate Change (IPCC): Geneva, Switzerland, 2023; pp. 35–115. [Google Scholar]
  2. McGree, S.; Smith, G.; Chandler, E.; Herold, N.; Begg, Z.; Kuleshov, Y.; Malsale, P.; Ritman, M. Climate Change in the Pacific 2022: Historical and Recent Variability, Extremes and Change; Pacific Community (SPC): Suva, Fiji, 2022. [Google Scholar]
  3. United Nations, Economic and Social Commission for Asia and the Pacific (ESCAP). The Disaster Riskscape Across the Pacific Small Island Developing States: Key Takeaways for Stakeholders; United Nations, Economic and Social Commission for Asia and the Pacific (ESCAP): Bangkok, Thailand, 2020. [Google Scholar]
  4. World Meteorological Organisation. Early Warnings for All: Executive Action Plan 2023–2027; World Meteorological Organization: Geneva, Switzerland, 2022; p. 56. [Google Scholar]
  5. Jenkins, S.C.; Putra, A.W.; Ayuliana, S.; Novikarany, R.; Khalid, N.M.; Che Mamat, C.S.N.; Moron, L.A.; Monteverde, M.C.A.; Cayanan, E.O.; Beckett, R.; et al. Investigating the Decision Thresholds for Impact-Based Warnings in South East Asia. Int. J. Disaster Risk Reduct. 2022, 76, 103021. [Google Scholar] [CrossRef]
  6. Kaltenberger, R.; Schaffhauser, A.; Staudinger, M. “What the Weather Will Do”–Results of a Survey on Impact-Oriented and Impact-Based Warnings in European NMHSs. Adv. Sci. Res. 2020, 17, 29–38. [Google Scholar] [CrossRef]
  7. World Meteorological Organisation. WMO Guidelines on Multi-Hazard Impact-Based Forecast and Warning Services-Part II: Putting Multi-Hazard IBFWS into Practice, 2021 ed.; World Meteorological Organisation: Geneva, Switzerland, 2021. [Google Scholar]
  8. Green Climate Fund. Multi-Hazard Impact-Based Forecasting and Early Warning System (MH-IBF-EWS) for the Philippines; Green Climate Fund: Incheon, Republic of Korea, 2019. [Google Scholar]
  9. Bhardwaj, J.; Kuleshov, Y.; Chua, Z.-W.; Watkins, A.B.; Choy, S.; Sun, Q. Building Capacity for a User-Centred Integrated Early Warning System for Drought in Papua New Guinea. Remote Sens. 2021, 13, 3307. [Google Scholar] [CrossRef]
  10. Pacific Community. Impact-Based Forecasting Operational in Samoa and Tonga; Pacific Community: Nadi, Fiji, 2023. [Google Scholar]
  11. World Bank. Draft Early Warning System Needs Assessment and Investment Plan for the Pacific Islands-Vanuatu; World Bank: Washington, DC, USA, 2020. [Google Scholar]
  12. McIver, L.; Kim, R.; Woodward, A.; Hales, S.; Spickett, J.; Katscherian, D.; Hashizume, M.; Honda, Y.; Kim, H.; Iddings, S.; et al. Health Impacts of Climate Change in Pacific Island Countries: A Regional Assessment of Vulnerabilities and Adaptation Priorities. Environ. Health Perspect. 2016, 124, 1707–1714. [Google Scholar] [CrossRef]
  13. McMichael, A.J.; Lindgren, E. Climate Change: Present and Future Risks to Health, and Necessary Responses: Review: Climate Change and Health. J. Intern. Med. 2011, 270, 401–413. [Google Scholar] [CrossRef]
  14. Quigley, S.; Addinsall, C.; Cox, K.; Scott, W. Increasing the Productivity and Market Options of Smallholder Beef Cattle Farmers in Vanuatu; ACIAR: Canberra, Australia, 2021. [Google Scholar]
  15. United Nations Development Programme. Annual Report 2023: A Malaria Free Vanuatu; United Nations Development Programme: New York, NY, USA, 2024. [Google Scholar]
  16. Idris, Z.M.; Chan, C.W.; Mohammed, M.; Kalkoa, M.; Taleo, G.; Junker, K.; Arcà, B.; Drakeley, C.; Kaneko, A. Serological Measures to Assess the Efficacy of Malaria Control Programme on Ambae Island, Vanuatu. Parasites Vectors 2017, 10, 204. [Google Scholar] [CrossRef]
  17. Lum, J.K.; Kaneko, A.; Taleo, G.; Amos, M.; Reiff, D.M. Genetic Diversity and Gene Flow of Humans, Plasmodium falciparum, and Anopheles farauti s.s. of Vanuatu: Inferred Malaria Dispersal and Implications for Malaria Control. Acta Tropica 2007, 103, 102–107. [Google Scholar] [CrossRef]
  18. World Health Organization. World Malaria Report 2024; World Health Organization: Geneva, Switzerland, 2024. [Google Scholar]
  19. Vanautu Ministry of Health. Case Study: Successful Elimination of Malaria, Tafea Province, Vanuatu; Vanautu Ministry of Health: Port Vila, Vanautu, 2019; pp. 1–14.
  20. Sekine, S.; Chan, C.W.; Kalkoa, M.; Yamar, S.; Iata, H.; Taleo, G.; Kc, A.; Kagaya, W.; Kido, Y.; Kaneko, A. Tracing the Origins of Plasmodium Vivax Resurgence after Malaria Elimination on Aneityum Island in Vanuatu. Commun. Med. 2024, 4, 91. [Google Scholar] [CrossRef] [PubMed]
  21. Vanuatu Ministry of Health. National Strategic Plan for Malaria Elimination 2021–2026; Vanautu Ministry of Health: Port Vila, Vanautu, 2021.
  22. Williams, W.; van Gemert, C.; Mariasua, J.; Iavro, E.; Fred, D.; Nausien, J.; Manwo, O.; Atua, V.; Pakoa, G.J.; Taissets, A.; et al. Challenges to Implementation and Strengthening of Initial COVID-19 Surveillance in Vanuatu: January–April 2020. West. Pac. Surveill. Response J. 2021, 12, 57–64. [Google Scholar] [CrossRef]
  23. Burnet Institute. Strengthening Disease Outbreak Response in the Pacific; Burnet Institute: Melbourne, Australia, 2025. [Google Scholar]
  24. Ohm, J.R.; Baldini, F.; Barreaux, P.; Lefevre, T.; Lynch, P.A.; Suh, E.; Whitehead, S.A.; Thomas, M.B. Rethinking the Extrinsic Incubation Period of Malaria Parasites. Parasites Vectors 2018, 11, 178. [Google Scholar] [CrossRef]
  25. Smith, J.; Tahani, L.; Bobogare, A.; Bugoro, H.; Otto, F.; Fafale, G.; Hiriasa, D.; Kazazic, A.; Beard, G.; Amjadali, A.; et al. Malaria Early Warning Tool: Linking Inter-Annual Climate and Malaria Variability in Northern Guadalcanal, Solomon Islands. Malar. J. 2017, 16, 472. [Google Scholar] [CrossRef] [PubMed]
  26. Chow, W.K.; Beebe, N.W.; Ambrose, L.; Pickering, P.; Cooper, R.D. Seasonal Assessment on the Effects of Time of Night, Temperature and Humidity on the Biting Profile of Anopheles Farauti in North Queensland, Australia Using a Population Naive to Malaria Vector Control Pressures. Malar. J. 2023, 22, 85. [Google Scholar] [CrossRef]
  27. Cleary, E.; Hetzel, M.W.; Siba, P.M.; Lau, C.L.; Clements, A.C.A. Spatial Prediction of Malaria Prevalence in Papua New Guinea: A Comparison of Bayesian Decision Network and Multivariate Regression Modelling Approaches for Improved Accuracy in Prevalence Prediction. Malar. J. 2021, 20, 269. [Google Scholar] [CrossRef] [PubMed]
  28. Pollard, E.J.M.; Russell, T.L.; Apairamo, A.; Burkot, T.R. Unique Fine Scale Village Spatial-Temporal Distributions of Anopheles Farauti Differ by Physiological State and Sex. Parasites Vectors 2019, 12, 558. [Google Scholar] [CrossRef] [PubMed]
  29. Paaijmans, K.P.; Blanford, S.; Bell, A.S.; Blanford, J.I.; Read, A.F.; Thomas, M.B. Influence of Climate on Malaria Transmission Depends on Daily Temperature Variation. Proc. Natl. Acad. Sci. USA 2010, 107, 15135–15139. [Google Scholar] [CrossRef]
  30. Sorenson, J.; Watkins, A.B.; Kuleshov, Y. The Influence of Climate Variables on Malaria Incidence in Vanuatu. Climate 2025, 13, 22. [Google Scholar] [CrossRef]
  31. Imai, C.; Cheong, H.-K.; Kim, H.; Honda, Y.; Eum, J.-H.; Kim, C.T.; Kim, J.S.; Kim, Y.; Behera, S.K.; Hassan, M.N.; et al. Associations between Malaria and Local and Global Climate Variability in Five Regions in Papua New Guinea. Trop. Med. Health 2016, 44, 23. [Google Scholar] [CrossRef]
  32. Gilbert, M.; Brindle, R. El Niño and Variations in the Prevalence of Plasmodium Vivax and P. Falciparum in Vanuatu. Trans. R. Soc. Trop. Med. Hyg. 2009, 103, 1285–1287. [Google Scholar] [CrossRef]
  33. Escarcha, J.F.; Lassa, J.A.; Zander, K.K. Livestock Under Climate Change: A Systematic Review of Impacts and Adaptation. Climate 2018, 6, 54. [Google Scholar] [CrossRef]
  34. Cole, S.; Waldron, S.; Quigley, S. The Vanuatu Beef Industry; ACIAR: Canberra, Australia, 2019. [Google Scholar]
  35. WITS Data. World Bank Vanuatu Trade Summary. Available online: https://wits.worldbank.org/CountryProfile/en/Country/VUT/Year/LTST/Summary (accessed on 4 March 2024).
  36. Vanuatu Bureau of Statistics. 2022 Vanuatu National Agricultural Census Preliminary Report; Vanuatu Bureau of Statistics: Port Vila, Vanuatu, 2022.
  37. Ministry of Agriculture, Livestock, Forestry, Fisheries and Biosecurity. Vanuatu National Livestock Sector Policy Action Plan, Monitoring & Evaluation Framework 2015–2030; Government of the Republic of Vanuatu: Port Vila, Vanuatu, 2015.
  38. Scholtz, M.M.; McManus, C.; Okeyo, A.M.; Theunissen, A. Opportunities for Beef Production in Developing Countries of the Southern Hemisphere. Livest. Sci. 2011, 142, 195–202. [Google Scholar] [CrossRef]
  39. Thornton, P.; Nelson, G.; Mayberry, D.; Herrero, M. Increases in Extreme Heat Stress in Domesticated Livestock Species during the Twenty-first Century. Glob. Change Biol. 2021, 27, 5762–5772. [Google Scholar] [CrossRef] [PubMed]
  40. Lees, A.M.; Sejian, V.; Wallage, A.L.; Steel, C.C.; Mader, T.L.; Lees, J.C.; Gaughan, J.B. The Impact of Heat Load on Cattle. Animals 2019, 9, 322. [Google Scholar] [CrossRef]
  41. North, M.A.; Franke, J.A.; Ouweneel, B.; Trisos, C.H. Global Risk of Heat Stress to Cattle from Climate Change. Environ. Res. Lett. 2023, 18, 94027. [Google Scholar] [CrossRef]
  42. Chang-Fung-Martel, J.; Harrison, M.T.; Brown, J.N.; Rawnsley, R.; Smith, A.P.; Meinke, H. Negative Relationship between Dry Matter Intake and the Temperature-Humidity Index with Increasing Heat Stress in Cattle: A Global Meta-Analysis. Int. J. Biometeorol. 2021, 65, 2099–2109. [Google Scholar] [CrossRef] [PubMed]
  43. Shephard, R.; Maloney, S. A Review of Thermal Stress in Cattle. Aust. Vet. J. 2023, 101, 417–429. [Google Scholar] [CrossRef]
  44. Oke, O.E.; Uyanga, V.A.; Iyasere, O.S.; Oke, F.O.; Majekodunmi, B.C.; Logunleko, M.O.; Abiona, J.A.; Nwosu, E.U.; Abioja, M.O.; Daramola, J.O.; et al. Environmental Stress and Livestock Productivity in Hot-Humid Tropics: Alleviation and Future Perspectives. J. Therm. Biol. 2021, 100, 103077. [Google Scholar] [CrossRef]
  45. Reeve, E.; Watkins, A.B.; Kuleshov, Y. The Impact of Climate Variability on Cattle Heat Stress in Vanuatu. Agriculture 2024, 14, 1955. [Google Scholar] [CrossRef]
  46. Gaughan, J.B.; Mader, T.L.; Holt, S.M.; Lisle, A. A New Heat Load Index for Feedlot Cattle. J. Anim. Sci. 2008, 86, 226–234. [Google Scholar] [CrossRef]
  47. Beatty, D.T.; Barnes, A.; Taylor, E.; Pethick, D.; McCarthy, M.; Maloney, S.K. Physiological Responses of Bos Taurus and Bos Indicus Cattle to Prolonged, Continuous Heat and Humidity. J. Anim. Sci. 2006, 84, 972–985. [Google Scholar] [CrossRef]
  48. Gaughan, J.; Perkins, N.; Woldeyohannes, S. Evaluation of a Heat Load Model for Feedlot Cattle; Meat and Livestock Australia: North Sydney, Australia, 2019; p. 64. [Google Scholar]
  49. Salinger, M.J.; McGree, S.; Beucher, F.; Power, S.B.; Delage, F. A New Index for Variations in the Position of the South Pacific Convergence Zone 1910/11–2011/2012. Clim. Dyn. 2014, 43, 881–892. [Google Scholar] [CrossRef]
  50. Humanitarian Data Exchange. Vanuatu-Subnational Administrative Boundaries; Humanitarian Data Exchange: The Hague, The Netherlands, 2018. [Google Scholar]
  51. Iese, V.; Kiem, A.S.; Mariner, A.; Malsale, P.; Tofaeono, T.; Kirono, D.G.C.; Round, V.; Heady, C.; Tigona, R.; Veisa, F.; et al. Historical and Future Drought Impacts in the Pacific Islands and Atolls. Clim. Change 2021, 166, 19. [Google Scholar] [CrossRef]
  52. Hersbach, H.; Bell, B.; Berrisford, P.; Hirahara, S.; Horányi, A.; Muñoz-Sabater, J.; Nicolas, J.; Peubey, C.; Radu, R.; Schepers, D.; et al. The ERA5 Global Reanalysis. Q. J. R. Meteorol. Soc. 2020, 146, 1999–2049. [Google Scholar] [CrossRef]
  53. Beck, H.E.; Wood, E.F.; Pan, M.; Fisher, C.K.; Miralles, D.G.; van Dijk, A.I.J.M.; McVicar, T.R.; Adler, R.F. MSWEP V2 Global 3-Hourly 0.1° Precipitation: Methodology and Quantitative Assessment. Bull. Amer. Meteor. Soc. 2019, 100, 473–500. [Google Scholar] [CrossRef]
  54. Thépaut, J.-N.; Dee, D.; Engelen, R.; Pinty, B. The Copernicus Programme and Its Climate Change Service. In Proceedings of the IGARSS 2018–2018 IEEE International Geoscience and Remote Sensing Symposium, Valencia, Spain, 22–27 July 2018; pp. 1591–1593. [Google Scholar]
  55. Basáñez, M.-G.; Marshall, C.; Carabin, H.; Gyorkos, T.; Joseph, L. Bayesian Statistics for Parasitologists. Trends Parasitol. 2004, 20, 85–91. [Google Scholar] [CrossRef]
  56. World Health Organization (WHO); Pacific Public Health Surveillance Network (PPHSN). Pacific Outbreak Manual; World Health Organization (WHO): Manila, Philippines, 2016. [Google Scholar]
  57. Teklehaimanot, H.D.; Schwartz, J.; Teklehaimanot, A.; Lipsitch, M. Alert Threshold Algorithms and Malaria Epidemic Detection. Emerg. Infect. Dis. 2004, 10, 1220–1226. [Google Scholar] [CrossRef] [PubMed]
  58. Carvalho, F.A.; Lammoglia, M.A.; Simoes, M.J.; Randel, R.D. Breed Affects Thermoregulation and Epithelial Morphology in Imported and Native Cattle Subjected to Heat Stress. J. Anim. Sci. 1995, 73, 3570–3573. [Google Scholar] [CrossRef] [PubMed]
  59. Gaughan, J.B.; Mader, T.L.; Holt, S.M.; Sullivan, M.L.; Hahn, G.L. Assessing the Heat Tolerance of 17 Beef Cattle Genotypes. Int. J. Biometeorol. 2010, 54, 617–627. [Google Scholar] [CrossRef]
  60. Wang, X.; Bjerg, B.S.; Choi, C.Y.; Zong, C.; Zhang, G. A Review and Quantitative Assessment of Cattle-Related Thermal Indices. J. Therm. Biol. 2018, 77, 24–37. [Google Scholar] [CrossRef]
  61. Cowan, T.; Wheeler, M.C.; Cobon, D.H.; Gaughan, J.B.; Marshall, A.G.; Sharples, W.; McCulloch, J.; Jarvis, C. Observed Climatology and Variability of Cattle Heat Stress in Australia. J. Appl. Meteorol. Climatol. 2024, 63, 645–663. [Google Scholar] [CrossRef]
  62. Islam, M.A.; Lomax, S.; Doughty, A.; Islam, M.R.; Jay, O.; Thomson, P.; Clark, C. Automated Monitoring of Cattle Heat Stress and Its Mitigation. Front. Anim. Sci. 2021, 2, 737213. [Google Scholar] [CrossRef]
  63. Struthers, G. Vanuatu Country Report: Animal Genetic Resources; FAO: Rome, Italy, 2007. [Google Scholar]
  64. Dash, B. Gap between Impact-Based and Impact Forecast and Warning: Implications for People-Centric Early Warning System (EWS) in India. Nat. Hazards Res. 2024, 4, 110–117. [Google Scholar] [CrossRef]
  65. Taylor, A.; Summers, B.; Domingos, S.; Garrett, N.; Yeomans, S. The Effect of Likelihood and Impact Information on Public Response to Severe Weather Warnings. Risk Anal. 2024, 44, 1237–1253. [Google Scholar] [CrossRef] [PubMed]
  66. Morss, R.E.; Mulder, K.J.; Lazo, J.K.; Demuth, J.L. How Do People Perceive, Understand, and Anticipate Responding to Flash Flood Risks and Warnings? Results from a Public Survey in Boulder, Colorado, USA. J. Hydrol. 2016, 541, 649–664. [Google Scholar] [CrossRef]
  67. Adhikari, B.; Pell, C.; Phommasone, K.; Soundala, X.; Kommarasy, P.; Pongvongsa, T.; Henriques, G.; Day, N.P.J.; Mayxay, M.; Cheah, P.Y. Elements of Effective Community Engagement: Lessons from a Targeted Malaria Elimination Study in Lao PDR (Laos). Glob. Health Action 2017, 10, 1366136. [Google Scholar] [CrossRef] [PubMed]
  68. Atkinson, J.-A.M.; Fitzgerald, L.; Toaliu, H.; Taleo, G.; Tynan, A.; Whittaker, M.; Riley, I.; Vallely, A. Community Participation for Malaria Elimination in Tafea Province, Vanuatu: Part I. Maintaining Motivation for Prevention Practices in the Context of Disappearing Disease. Malar. J. 2010, 9, 93. [Google Scholar] [CrossRef]
  69. World Health Organization. Progress in Malaria Control and Moving towards Elimination in Solomon Islands and Vanuatu; WHO Regional Office for the Western Pacific: Manila, Philippines, 2011. [Google Scholar]
  70. Donald, W.; Pasay, C.; Guintran, J.-O.; Iata, H.; Anderson, K.; Nausien, J.; Gresty, K.J.; Waters, N.C.; Vestergaard, L.S.; Taleo, G.; et al. The Utility of Malaria Rapid Diagnostic Tests as a Tool in Enhanced Surveillance for Malaria Elimination in Vanuatu. PLoS ONE 2016, 11, e0167136. [Google Scholar] [CrossRef]
  71. Pacific Mosquito Surveillance Strengthening for Impact. Residual Spraying Against Aedes Vectors in the Pacific. In Proceedings of the Training of Trainers Workshop, Cairns, Australia, 9–13 October 2023; pp. 1–20.
  72. Watanabe, N.; Kaneko, A.; Yamar, S.; Leodoro, H.; Taleo, G.; Tanihata, T.; Lum, J.K.; Larson, P.S. Determinants of the Use of Insecticide-Treated Bed Nets on Islands of Pre- and Post-Malaria Elimination: An Application of the Health Belief Model in Vanuatu. Malar. J. 2014, 13, 441. [Google Scholar] [CrossRef]
  73. World Health Organization. Global Malaria Program Control of Residual Malaria Parasite Transmission-Guidance Note; World Health Organization: Geneva, Switzerland, 2014. [Google Scholar]
  74. Tynan, A.; Atkinson, J.-A.; Toaliu, H.; Taleo, G.; Fitzgerald, L.; Whittaker, M.; Riley, I.; Schubert, M.; Vallely, A. Community Participation for Malaria Elimination in Tafea Province, Vanuatu: Part Ii. Social and Cultural Aspects of Treatment-Seeking Behaviour. Malar. J. 2011, 10, 204. [Google Scholar] [CrossRef]
  75. World Health Organization. Disease Surveillance for Malaria Control: An Operational Manual; World Health Organization: Geneva, Switzerland, 2012. [Google Scholar]
  76. Hii, J.; Hustedt, J.; Bangs, M.J. Residual Malaria Transmission in Select Countries of Asia-Pacific Region: Old Wine in a New Barrel. J. Infect. Dis. 2021, 223, S111–S142. [Google Scholar] [CrossRef]
  77. World Health Organization; Regional Office for the Western Pacific. Regional Action Framework for Malaria Control and Elimination in the Western Pacific (2016–2020); World Health Organization: Manila, Philippines, 2017; ISBN 9789290618157. [Google Scholar]
  78. Wangdi, K.; Pasaribu, A.P.; Clements, A.C.A. Addressing Hard-to-Reach Populations for Achieving Malaria Elimination in the Asia Pacific Malaria Elimination Network Countries. Asia Pac. Policy Stud. 2021, 8, 176–188. [Google Scholar] [CrossRef]
  79. Poveda, G.; Estrada-Restrepo, Ó.A.; Morales, J.E.; Hernández, Ó.O.; Galeano, A.; Osorio, S. Integrating Knowledge and Management Regarding the Climate–Malaria Linkages in Colombia. Curr. Opin. Environ. Sustain. 2011, 3, 448–460. [Google Scholar] [CrossRef]
  80. Ministry of Health. Coronavirus Disease 201 (COVID-19): Vanuatu Situation Report #149; Ministry of Health: Port Vila, Vanuatu, 2022.
  81. Chan, C.W.; Iata, H.; Yaviong, J.; Kalkoa, M.; Yamar, S.; Taleo, G.; Isozumi, R.; Fukui, M.; Aoyama, F.; Pomer, A.; et al. Surveillance for Malaria Outbreak on Malaria-Eliminating Islands in Tafea Province, Vanuatu after Tropical Cyclone Pam in 2015. Epidemiol. Infect. 2017, 145, 41–45. [Google Scholar] [CrossRef] [PubMed]
  82. United Nations Development Programme. Mid-Term Review of the Malaria Elimination Programme: Vanuatu; United Nations Development Programme: Suva, Fiji, 2023. [Google Scholar]
  83. World Health Organization. A Framework for Malaria Elimination; World Health Organization: Geneva, Switzerland, 2017; ISBN 978-92-4-151198-8. [Google Scholar]
  84. Bakare, A.G.; Kour, G.; Akter, M.; Iji, P.A. Impact of Climate Change on Sustainable Livestock Production and Existence of Wildlife and Marine Species in the South Pacific Island Countries: A Review. Int. J. Biometeorol. 2020, 64, 1409–1421. [Google Scholar] [CrossRef]
  85. Abellán, E.; Killip, C.; Cunliffe, S. Heat Load Index Forecast Season 2018–2019; Meat and Livestock Australia: Sydney, NSW, Australia, 2019. [Google Scholar]
  86. Tucker, C.B.; Rogers, A.R.; Schütz, K.E. Effect of Solar Radiation on Dairy Cattle Behaviour, Use of Shade and Body Temperature in a Pasture-Based System. Appl. Anim. Behav. Sci. 2008, 109, 141–154. [Google Scholar] [CrossRef]
  87. Dean, L.; Tarpoff, A.J.; Nickles, K.; Place, S.; Edwards-Callaway, L. Heat Stress Mitigation Strategies in Feedyards: Use, Perceptions, and Experiences of Industry Stakeholders. Animals 2023, 13, 3029. [Google Scholar] [CrossRef]
  88. Meat & Livestock Australia. Tips & Tools: Heatload in Feedlot Cattle; Meat & Livestock Australia: North Sydney, NSW, Australia, 2017. [Google Scholar]
  89. Dairy Australia. Cool Cows: Strategies for Managing Heat Stress in Dairy Cows; Dairy Australia: Southbank, VIC, Australia, 2023. [Google Scholar]
  90. Chaidanya, K.; Shaji, S.; Niyas, P.A.A.; Sejian, V.; Bhatta, R.; Bagath, M.; Rao, G.S.L.H.V.P.; Kurien, E.K.; Varma, G. Climate Change and Livestock Nutrient Availability: Impact and Mitigation. J. Vet. Sci. Med. Diagn. 2015, 4, 3. [Google Scholar] [CrossRef]
  91. Mader, T.L.; Davis, M.S.; Gaughan, J.B. Effect of Sprinkling on Feedlot Microclimate and Cattle Behavior. Int. J. Biometeorol. 2007, 51, 541–551. [Google Scholar] [CrossRef]
  92. Lopes, L.B.; Eckstein, C.; Pina, D.S.; Carnevalli, R.A. The Influence of Trees on the Thermal Environment and Behaviour of Grazing Heifers in Brazilian Midwest. Trop. Anim. Health Prod. 2016, 48, 755–761. [Google Scholar] [CrossRef]
  93. Neußner, O. Early Warning Alerts for Extreme Natural Hazard Events: A Review of Worldwide Practices. Int. J. Disaster Risk Reduct. 2021, 60, 102295. [Google Scholar] [CrossRef]
  94. Murphy, J.; Dyson, J.; Leck, A.; Rundle, S.; Maguire, S.; Greer, D.; Dootson, P. Warning Message Construction: Choosing Your Words: Key Considerations for Writing Effective Warning Messages (Australian Disaster Resilience Handbook Collection, Guideline 1); Australia Institute for Disaster Resilience: East Melbourne, VIC, Australia, 2018; pp. 1–19. [Google Scholar]
  95. Golnaraghi, M. (Ed.) Institutional Partnerships in Multi-Hazard Early Warning Systems: A Compilation of Seven National Good Practices and Guiding Principles; Springer: Berlin/Heidelberg, Germany, 2012; ISBN 978-3-642-25372-0. [Google Scholar]
  96. World Meteorological Organization. Multi-Hazard Early Warning Systems: A Checklist, Outcome of the First Multi-Hazard Early Warning Conference; World Meteorological Organization: Cancún, Mexico, 2018. [Google Scholar]
  97. Government of Papua New Guinea. Papua New Guinea Climate and Special Services: August 2023 Drought Update; Government of Papua New Guinea: Port Moresby, Papua New Guinea, 2023.
  98. Seng, D.C. Improving the Governance Context and Framework Conditions of Natural Hazard Early Warning Systems. IDRiM J. 2012, 2, 1–25. [Google Scholar] [CrossRef]
  99. Dashora, L.K.; Basnayake, S.; Ganepola, G.A.C.; Jaysinghe, S. Readiness Stocktaking of Multi-Hazard Early Warning Systems in Pacific Small Island Developing States. Asia-Pac. Sustain. Dev. J. 2024, 31, 47–75. [Google Scholar]
  100. Macherera, M.; Chimbari, M.J. Developing a Community-Centred Malaria Early Warning System Based on Indigenous Knowledge: Gwanda District, Zimbabwe. JÀMBÁ J. Disaster Risk Stud. 2016, 8, 289. [Google Scholar] [CrossRef]
  101. Baudoin, M.-A.; Henly-Shepard, S.; Fernando, N.; Sitati, A.; Zommers, Z. From Top-Down to “Community-Centric” Approaches to Early Warning Systems: Exploring Pathways to Improve Disaster Risk Reduction Through Community Participation. Int. J. Disaster Risk Sci. 2016, 7, 163–174. [Google Scholar] [CrossRef]
  102. Twomlow, A.; Grainger, S.; Cieslik, K.; Paul, J.D.; Buytaert, W. A User-Centred Design Framework for Disaster Risk Visualisation. Int. J. Disaster Risk Reduct. 2022, 77, 103067. [Google Scholar] [CrossRef]
  103. Beer, N.; Ali, A.S.; Eskilsson, H.; Jansson, A.; Abdul-Kadir, F.M.; Rotllant-Estelrich, G.; Abass, A.K.; Wabwire-Mangen, F.; Björkman, A.; Källander, K. A Qualitative Study on Caretakers’ Perceived Need of Bed-Nets after Reduced Malaria Transmission in Zanzibar, Tanzania. BMC Public Health 2012, 12, 606. [Google Scholar] [CrossRef] [PubMed]
  104. Koenker, H.M.; Loll, D.; Rweyemamu, D.; Ali, A.S. A Good Night’s Sleep and the Habit of Net Use: Perceptions of Risk and Reasons for Bed Net Use in Bukoba and Zanzibar. Malar. J. 2013, 12, 203. [Google Scholar] [CrossRef] [PubMed]
  105. Pulford, J.; Hetzel, M.W.; Bryant, M.; Siba, P.M.; Mueller, I. Reported Reasons for Not Using a Mosquito Net When One IS Available: A Review of the Published Literature. Malar. J. 2011, 10, 83. [Google Scholar] [CrossRef]
  106. Atkinson, J.-A.; Bobogare, A.; Fitzgerald, L.; Boaz, L.; Appleyard, B.; Toaliu, H.; Vallely, A. A Qualitative Study on the Acceptability and Preference of Three Types of Long-Lasting Insecticide-Treated Bed Nets in Solomon Islands: Implications for Malaria Elimination. Malar. J. 2009, 8, 119. [Google Scholar] [CrossRef]
  107. Dirontsho, M.; Ntombi, N.B.; Dare, K.O.; Ronald, M.M.; Vincent, P. LOCAL KNOWLEDGE OF ADAPTIVE STRATEGIES AGAINST MALARIA ENDEMICITY IN THE OKAVANGO DELTA, BOTSWANA. AJID 2022, 16, 21–34. [Google Scholar] [CrossRef]
  108. Adade Williams, P.; Sikutshwa, L.; Shackleton, S. Acknowledging Indigenous and Local Knowledge to Facilitate Collaboration in Landscape Approaches—Lessons from a Systematic Review. Land 2020, 9, 331. [Google Scholar] [CrossRef]
  109. Granderson, A.A. The Role of Traditional Knowledge in Building Adaptive Capacity for Climate Change: Perspectives from Vanuatu. Weather Clim. Soc. 2017, 9, 545–561. [Google Scholar] [CrossRef]
Figure 1. Map of Vanuatu with labelled provinces, showing neighbouring countries.
Climate 13 00118 g001
Figure 2. Monthly malaria cases from 2014 to 2023 for all provinces in Vanuatu.
Climate 13 00118 g002
Figure 3. Posterior plots showing observed provincial cases and model-predicted cases from 2014 to 2023 for (a) Malampa, (b) Sanma and (c) Torba.
Climate 13 00118 g003
Figure 4. Line plots comparing observed provincial cases and average model-predicted cases from 2014 to 2023 for (a) Malampa, (b) Sanma and (c) Torba.
Climate 13 00118 g004
Figure 5. Climate parameters used in the January 2020 malaria risk map, (a) monthly average maximum temperature during December 2019 and (b) monthly total precipitation during December 2019.
Climate 13 00118 g005
Figure 6. Malaria risk categorisation matrix based on the prior month’s average maximum temperature and total precipitation, developed as a Risk–Response matrix [64].
Climate 13 00118 g006
Figure 7. Malaria risk map for Vanuatu in January 2020 using (a) observed cases and (b) predicted cases using a climate-based model. Risk categories are based on percentiles of historical case burden for each province.
Climate 13 00118 g007
Figure 8. Forecasted Heat Load Index of the first week of February 2016, calculated on a 6-hourly basis across the regions in Vanuatu.
Climate 13 00118 g008
Figure 9. Forecasted daily maximum Heat Load Index across the regions of Vanuatu for the first week of February 2016.
Climate 13 00118 g009
Figure 10. Risk categorisation matrix for the potential accumulation of heat load in cattle during a forecasted week, based on the previous week’s Accumulated Heat Load and the anticipated effects of the forecasted week’s Heat Load Index, developed as a Risk–Response matrix [64].
Climate 13 00118 g010
Figure 11. Accumulated Heat Load (AHL) risk map for the first week of February 2016, with grey corresponding to very low risk, yellow to low risk, orange to medium risk and red to a high risk of the existence or development of an elevated AHL in cattle within the forecasted week.
Climate 13 00118 g011
Figure 12. Malaria early warning system bulletin for January 2020.
Climate 13 00118 g012
Figure 13. Cattle heat stress early warning system bulletin for the first week of February 2016.
Climate 13 00118 g013
Table 1. Climate variables and data sources used in analysis, separated by malaria and cattle heat stress models.
SourceVariableTemporal ResolutionSpatial Resolution
Malaria Data
ERA52 m air temperature (maximum)Hourly0.25°
MSWEP v2Gauge-adjusted reanalysis precipitation (total)Daily0.1°
Cattle Heat Stress Data
10 m u–component of windHourly0.25°
10 m v–component of wind
ERA52 m dew point temperature
2 m temperature
Surface solar radiation downwards
Relative humidity (at 1000 hPa)
10 m u–component of wind6 h instantaneous1.0°
10 m v–component of wind
2 m dew point temperature
ECMWF seasonal forecast2 m temperature
Surface solar radiation downwards24 h aggregation since beginning of forecast
Table 2. Keyword search combinations.
Population/ContextExposureOutcome
Pacific Island countriesClimate changePublic health
VanuatuClimate variabilityAnimal health
Small Island Developing StatesExtreme climate eventsAgriculture
Solomon IslandsNatural hazardsCattle heat stress
FijiNatural disastersHeat stress
Papua New GuineaTemperature riseVector-borne disease
Cook Islands Cattle mortality
Morbidity
Table 3. Summary table of the coefficients, 94% highest density intervals, Markov Chain Monte Carlo performance and model performance for Bayesian models at each time lag.
ProvinceVariableMean94% HDI *ESS ** BulkESS TailLOO ***
Intercept−0.05(−2.00, 1.71)2076.02043.0
MalampaTemperature0.59(0.36, 0.86)1466.01638.0−503.06
Precipitation0.04(0.00, 0.07)1430.0974.0
Intercept0.07(−1.76, 2.00)2143.02368.0
SanmaTemperature0.65(0.34, 1.03)1454.01778.0−543.35
Precipitation0.07(0.02, 0.11)1456.01609.0
Intercept−0.09(−2.03, 1.67)1524.01680.0
TorbaTemperature0.23(0.08, 0.37)1041.0964.0−404.32
Precipitation0.02(0.00, 0.03)986.0905.0
* 94% highest density interval; ** essential sample size; *** leave-one-out cross-validation.
Table 4. Accumulated Heat Load of each province on 31 January 2016, at the beginning of the forecasted week, calculated using observational climate data.
ProvinceStarting AHL *AHL Category
Malampa0.90Zero (<1)
Penama3.98Mild (1–10)
Sanma15.17Moderate (10–20)
Shefa4.57Mild (1–10)
Tafea1.07Mild (1–10)
Torba33.43Hot (20–50)
* Accumulated Heat Load.
Table 5. Forecasted number of ‘hot’ (Heat Load Index (HLI) > 93), ‘cool’ (HLI < 77) and ‘neutral’ (77 < HLI < 93) days within the first week of February 2016.
ProvinceHot Days (HLI * > 93)Neutral Days (77 < HLI < 93)Cool Days (HLI < 77)
Malampa430
Penama520
Sanma610
Shefa430
Tafea430
Torba610
* Heat Load Index.
Table 6. Malaria response strategies for varying risk levels.
Risk LevelResponse LevelResponse Strategies
LowBe awareRoll out PCD * [70]
Maintenance of LLINs **—check for holes, count number of times washed and reshare this information [15,72]
Provide households with new LLINs if required [15,18,72]
Distribute outdoor attractants to lure/trap mosquitoes [73]
Redistribution of information about LLINs and IRS *** to households [72,74]
MediumBe preparedRoll out ACD **** [70,75]
Issue warning to use LLINs [69,76]
Encourage wearing protective clothing [73,76]
Re-spray insecticide on indoor surfaces in and around houses [18,75,76]
Check stock and supply of anti-malaria medication (public, private and community-based delivery channels) [15,18]
Redistribute artemisinin-based combination therapy (treat cases and enhance detection and surveillance coverage) [15,18,69,75,76]
Set up physical screening barriers and repellents to deter and prevent indoor mosquito entry [73]
HighTake actionRoll out reactive case detection [70]
Develop chemoprophylaxis for high-risk groups and communities [18,77]
Send mobile malaria screenings and campaign teams [15,77,78]
Limit night activities, i.e., marketplaces, entertainment [79]
* Passive case detection. ** Long-lasting insecticidal nets. *** Indoor residual spraying. **** Active case detection.
Table 7. Cattle heat stress response strategies for varying risk levels.
Risk LevelResponse LevelResponse Strategies
Very LowNo to minimal actionProvide shade to maintain cattle’s thermal comfort zone [88,89]
Clean manure in and around water troughs and under shade structures reducing humidity from wet manure [88,89]
Provide additional water in troughs [90]
LowBe awareMove cattle under trees for additional shading [84,88]
Perform maintenance check on shading infrastructure and water storage facilities [88,89]
Limit grouping of cows [89]
MediumBe preparedLimit animal movements and handling [87,88]
Provide consistent sources of water supply in troughs [87,89]
Observe breathing condition and panting frequency [86,88]
HighTake actionIncrease roughage content of diet (nutrition program—low heat increment feed ingredients (fats and oils)) [88]
Intermittently sprinkle cows for cooling purposes [91]
Establish several areas for shading [86,92]
Disclaimer/Publisher’s Note: The statements, opinions and data contained in all publications are solely those of the individual author(s) and contributor(s) and not of MDPI and/or the editor(s). MDPI and/or the editor(s) disclaim responsibility for any injury to people or property resulting from any ideas, methods, instructions or products referred to in the content.