Article

Locating Urban Area Heat Waves by Combining Thermal Comfort Index and Computational Fluid Dynamics Simulations: The Optimal Placement of Climate Change Infrastructure in a Korean City

1
Department of Environmental Landscape Architecture, Gangneung-Wonju National University, Gangneung 25457, Republic of Korea
2
Graduate School of Environmental Technology Cooperative Course, Gangneung-Wonju National University, Gangneung 25457, Republic of Korea
3
International Center for Urban Water Hydroinformatics Research & Innovation, Yeonsu-gu, Incheon 21988, Republic of Korea
*
Author to whom correspondence should be addressed.
Climate 2025, 13(6), 113; https://doi.org/10.3390/cli13060113
Submission received: 8 April 2025 / Revised: 16 May 2025 / Accepted: 26 May 2025 / Published: 29 May 2025
(This article belongs to the Special Issue Climate Adaptation and Mitigation in the Urban Environment)

Abstract

:
The intensification of extreme temperature events driven by climate change has heightened the vulnerability of urban areas to heatwaves, making it a critical environmental challenge. In this study, we investigate the spatial characteristics of urban heatwave vulnerability in Jungang-dong, Gangneung—a representative mid-sized coastal city in South Korea that experiences a strong urban heat island (UHI) effect due to the prevalent land–sea breeze dynamics, high building density, and low green-space ratio. A representative heatwave day (22 August 2024) was selected using AWS data from the Korea Meteorological Administration (KMA), and hourly meteorological conditions were applied to Computational Fluid Dynamics (CFD) simulations to model the urban microclimates. The thermal stress levels were quantitatively assessed using the Universal Thermal Climate Index (UTCI). The results indicated that, at 13:00, the surface temperatures reached 40 °C and the UTCI values peaked at 43 °C, corresponding to a “Very Strong Heat Stress” level. Approximately 17.4% of the study area was identified as being under extreme thermal stress, particularly in densely built-up zones, roadside corridors with high traffic, and pedestrian commercial areas. Based on these findings, we present spatial analysis results that reflect urban morphological characteristics to guide the optimal allocation of urban cooling strategies, including green (e.g., street trees, urban parks, and vegetated roofs), smart, and engineered infrastructure. These insights are expected to provide a practical foundation for climate adaptation planning and thermal environment improvement in mid-sized urban contexts.

1. Introduction

1.1. Background

With the intensification of extreme temperature events caused by climate change, urban heatwave vulnerability has emerged as a critical issue [1,2,3]. In particular, heatwaves are exacerbated in urban areas due to the increased building density and spread of asphalt and concrete pavement, and the reduction in green spaces. These factors contribute to the aggravation of the urban heat island (UHI) effect [4,5]. The deterioration of the thermal environment in urban centers directly affects public health and quality of life, especially for socially vulnerable groups such as the elderly, outdoor workers, and low-income residents [6,7].
This urban heat island phenomenon is also prevalent in some highly urbanized cities in South Korea [8]. Gangneung, a representative tourist city located on the east coast of Korea, experiences intensified heatwaves during the summer due to the temperature gap between coastal and inland areas. In its city center, the high building density and low proportion of green spaces exacerbate thermal environmental issues [9]. Specifically, Jungang-dong, the administrative and commercial hub of Gangneung, is characterized by high amounts of pedestrian traffic, extensive asphalt and concrete surfaces, and a lack of greenery, resulting in severe heat accumulation and limited cooling effects [10]. Therefore, it is essential to quantitatively analyze heat-vulnerable areas like Jungang-dong and to establish optimized climate adaptation strategies accordingly.
To mitigate the damage caused by heatwaves, local governments are implementing various policies. Gangneung City is promoting heatwave adaptation through the “2nd Gangneung Climate Change Adaptation Action Plan (2021–2025)”, which encompasses measures such as protection for vulnerable groups, the expansion of urban greenery, and increased use of cooling systems.
Additionally, the city is planning to establish a heatwave response system utilizing smart infrastructure under the “2nd Gangneung Smart City Master Plan (2021–2025)” [11]. At the regional level, the “1st Gangwon Special Self-Governing Province Basic Plan for Carbon Neutrality and Green Growth (2024–2033)” outlines climate crisis response strategies involving Gangneung and other municipalities. While these policies play an important role in alleviating the impacts of heatwaves, there remains a lack of detailed analysis on heatwave vulnerability within the urban context [12].
To effectively respond to the urban heat island (UHI) phenomenon, it is essential to accompany structural and technological measures with quantitative and scientific analyses of heatwave vulnerability within urban areas from a research perspective. Previous studies have primarily focused on protecting vulnerable populations or proposing individual mitigation strategies, such as expanding roadside greenery or applying reflective materials to buildings [12,13,14]. However, most implementation plans have been carried out solely based on policy frameworks, lacking a systematic process to identify optimal locations for adaptation facilities through spatial heatwave vulnerability analysis and to quantitatively assess their effectiveness [12]. Therefore, to evaluate urban heatwave vulnerability more systematically, the integration of quantitative data analysis is crucial.
Vulnerability assessment is another area that has received considerable attention in heatwave-related research. One notable approach is the Analytic Hierarchy Process (AHP), which evaluates vulnerability by hierarchically structuring and weighting multiple criteria [15,16]. AHP is useful for comparing and evaluating urban heatwave vulnerability by considering variables such as temperature, humidity, wind speed, and radiant heat.
Nevertheless, these conventional methods have limitations in terms of accurately modeling physical environmental processes [17]. For example, assessments based solely on statistical analyses of temperature, humidity, or wind data struggle to reflect localized thermal environmental changes in urban settings [18]. Additionally, although Geographic Information System (GIS)-based spatial analysis excels at visualizing spatial distribution, it lacks the precision required to analyze interactions among climatic elements [19].
To overcome these limitations, recent research has increasingly applied Computational Fluid Dynamics (CFD) simulations to more precisely analyze the urban thermal environment [20,21,22,23,24]. CFD allows for numerical analyses of fluid flow within a space, enabling detailed assessments of temperature variations, air circulation, and radiative heat transfer. This provides a more comprehensive understanding of physical interactions that are difficult to capture using traditional methods [25]. Consequently, CFD can move beyond simple climate data-based assessments by identifying mechanisms of heatwave occurrence and verifying the potential cooling effects of green and smart infrastructure interventions [26].
The objective of this study is to quantitatively analyze heat-vulnerable areas in Jungang-dong, Gangneung, and present evidence-based data for the optimal placement of climate adaptation infrastructure. To this end, we apply the Universal Thermal Climate Index (UTCI) and CFD simulations to derive climate adaptation strategies that are applicable not only to Gangneung but also to other cities with similar climatic conditions [27,28,29]. The heat-vulnerable areas in Jungang-dong are identified through an analysis of climatic data (temperature, humidity, wind speed, etc.), followed by simulation using the UTCI.
This study is expected to contribute to the development of scientific and data-driven urban climate adaptation strategies through quantitative heatwave vulnerability assessments. The proposed approach can serve as a practical model for improving the urban environment and developing effective heatwave response strategies in Gangneung and other cities with comparable climatic conditions [30].

1.2. Literature Review

Previous studies relevant to this research can be classified into four categories: (1) urban heat mapping using satellite imagery, (2) heat mitigation research based on physically grounded models such as Computational Fluid Dynamics (CFD), (3) identification of thermal hotspots in urban areas through vulnerability assessments, and (4) heatwave prediction using technologies such as artificial intelligence.
Numerous studies have used satellite imagery to map urban heat islands (UHIs). Since 2018, this has remained a prominent research topic. A recent study by Yoo et al. developed a 30 m resolution heatwave map for Seoul that demonstrated strong reliability, with an R2 value exceeding 0.7 [31]. Nichol and To analyzed urban heat stress using four ASTER thermal satellite images and showed that satellite data can more accurately identify heat-prone areas than meteorological stations [32]. Additionally, a study in Dhaka, Bangladesh, utilized Landsat 8 (OLI) imagery from April 2021, and a time-series analysis of Land Surface Temperature (LST) using Terra/Aqua MODIS data from 2003 to 2015 was conducted in Sydney, Australia [33,34]. These studies confirmed that MODIS and Landsat data are effective for spatial and temporal monitoring of UHI phenomena. Furthermore, some studies which measured LST using MODIS and Landsat 8 calculated heat exposure indices, and applied GIS-based spatial analysis tools to integrate sociodemographic variables, thereby producing UHI vulnerability maps [34].
CFD-based research on urban heat mitigation has gained attention in response to the growing climate crisis. For example, Kim and Kang (2022) evaluated the temperature reduction effects of a fog cooling system in Daegu and proposed an optimal deployment strategy [35]. They reported a high simulation accuracy, with an R2 value above 0.8.
Studies using the Analytic Hierarchy Process (AHP) have also been conducted. One such study assessed UHI hotspots in Can Tho, a rapidly urbanizing city in the Mekong Delta, Vietnam. They identified key drivers of the UHI effect and examined changes in surface urban heat islands (SUHIs) during urban development [36]. Artificial intelligence has recently been employed to predict heatwave severity, and machine learning techniques have achieved high accuracy and low error rates in this area [37].
Despite these advancements, existing approaches often lack the ability to simulate physical urban environments in detail. We aim to overcome these limitations through improved modeling techniques. The novel aspects of this research are summarized as follows:
  • A precise assessment of heatwave vulnerability through quantitative, CFD-based simulations.
  • The proposal of quantitative guidance for the optimal implementation of climate adaptation infrastructure.
  • The derivation of simulation-based adaptation strategies applicable to Gangneung and other cities with similar climatic conditions.

2. Materials and Methods
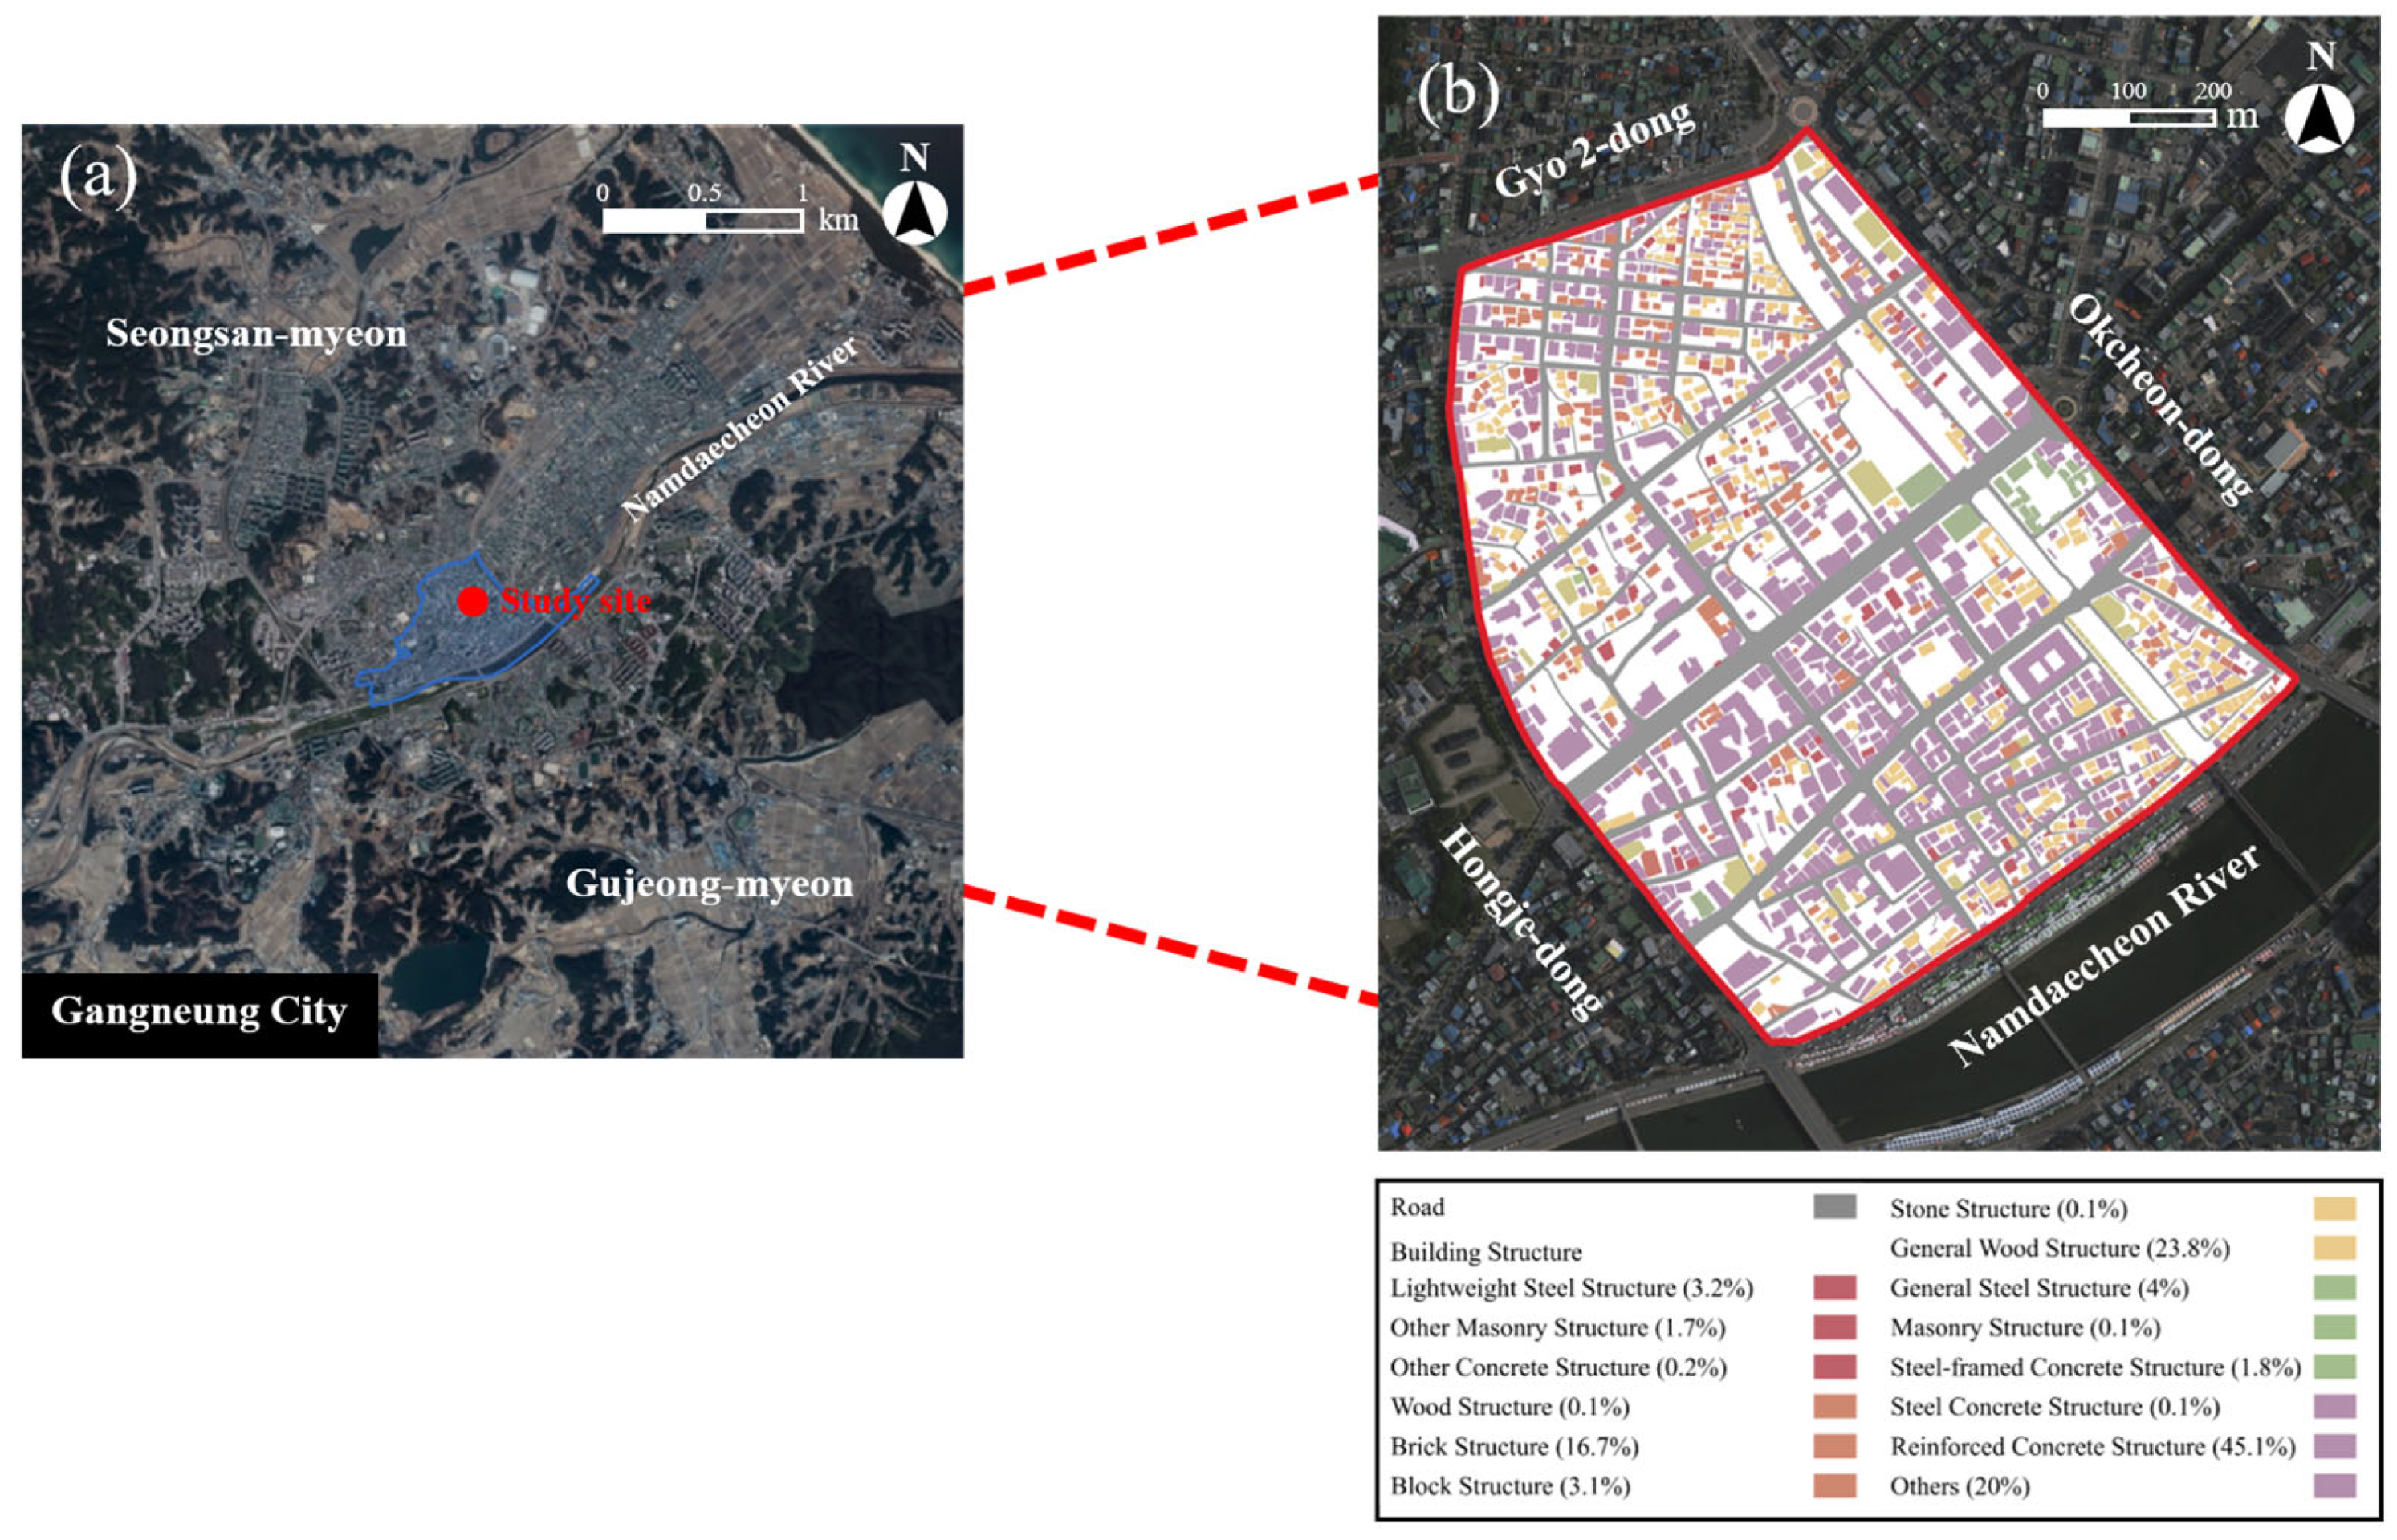
In the first step, a comprehensive review of relevant literature and previous studies was conducted [38]. In the second step, the study area was selected, followed by spatial analysis (e.g., land use and building layout) and environmental analysis (e.g., temperature, humidity, and wind patterns) [39]. Subsequently, a 3D model was constructed, boundary conditions were defined, and meteorological data were applied for the simulation. In the next step, heatwave vulnerability was analyzed using CFD simulation, and the results were visualized [40,41]. In the final stage, a quantitative comparison was also performed to evaluate the correlation between the input air temperature data and the simulated surface temperature derived from CFD. Furthermore, the temporal variation of both surface temperature and UTCI was analyzed to assess how accurately the CFD model reproduced the dynamic thermal environment based on observed meteorological conditions. The input air temperature was obtained from AWS observations by the Korea Meteorological Administration, while the simulation outputs included spatial distributions of surface temperature and UTCI.

2.1. Site Analysis

Jungang-dong is located in the central area of Gangneung City, Gangwon Special Self-Governing Province. The total study area is approximately 494,168 m2, and the average building height is about 3.8 m (Figure 1). This area was selected as the study site due to its high pedestrian density, elevated heatwave exposure risk, pronounced urban heat island (UHI) effect, and insufficient cooling infrastructure [42]. Jungang-dong has a high building density and a large proportion of impervious surfaces, resulting in increased heat accumulation and persistently high nighttime temperatures [43]. In addition, the area experiences heavy traffic, contributing to thermal loads through vehicle exhaust emissions [44]. In terms of structure types, reinforced concrete buildings account for the highest proportion (45.1%), followed by wooden structures, brick structures, and other types. This indicates that while some traditional wooden buildings remain, many newly constructed or renovated buildings use reinforced concrete for enhanced durability.
Regarding building usage, detached houses comprise the largest proportion (43.9%), followed by Class 1 neighborhood living facilities (30.5%). This reflects a mixed-use urban structure with both residential and small-scale commercial buildings. Based on the year of construction, buildings from the 1980s represent the highest proportion, at 24%, and most structures are one-story buildings. Additionally, 86.9% of the buildings fall within a size range of 0–200 m2, indicating that the area is primarily composed of small-scale residential and commercial facilities.

2.2. Selection of Analysis Software

In this study, Computational Fluid Dynamics (CFD) was applied to conduct a quantitative assessment of the urban thermal environment. For this purpose, Simcenter STAR-CCM+ version 2310 was utilized. This software is optimized for analyzing various fluid dynamic and heat transfer phenomena based on the Finite Volume Method (FVM) [46]. STAR-CCM+ allows for turbulence modeling, radiative heat transfer analysis, and multiphase flow simulation, making it suitable for analyzing complex physical interactions in urban airflow and thermal environments [47].
In the climate simulation, the Reynolds-Averaged Navier–Stokes (RANS) equations were applied to precisely model airflow and heat transfer within the urban area [48,49]. The Realizable k-ε turbulence model was employed in this study to improve the accuracy of turbulent flow and thermal behavior simulations. Although this study focused on extreme heatwave conditions, the CFD model that was employed—based on the RANS equations and the Realizable k-ε turbulence model—is widely applicable to various urban climate scenarios, including non-extreme conditions. The governing equations can be expressed as Equation (1) [50]:
α ( p k ) α t + α ( p k u i ) α χ i = α α χ j [ ( μ + μ t σ k ) α k α χ j ] + Ρ k ρ ϵ
In this study, p denotes the fluid density, u i represents the velocity components, μ is the dynamic viscosity, and μ t is the turbulent (or eddy) viscosity. The turbulent Prandtl number for energy transport is denoted by σ k , while Ρ k refers to the generation of turbulence kinetic energy. Finally, ϵ denotes the dissipation rate of turbulence kinetic energy.
Using these equations, CFD simulations were conducted to analyze the thermal environment in urban areas. The results provide a quantitative understanding of how building arrangement, road layout, and green spaces influence the urban heat island effect and air circulation [51].

2.3. Meteorological Data Analysis

To assess heatwave vulnerability in the study area, meteorological data for Gangneung City were utilized. The data were obtained from the Automatic Weather System (AWS) provided by the Korea Meteorological Administration (KMA) Open Data Portal [52]. Temperature data from 18 June to 31 August 2024 were analyzed to identify the hottest day during this period. Subsequently, temperature data at hourly intervals from 6:00 a.m. to 6:00 p.m. on the selected day were used for simulation.
The AWS station is located near Unjeonggyo Bridge over Gyeongpo Stream in Gangneung, Gangwon Special Self-Governing Province. Temperature, wind direction, wind speed, and humidity data recorded at this station were applied as input values for the CFD model (Table 1). As the station is situated outside the dense urban core, the data are not affected by localized heat island effects, making them suitable for representing baseline boundary conditions in the simulation.
To analyze wind direction, AWS data were collected from 18 June to 31 August 2024, and a wind rose diagram was generated using WRPLOT (https://www.weblakes.com/software/freeware/wrplot-view/ accessed on 16 May 2025). A total of 967 datasets were recorded at 1 h intervals during this period. The analysis revealed that the prevailing wind direction was northeast, with wind speeds ranging from 2.1 m/s to 3.6 m/s (Figure 2).

2.4. Boundary Condition Setup

To create the 3D model, it was necessary to define the model components. The components were classified into buildings, green spaces, roads, outer walls, and sky [53]. Prior to running the simulation, the mesh structure was configured based on the study of Kim et al. (2024), and the mesh size was set as shown in Table 2 [54].
The highest temperature in the summer of 2024 in Gangneung was recorded on 22 August, so this date was selected as the representative heatwave day and chosen for the simulation. The CFD simulation was run for 12 h, from 6:00 a.m. to 6:00 p.m., with 300 iterations per hour, resulting in a total of 3600 iterations. Although the simulation was conducted for a single day, this approach is widely used in urban climate studies to capture worst-case thermal conditions under limited computational resources. The selected day effectively represents the most extreme heat stress scenario, which is critical for evaluating the performance of adaptation infrastructure.

2.5. Evaluation Method: Air Temperature and UTCI

In this study, the surface temperature and Universal Thermal Climate Index (UTCI) were jointly employed to perform a more precise analysis of the urban thermal environment [55]. The surface temperature, derived from the Computational Fluid Dynamics (CFD) simulation results, represented the degree of heat accumulation on urban surfaces such as roads, sidewalks, and building facades, and served as a key physical indicator for assessing urban heat island (UHI) phenomena.
The Universal Thermal Climate Index (UTCI) was adopted as the thermal comfort assessment method [55]. The UTCI is a comprehensive index that reflects air temperature, humidity, wind speed, and radiant heat (including solar radiation), allowing for a precise evaluation of the perceived temperature under heatwave conditions [56,57]. The UTCI can be classified into ten categories, as shown in Table 3 [58]. The UTCI values in this study were derived from CFD simulation outputs and represent levels of perceived thermal stress that account for multiple environmental factors, including air temperature, humidity, wind speed, and MRT. Therefore, these values differ fundamentally in terms of purpose and interpretation from the meteorological input data shown in Table 1, which were based on AWS observations and used as boundary conditions for the CFD model.
The UTCI is defined by Equation (2) [59]:
U T C I = 3.21 + 0.872 × T + 0.2459 × M R T 2.5078 × ν 0.0176 × R H
Here, T is the air temperature (°C), M R T is the mean radiant temperature (°C), ν is the wind speed (m/s), and R H is the relative humidity (%).

3. Results

3.1. Results of Air Temperature Analysis

According to the surface temperature analysis derived from the CFD simulation, the thermal environment of the study area—Jungang-dong in Gangneung City—exhibited significant temporal variation. The simulation was based on hourly meteorological data from the Korea Meteorological Administration, and the resulting air temperature values at 1.5 m represent spatially averaged outputs from the CFD model. At 6:00 a.m., the minimum temperature was recorded as 25 °C, and as the solar altitude increased, the temperature rose rapidly, reaching a peak of 40 °C (simulated air temperature) at 1:00 p.m. At a pedestrian height of 1.5 m, the spatially averaged temperature across the study area reached 39 °C, indicating a considerable level of perceived heat stress during human activities. The variation in the surface temperature distribution by time of day is visualized in Figure 3, which presents the simulation results at one-hour intervals from 7:00 a.m. to 6:00 p.m. The figure demonstrates a gradual increase in the surface temperature due to increased solar radiation and heat accumulation, peaking in the afternoon hours.
Interestingly, the simulation showed that the peak temperature occurred one hour earlier (at 1:00 p.m.) than the actual observed peak. This can be attributed to reduced solar radiation reaching the ground and pedestrians due to the shading effect of buildings at around 2:00 p.m., which slowed the rate of temperature increase. This result highlights the influence of building configuration and shadow formation on the urban thermal environment, emphasizing the importance of solar radiation control in urban design [60,61].
Moreover, the spatial distribution of air temperature also showed considerable variation. Higher temperatures were observed near wide roadways with broad pedestrian paths, narrow alleys between buildings, and intersections with large areas of paved surfaces that promote heat accumulation. These findings demonstrate how localized heat island effects can vary significantly depending on the urban landscape’s spatial characteristics [62,63].

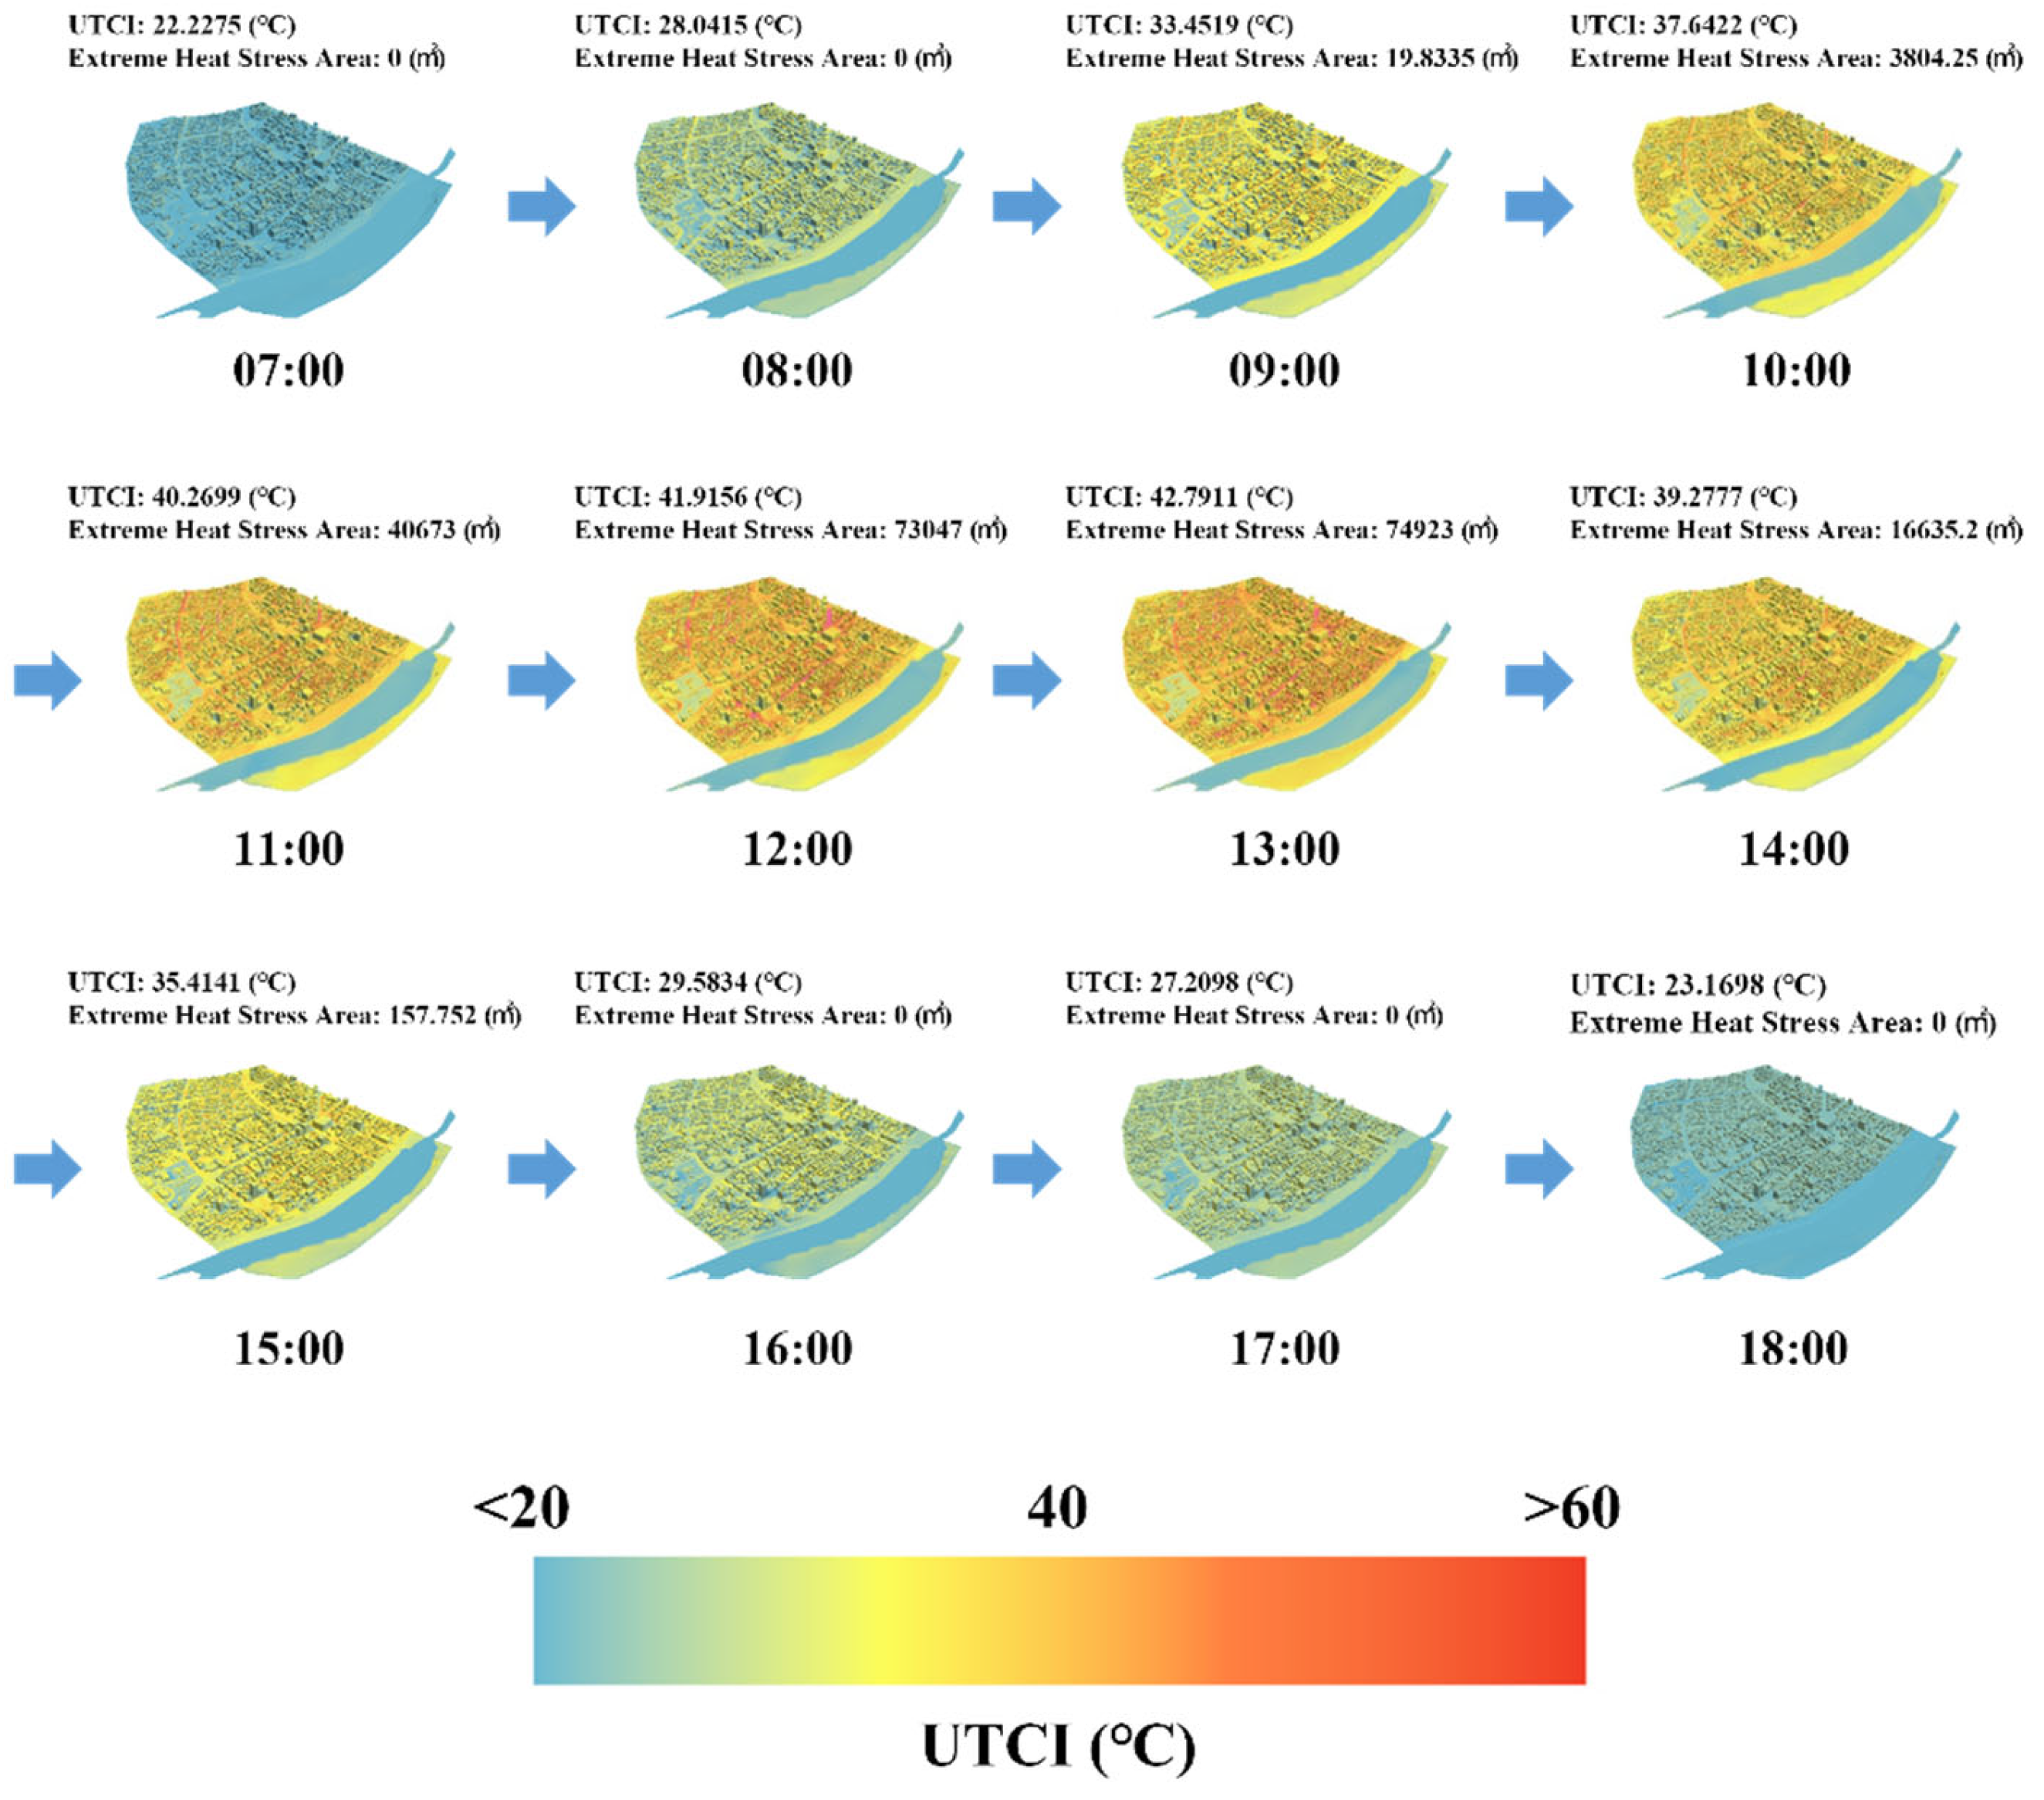
3.2. Results of the Thermal Comfort Index (UTCI) Analysis

According to the thermal comfort analysis using the Universal Thermal Climate Index (UTCI), the study area recorded a UTCI value of 43 °C at 1:00 p.m., corresponding to the “Very Strong Heat Stress” level. This index reflects the intensity of thermal stress experienced by the human body, as it considers not only the air temperature but also the humidity, radiant heat, and wind speed [64]. At 6:00 a.m., the UTCI was a relatively comfortable 18 °C, but it increased sharply after 9:00 a.m., resulting in extreme thermal conditions in the afternoon. The variation in the thermal comfort distribution by time of day is visualized in Figure 4, which presents hourly UTCI distributions from 7:00 a.m. to 6:00 p.m. This figure illustrates the temporal progression of perceived temperature and clearly shows the gradual expansion of areas experiencing “Extreme Heat Stress” (UTCI ≥ 41 °C) as time advances.
Notably, areas with UTCI values exceeding 41 °C, classified as Extreme Heat Stress Areas, covered approximately 86,200 m2 at 12:00 p.m., accounting for about 17.4% of the total study area. These areas were predominantly found in dense commercial zones, sidewalks adjacent to roadways, and intersections with high traffic volumes.
The correlation between the spatial characteristics and UTCI values indicates that factors such as building density, road pavement conditions, restricted airflow, and the presence of anthropogenic heat sources (e.g., vehicles) contribute to an elevated UTCI [65,66]. In particular, 45.1% of the buildings in the study area are reinforced concrete structures, which tend to absorb solar radiation during the day and gradually release it at night, exacerbating nocturnal heat accumulation [67].
Additionally, the building use analysis revealed that detached houses (43.9%) and Class 1 neighborhood living facilities (30.5%) make up the majority of the area’s structures. This indicates that Jungang-dong is not solely a residential district but also an active zone of pedestrian and commercial activities, increasing heat stress risks for vulnerable groups such as the elderly, street vendors, and shopkeepers. These findings highlight the urgent need for climate adaptation strategies.
The time-series variation in temperature is presented in Figure 5a. As shown in the graph, all three indicators gradually increased from 06:00 and peaked in the afternoon, followed by a downward trend. Notably, while the simulated surface temperature and UTCI reached their maximum at 13:00, the input air temperature peaked at 14:00. This time lag is interpreted as a result of the physical characteristics reflected in the CFD simulation, such as shading effects from buildings and surface heat storage. Overall, the simulation results closely followed the temporal pattern of the observed air temperature.
The scatter plot shown in Figure 5b illustrates the quantitative correlation between the input air temperature and the simulated surface temperature. The coefficient of determination (R2) was found to be 0.939, indicating a strong linear relationship between the two variables. This suggests that the CFD simulation effectively captures the thermal dynamics of the urban surface based on real-world temperature inputs.

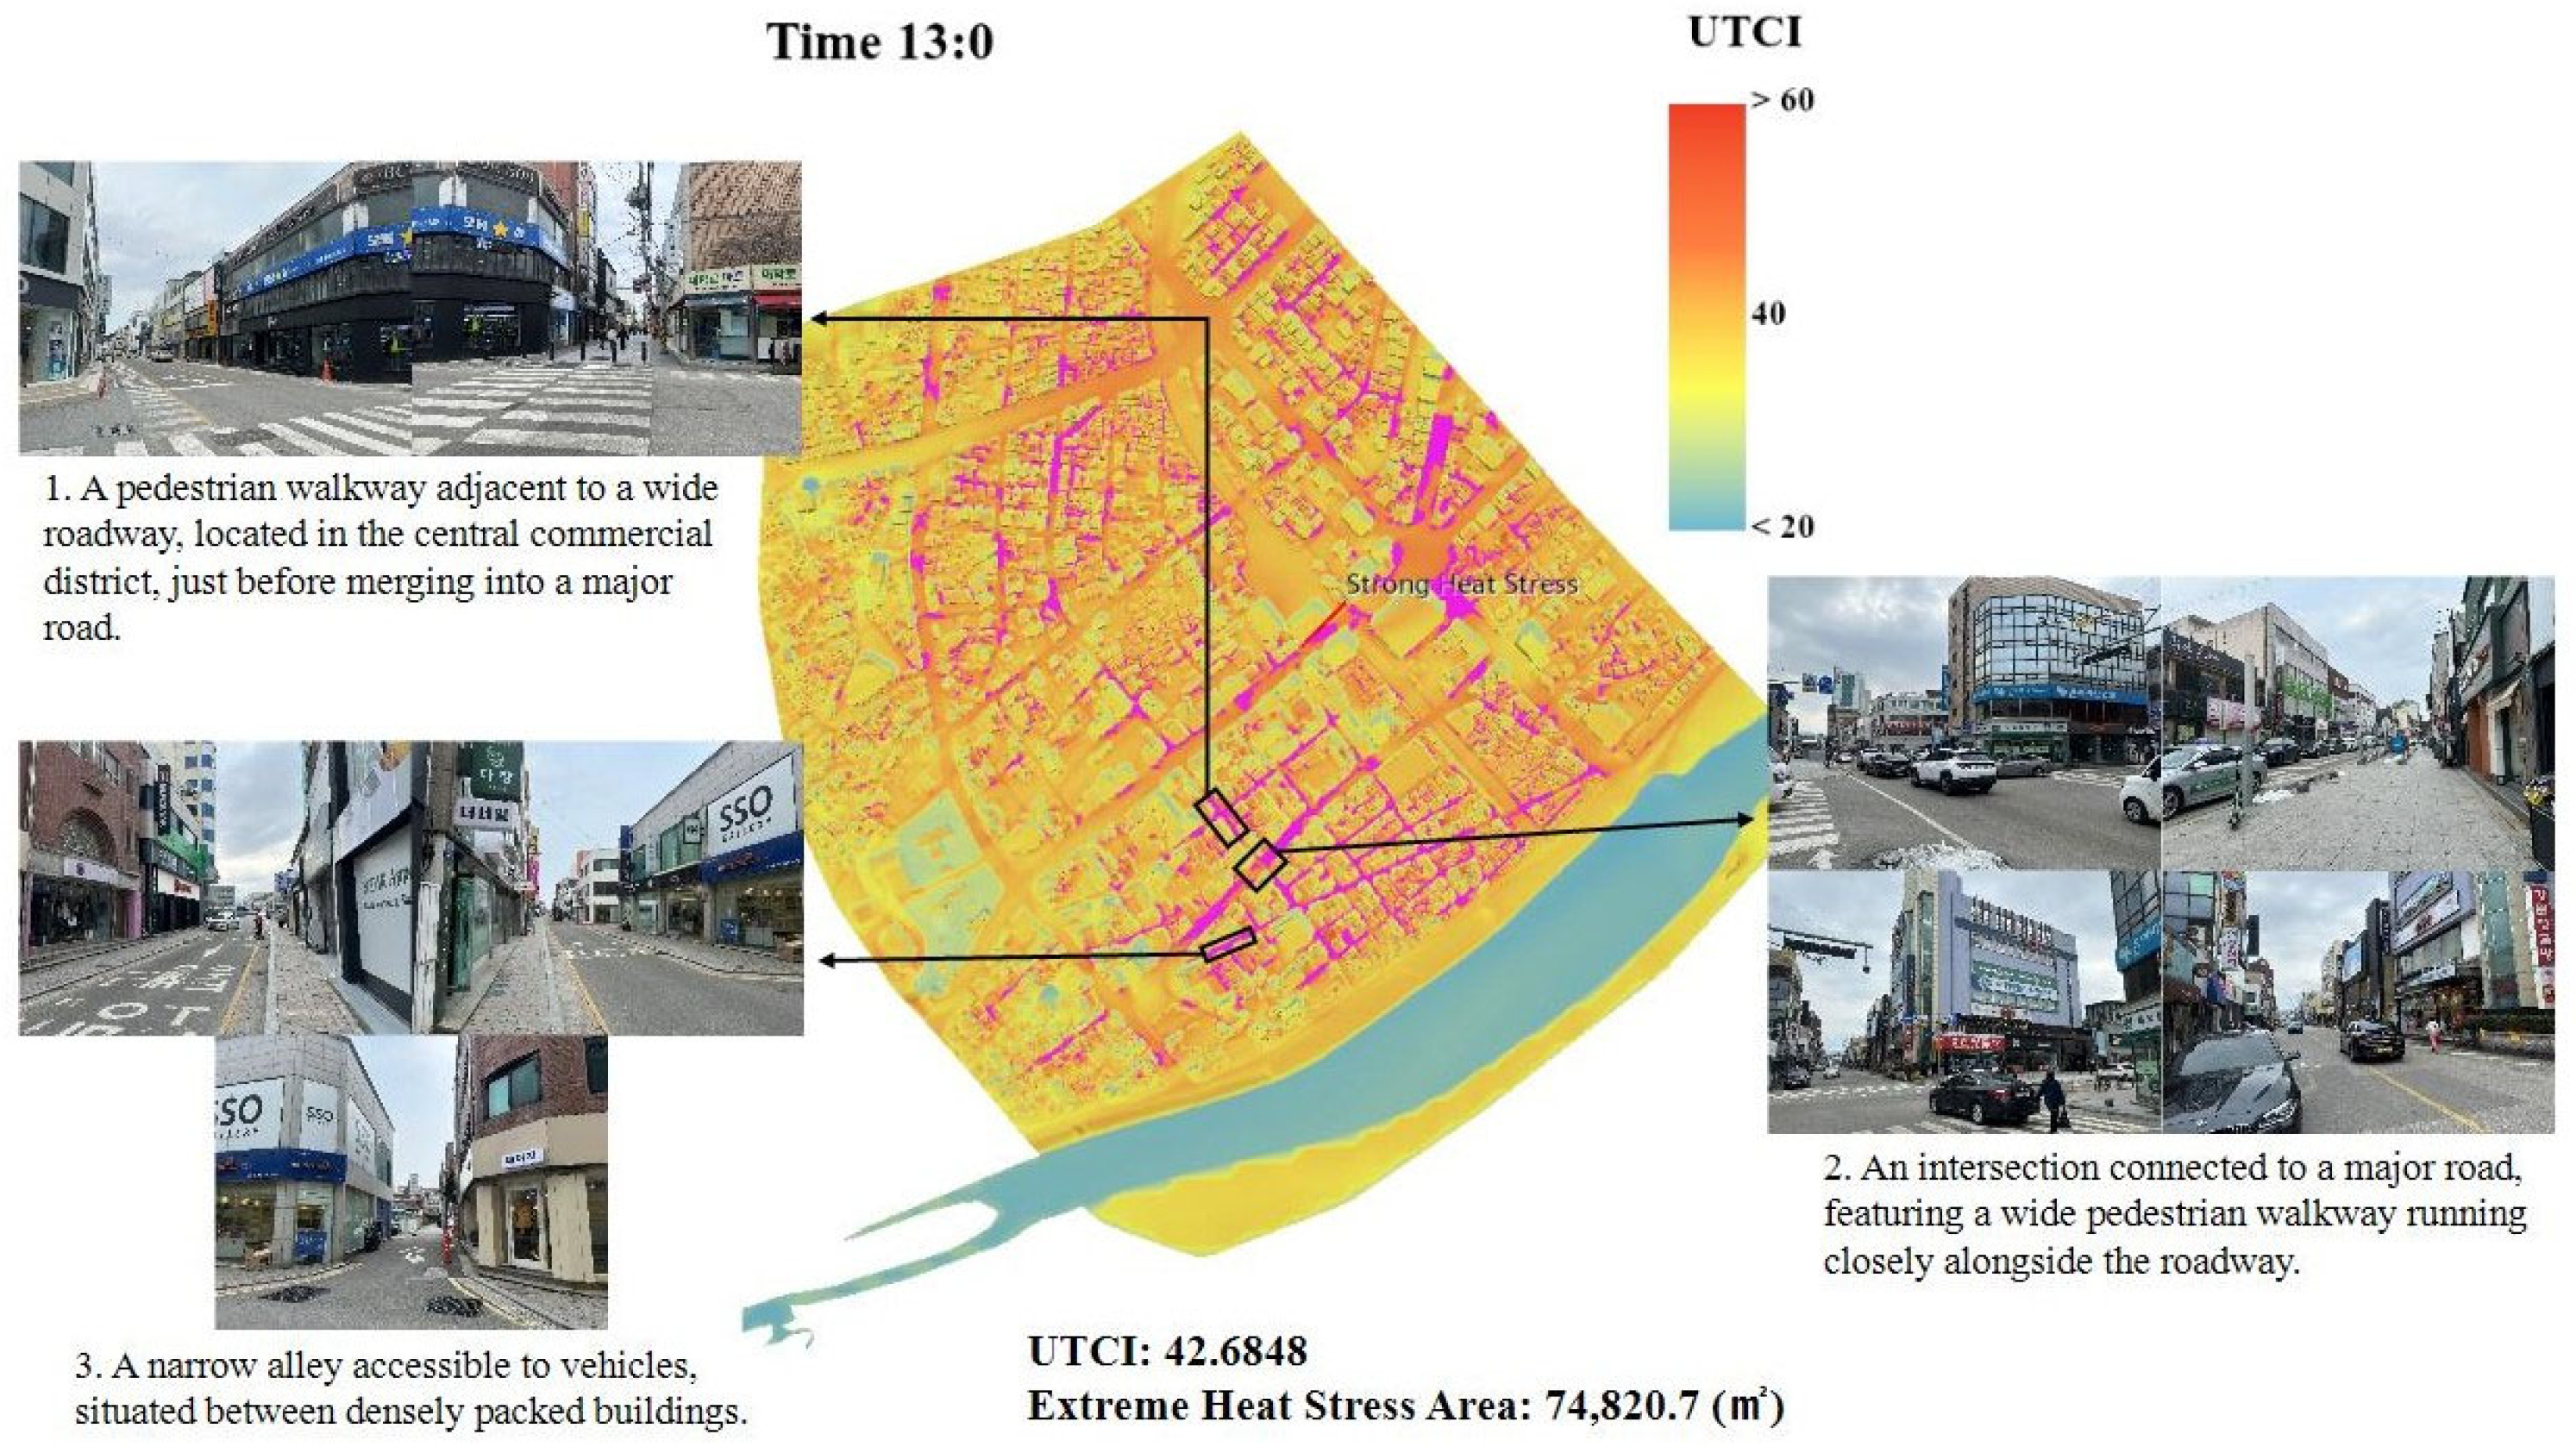
3.3. Characteristics of Heat Wave-Vulnerable Areas

Based on the results of the heatwave simulation, the Extreme Heat Stress Area (UTCI ≥ 41 °C) in Jungang-dong, Gangneung, was approximately 74,820.7 m2 at 13:00, when the UTCI reached its highest value of 42.68 °C, corresponding to the Very Strong Heat Stress category. Spatially, severe heat stress was primarily concentrated in commercial zones, pedestrian pathways adjacent to roads, and intersections with heavy vehicular traffic.
Figure 6 visualizes these UTCI analysis results in conjunction with on-site photographs of representative hotspots.
The first case depicts a pedestrian walkway adjacent to a wide road between dense commercial buildings. This area is highly exposed to direct solar radiation and lacks shaded zones, contributing to elevated UTCI values.
The second case is located near a major intersection where wide pedestrian areas and high traffic volumes coexist. The prevalence of asphalt paving and the scarcity of shading structures lead to persistently high temperatures.
The third case involves a narrow alley flanked by tall buildings. Due to the limited air circulation and the accumulation of radiative heat, this location experiences the most intense thermal stress.
These visual and quantitative findings allow for the more precise identification of heat-vulnerable zones within the city. They serve as essential baseline data for prioritizing areas when implementing climate adaptation strategies, such as cooling infrastructure or the expansion of urban green spaces.

4. Discussion

In this study, we aimed to address the limitations of existing heatwave vulnerability assessment methods by adopting a more quantitative approach to analyzing the urban thermal environment [68]. Based on our findings, the following key insights were derived.
First, a quantitative analysis using Computational Fluid Dynamics (CFD) simulations was conducted to overcome the shortcomings of conventional vulnerability assessment methods [21]. Previous studies have primarily relied on GIS-based spatial analyses or statistical assessments of climatic data to identify heat-vulnerable areas. However, such approaches often fall short in accurately reflecting physical interactions such as airflow, heat accumulation, and radiative heat transfer that occur in actual urban microclimates [69]. By applying a CFD simulation, we quantitatively evaluated the heatwave vulnerability in the urban environment. The results indicated that Jungang-dong in Gangneung City was most vulnerable at 1:00 p.m., coinciding with the peak in solar radiation and the release of accumulated heat from road surfaces and building exteriors—conditions that intensify thermal stress.
Second, this study distinguishes itself by focusing on a small- to mid-sized city—Jungang-dong in Gangneung—rather than a major metropolitan area. Previous studies have primarily examined large cities such as Seoul, Busan, and Daegu, with relatively little research conducted on the heatwave response in smaller cities [70,71]. However, the impacts of climate change are increasingly affecting mid-sized urban areas, highlighting the need for scientific countermeasures. This study underscores the importance of developing evidence-based heat mitigation strategies in small cities like Gangneung, and our proposed approach could contribute to the development of heatwave response models in other regions with similar climatic conditions.
Nevertheless, it should be acknowledged that the CFD was validated using temperature data from a single AWS station. While the high coefficient of determination between the observed and simulated temperature adds credibility to the simulation framework, spatial limitations exist. Relying on a single-point validation may not fully capture microclimatic variations across the entire study area, particularly in complex urban geometries. This limitation stems from data availability and is common in urban-scale CFD studies. Future research should incorporate multi-point observational data to enhance the spatial reliability of the simulation results and further support the proposed modeling approach.
In addition, future research may expand upon this study by evaluating the effectiveness of actual cooling interventions—such as cooling mist systems, heat-reflective pavements, and urban greening—in the identified heat-vulnerable areas. Among these, green vegetation plays a particularly vital role: trees and shrubs with dense foliage provide shade, absorb air pollutants, sequester carbon, and reduce urban residents’ physiological and psychological stress. These co-benefits underscore the necessity of incorporating green elements as part of a comprehensive and multifunctional climate adaptation strategy.
To enhance practical applicability, future studies should systematically incorporate multiple adaptation strategies into the simulation framework and evaluate their relative effectiveness under different urban conditions. Such efforts will contribute to bridging the gap between theoretical modeling and real-world implementation. By spatially analyzing heat-vulnerable areas using UTCI-based CFD simulations, this study provides a basis for identifying the optimal placement of climate adaptation infrastructure, making it possible to establish more effective and location-specific heatwave response models.
Overall, this study provides a CFD-based vulnerability assessment framework applied in the context of a small urban area, which could serve as a foundational reference for future climate adaptation strategies in similar cities both domestically and internationally.

5. Conclusions

This study aimed to quantitatively analyze the urban heatwave vulnerability in Jungang-dong, Gangneung City, using Computational Fluid Dynamics (CFD) simulations and the Universal Thermal Climate Index (UTCI). The study also aimed to establish a foundational dataset to support climate adaptation strategies. Based on the results, the three key contributions of this research can be summarized as follows:
First, a quantitative evaluation of heatwave vulnerability in an urban context was conducted. Whereas previous studies primarily relied on GIS-based spatial analysis or statistical approaches using climatic data, this study applied CFD simulations to achieve a more precise assessment [72,73]. The findings revealed that areas with dense building clusters and roadway-adjacent sidewalks were the most vulnerable to heat stress. The UTCI analysis further confirmed that 1:00 p.m. was the time of peak thermal stress in the study area. These results can serve as critical inputs for future heatwave mitigation strategies. Second, a new direction for vulnerability assessment was proposed by integrating CFD and the UTCI. CFD enables a detailed simulation of airflow and heat accumulation in urban spaces, while the UTCI provides an objective index to evaluate the physiological impacts of heat on the human body. By combining these tools, the study introduced a more systematic approach to analyzing heat stress that goes beyond simple temperature-based assessments and incorporates multiple environmental stressors.
Third, practical data were provided to guide the implementation of climate adaptation infrastructure. By identifying Extreme Heat Stress Areas, the study offers a basis for selecting optimal locations for applying cooling systems and green infrastructure [74]. Green infrastructure measures may include street trees, green roofs, vertical greening, and pocket parks. Urban greening, in particular, refers to a broader integration of vegetation into the urban fabric, encompassing not only cooling installations but also landscape-based interventions such as linear green corridors, bioswales, and green pedestrian zones. These vegetation-based solutions not only provide cooling through shading and evapotranspiration, but also offer a wide range of additional benefits, including improved air quality, stormwater management, biodiversity enhancement, reduced noise levels, carbon sequestration, and psychological well-being. This goes beyond reactive heatwave responses and contributes to climate-resilient urban design through scientific and data-driven planning.
Overall, this study moves beyond a simple analysis of air temperature distribution by presenting results of a quantitative, simulation-based spatial distribution of heat stress that directly affects human health. The findings provide a scientific basis for future policies such as urban cooling system installation, green infrastructure development, and changes in road surface materials.
However, a key limitation of this study is that the simulation was conducted for a single day. Therefore, future studies should address this limitation by incorporating long-term meteorological data and accounting for inter-day and inter-annual variability, thereby improving the statistical robustness and general applicability of the results. Additionally, incorporating climate change scenarios and long-term meteorological data into future models may enable more realistic forecasting of heatwave risks and support the development of robust climate adaptation models.
In conclusion, this study holds both academic and policy-level significance in that it presents a quantitative, data-driven approach to heatwave vulnerability analysis and provides a scientific foundation for establishing climate adaptation strategies. The findings are expected to make a meaningful contribution to urban climate adaptation policy formulation and sustainable urban environment design.

Author Contributions

Conceptualization, methodology, and supervision, J.K.; software, formal analysis, and writing-original draft preparation, S.C. (Sinhyung Cho); writing-review and editing, S.C. (Sinwon Cho); Project administration and funding acquisition, S.J. All authors have read and agreed to the published version of the manuscript.

Funding

This work was supported by the National Research Foundation of Korea (NRF) grant funded by the Korean government (MSIT) (No. RS-2023-00259995).

Data Availability Statement

Data are available upon request.

Conflicts of Interest

The authors declare no conflict of interest.

References

  1. IPCC. Climate Change 2021: The Physical Science Basis; Cambridge University Press: Cambridge, UK, 2021; Available online: https://www.ipcc.ch/report/ar6/wg1/ (accessed on 28 March 2025).
  2. Mora, C.; Dousset, B.; Caldwell, I.R.; Powell, F.E.; Geronimo, R.C.; Bielecki, C.R.; Counsell, C.W.W.; Dietrich, B.S.; Johnston, E.T.; Louis, L.V.; et al. Global risk of deadly heat. Nat. Clim. Chang. 2017, 7, 501–506. [Google Scholar] [CrossRef]
  3. Zhao, L.; Oppenheimer, M.; Zhu, Q.; Baldwin, J.W.; Ebi, K.L.; Bou-Zeid, E.; Guan, K.; Liu, X. Interactions between urban heat islands and heat waves. Environ. Res. Lett. 2018, 13, 034003. [Google Scholar] [CrossRef]
  4. Oke, T.R. The energetic basis of the urban heat island. Q. J. R. Meteorol. Soc. 1982, 108, 1–24. [Google Scholar] [CrossRef]
  5. Rizwan, A.M.; Dennis, L.Y.C.; Liu, C. A review on the generation, determination and mitigation of Urban Heat Island. J. Environ. Sci. 2008, 20, 120–128. [Google Scholar] [CrossRef]
  6. Lee, N.Y.; Cho, Y.; Lim, J.Y. Effect of Climate Change on Mortality Rate Analysis of Vulnerable Populations. Health Soc. Welf. Rev. 2014, 34, 456–484. [Google Scholar] [CrossRef]
  7. Jo, H.; Ha, J.; Lee, S. An Analysis of Urban Heat Island Effect and Spatial Distribution of the Socially Vulnerable Class in Seoul, Korea. In Proceedings of the Korean Urban Administration Association Conference, Seoul, Republic of Korea, 4 December 2015; pp. 1–15. [Google Scholar]
  8. Yeo, W.; Oh, D. Actual condition analysis and mitigation measures of the urban heat island in Busan. Busan Dev. Inst. 2013. Available online: https://data.bdi.re.kr (accessed on 28 March 2025).
  9. Korea Meteorological Administration. Heat Wave Statistics and Chart Viewer. Available online: https://data.kma.go.kr/climate/heatWave/selectHeatWaveChart.do (accessed on 28 March 2025).
  10. Gangneung Culture Center. Jungang-dong. Gangneung City Local Culture Encyclopedia. Available online: https://gangneung.grandculture.net/gangneung/toc/GC00303324 (accessed on 28 March 2025).
  11. Gangneung City. The 2nd Gangneung Smart City Master Plan (2021–2025); Gangneung City Government: Gangneung, Republic of Korea, 2021. Available online: https://smartcity.go.kr (accessed on 2 April 2025).
  12. Chae, Y.; Park, J. Current Status and Implications of Local Government Heatwave Response: Focusing on the Detailed Implementation Plan for Climate Change Adaptation; Korea Research Institute for Human Settlements (KRIHS): Sejong, Republic of Korea, 2022; pp. 22–32. Available online: https://www.krihs.re.kr/gallery.es?act=view&bid=0025&list_no=29816&mid=a10103090000 (accessed on 28 March 2025).
  13. Santamouris, M. Cooling the cities—A review of reflective and green roof mitigation technologies to fight heat island and improve comfort in urban environments. Sol. Energy 2014, 103, 682–703. [Google Scholar] [CrossRef]
  14. Lee, J.; Choi, J.; Kim, M.; Cho, Y.; Kim, J.; Cho, P. Verification of On-Site Applicability of Rainwater Road Surface Spraying for Promoting Rainwater Utilization and Analyzing the Fine Dust Reduction Effect. Sustainability 2024, 16, 8756. [Google Scholar] [CrossRef]
  15. Saaty, T.L. The Analytic Hierarchy Process: Planning, Priority Setting, Resource Allocation; McGraw-Hill: New York, NY, USA, 1980. [Google Scholar]
  16. Saaty, T.L. Decision making with the analytic hierarchy process. Int. J. Serv. Sci. 2008, 1, 83–98. [Google Scholar] [CrossRef]
  17. Ali-Toudert, F.; Mayer, H. Numerical study on the effects of aspect ratio and orientation of an urban street canyon on outdoor thermal comfort in hot and dry climate. Build. Environ. 2006, 41, 94–108. [Google Scholar] [CrossRef]
  18. Harlan, S.L.; Brazel, A.J.; Prashad, L.; Stefanov, W.L.; Larsen, L. Neighborhood microclimates and vulnerability to heat stress. Soc. Sci. Med. 2006, 63, 2847–2863. [Google Scholar] [CrossRef]
  19. Voogt, J.A.; Oke, T.R. Thermal remote sensing of urban climates. Remote Sens. Environ. 2003, 86, 370–384. [Google Scholar] [CrossRef]
  20. Blocken, B. Computational Fluid Dynamics (CFD) for urban physics: Importance, scales, possibilities, limitations and ten tips and tricks towards accurate and reliable simulations. Build. Environ. 2015, 91, 219–245. [Google Scholar] [CrossRef]
  21. Kim, J.; Lee, J.M.; Jun, H. A Study on the Effectiveness of Climate Adaptation Materials for Urban Heat Islands using Digital Twin and Computational Fluid Dynamics. J. Korean Soc. Hazard Mitig. 2024, 24, 9–17. [Google Scholar] [CrossRef]
  22. Ahn, J.; Kim, J.; Kang, J. Development of an artificial intelligence model for CFD data augmentation and improvement of thermal environment in urban areas using nature-based solutions. Urban For. Urban Green. 2025, 104, 128629. [Google Scholar] [CrossRef]
  23. Krayenhoff, E.S.; Voogt, J.A. A microscale three-dimensional urban energy balance model for studying surface temperatures. Bound. Layer Meteorol. 2007, 123, 433–461. [Google Scholar] [CrossRef]
  24. Yang, X.; Zhao, L.; Bruse, M.; Meng, Q. An integrated simulation method for building energy performance assessment in urban environments. Energy Build. 2012, 54, 243–251. [Google Scholar] [CrossRef]
  25. Toparlar, Y.; Blocken, B.; Maiheu, B.; van Heijst, G.J.F. A review on the CFD analysis of urban microclimate. Renew. Sustain. Energy Rev. 2017, 80, 1613–1640. [Google Scholar] [CrossRef]
  26. Mirzaei, P.A. Recent challenges in modeling of urban heat island. Sustain. Cities Soc. 2015, 19, 200–206. [Google Scholar] [CrossRef]
  27. Blazejczyk, K.; Epstein, Y.; Jendritzky, G.; Staiger, H.; Tinz, B. Comparison of UTCI to selected thermal indices. Int. J. Biometeorol. 2012, 56, 515–535. [Google Scholar] [CrossRef]
  28. Kántor, N.; Unger, J. The most problematic variable in the course of human-biometeorological comfort assessment—The mean radiant temperature. Cent. Eur. J. Geosci. 2011, 3, 90–100. [Google Scholar] [CrossRef]
  29. Taleghani, M.; Sailor, D.J.; Tenpierik, M.; van den Dobbelsteen, A. Thermal assessment of heat mitigation strategies: The case of Portland State University, Oregon, USA. Build. Environ. 2014, 73, 138–150. [Google Scholar] [CrossRef]
  30. Stone, B.; Hess, J.J.; Frumkin, H. Urban Form and Extreme Heat Events: Are Sprawling Cities More Vulnerable to Climate Change Than Compact Cities? Environ. Health Perspect. 2010, 118, 1425–1428. [Google Scholar] [CrossRef]
  31. Yoo, C.; Im, J.; Weng, Q.; Cho, D.; Kang, E.; Shin, Y. Diurnal urban heat risk assessment using extreme air temperatures and real-time population data in Seoul. iScience 2023, 26, 108123. [Google Scholar] [CrossRef]
  32. Nichol, J.E.; To, P.H. Temporal characteristics of thermal satellite images for urban heat stress and heat island mapping. ISPRS J. Photogramm. Remote Sens. 2012, 74, 153–162. [Google Scholar] [CrossRef]
  33. Abrar, R.; Sarkar, S.K.; Nishtha, K.T.; Talukdar, S.; Shahfahad; Rahman, A.; Islam, A.R.M.T.; Mosavi, A. Assessing the Spatial Mapping of Heat Vulnerability under Urban Heat Island (UHI) Effect in the Dhaka Metropolitan Area. Sustainability 2022, 14, 4945. [Google Scholar] [CrossRef]
  34. Sidiqui, P.; Huete, A.; Devadas, R. Spatio-temporal mapping and monitoring of urban heat island patterns over Sydney, Australia using MODIS and Landsat-8. In Proceedings of the 4th International Workshop on Earth Observation and Remote Sensing Applications (EORSA), Guangzhou, China, 4–6 July 2016; pp. 217–221. [Google Scholar] [CrossRef]
  35. Kim, J.; Kang, J. Evaluating the efficiency of fog cooling for climate change adaptation in vulnerable groups: A case study of Daegu Metropolitan City. Build. Environ. 2022, 217, 109120. [Google Scholar] [CrossRef]
  36. Diem, P.K.; Diem, N.K.; Nguyen, C.T.; Diep, N.T.H. Urbanisation and Urban Heat Island in a Mekong Delta City: From Monitoring to Dominant Factors. In Climate Change and Cooling Cities; Cheshmehzangi, A., He, B.-J., Sharifi, A., Matzarakis, A., Eds.; Springer Nature: Gateway East, Singapore, 2023; pp. 235–248. [Google Scholar] [CrossRef]
  37. Mane, A.; Lekurwale, N.; Maidamwar, P.; Khobragade, P.; Dongre, S. Artificial Intelligence Based Heatwave Intensity Prediction Model. In Proceedings of the 2023 International Conference on IoT, Communication and Automation Technology (ICICAT), Nagpur, India, 4–5 August 2023; pp. 1–5. [Google Scholar] [CrossRef]
  38. Buscail, C.; Upegui, E.; Viel, J.-F. Mapping heatwave health risk at the community level for public health action. Int. J. Health Geogr. 2012, 11, 38. [Google Scholar] [CrossRef]
  39. Chen, L.; Ng, E. Outdoor thermal comfort and outdoor activities: A review of research in the past decade. Cities 2012, 29, 118–125. [Google Scholar] [CrossRef]
  40. Huo, H.; Chen, F. A Study of Simulation of the Urban Space 3D Temperature Field at a Community Scale Based on High-Resolution Remote Sensing and CFD. Remote Sens. 2022, 14, 3174. [Google Scholar] [CrossRef]
  41. Cocci Grifoni, R.; Caprari, G.; Marchesani, G.E. Combinative Study of Urban Heat Island in Ascoli Piceno City with Remote Sensing and CFD Simulation—Climate Change and Urban Health Resilience—CCUHRE Project. Sustainability 2022, 14, 688. [Google Scholar] [CrossRef]
  42. Korea Meteorological Administration. Gangwon Gangneung: Climate Change Scenario Report. Available online: http://www.climate.go.kr/home/cc_data/scenario_web_report/Gangwon_Gangneung.pdf (accessed on 28 March 2025).
  43. Jusuf, S.K.; Wong, N.H.; Hagen, E.; Anggoro, R.; Hong, Y. The influence of land use on the urban heat island in Singapore. Habitat. Int. 2007, 31, 232–242. [Google Scholar] [CrossRef]
  44. Kim, Y.H.; Baik, J.J. Spatial and Temporal Structure of the Urban Heat Island in Seoul. J. Appl. Meteorol. 2005, 44, 591–605. [Google Scholar] [CrossRef]
  45. Google Earth. Gangneung Jungang-dong, South Korea [Satellite Image]. 2025. Available online: https://earth.google.com/ (accessed on 21 March 2025).
  46. Siemens Digital Industries Software. Simcenter STAR-CCM+. Available online: https://plm.sw.siemens.com/ko-KR/simcenter/fluids-thermal-simulation/star-ccm/ (accessed on 28 March 2025).
  47. Baek, S.; Kim, J.; Kang, J. Impact of green infrastructure on PM10 in port-adjacent residential complexes: A finite volume method-based computational fluid dynamics study. Sustain. Cities Soc. 2024, 115, 105815. [Google Scholar] [CrossRef]
  48. Tominaga, Y.; Mochida, A.; Yoshie, R.; Kataoka, H.; Nozu, T.; Yoshikawa, M.; Shirasawa, T. AIJ guidelines for practical applications of CFD to pedestrian wind environment around buildings. J. Wind Eng. Ind. Aerodyn. 2008, 96, 1749–1761. [Google Scholar] [CrossRef]
  49. Franke, J.; Hellsten, A.; Schlünzen, H.; Carissimo, B. The COST 732 Best Practice Guideline for CFD simulation of flows in the urban environment: A summary. Int. J. Environ. Pollut. 2011, 44, 419–427. [Google Scholar] [CrossRef]
  50. ANSYS Inc. ANSYS Fluent Theory Guide, Release 15.0; ANSYS Inc.: Canonsburg, PA, USA, 2013; Available online: https://www.ansys.com/products/fluids/ansys-fluent (accessed on 28 March 2025).
  51. Cho, H.; Lim, J. The Effect of Urban Road Vegetation on a Decrease of Road Surface Temperature. J. Korean Inst. Landsc. Archit. 2011, 39, 107–116. [Google Scholar] [CrossRef]
  52. Korea Meteorological Administration. Automatic Weather System (AWS) Data. Available online: https://data.kma.go.kr/data/grnd/selectAwsRltmList.do?pgmNo=56 (accessed on 28 March 2025).
  53. Franke, J.; Hellsten, A.; Schlünzen, H.; Carissimo, B. Best Practice Guideline for the CFD Simulation of Flows in the Urban Environment. COST Action 732. 2007. Available online: https://www.researchgate.net/publication/257762102 (accessed on 28 March 2025).
  54. Kim, J.; Jeon, J. Study on JAVA-based Automated Urban Heat Island (UHI) Simulation—A Case Study of Jeonju Hanok Village. J. Korea Acad. Ind. Coop. Soc. 2024, 25, 164–171. [Google Scholar] [CrossRef]
  55. Kim, J.; Kang, J. AI-based temperature reduction effect model of fog cooling for human thermal comfort: Climate adaptation technology. Sustain. Cities Soc. 2023, 95, 104574. [Google Scholar] [CrossRef]
  56. Di Napoli, C.; Pappenberger, F.; Cloke, H.L. Assessing heat-related health risk in Europe via the Universal Thermal Climate Index (UTCI). Int. J. Biometeorol. 2018, 62, 1155–1165. [Google Scholar] [CrossRef]
  57. Bröde, P.; Fiala, D.; Błażejczyk, K.; Holmér, I.; Jendritzky, G.; Kampmann, B.; Havenith, G.; Tinz, B. Deriving the operational procedure for the Universal Thermal Climate Index (UTCI). Int. J. Biometeorol. 2012, 56, 481–494. [Google Scholar] [CrossRef]
  58. Ramsden, J. Calculate UTCI (Universal Thermal Climate Index) in C#. Available online: https://james-ramsden.com/calculate-utci-c-code/ (accessed on 26 March 2025).
  59. Wan, M.P.; Bozonnet, E. Simulation advances with EnviBatE: A case study on urban heat island mitigation in Singapore. Build. Environ. 2024, 258, 111966. [Google Scholar] [CrossRef]
  60. Emmanuel, R. An Urban Approach To Climate-Sensitive Design: Strategies for the Tropics; Routledge: London, UK, 2005. [Google Scholar]
  61. Okeil, A. A holistic approach to energy efficient building forms. Energy Build. 2010, 42, 1437–1444. [Google Scholar] [CrossRef]
  62. Li, Y.; Schubert, S.; Kropp, J.P.; Rybski, D. On the influence of density and morphology on the Urban Heat Island intensity. Nat. Commun. 2020, 11, 2647. [Google Scholar] [CrossRef]
  63. Xu, D.; Wang, Y.; Zhou, D.; Wang, Y.; Zhang, Q.; Yang, Y. Influences of urban spatial factors on surface urban heat island effect and its spatial heterogeneity: A case study of Xi’an. Build. Environ. 2024, 248, 111072. [Google Scholar] [CrossRef]
  64. Bröde, P.; Krüger, E.L.; Rossi, F.A. Assessment of urban outdoor thermal comfort by the Universal Thermal Climate Index (UTCI). In Proceedings of the 14th International Conference on Environmental Ergonomics, Nafplio, Greece, 7–12 July 2011; pp. 338–341. Available online: https://www.researchgate.net/publication/322991510 (accessed on 28 March 2025).
  65. Ibrahim, S.H.; Ibrahim, N.I.A.; Wahid, J.; Goh, N.A.; Koesmeri, D.R.A.; Nawi, M.N.M. The impact of road pavement on Urban Heat Island (UHI) phenomenon. Int. J. Technol. 2018, 9, 1597–1608. [Google Scholar] [CrossRef]
  66. Druckenmiller, H. Urban Heat Islands 101. Resources for the Future. 2023. Available online: https://www.rff.org/publications/explainers/urban-heat-islands-101/ (accessed on 28 March 2025).
  67. Wonorahardjo, S.; Sutjahja, I.M.; Mardiyati, Y.; Andoni, H.; Thomas, D.; Achsani, R.A.; Steven, S. Characterising thermal behaviour of buildings and its effect on urban heat island in tropical areas. Int. J. Energy Environ. Eng. 2020, 11, 129–142. [Google Scholar] [CrossRef]
  68. Moonen, P.; Defraeye, T.; Dorer, V.; Blocken, B.; Carmeliet, J. Urban physics: Effect of the micro-climate on comfort, health and energy demand. Front. Archit. Res. 2012, 1, 197–228. [Google Scholar] [CrossRef]
  69. Kang, J.E.; Lee, M.J. Assessment of flood vulnerability to climate change using fuzzy model and GIS in Seoul. J. Korean Assoc. Geogr. Inf. Stud. 2012, 15, 119–136. [Google Scholar] [CrossRef]
  70. Kim, K.; Park, B.; Heo, J.; Kang, J.; Lee, I. Assessment of heat wave vulnerability in Busan using the IPCC climate change vulnerability assessment framework. Korea Spat. Plan. Rev. 2020, 104, 23–38. [Google Scholar] [CrossRef]
  71. Kang, M.; Kim, H. Prediction of heat wave based on LSTM considering urban-social characteristics of Busan. Korea Spat. Plan. Rev. 2021, 109, 23–36. [Google Scholar] [CrossRef]
  72. Sidiqui, P.; Roös, P.B.; Herron, M.; Jones, D.S.; Duncan, E.; Jalali, A.; Allam, Z.; Roberts, B.J.; Schmidt, A.; Tariq, M.A.U.R.; et al. Urban heat island vulnerability mapping using advanced GIS data and tools. J. Earth Syst. Sci. 2022, 131, 266. [Google Scholar] [CrossRef]
  73. Back, Y.; Kumar, P.; Bach, P.M.; Rauch, W.; Kleidorfer, M. Integrating CFD-GIS modelling to refine urban heat and thermal comfort assessment. Sci. Total Environ. 2023, 859, 159729. [Google Scholar] [CrossRef] [PubMed]
  74. Li, D.; Bou-Zeid, E.; Oppenheimer, M. The effectiveness of cool and green roofs as urban heat island mitigation strategies. Environ. Res. Lett. 2014, 9, 055002. [Google Scholar] [CrossRef]
Figure 1. Study site: (a) Gangneung-City, (b) Jungang-dong (Google Earth, 2025) [45].
Climate 13 00113 g001
Figure 2. Wind rose diagram of predominant wind direction in Jungang-dong (June–August, 2024).
Climate 13 00113 g002
Figure 3. Hourly variation in simulated surface temperature in Jungang-dong (6:00–18:00).
Climate 13 00113 g003
Figure 4. Hourly variation in simulated UTCI values in Jungang-dong (6:00–18:00).
Climate 13 00113 g004
Figure 5. Validation of CFD simulation: (a) temporal comparison between input temperature and simulation outputs; (b) correlation (R2) between input temperature and simulation outputs.
Climate 13 00113 g005
Figure 6. Spatial characteristics and visual documentation of heat wave-vulnerable hotspots in Jungang-dong.
Climate 13 00113 g006
Table 1. AWS-based hourly meteorological data for CFD boundary conditions.
TimeTemperature (°C)Humidity (%)Wind Direction (°)Wind Speed (m/s)
06:0025.995239.51.2
07:0027.7912491.6
08:002987258.60.9
09:0031.973133.21.3
10:0032.86774.12.5
11:0035.751238.73.8
12:003644224.74.5
13:0036.747199.64.5
14:0036.846208.65
15:0035.948208.45.7
16:0034.355248.15.7
17:0035.452248.42
18:0034.652212.53.5
Table 2. Mesh size settings by component in the CFD simulation.
Default ControlsBuildingGreenRoadSideSky
Base Size20.0 m
Target
Surface Size
20.0 m2.0 m2.0 m2.0 m200.0 m200.0 m
Minimum
Surface Size
2.0 m1.0 m1.0 m1.0 m20.0 m20.0 m
Prism Layer Total Thickness2.0 m 0.4 m0.4 m
Table 3. Classification of thermal stress levels based on UTCI range.
UTCI Range (°C)Stress Category
>46Extreme Heat Stress
38 to 46Very Strong Heat Stress
32 to 38Strong Heat Stress
26 to 32Moderate Heat Stress
9 to 26No Thermal Stress
0 to 9Slight Cold Stress
−13 to 0Moderate Cold Stress
−27 to 13Strong Cold Stress
−40 to 27Very Strong Cold Stress
<−40Extreme Cold Stress
Disclaimer/Publisher’s Note: The statements, opinions and data contained in all publications are solely those of the individual author(s) and contributor(s) and not of MDPI and/or the editor(s). MDPI and/or the editor(s) disclaim responsibility for any injury to people or property resulting from any ideas, methods, instructions or products referred to in the content.

