Article

Semi-Annual Climate Modes in the Western Hemisphere

1
Physics Department, University of Puerto Rico Mayagüez, Mayagüez, PR 00681, USA
2
Geography Department, University of Zululand, KwaDlangezwa 3886, South Africa
Climate 2025, 13(6), 111; https://doi.org/10.3390/cli13060111
Submission received: 14 October 2024 / Revised: 7 May 2025 / Accepted: 24 May 2025 / Published: 27 May 2025

Abstract

:
Semi-annual climate oscillations in the Western Hemisphere (20 S–35 N, 150 W–20 E) were studied via empirical orthogonal function (EOF) eigenvector loading patterns and principal component time scores from 1980 to 2023. The spatial loading maximum for 850 hPa zonal wind extended from the north Atlantic to the east Pacific; channeling was evident over the southwestern Caribbean. The eigenvector loading maximum for precipitation reflected an equatorial trough, while the semi-annual SST formed a dipole with loading maxima in upwelling zones off Angola (10 E) and Peru (80 W). Weakened Caribbean trade winds and strengthened tropical convection correlated with a warm Atlantic/cool Pacific pattern (R = 0.46). Wavelet spectral analysis of principal component time scores found a persistent 6-month rhythm disrupted only by major El Nino Southern Oscillation events and anomalous mid-latitude conditions associated with negative-phase Arctic Oscillation. Historical climatologies revealed that 6-month cycles of wind, precipitation, and sea temperature were tightly coupled in the Western Hemisphere by heat surplus in the equatorial ocean diffused by meridional overturning Hadley cells. External forcing emerged in early 2010 when warm anomalies over Canada diverted the subtropical jet, suppressing subtropical trade winds and evaporative cooling and intensifying the equatorial trough across the Western Hemisphere. Climatic trends of increased jet-stream instability suggest that the semi-annual amplitude may grow over time.

1. Introduction

The seasonal cycle of Earth’s climate is driven by the annual march of solar insolation [1,2], which is governed by the axial tilt of the planet and its orbit around the sun. This cyclical variation in incident solar radiation modulates the energy balance on the surface and within the atmosphere, giving rise to seasonal changes in temperature, precipitation, and circulation. These changes, in turn, regulate critical components of the Earth system, including hydrological outcomes, agricultural productivity, human health, tourism patterns, ecosystem functioning, and extreme weather phenomena [3].
Across much of the globe, the climatic response to seasonal forcing manifests as a unimodal summer–winter alternation, reflecting the dominant annual harmonic of temperature and circulation. However, semi-annual (6-month) oscillations—characterized by two peaks and troughs per year—are also evident in several zones, including the following:
(i)
Equatorial convection patterns, which exhibit bi-annual maxima associated with solar zenith passages [4];
(ii)
The symmetry of Hadley cell circulations, which reorganize around equinoctial solar forcing [5,6];
(iii)
Phase lags in the upper-ocean thermal response, where oceanic mixed layers adjust to surface fluxes with delays governed by depth and stratification [7];
(iv)
Coupled variations in solar radiation, air–sea fluxes, and mixed-layer depth, particularly in equatorial regions [8];
(v)
Bifurcation of subtropical jet streams and formation of cutoff lows, which are linked to spring and autumn peaks in baroclinic instability [9].
Seasonality is further modulated by thermocline oscillations, zonal planetary waves, and land–sea thermal contrasts [10,11], that enable seasonal prediction and climate diagnostics. The semi-annual components are frequently masked or subsumed in the annual cycle, resulting in uncertainty in attribution and challenges in isolating their specific physical drivers [12,13,14].
In the Western Hemisphere, notable features such as the cold tongues of the equatorial Atlantic and eastern Pacific dominate the climatological backdrop. These regions of persistent upwelling and reduced sea surface temperature arise from the action of easterly trade winds and Ekman divergence. The meridional energy imbalance—a result of a net solar energy surplus in the tropics—is redistributed poleward through an integrated system involving western boundary currents, Ekman transport, and Hadley cell overturning circulation. These processes create ascending motions near the equator and descending motions in the subtropics, with opposing consequences for the ocean and atmosphere.
The interplay of momentum and thermal energy in these circulations sustains the equatorial trough, a low-pressure zone that migrates seasonally with the solar declination [15]. Importantly, the equatorial cold tongues exert a flattening effect on the meridional temperature gradient, suppressing deep convection and introducing global asymmetries in atmospheric circulation. This can lead to bifurcation of mid-latitude jet streams and preferential formation of cutoff lows [16].
This study placed a specific focus on the semi-annual cycle, aiming to elucidate its physical structure, variability, and climatic implications across the Western Hemisphere. Utilizing statistical cluster analysis of gridded climate datasets (1980–2023), we aimed to identify regions and variables exhibiting a coherent 6-month rhythm. Key scientific questions included the following:
Persistence: how stable and temporally consistent are semi-annual oscillations across different atmospheric and oceanic variables?
Spatial distribution: where is the kinematic and thermal amplitude of the semi-annual cycle greatest?
Coupling and phase relationships: do 6-month oscillations in wind fields, deep convection, and sea surface temperature occur synchronously, or do they exhibit temporal lags?
Forcing mechanisms: can the internal and external forcing of the semi-annual cycle be distinguished?
Climatic impacts: what are the hydro-meteorologic consequences of semi-annual variability?
By advancing our understanding of semi-annual oscillations, this work seeks to clarify an often-overlooked dimension of Earth’s climate system and to improve our capacity to predict seasonal variability and conceptually understand this phenomenon.

2. Data and Methods

The climate of the Western Hemisphere, encompassing the subtropical Atlantic and east Pacific (20 S–35 N, 150 W–20 E) during the period from 1980 to 2023, was described via monthly MERRA v2 reanalysis [17] of winds, relative humidity, and vertical motion; by NASA GPCP precipitation [18]; and by Hadley Centre sea surface temperature (SST) [19]. The monthly fields of 850 hPa zonal (U) wind, precipitation, and SST were standardized (by subtracting the overall mean and dividing by the standard deviation) and subjected to empirical orthogonal function (EOF) analysis using a Climate Explorer subroutine. This preserved seasonality and normalized the outputs, making them unitless and comparable. The leading eigenvector loadings and principal component (PC) time scores were calculated. After screening for semi-annual spectral energy, only those with dominant 6-month oscillations were retained: (i) U850 wind (PC2) (12.3% of variance), (ii) precipitation (PC3) (5.4% of variance), and (iii) SST (PC4) (2.3% of variance). The spatial patterns and temporal characteristics were evaluated for semi-annual climatology, lag correlation, and teleconnections with numerous climate indices. Significant correlations were only found with the Arctic Oscillation (AO) [20] and El Nino Southern Oscillation (Nino3) from 1980 to 2023, and they are reported. The 528-month record generated ~40 degrees of freedom due to persistence, which was quantified by PC time score lag auto-correlations. Hence, the threshold for 90% confidence required R > |0.26|.
The median annual cycle of the PC time scores was calculated, and the 6-month amplitude was evaluated via wavelet spectral power. Following the identification of the semi-annual modes, the methodology proceeded to the background processes underpinning them via meridional sections (20 S–35 N) of the tropospheric circulation and humidity. The upper-ocean net heat balance, mixed-layer depth, and salinity were also reanalyzed via the GODAS [21]. Western Hemisphere mean annual Hovmoller plots were calculated to reanalyze net solar radiation and 850 hPa zonal wind, and satellite precipitation and SST were calculated to reveal the north–south march. To examine inter-annual variability, the U850 wind (PC2), precipitation (PC3), and SST (PC4) time scores were filtered for cycles > 18 months and their wavelet spectral power was calculated. Within the filtered inter-annual PC time series ‘residuals’, multi-year spells of high amplitudes were evaluated for phase relationships. The case of Mar–May 2010 was analyzed for anomalous conditions to distinguish internal/external forcing and climatic impacts.
To better understand the coupling between semi-annual wind, precipitation, and SST, their PC scores were summed and ranked to identify the 10 most positive and negative months. Meridional circulation and salinity anomalies were composited for positive and negative phases, and zonal circulation and sea temperature differences were composited as positive minus negative. To summarize, the methodology had distinct themes: (i) semi-annual space-time characteristics, (ii) links with tropical and polar climate indices, (iii) background processes in annual cycling and spring/autumn circulations, (iv) inter-annual residuals and a case study, and (v) composites of semi-annual modes and the inferences thereof.

3. Results

3.1. Semi-Annual EOF Mode of Space-Time Character

The spatial eigenvector loading patterns of the semi-annual modes are presented in Figure 1a–c. The U850 wind (PC2) (Figure 1a) is tilted from the northeast Atlantic (30 N, 20 W) through the Caribbean to the equatorial east Pacific (10 S, 140 W). The maximum loading reflects trade wind channeling over central America (10 N, 80 W). The semi-annual precipitation (PC3) (Figure 1b) shows a broad equatorial trough (150 W–20 E), with maximum loading over the oceans: 5 N (Atlantic) and 8 N (east Pacific). Inverse loading in the subtropics (5 S and 12 N) indicates subsidence associated with Hadley cells. The SST (PC4) pattern (Figure 1c) forms an Atlantic/Pacific dipole that resembles La Nina onset [22]. The semi-annual SST loading maxima (10 S) are located near the coasts of Peru (−σ) (80 W) and Angola (+σ) (10 E). Although the sun angle should instill a zonal axis, only precipitation meets that expectation. Other eigenvector loading patterns (U850 wind and SST) deviate from the thermal equator.
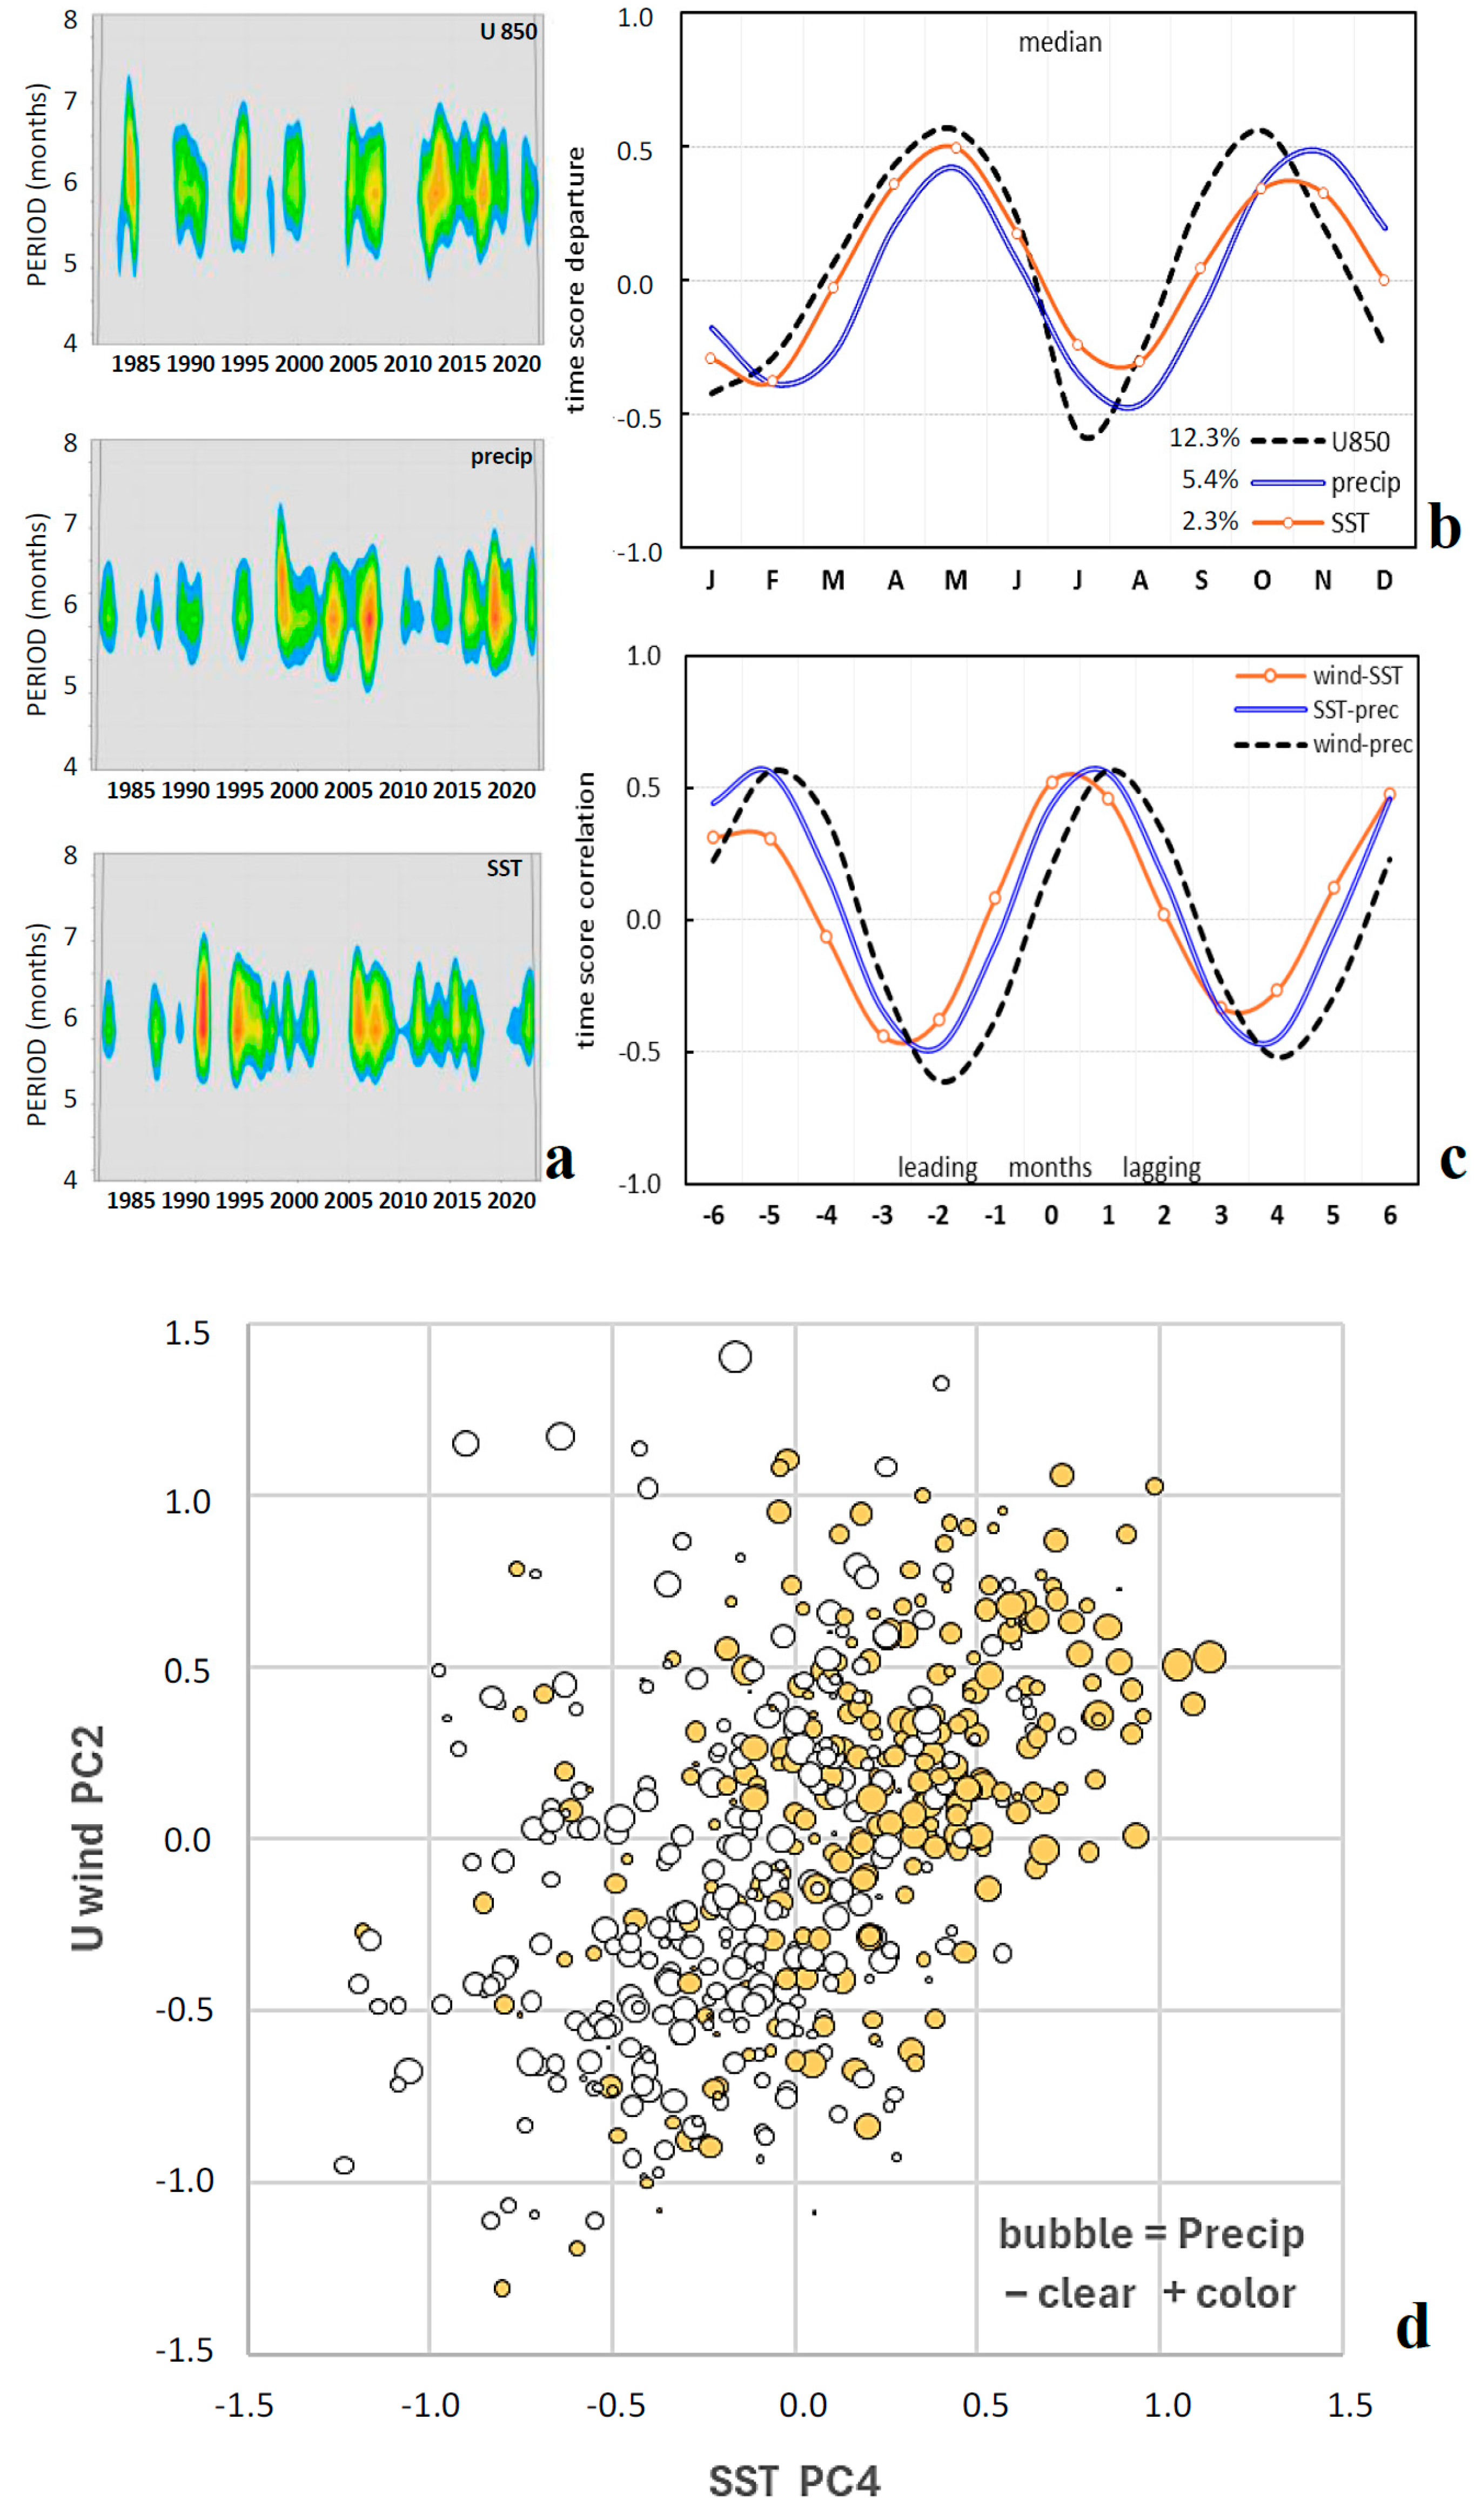
The temporal characteristics of the semi-annual modes are presented in Figure 2a–d. The wavelet spectral power (Figure 2a) reveals a persistent semi-annual rhythm. Multi-year intervals with high amplitudes are interspersed with brief spells with low amplitudes. At times, these match up with the three semi-annual modes. The median annual cycles of the PC time scores for U850 wind, precipitation, and SST are given in Figure 2b. Crests occurring every 6 months show that wind and SST are in-phase from Mar to May and slightly delayed from Sep to Nov. Semi-annual precipitation lags both the wind and SST modes by a month. The explained variance means that the amplitude for wind is ~x× and ~4× larger than those for precipitation and SST, respectively. Lag correlations (Figure 2c) reflect a cascade of wind–SST–precipitation, with R-values > 0.5 from 0 to +1 month. Seasonality is largely in-phase.
Positive interactions are favored, according to the scatterplot (Figure 2d): a warm Atlantic/a cool Pacific corresponds with weakened Caribbean airflow (R = 0.46) and strengthened equatorial convection. Underlying climatic processes include the upper-ocean response to evaporation, the SST’s influence on convective potential energy, and feedback between circulation and cloud heating. Simply stated, the SST dipole corresponds with an eastward surface air pressure gradient and intertropical convergence. Cross-correlations between the semi-annual PC time scores and global climate indices yielded significant negative values with the Arctic Oscillation and the Pacific Nino3 SST (both R = −0.4).

3.2. Background Conditions Supporting Semi-Annual Modes

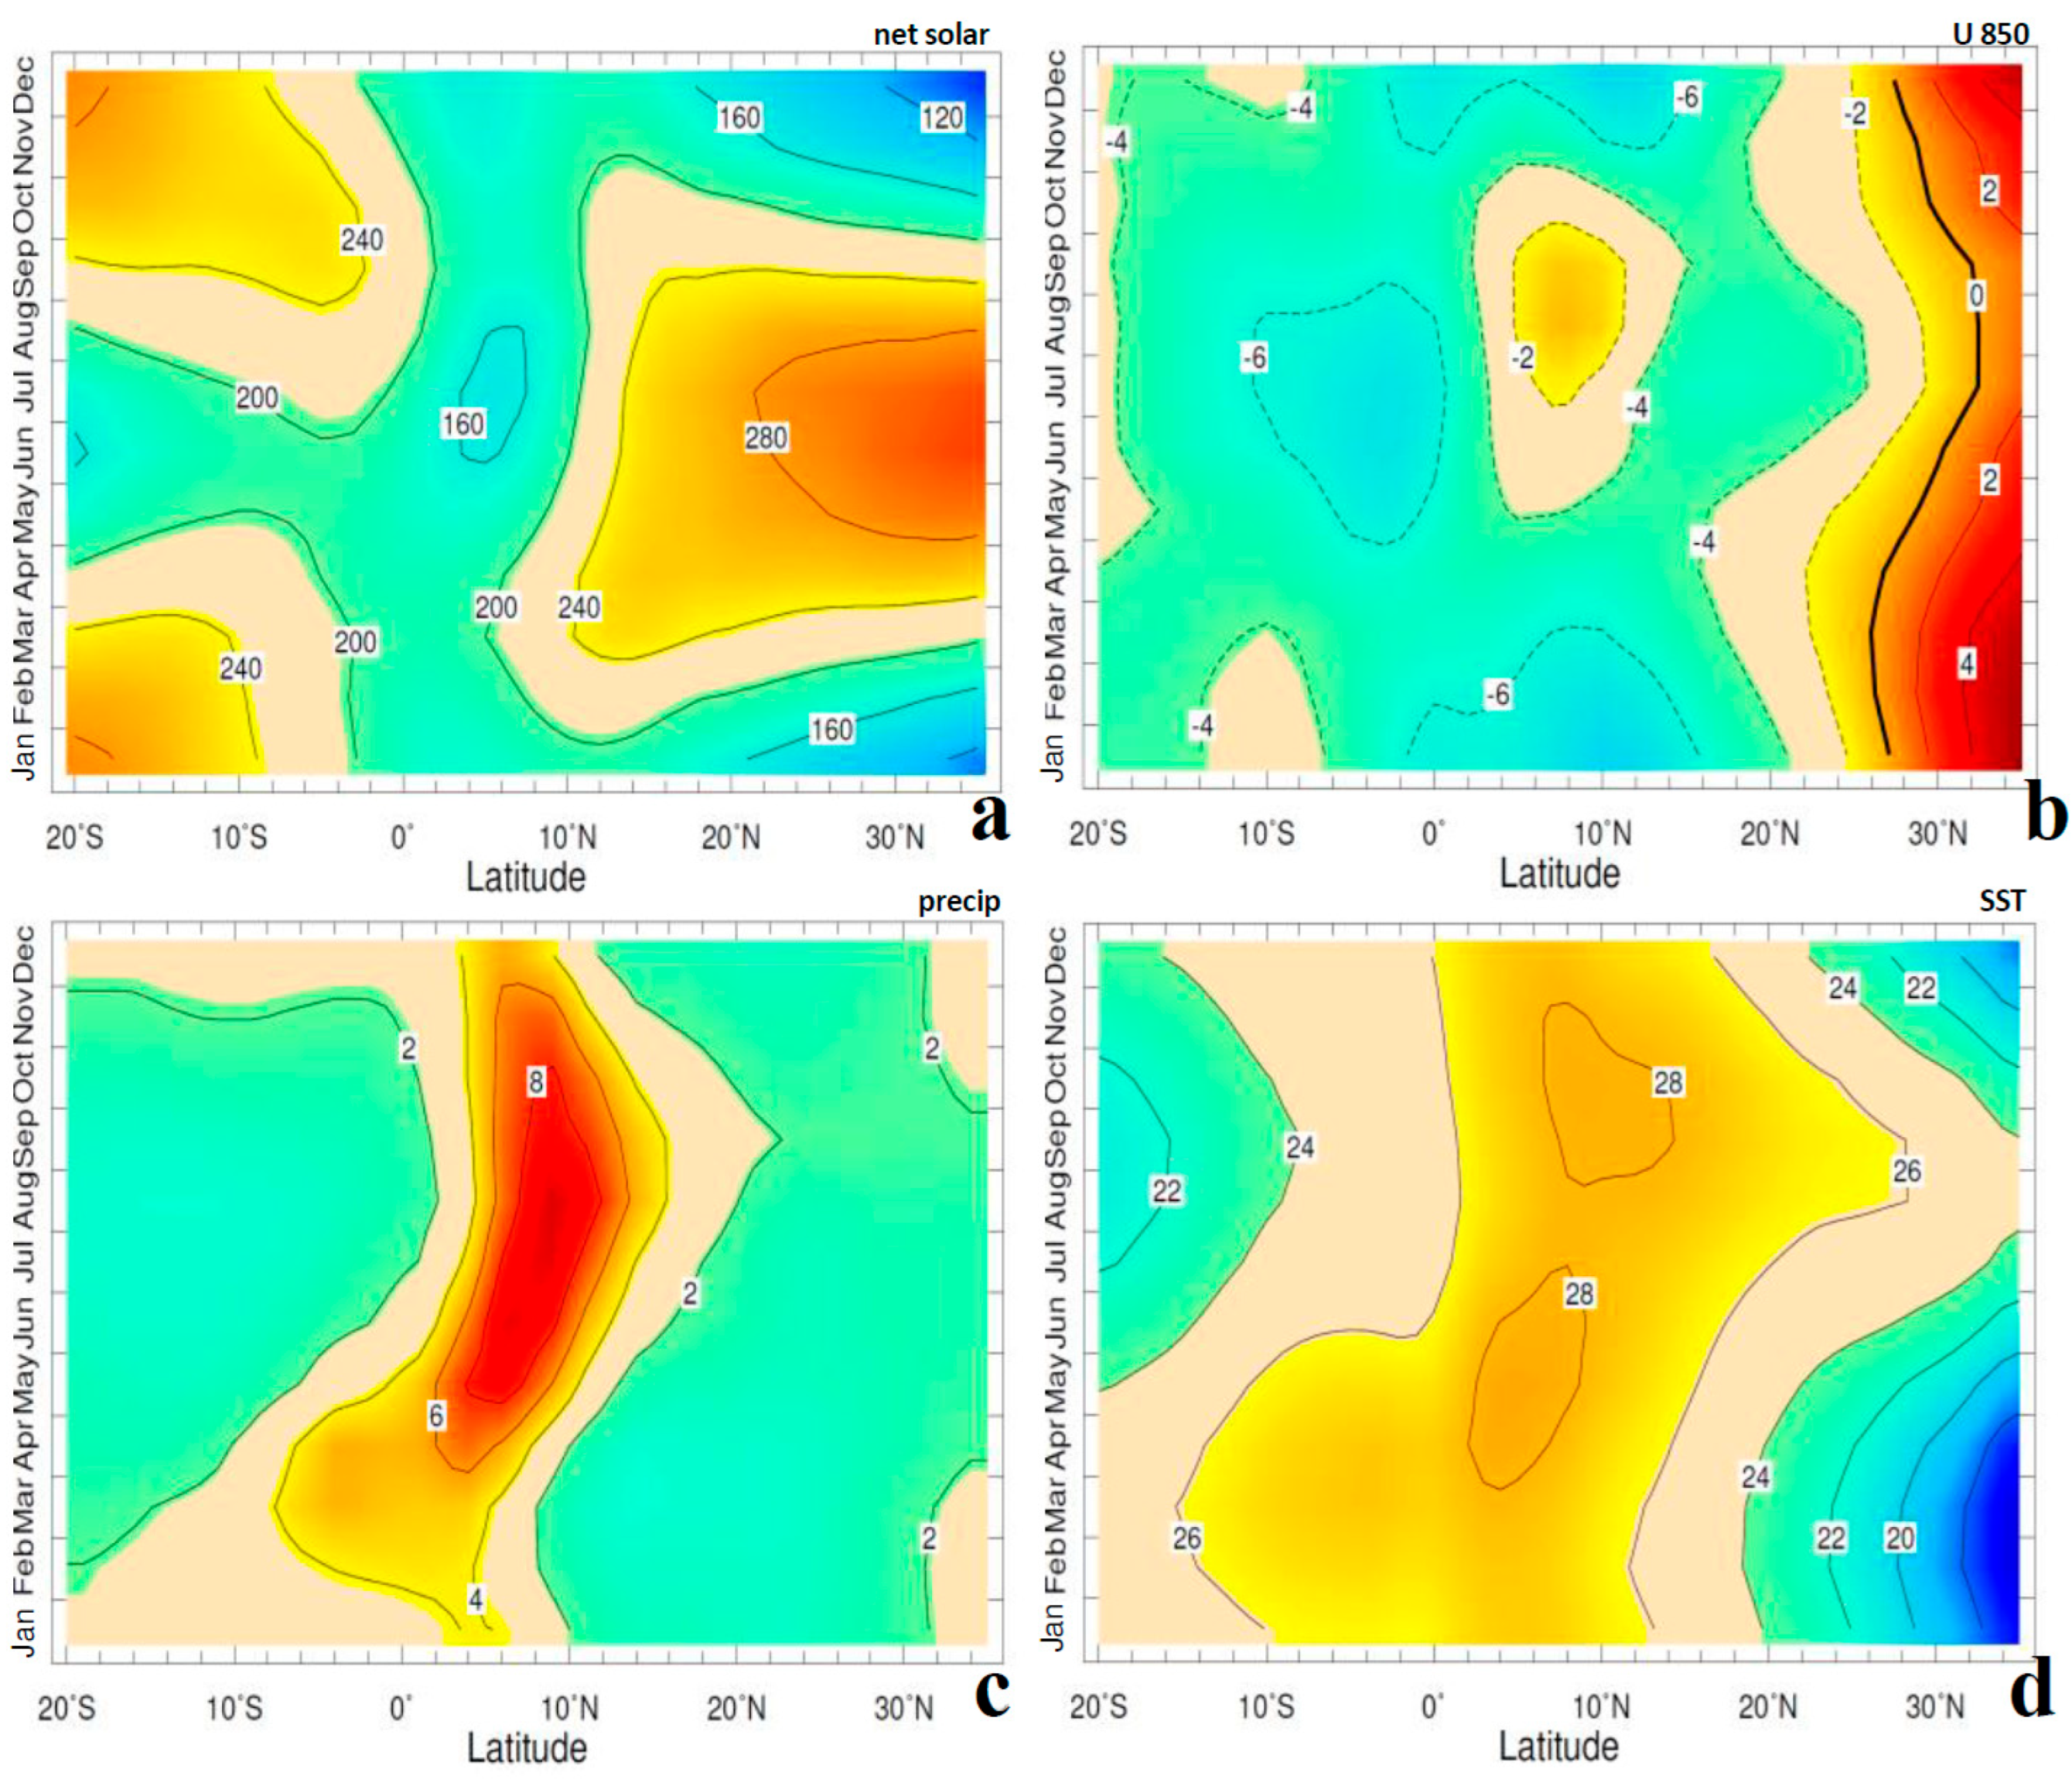
The EOF analysis and statistics suggest the semi-annual modes are coupled. To provide context, Hovmoller plots of annual cycles averaged over the Western Hemisphere are analyzed in Figure 3a–d. Unlike the static loading patterns, these evolve according to the meridional march of net solar radiation. Although 6-month pulses are subsumed in the annual cycle, high solar radiation and relaxed trade winds intrude from the subtropics in the spring and autumn transition seasons. Similarly, deep convection and warm SSTs expand away from the equator from Mar to Apr/Sep to Oct. The Hovmoller plots illustrate a semi-annual evolution that cannot be attributed to marine phase delay.
Further context for semi-annual coupling is presented in long-term average meridional sections. The ocean’s net heat balance (Figure 4a) peaks at 100 W/m2 directly on the equator and declines symmetrically to zero in the subtropics. In contrast, the average mixed-layer depth and salinity from 150 W to 20 E (Figure 4b) are offset northward (0–10 N) and characterized by shallow (−30 m) and fresh (34.5 ppt) conditions due to marine precipitation and monsoon runoff. In the subtropics, anticyclonic subsidence induces a salty upper ocean (36.0 ppt) that is prone to mixing (60 m). Surplus heat in the latitude band from 0 to 10 N dissipates toward higher latitudes via Ekman transport. We infer that semi-annual coupling is prominent between the equatorial cold tongue and the migratory intertropical convergence zone.
Meridional sections of the mean Hadley cells from Mar to May and from Sep to Nov are illustrated in Figure 4c,d. Naturally, they show twin meridional overturning rotors that are quite symmetrical from Mar to May. The upper westerlies reach 30 m/s at 25 N and 200 hPa, and equatorial humidity is lifted 2 km (800–600 hPa). From Sep to Nov, the circulation is asymmetrical: the northern Hadley cell is weaker than the southern one, and humidity is lifted 3 km (800–500 hPa) over 8 N. The Hadley cells link the semi-annual features, sustaining deep convection at low latitudes via a 925 hPa inflow and a 250 hPa outflow that extends 2000 km into the subtropics.

3.3. Characterizing the Inter-Annual Residual

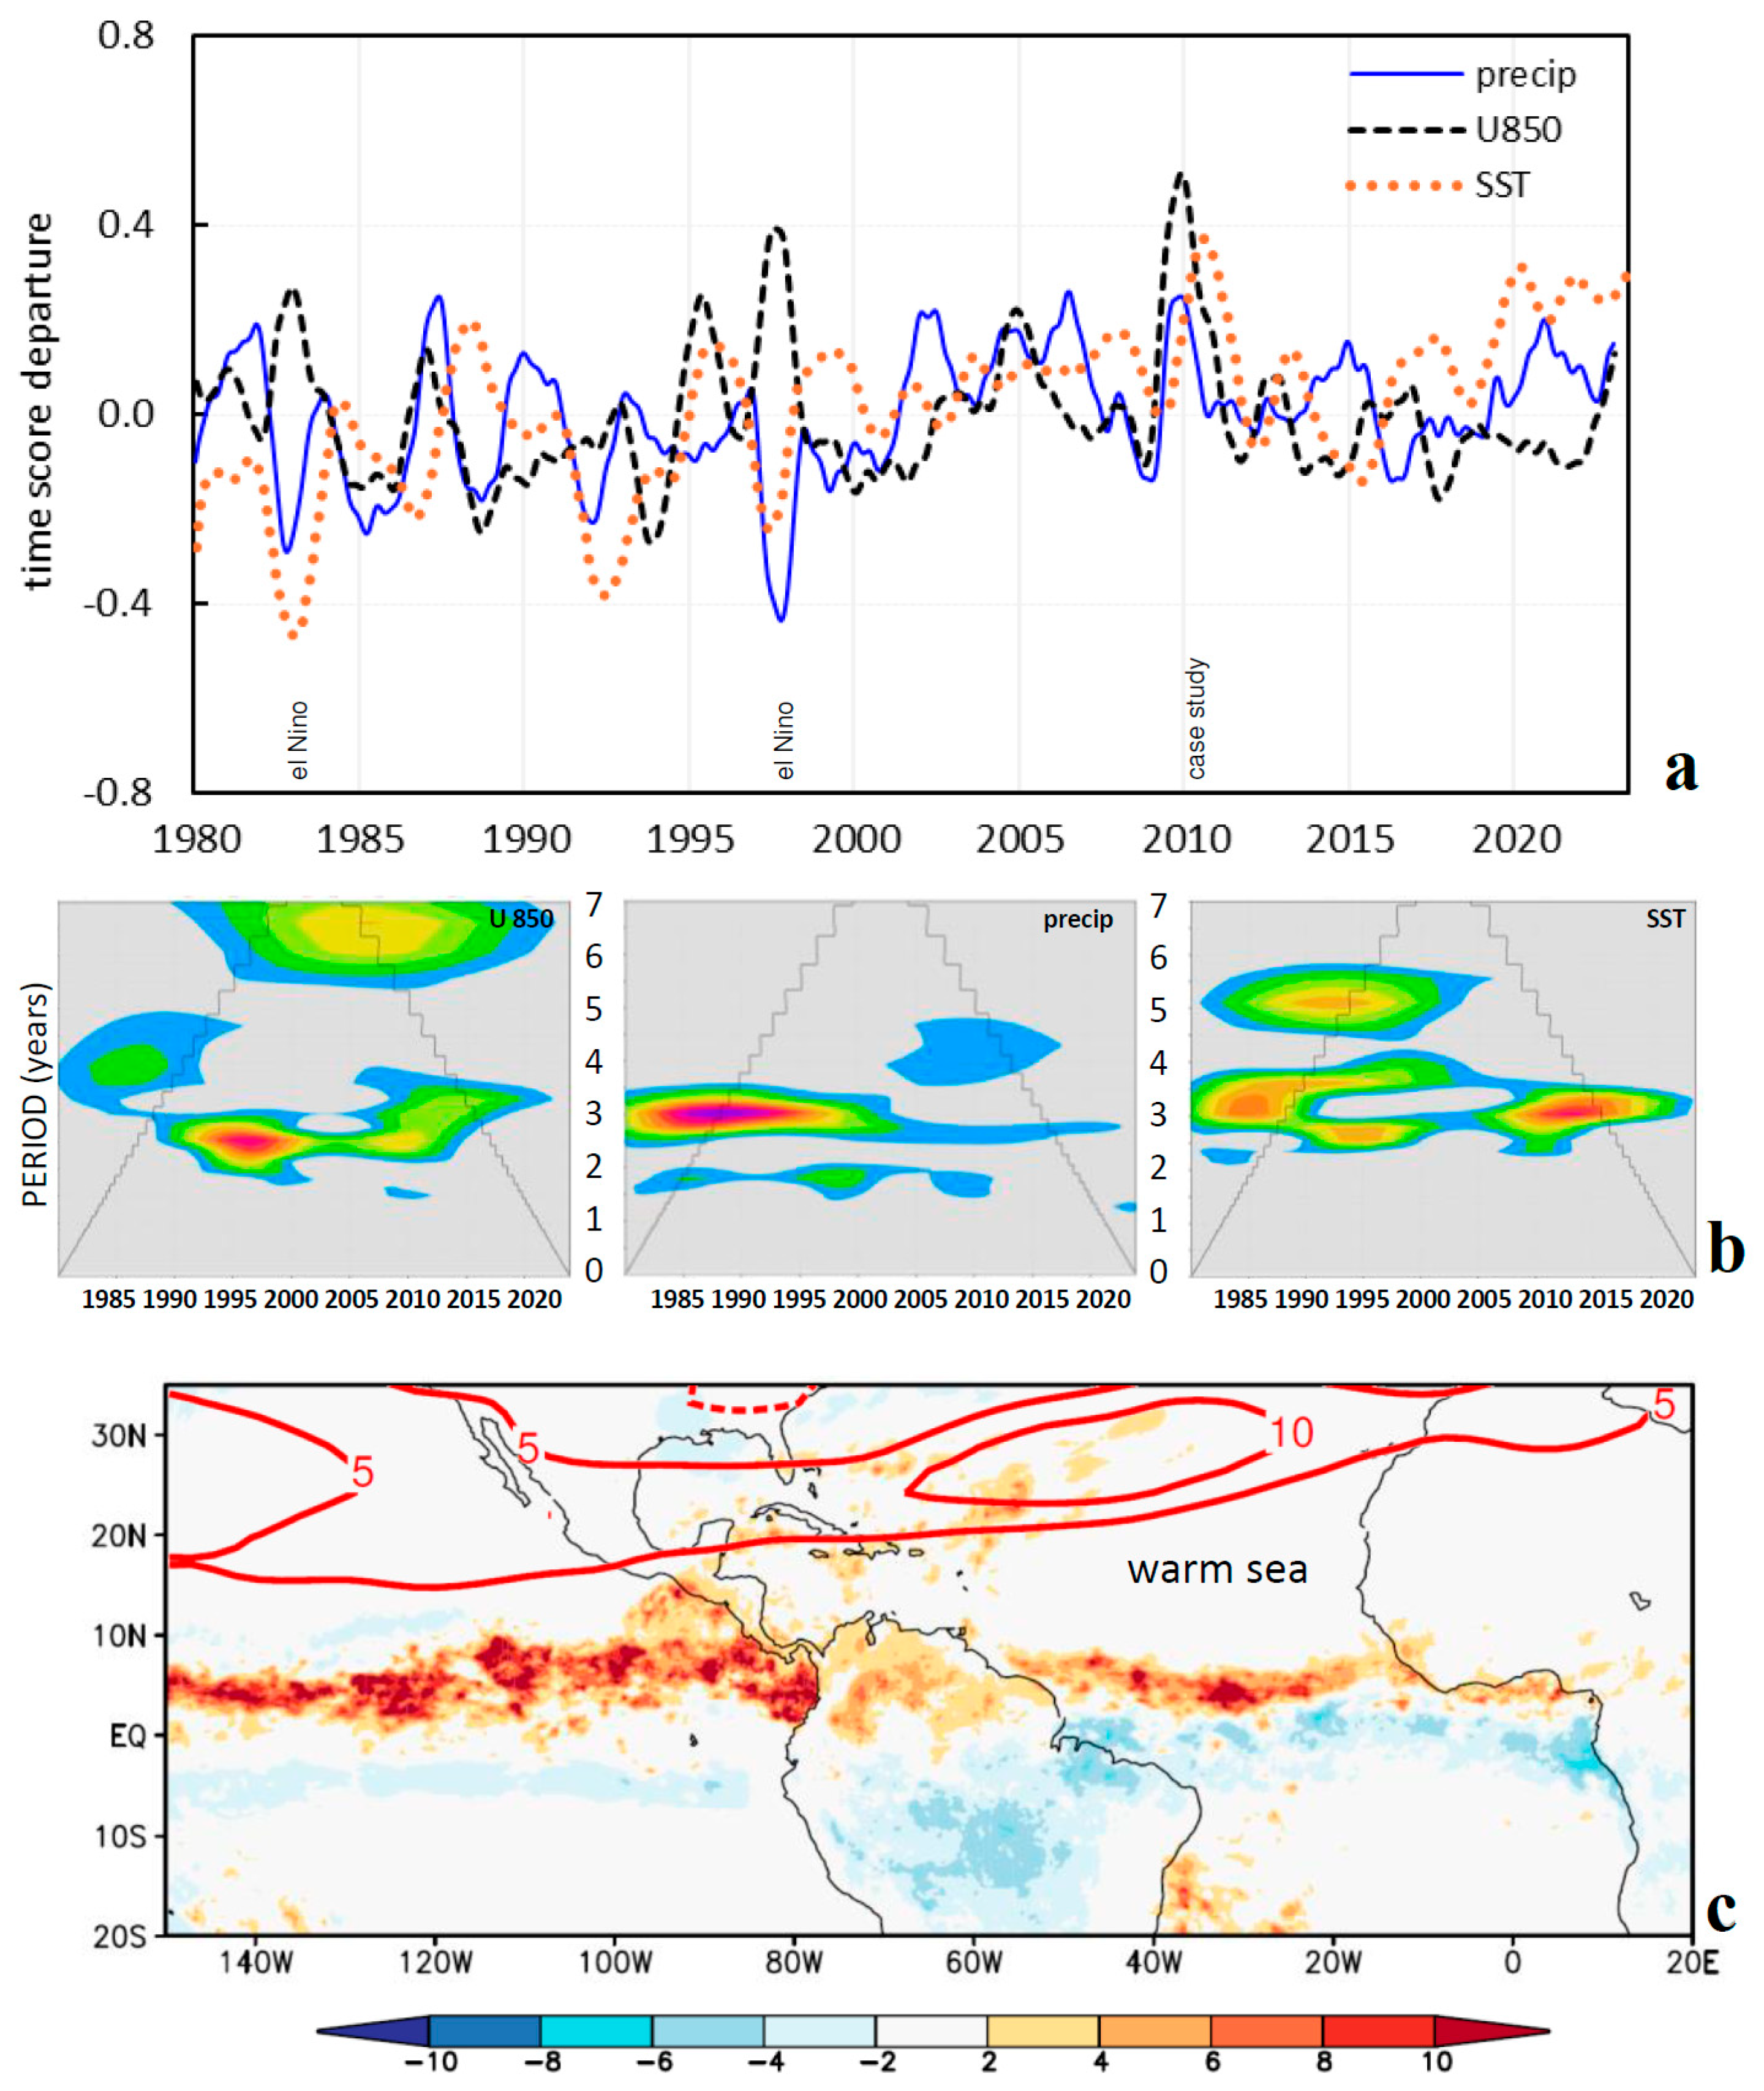
To isolate and analyze climate variability beyond the dominant cycles, temporal data were subjected to an 18-month low-pass filter. The PC time scores and corresponding wavelet spectral energy are presented in Figure 5a,b.
The inter-annual variability is characterized by oscillations with periods in the range of 3–4 years, which are statistically significant in the wavelet spectrum. These signals are consistent with the known effects of Pacific Ocean variability, particularly baroclinic Rossby waves [10], which propagate westward across the basin. These planetary-scale waves perturb the thermocline, introducing zonal tilt and vertical displacement that modulate sea surface temperatures (SSTs), the ocean heat content, and atmospheric convection patterns over inter-annual timescales.
In addition to the primary 3–4-year signal, secondary spectral peaks were detected: SST anomalies exhibit a ~5-year periodicity, and wind anomalies (U850) show oscillatory behavior on a 6–7-year timescale. These secondary modes reflect inter-decadal ocean–atmosphere coupling.
The 3–4-year inter-annual signal is modulated by ENSO cycling involving (i) an SST dipole across the tropical Pacific, (ii) altered equatorial convection, and (iii) relaxation of Caribbean trade winds (+U850 departures). These responses shift the Walker circulation and redistribute tropical convection. The period from 2015 to 2016 showed incoherent atmosphere–oceanic coupling between the semi-annual modes, likely due to the zonal circulation prevailing over the meridional overturning.
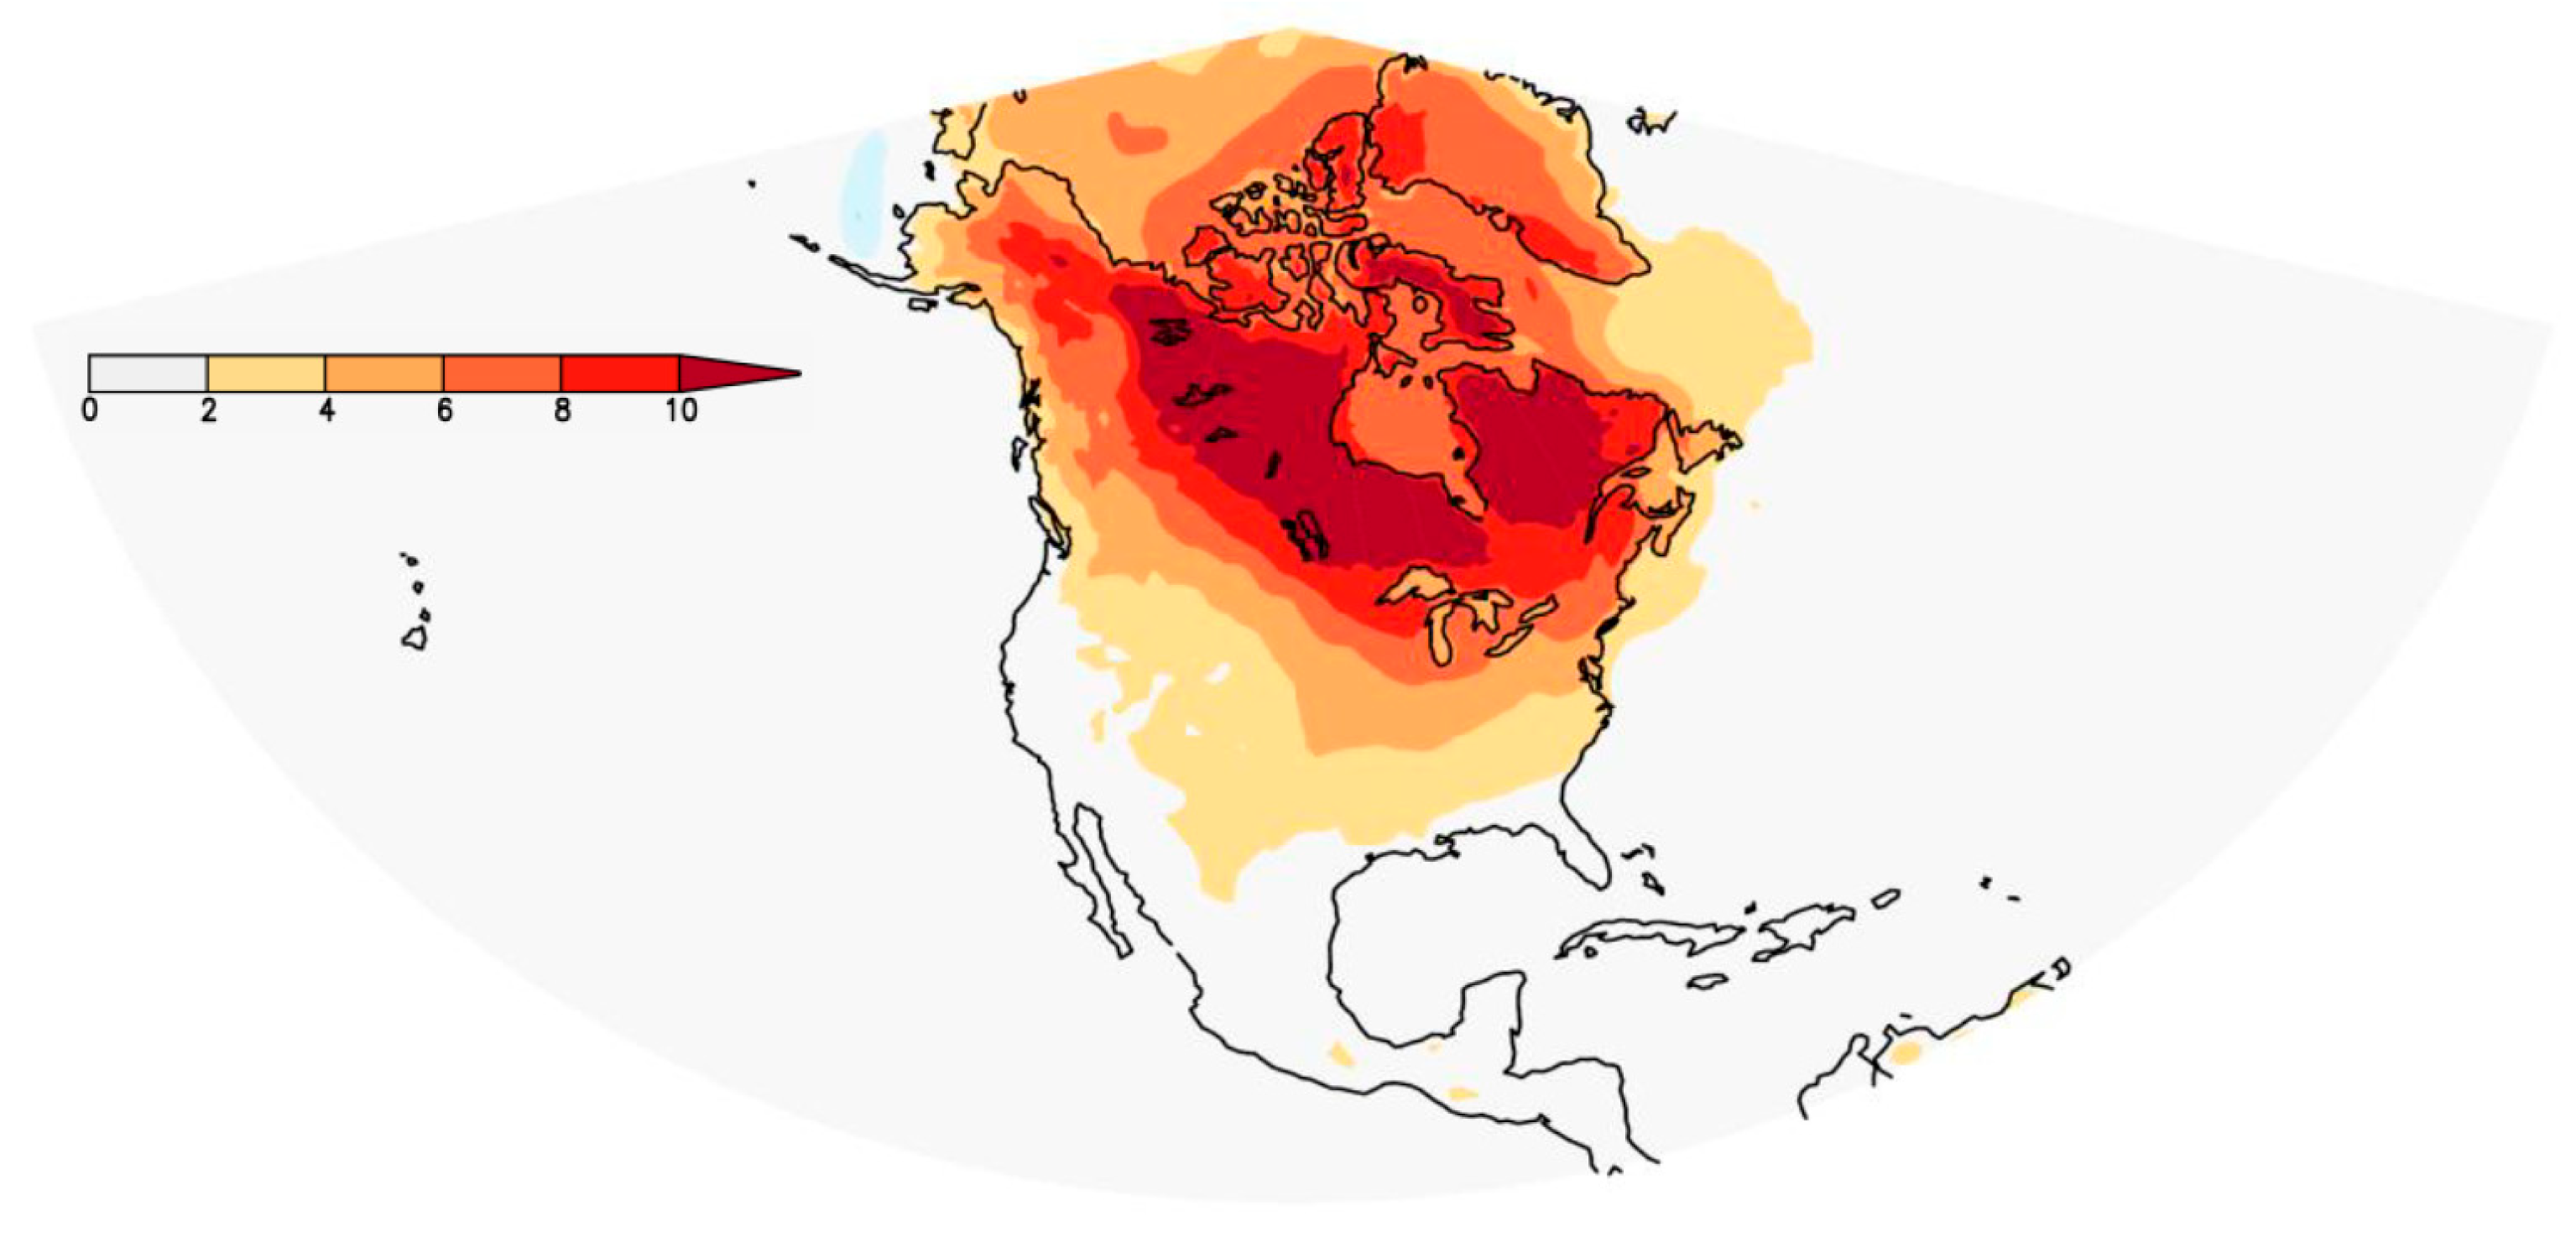
The 2010 event was conspicuous, as all semi-annual EOF time scores reached their peak values from Mar to May. Equatorial precipitation anomalies of +10 mm/day spread across the Western Hemisphere (Figure 5c) in conjunction with a warmer east Atlantic. Anomalous warm temperatures over Canada (cf. Appendix A) [23] and negative-phase Arctic Oscillation coincided with a shift in upper westerly winds from subpolar to subtropical latitudes. This represented external forcing of the semi-annual climate that was distinct from the internal forcing seen in the 1983 and 1998 El Nino events.

3.4. Composite Anomalies and Inferences

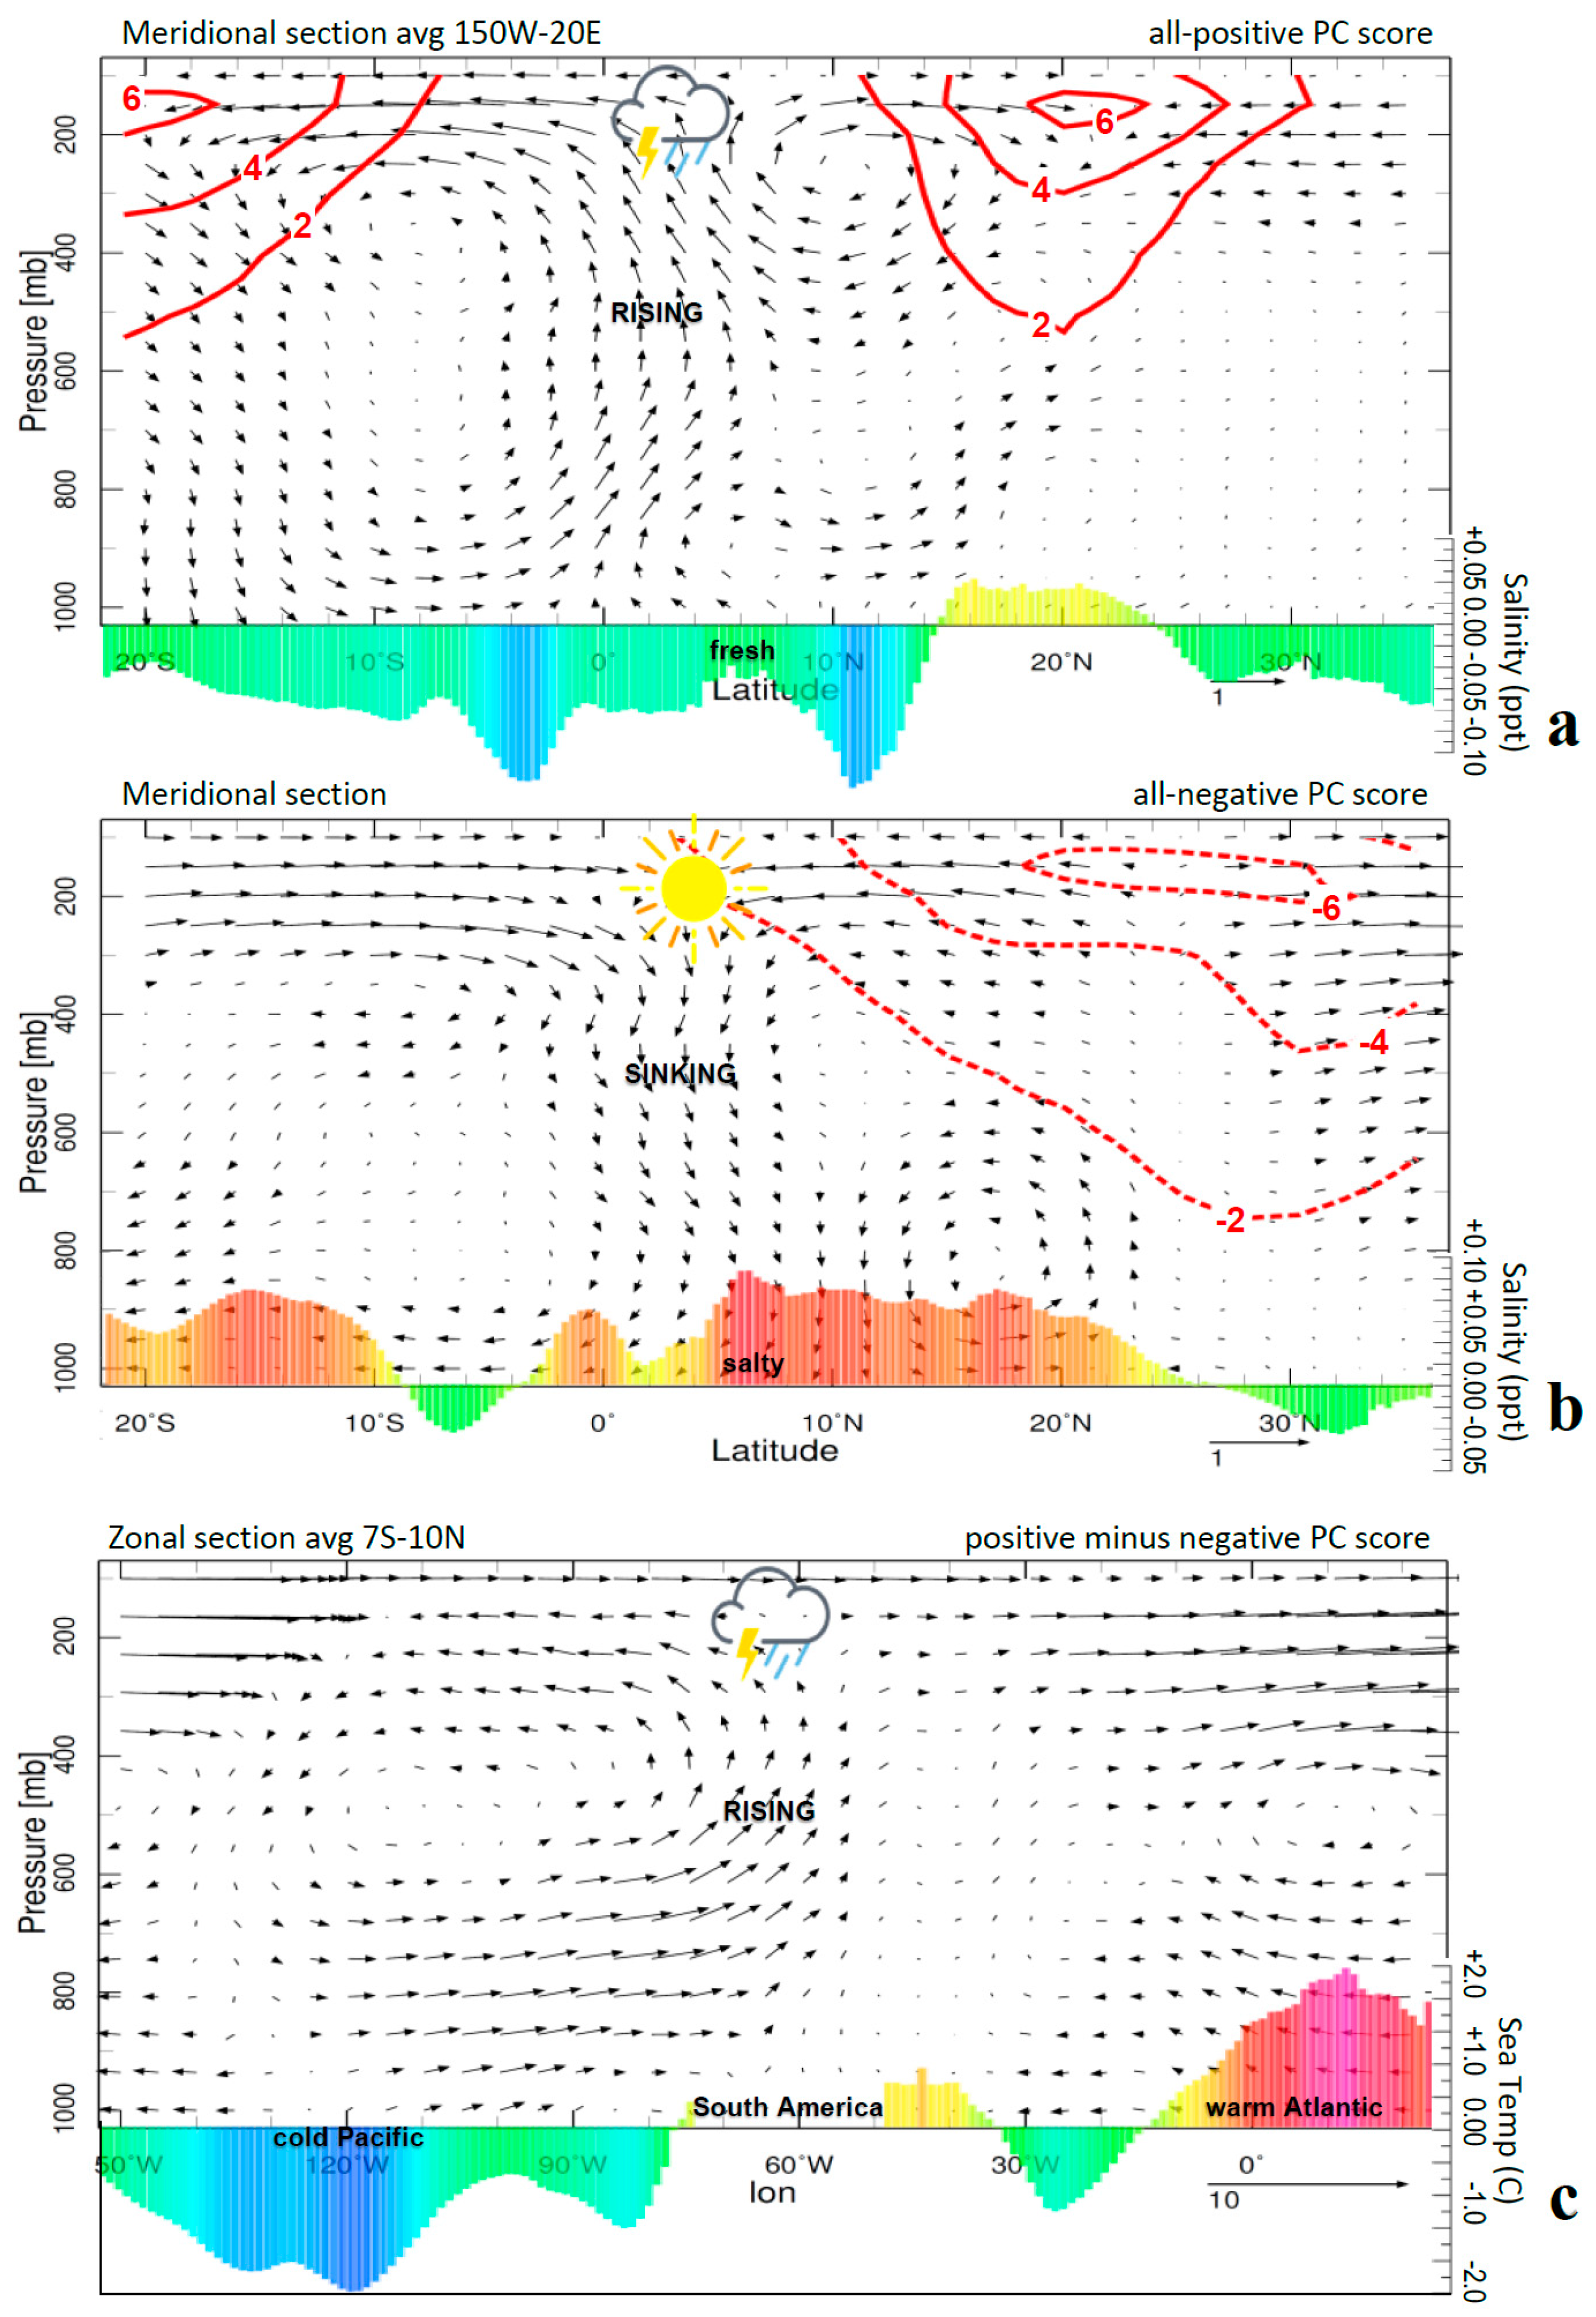
The summed and ranked PC scores identified the 10 most positive and negative months of semi-annual oscillation across the Western Hemisphere. They are composited in Figure 6a,b to illustrate meridional climate anomalies. During the positive phase, there is a widespread rising motion over the equatorial zone (3 S–7 N) supported by the meridional Hadley cells (mainly the southern cell). The subtropical jets are strengthened (+6 m/s at 20 S and 20 N), and the tropical upper ocean is fresh due to enhanced precipitation and runoff. During the negative phase, there is a sinking motion over the equatorial zone (0–7 N) and a weakened northern subtropical jet (−6 m/s from 20 to 30 N). The upper ocean is salty from 20 S to 20 N due to suppressed moist convection. Differences in zonal circulation and upper-ocean temperature are presented in Figure 6c as a positive minus negative composite averaged for 7 S to 10 N. The cold Pacific/warm Atlantic pattern underlies counter-rotating Walker cells that instill a rising motion. Upper-level divergence between Pacific easterlies and Atlantic westerlies is a noteworthy influence on the semi-annual modes.

4. Concluding Discussion

This research revealed semi-annual cycling in the Western Hemisphere via EOF eigenvector loadings and PC time scores for 850 hPa zonal wind, precipitation, and sea surface temperature. The variance explained by these modes occurring every 6 months was 12.3%, 5.4%, and 2.3%, respectively. The eigenvector loading pattern for U850 wind extended from the north Atlantic to the east Pacific, tilting ENE-WSW, and channeled over the Caribbean and central America. The pattern for precipitation covered the equatorial zone, while the SST formed a dipole representing anti-phase coastal upwelling off Peru and Angola. Semi-annual trade winds respond to the SST dipole: a warm Atlantic/cool Pacific weakens Caribbean airflow (R = 0.46) and strengthens equatorial convection via overturning Hadley and Walker circulations. This link has important implications for global climate teleconnections from the Western Hemisphere. ENSO signals are amplified and spread across the world when semi-annual modes are in-phase but are suppressed and localized when these modes are out of phase.
The EOF statistics have broader implications. The U850 loading pattern that connects north Atlantic and east Pacific trade winds underpins a cascade of evaporation–SST–convective potential energy. East Pacific upwelling tends to slow north Atlantic airflow at intra-seasonal to inter-annual timescales. The small explained variance of the SST dipole relates to fluctuations in ENSO onset during transition seasons [24]. Semi-annual precipitation extends across the equatorial zone, despite the zonal overturning Walker circulation [25] that underpins contrasts between the Atlantic and Pacific sectors (cf. Figure 6c).
Temporal analysis uncovered a persistent 6-month rhythm that only breaks down during major El Nino events and negative-phase Arctic Oscillation [26]. The case study of 2010 found co-occurrence, whereas in other cases AO and ENSO appeared to be decoupled from semi-annual modes (e.g., 1983 and 1998). Spatial analysis revealed semi-annual trade winds channeled over the southwest Caribbean. Climatology calculations confirmed little phase delay in 6-month cycles of wind, precipitation, and sea temperature. The composites identified a subtropical ‘bridge’ underpinned by anomalous Hadley cells and intertropical convection that modulates upper westerlies across the mid-latitudes (cf. Figure 6a,b).
Increasingly undulatory subtropical jet streams [27] could fuel growth in the semi-annual amplitude and motivate further research. Recognizing the limitation of averaging marine and terrestrial climates from 150 W to 20 E, further work will focus on the alternation of heat outflows from the tropical Atlantic and east Pacific suggested by the SST dipole.

Funding

The author received no direct funding for this work.

Data Availability Statement

A data analysis spreadsheet can be requested from the author by email.

Acknowledgments

Most data analysis was derived from the IRI Climate Library and KNMI Climate Explorer. Support from the South African Department of Higher Education is noted.

Conflicts of Interest

The author declares no conflicts of interest.

Appendix A

Figure A1. Surface air temperature anomalies over North America from March to May 2010, on a Lambert projection. The semi-annual modes in the tropics had positive excursions, and the Arctic Oscillation reached −4.
Climate 13 00111 g0a1

References

  1. Pezzulli, S.; Stephenson, D.B.; Hannachi, A. The variability of seasonality. J. Clim. 2005, 18, 71–88. [Google Scholar] [CrossRef]
  2. Donohoe, A.; Battisti, D.S. The seasonal cycle of atmospheric heating and temperature. J. Clim. 2013, 26, 4962–4980. [Google Scholar] [CrossRef]
  3. Cleland, E.E.; Chuine, I.; Menzel, A.; Mooney, H.A.; Schwartz, M.D. Shifting plant phenology in response to global change. Trends Ecol. Evol. 2007, 22, 357–365. [Google Scholar] [CrossRef] [PubMed]
  4. Jury, M.R.; Mpeta, E.J. The annual cycle of climate over Africa and its variability. Water SA 2005, 31, 1–8. [Google Scholar] [CrossRef]
  5. Fang, M.; Tung, K.K. Time-dependent nonlinear Hadley circulation. J. Atmos. Sci. 1999, 56, 1797–1807. [Google Scholar] [CrossRef]
  6. Dima, I.M.; Wallace, J.M. On the seasonality of the Hadley Cell. J. Atmos. Sci. 2003, 60, 1522–1527. [Google Scholar] [CrossRef]
  7. McKinnon, K.; Stine, A.; Huybers, P. The spatial structure of the annual cycle in surface temperature: Amplitude, phase and lagrangian history. J. Clim. 2013, 26, 7852–7862. [Google Scholar] [CrossRef]
  8. Yang, F.; Wu, Z. On the physical origin of the semi-annual component of surface air temperature over oceans. Clim. Dyn. 2022, 59, 2137–2149. [Google Scholar] [CrossRef]
  9. Pinheiro, H.R.; Hodges, K.I.; Gan, M.A. Deepening mechanisms of cut-off lows in the southern hemisphere and the role of jet-streams: Insights from eddy kinetic energy analysis. Weather Clim. Dyn. 2024, 5, 881–894. [Google Scholar] [CrossRef]
  10. White, W.B. Tropical coupled Rossby waves in the Pacific ocean–atmosphere system. J. Phys. Oceanogr. 2000, 30, 1245–1264. [Google Scholar] [CrossRef]
  11. Jury, M.R. MJO influence in the Caribbean. Theor. Appl. Climatol. 2019, 138, 1559–1567. [Google Scholar] [CrossRef]
  12. Donohoe, A.; Dawson, E.; McMurdie, L.; Battisti, D.S.; Rhines, A. Seasonal asymmetries in the lag between insolation and surface temperature. J. Clim. 2020, 33, 3921–3945. [Google Scholar] [CrossRef]
  13. North, J.S.; Schliep, E.M.; Wikle, C.K. On the spatial and temporal shift in the archetypal seasonal temperature cycle as driven by annual and semi-annual harmonics. Environmetrics 2021, 32, e2665. [Google Scholar] [CrossRef]
  14. Song, Y.; Lawlor, K.B.; Witten, T.A. Excess semiannual variation in historical temperature records. Qtr. J. Roy. Meteo. Soc. 2021, 147, 764–772. [Google Scholar] [CrossRef]
  15. Adam, O. Dynamic and energetic constraints on the modality and position of the inter-tropical convergence zone in an aquaplanet. J. Clim. 2021, 34, 527–543. [Google Scholar] [CrossRef]
  16. Liu, X.; Grise, K.M.; Schmidt, D.F.; Davis, R.E. Regional characteristics of variability in the Northern Hemisphere wintertime polar front jet and subtropical jet in observations and CMIP6 models. J. Geophys. Res. Atmos. 2021, 126, e2021JD034876. [Google Scholar] [CrossRef]
  17. Gelaro, R.; McCarty, W.; Suárez, M.J.; Todling, R.; Molod, A.; Takacs, L.; Randles, C.A.; Darmenov, A.; Bosilovich, M.G.; Reichle, R.; et al. The modern-era retrospective analysis for research and applications, version 2 (MERRA-2). J. Clim. 2017, 30, 5419–5454. [Google Scholar] [CrossRef]
  18. Adler, R.F.; Sapiano, M.; Wang, J.-J. Global Precipitation Climatology Project (GPCP) Monthly Analysis. NASA technical paper: CDRP-ATBD-0848; NASA: Washington, DC, USA, 2016; p. 32. [Google Scholar]
  19. Rayner, N.A.; Parker, D.E.; Horton, E.B.; Folland, C.K.; Alexander, L.V.; Rowell, D.P.; Kent, E.C.; Kaplan, A. Global analyses of sea surface temperature, sea ice, and night marine air temperature since the late nineteenth century. J. Geophys. Res. 2003, 108, 4407. [Google Scholar] [CrossRef]
  20. Ambaum, M.H.; Hoskins, B.J.; Stephenson, D.B. Arctic oscillation or north Atlantic oscillation? J. Clim. 2001, 14, 3495–3507. [Google Scholar] [CrossRef]
  21. Penny, S.G.; Behringer, D.W.; Carton, J.A.; Kalnay, E. The hybrid global ocean data assimilation system at NCEP. Mon. Wea. Rev. 2015, 143, 4660–4677. [Google Scholar] [CrossRef]
  22. Ding, H.; Keenlyside, N.; Latif, M. Impact of the equatorial Atlantic on the El Niño Southern Oscillation. Clim. Dyn. 2012, 38, 1965–1972. [Google Scholar] [CrossRef]
  23. Whitewood, R.; Phillips, D. Regional Climates (Canada), in State of the Climate in 2010. Bull. Amer. Meteo. Soc. 2011, 92, S173–175. [Google Scholar]
  24. Wang, B. Interdecadal changes in El Niño onset in the last four decades. J. Clim. 1995, 8, 267–285. [Google Scholar] [CrossRef]
  25. Wang, C. ENSO, Atlantic climate variability, and the Walker and Hadley circulations. In The Hadley Circulation: Present, Past and Future; Diaz, H.F., Bradley, R.S., Eds.; Kluwer: Alphen aan den Rijn, The Netherlands, 2005; pp. 173–202. [Google Scholar]
  26. Chen, S.; Chen, W.; Wu, R.; Yu, B.; Graf, H.-F.; Cai, Q.; Ying, J.; Xing, W. Atlantic multidecadal variability controls Arctic-ENSO connection. Nature Clim. Atmos. Sci. 2025, 8, 44. [Google Scholar] [CrossRef]
  27. Mullens, S.R. Increasingly undulatory jet-streams. In Proceedings of the 26th Conference on Climate Variability and Change (AMS), Atlanta, GA, USA, 3 February 2014. [Google Scholar]
Figure 1. Spatial eigenvector loading patterns for (a) 850 hPa zonal wind PC2, (b) GPCP precipitation PC3, and (c) SST PC4. Color bar applies to all subfigures in σ units, ‘max’ in (a) refers to greatest semi-annual amplitude, dashed line in (b) is 5 N latitude, and gray shading in (c) indicates elevation > 1000 m.
Climate 13 00111 g001
Figure 2. (a) The amplitudes of the semi-annual cycles (wavelet spectral power shaded > 90% confidence) in the PC time scores (from top to bottom: U850 wind, precipitation, and SST). (b) The monthly medians of the PC time scores. (c) The pair-wise lag correlations between the semi-annual PC time scores. (d) A scatterplot of the 1980–2023 monthly PC time scores (R = 0.46), with colors and sizes according to precipitation.
Climate 13 00111 g002
Figure 3. Hovmoller plots of the mean annual cycles from 150 W to 20 E from 1980 to 2023 for (a) net solar radiation (W/m2), (b) U850 wind (m/s), (c) GPCP precipitation (mm/day), and (d) satellite SST (°C).
Climate 13 00111 g003
Figure 4. Long-term averages for (a) ocean surface heat balance and (b) mixed-layer depth and salinity (blue line, inverted). Meridional Hadley cells with zonal wind > 10 m/s (red contour) and relative humidity > 50% (green contour): (c) Mar-May and (d) Sep-Nov. Vertical motion is exaggerated. All are averages for 150 W–20 E from 1980 to 2023.
Climate 13 00111 g004
Figure 5. (a) Filtered inter-annual PC time scores (El Nino disruptions and case study are labeled). (b) Amplitudes of inter-annual variability (wavelet spectral power shaded > 90% confidence) (from left to right: U850 wind, precipitation, and SST) with cone of validity. (c) Mar–May 2010 anomalies in precipitation (shaded mm/day), SST (‘warm sea’ > 1.5 C), and 250 hPa zonal wind (red contour, 5 m/s).
Climate 13 00111 g005
Figure 6. Composite anomalies in the meridional Hadley circulation, zonal wind (red contour), and 1–100 m salinity (lower, scale on right) averaged over the Western Hemisphere (150 W–20 E) for (a) the 10 most positive and (b) 10 most negative cases. (c) Composite anomalies in the zonal Walker circulation and 1–100 m sea temperature (lower, scale on right) averaged for 7 S–10 N for 10 positive minus 10 negative cases.
Climate 13 00111 g006
Disclaimer/Publisher’s Note: The statements, opinions and data contained in all publications are solely those of the individual author(s) and contributor(s) and not of MDPI and/or the editor(s). MDPI and/or the editor(s) disclaim responsibility for any injury to people or property resulting from any ideas, methods, instructions or products referred to in the content.