Review

From Climate to Cloud: Advancing Fog Detection Through Satellite Imagery

by
Andrés Gabriel Arguedas Chaverri
,
Rogério Hartung Toppa
and
Kelly Cristina Tonello
*
Department of Environmental Sciences, Universidade Federal de São Carlos, Campus Sorocaba, Sorocaba 18052-780, SP, Brazil
*
Author to whom correspondence should be addressed.
Climate 2025, 13(6), 110; https://doi.org/10.3390/cli13060110
Submission received: 24 March 2025 / Revised: 16 May 2025 / Accepted: 23 May 2025 / Published: 27 May 2025
(This article belongs to the Topic Advances in Hydrological Remote Sensing)

Abstract

:
The broad spatiotemporal coverage provided by satellite remote sensing is fundamental for monitoring fog events, a phenomenon that impacts transportation, agriculture, and ecosystem functioning. Despite advances in remote sensing technology, significant knowledge gaps remain regarding the application of these techniques to fog detection, especially over terrestrial ecosystems. This scoping review synthesizes the trends in methods used for fog detection by analyzing 38 papers retrieved from Scopus and Web of Science. Only studies that utilized satellite imagery to analyze the spatiotemporal dynamics of fog were included. Articles that employed non-satellite methodologies or focused on processes other than the detection, formation, or identification of fog events were excluded. In addition to a term co-occurrence analysis of abstracts using VOSviewer, this study examines key parameters of the detection methods—including sensor type, spectral bands, temporal resolution, and algorithmic approaches (e.g., threshold methods and deep learning techniques)—to evaluate their evolution and current limitations. Our results reveal that while approximately 53% of studies rely on geostationary satellite data (95% CI: 36.7–68.5%), favored for their high temporal resolution, the remaining 47% employ polar-orbiting sensors (95% CI: 31.5–63.2%) that offer superior spatial resolution. Notably, most research has concentrated on maritime fog detection, with few studies extending these techniques to complex terrestrial environments. The review highlights critical gaps in current approaches and proposes an integrated framework that combines traditional brightness temperature difference methods with emerging machine learning techniques, which could advance fog detection in diverse settings.

Graphical Abstract

1. Introduction

Fog is a meteorological phenomenon defined as a collection of water droplets suspended near the Earth’s surface, which reduces horizontal visibility to less than 1 km [1]. For decades, fog has captured the attention of the scientific community due to its direct and indirect impacts on human activities [2]. Beyond its visual and atmospheric characteristics, fog poses significant challenges to transportation systems—aviation, marine, and land—resulting in considerable economic and social consequences [3,4]. For instance, during the winter of 1998–1999, persistent fog in eastern India and northeastern Pakistan affected over 2200 commercial flights, including 925 cancellations, disrupted rail services, and caused numerous vehicular accidents, illustrating the severity of fog-related impacts on human mobility and safety [5]. Additionally, fog has been linked to psychological effects, the spread of epidemics, increased atmospheric pollution, and public health crises, as historically documented [6] in the London Smog in December 1952 [7].
While fog is widely recognized for its negative consequences—such as reduced visibility and increased accident risks—it also plays a vital ecological role by contributing to regional water cycles through fog precipitation. Also known as horizontal or occult precipitation, this process can substantially contribute to water budgets, particularly in arid and semi-arid regions [8,9]. Model-based studies indicate that cloud water interception (CWI) can account for less than 5% of total precipitation in humid regions and exceed 75% in low-rainfall areas [2]. In these environments, fog functions as a subtle yet persistent natural reservoir, sustaining ecosystems and supporting local communities where conventional rainfall is limited [10,11].
Despite the relevance of ground-based fog observations for local monitoring, their spatial and temporal limitations constrain broader assessments. In contrast, satellite remote sensing offers a synoptic and continuous view of fog dynamics, much like an aerial survey that captures the temporal evolution of fog across extensive regions [12,13]. Since the 1970s, when satellite imagery first began to be used for fog detection [14], technological advances have introduced both polar-orbiting and geostationary sensors capable of providing high-temporal-resolution data across multiple spectral channels [15,16]. This capability can be likened to creating a time-lapse sequence of fog development, movement, and dissipation—essential for both operational forecasting and the analysis of climatological patterns.
Nevertheless, despite technological progress, significant knowledge gaps persist regarding the spatiotemporal dynamics of fog, limiting our ability to understand its life cycle and accurately map its occurrence across different regions [17,18,19,20]. Filling these gaps is particularly critical for informing public policies and operational decisions in sectors such as transportation, agriculture, and industry [13]. Although advances in fog detection have been notable in Europe and North America, other parts of the world remain underrepresented in the scientific literature [12]. These disparities underscore the need to adapt and refine remote detection methodologies to better accommodate diverse climatic and geographic contexts. Recent efforts to simulate fog in urban areas have further revealed spatial mismatches and resolution limitations between satellite observations and numerical models, underscoring the need for methodological integration [21]. This challenge can be compared to refining a universal translation tool that must account for linguistic nuances—requiring both precision and adaptability.
Historically, the development of satellite-based fog detection began in the 1970s, when visible and infrared imagery were first employed to assess the radiative properties of clouds and fog, laying the physical groundwork for remote detection [22]. Early techniques using AVHRR (Advanced Very High Resolution Radiometer) imagery leveraged brightness temperature differences between thermal channels to detect nighttime fog [23,24]. These methods were progressively refined and adapted to different geographic contexts over the following decades [25,26], relying primarily on threshold-based analyses and manual interpretation.
Further advancements were achieved with the use of multispectral infrared imagery from GOES satellites, which enhanced nighttime fog detection [27], along with the development of microphysical retrieval techniques validated by in situ balloon measurements [28]. Subsequent improvements in satellite instrumentation, such as the GOES I-M series, expanded the capabilities for monitoring boundary-layer cloud properties [29]. Comprehensive reviews published in the early 2000s synthesized these advancements, highlighting key physical principles and methods for fog detection from space [4,30,31]. Despite the limitations of early sensors and algorithms, these pioneering contributions remain foundational to the evolution of current satellite-based fog detection methodologies.
Given the ecological, economic, and social relevance of fog, combined with the historical development and ongoing methodological challenges discussed above, it becomes essential to understand how scientific research in this field has evolved. In this context, the present study aims to map, through a bibliometric analysis, the main trends, methods, and gaps related to satellite-based fog detection, providing a critical overview of the current state of knowledge and outlining pathways for the development of more robust and applicable methodologies across diverse geographic and climatic contexts.
This study is structured around two primary research questions:
What are the specific methods employed in satellite-based fog detection, and what are their advantages and limitations?
Why is it urgent to refine these methods for terrestrial applications, and how can these improvements advance our understanding of fog dynamics and their implications for environmental management and societal needs?
By addressing these questions, this review aims to bridge knowledge gaps and propose a roadmap for future research. Ultimately, improving fog detection methodologies will contribute to more accurate forecasting and support informed decision-making in sectors that are highly sensitive to fog-related risks and opportunities, such as governmental planning, industrial operations, transportation logistics, and agricultural management.

2. Material and Methods

Literature Review and Data Extraction

A scoping review was conducted following the PRISMA guidelines [32] to identify papers that apply satellite remote sensing for fog detection. Searches were performed in the Scopus and Web of Science databases, which are among the most comprehensive sources for publication metadata and impact indicators due to their extensive coverage of diverse topics and multidisciplinary content [33]. The search was conducted on 8 February 2024, ensuring the inclusion of the most recent publications relevant to the topic. The keywords “fog frequency”, “remote sensing”, and their variants were searched to analyze papers that were associated with fog event frequency detected through remote sensing (Table 1). The search was unrestricted by publication year and confined to scientific papers, thereby excluding review articles, books, book chapters, and publications in languages other than English. To manage the literature, the Rayyan (https://www.rayyan.ai/ (accessed on 18 November 2024)) interface was employed, which facilitated duplicate detection and efficient tracking of included and excluded records during the identification stage. The resulting papers were evaluated in the first part of the screening stage by title and abstract, according to the established inclusion and exclusion criteria listed below. In the initial screening stage, abstracts and titles were reviewed based on predetermined inclusion and exclusion criteria. Specifically, only studies that utilized satellite imagery to analyze the spatiotemporal dynamics of fog were included. Articles that employed non-satellite methodologies or focused on processes other than the detection, formation, or identification of fog events were excluded. Furthermore, our search was ultimately limited to peer-reviewed original research and review papers. Any duplicate entries from the search results were removed prior to the detailed review process.
The studies were categorized based on fog detection techniques, sensor type, and research domain (terrestrial vs. maritime). Once the papers to be included in this review were selected, VOSviewer software version 1.6.19 was used to create a term co-occurrence map based on text data extracted from the title and abstract of each paper. We applied binary counting to capture only the presence or absence of terms in each document, rather than their frequency. Terms with fewer than two co-occurrences were excluded. Common monosyllabic words and irrelevant terms were excluded from the final selection. Clusters were automatically generated by the software’s default algorithm, which is based on cosine similarity. No manual adjustments were made to the allocation of terms into clusters.
In the network visualization map, the higher the occurrence of a term, the larger its label and circle, and the distance between words indicates their relationship [34]. The distribution was analyzed over the years of publication and the country of the lead author of each paper, along with the average year of publication of the documents in which a particular word appears, to understand the trend of the studied terms.
As this study is a scoping review, a formal risk of bias assessment was not conducted. The focus was on mapping research trends rather than critically appraising study quality. In addition, no effect measures were calculated or synthesized.

3. Results and Discussion

3.1. Analysis of Publications

A total of 154 references were retrieved in the information search, with 101 from the Scopus database and 53 from Web of Science. Forty-eight papers were eliminated due to duplication, 68 due to exclusion criteria, and four because the full text was not available (Figure 1). Two of these were published in Chinese without available English translations, and two others were inaccessible despite attempts to retrieve them via institutional subscriptions and author contact. We acknowledge that the exclusion of non-English publications—particularly in Chinese, a dominant language in fog-related research—may introduce a potential language and regional bias into our findings. Nonetheless, we prioritized methodological consistency and transparency in the selection process, ensuring that all included studies met the same accessibility and evaluability criteria.
As a result of identifying studies through the databases, 34 studies were included in the review. Additionally, four records were identified based on citation searches, as they were references continuously found while reading the database texts. Papers that appeared in more than four different studies were considered as part of the citation search.
The countries with the most publications were China, Germany, India, and Canada, with 12, eight, five, and four studies, respectively (Figure 2). It was noted that both Chinese and Canadian researchers focused their studies on fog events in the oceans, the Yellow Sea and Bohai Sea in China [14,15,16,35,36,37,38,39,40,41] and the Atlantic Ocean off the coast of Nova Scotia and Newfoundland and Labrador in Canada [12,42,43,44].
In India, studies focused on the detection of continental fog within the Indo-Gangetic Plain, which includes parts of Pakistan, Bangladesh, and northern India [45,46,47,48,49]. In countries with fewer publications, the research objective was the impact of fog on vegetation in the Atacama Desert in Chile [19,50], port activities in Casablanca, Morocco [17,51], and agricultural production in California, United States [13,52]. It was found that the areas studied by German authors were located outside Germany, primarily researching the spatiotemporal distribution patterns of ecosystems with high ecological importance. Some of the regions studied include arid zones on the west coast of southern Africa [20,53] and fog forests and lowland tropical rainforests in South America and Taiwan [18,54,55,56,57].
While some regions identified in this review—such as China, Germany, India, and Canada—benefit from advanced research infrastructure and extensive satellite monitoring programs, this concentration of studies in a limited number of geographic areas introduces a significant geographic bias. The majority of reviewed studies focused on specific zones, including the Yellow Sea and Bohai Sea (China), the Atlantic coast of eastern Canada, the Indo-Gangetic Plain (South Asia), and arid or ecologically significant regions studied by German institutions across Africa, South America, and Taiwan. This uneven distribution limits the generalizability of the findings, as methodologies calibrated in well-studied regions may not translate effectively to areas with different climatic, topographic, or ecological conditions.
Our analysis acknowledges a critical limitation in generalizing the findings to underrepresented regions, notably Africa and South America. As highlighted by other studies, atmospheric science research in these areas faces significant barriers—including limited infrastructure, funding constraints, and reduced participation in international collaborations—resulting in a shortage of region-specific studies that hampers the development of comprehensive models and limits our understanding of fog dynamics across diverse ecological and climatic contexts [58]. Consequently, the insights presented in this review—primarily drawn from regions with higher research output—may not fully capture the variability and characteristics of fog in data-scarce areas. Addressing this gap requires coordinated efforts to strengthen local research capacity, promote equitable collaboration, and prioritize studies in these critically important but understudied regions. As a result, current methodologies, which are often calibrated and validated using data from well-studied regions, may perform suboptimally when applied elsewhere. This underscores the need for future research to expand coverage to data-scarce regions, thereby enhancing the global applicability of satellite-based fog detection methods.
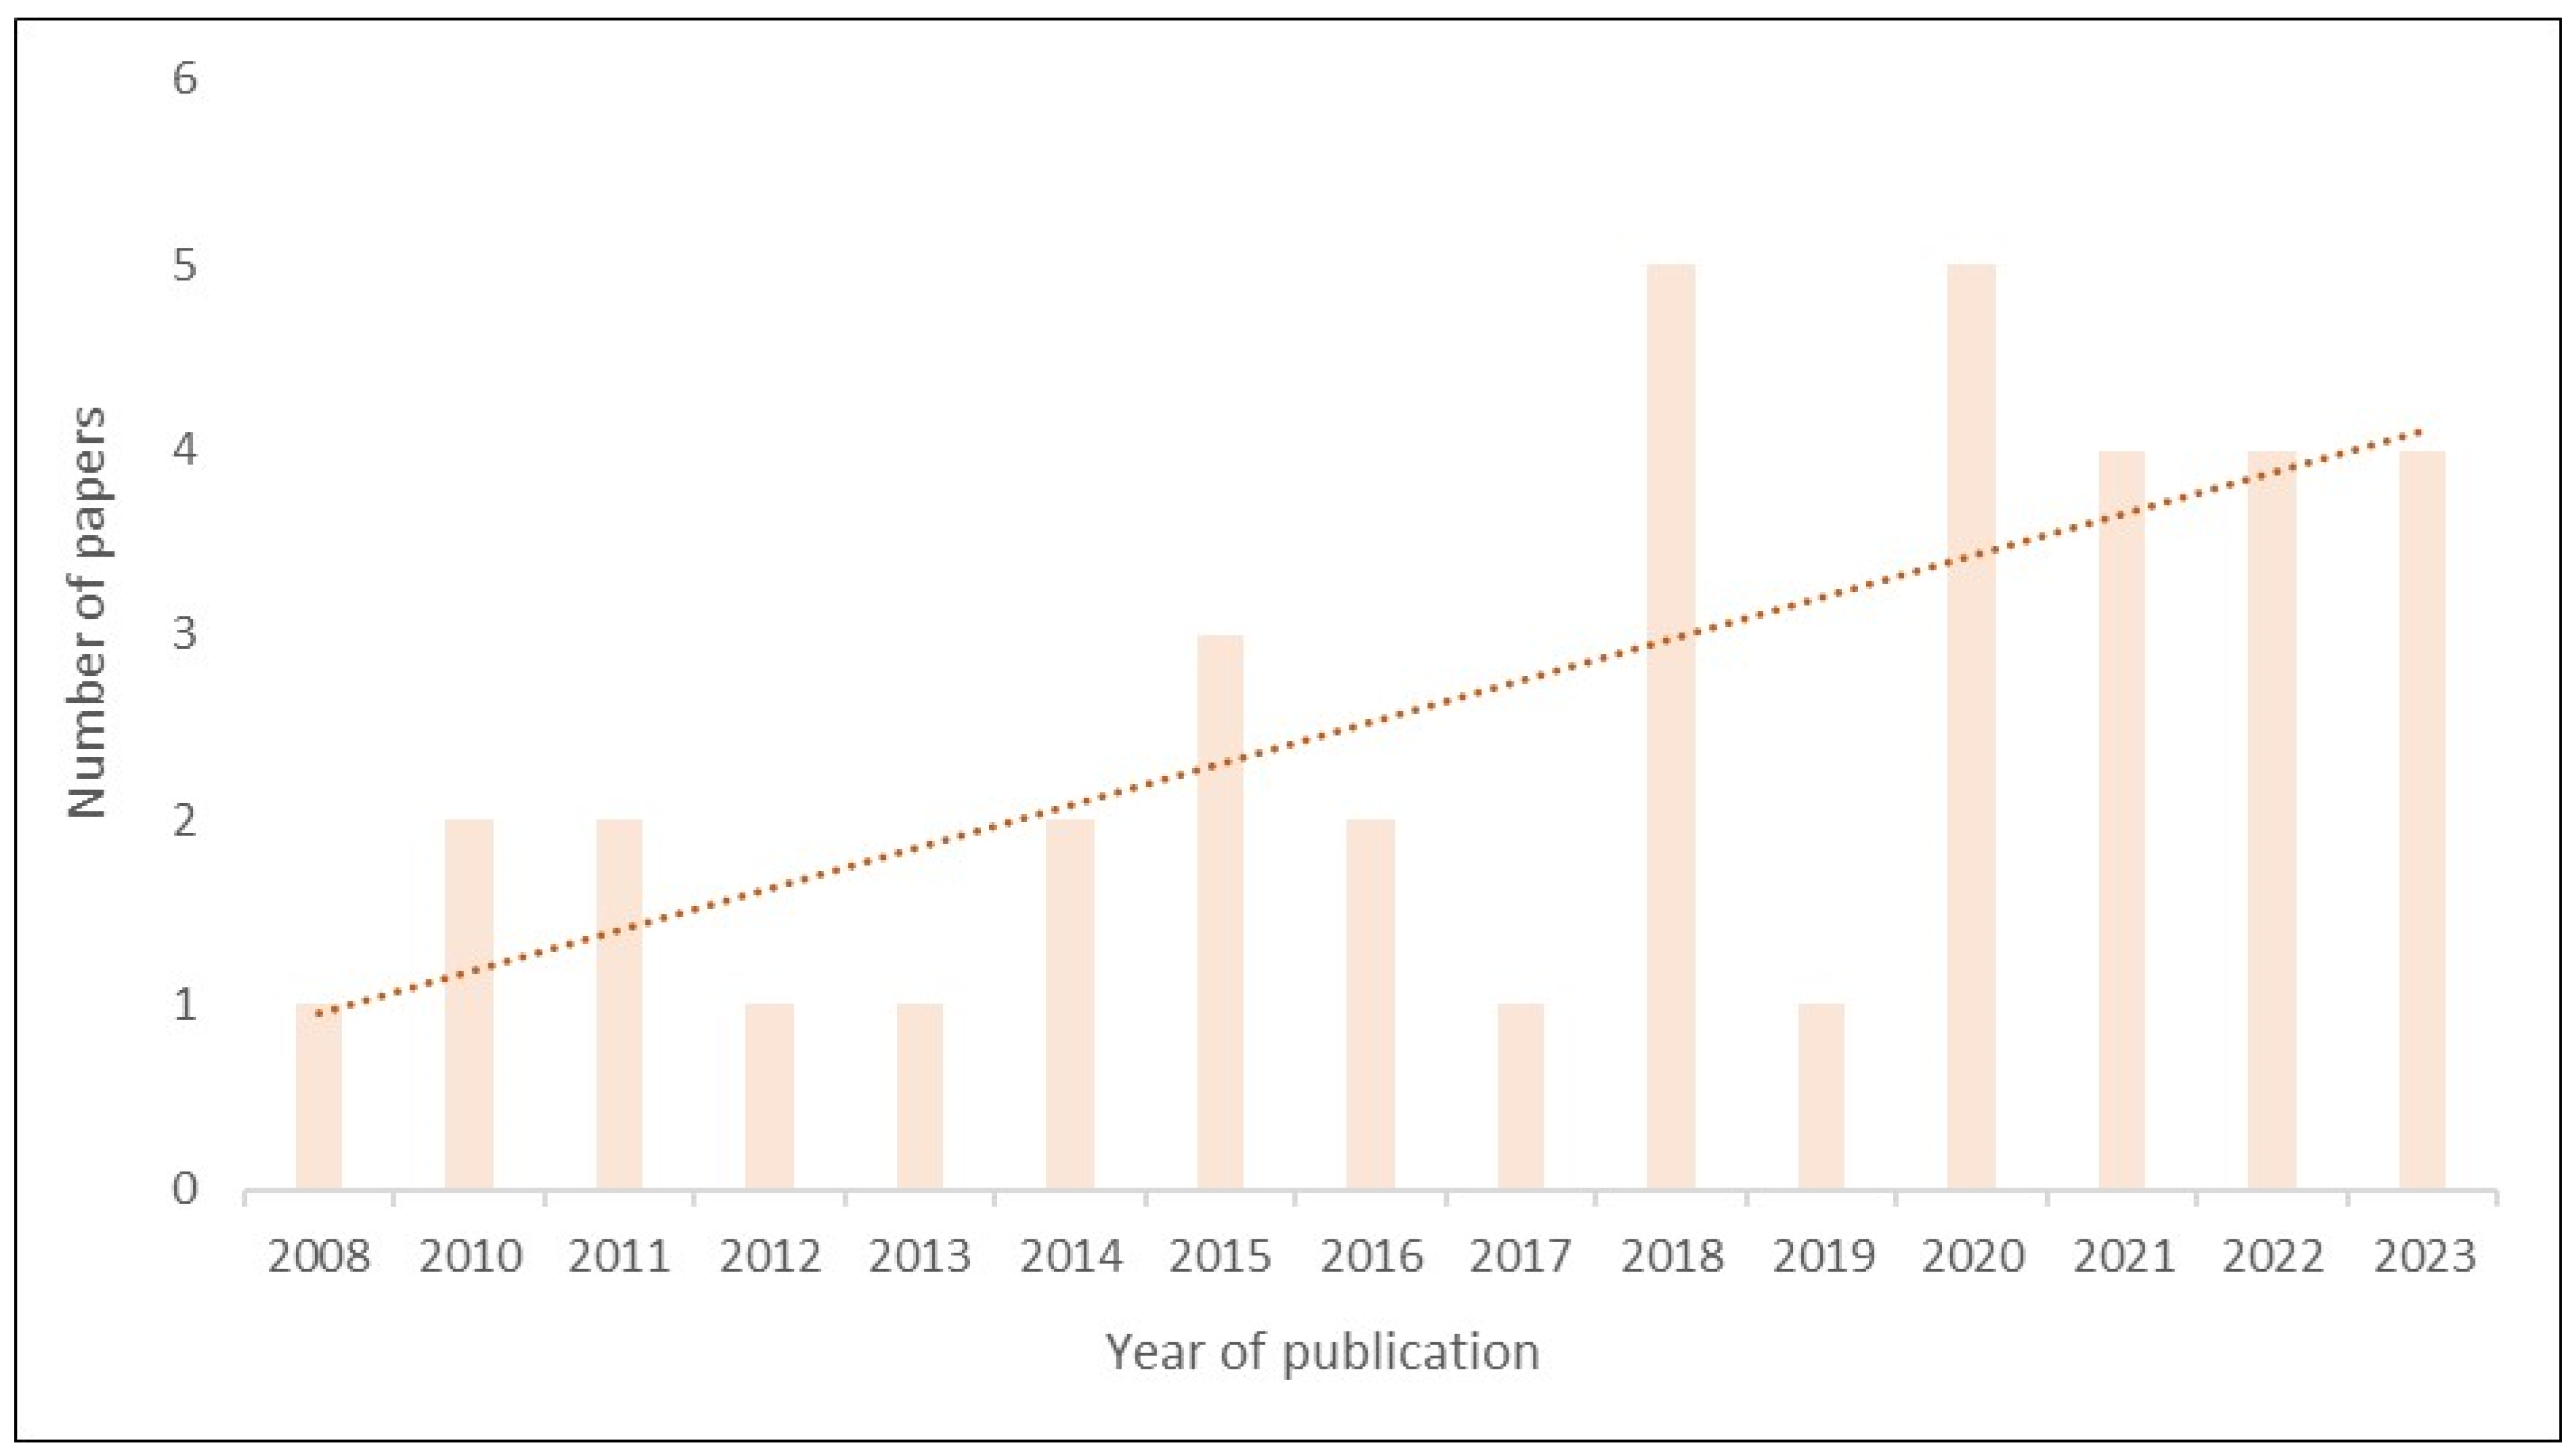
Regarding the distribution of publications by year, there was a trend of increasing numbers of publications, but it was not statistically significant over time (Figure 3). The increase seems to be driven by the effects of global warming on fog formation processes, such as the increase in Arctic fog resulting from sea ice melting [59]. Other observed effects include the spatial evolution of the fog life cycle over cities [17,49,60] and the importance of understanding variations in surface heat fluxes in plant ecosystems [19,52,54].

3.2. Term Co-Occurrence Analysis

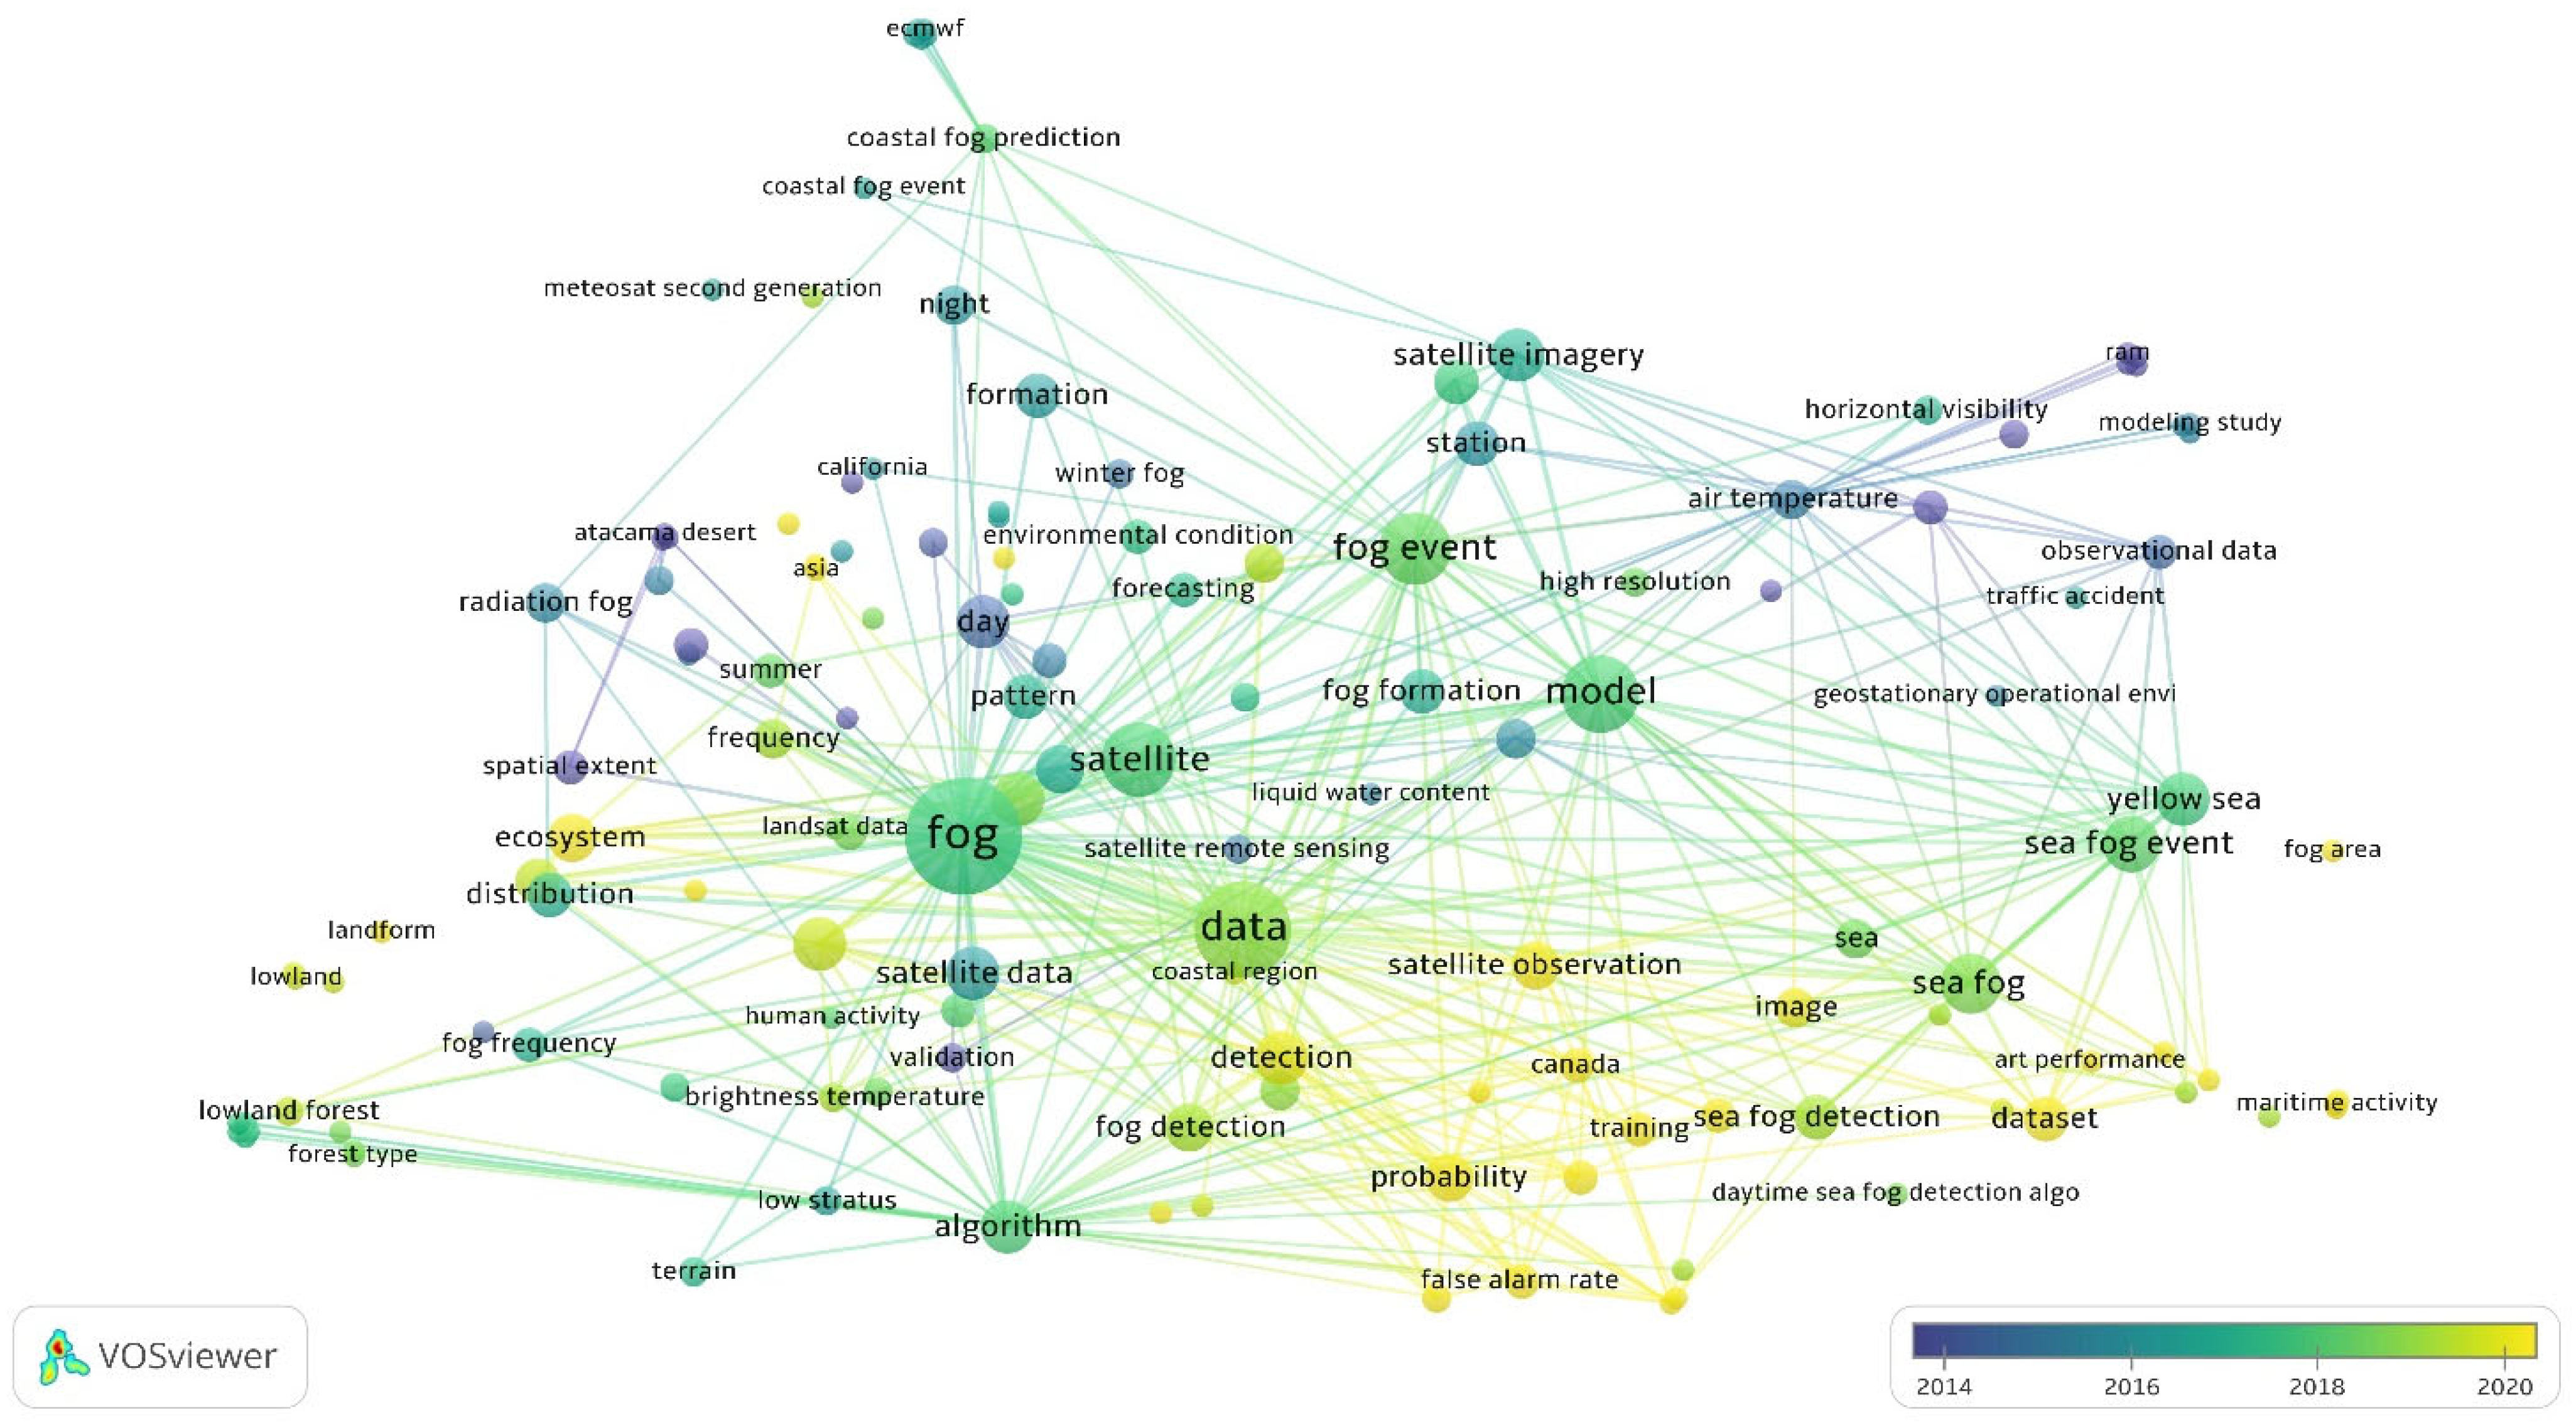
In the network visualization map, built based on text data extracted from the titles and abstracts, seven thematic clusters were identified, grouping the most related terms within the same color (Figure 4). Terms with the highest co-occurrence, such as “fog”, “satellite”, “data”, “satellite imagery”, “fog event”, and “remote sensing” are located at the center of the map, as they represent the main topics of this review.
Although some terms or words appeared less frequently compared to the main ones, their occurrence was enough to highlight them as secondary themes in their respective groups. In the yellow cluster, for example, terms such as “horizontal visibility”, “air temperature”, and “modeling study” gather studies that use visible satellite imagery and climate variables to model advection cooling fog formation processes. The advection fog occurs when warm, humid air is cooled to its dew point by a cold underlying sea surface until it condenses [35,36,61]. However, some studies used the difference between the temperature at the top of the fog and low stratus (FLS) and the surface temperature, considering that positive values imply the existence of a temperature inversion in the marine boundary layer, a condition favorable to fog occurrence [16,59].
Unlike the first three papers in the yellow cluster [35,36,61], which only use visible spectrum bands, the latter suggest a comprehensive dynamic threshold algorithm with infrared bands, combining cloud brightness temperature (BT) with climatological monthly mean data and sea surface BT values [16]. The green cluster shows secondary themes such as “satellite observation”, “sea fog”, and “Yellow Sea”, referring to studies on sea fog. Although connected with the yellow cluster terms, the methodologies in the green cluster for detecting maritime fog are based on the threshold method (TM) between thermal infrared and mid-infrared bands for fog detection [12,44,62]. Smaller droplets in fog are associated with lower emissivity in the 3.7 μm band than in the 10.8 μm band, while the emissivity for larger droplets in high- and mid-level clouds is approximately the same. This characteristic results in a significant contrast in BT due to the emissivity difference [48].
The term “model” from the green cluster is close to secondary terms such as “satellite imagery”, “forecasting”, and “environmental condition” from the purple cluster. This can be explained by the use of climate models, such as the Weather Research and Forecasting Model (WRF) [42] or the Mesoscale Nonhydrostatic Model (Meso NH) [17,51], along with reanalysis data, meteorological station information, and visible satellite imagery observations to study fog events and predict their formation in coastal cities.
Although the term “radiation fog” belongs to the purple cluster, related to modeling for a better understanding of the different physical processes of advection and radiation in coastal fog [51], it is more closely related to the blue and red clusters, which have other research objectives in continental areas. Radiation fog explains how certain factors, including local radiative cooling, high relative humidity, and calm winds, allow air near the ground to cool to its dew point, favoring fog formation associated with vegetation cover [49]. In this context, the red cluster moves away from clusters that predominantly focus on maritime fog formation studies (mainly formed by advection processes) and their forecasting, focusing instead on methodologies to study the spatial extent of fog over continental areas.
In the red cluster, terms such as “ecosystem”, “distribution”, “fog frequency”, and “algorithm” were identified as secondary terms that group papers focused on when developing methodologies to study the distribution and frequency of fog over time. This approach generates frequency maps to identify potential locations of cloud forests [18,56,57], as understanding the spatial occurrence of FLS is essential for detecting potential clusters of this type of forest [54]. In this group of studies, the incorporation of relief and topography data into detection algorithms was observed. These factors interact with climate variables in fog formation processes [56,63], as well as with the time of year and seasonal variations in which the studies are conducted [52].
The orange cluster presents the terms “fog detection”, “probability”, and “false alarm rate”, which refer to a group of studies with more complex methodologies, using a deep learning approach based on artificial neural network algorithms. These methodologies employ algorithms such as TMs between thermal bands, climate reanalysis data, radar, meteorological stations, satellite and ground observations, and fog event databases [38,40,41,62]. This dataset is used to train convolutional neural networks to improve fog event detection and forecasting.
Although most of the literature in this cluster focuses on applying these technologies to maritime fog detection, showing an overlap with terms from the green cluster such as “accuracy” and “training”, other investigations used deep learning algorithms to enhance fog forecasting and support traffic planning in northern China [39]. This connection helps explain the proximity of terms from the red cluster, such as “algorithm” and “human activity”.
It was observed that studies employing machine learning techniques for fog detection have shown a notable increase in recent years. Of the total ML-focused studies identified in this review, 75% were published between 2020 and 2023. This pattern aligns with the overlay visualization (Figure 5), where terms related to deep learning and training appear predominantly in more recent publications. However, recent trends in publications were also observed focusing on ecosystem research, such as studying the impact of climate change on the spatiotemporal dynamics of fog forests using learning methods [64]. Other studies found that fog can contribute to forest resilience to climate change in the Amazon, creating refuges for vulnerable organisms in areas with high fog frequency during the dry season [55].

3.3. Satellite Data in Fog Detection

The type of satellite imagery used in detection methodologies depended on the characteristics of the study areas in each paper. It is known that the temporal resolution of polar-orbiting satellites is lower than that of geostationary satellites, and polar-orbiting satellites have better spatial resolution [14]. Thus, the choice of satellite responded to the time and space information needs of the fog events being studied.
Of the total studies selected for this review, 47.34% (18 out of 38) worked with observations from sensors aboard polar-orbiting satellites (95% CI: 31.5–63.2%), while 52.63% (20 out of 38) were associated with observations using geostationary satellites (95% CI: 36.7–68.5%) (Table S1 in Supplementary Materials). Due to the limited temporal resolution of sensors mounted on polar-orbiting systems compared to geostationary systems, the latter became the more suitable option for providing data at short measurement intervals [65].
The use of geostationary system data was found to be more common in studies with shorter temporal series, where fog events were researched over intervals of days, months, or, at most, four years [17,35,36,39,43,44,46,50,51,60]. Images from the Geostationary Operational Environmental Satellite (GOES) 15 were used to study the effect of coastal fog on agricultural systems in California. The 30 min temporal resolution of GOES-15 was crucial for studying changes in plant’s energy and water balance, as well as changes in the spatial extent of fog [13]. For maritime fog research, observations from the Meteorological Imager (MI) aboard the Communication Ocean and Meteorological Satellite (COMS) were chosen. The advantages of short-term temporal resolution, a wide observation area, and many spectral channels from visible to long-wave infrared were the reasons for selecting this sensor’s data [62]. In contrast, the temporal series in studies using data from polar-orbiting satellites were longer, ranging from five to more than 15 years [38,47,48,49,52,54,55,57,59,63].
Polar-orbiting satellites cover many areas around the world with better spatial resolution due to their lower operating altitude compared to geostationary satellites. It was observed that the Moderate Resolution Imaging Spectroradiometer (MODIS) sensor was the most recurrent in the papers reviewed that used data from this type of orbiting satellite. Some research indicated that MODIS data provided new opportunities for monitoring fog dynamics [30], due to their finer spatial resolution and consistent overpass timing, which minimizes the influence of solar zenith angles—an issue observed with geostationary sensors such as SEVIRI during twilight periods [15]. Similarly, MODIS images were selected in other studies due to their spatial resolution of 1 km to 250 m, depending on the distribution of fog forests in Taiwan, which is highly altitude dependent. In mountainous areas, coarse resolution implies a large altitudinal range covered by each pixel [56,57].

3.4. Methodologies for Fog Detection

This section analyzes the different methodologies described in the reviewed papers for identifying fog using satellite images. TMs, neural networks, texture analysis, and cluster analysis are commonly used in cloud feature studies. Among them, the TM is the most widely used for detecting maritime fog via satellite [15]. However, despite being widely used for maritime detections, the TM was found in many studies in this review, regardless of the type of coverage. The term “brightness temperature”, a variable used in tests within the TM, is linked to the different thematic clusters in this review (Figure 6), highlighting the versatility and applicability of this method.
It was found that the TM, based on the brightness temperature difference (BTD) test between two infrared window channels, was applied to both geostationary and polar-orbiting satellite images. Although it is the same technique, it is important to understand that the threshold values can vary from place to place [45] and, therefore, between the bands of each sensor. Data from the Spinning Enhanced Visible and Infrared Imager (SEVIRI) sensor analyzed the difference between the 3.9 μm (IR3.9) and 10.8 μm (IR10.8) channels, based on the fact that low-level water clouds observed in IR3.9 have lower emissivity than the same clouds observed in IR10.8 [17,51]. Other studies that opted for images from the same sensor conducted the analysis using the 12.0 μm and 8.7 μm channels [20]. Data from GOES-16, captured in bands 14 (11.2 μm) and 7 (3.9 μm), corresponding to the thermal infrared and mid-infrared spectra, were used in a similar remote sensing technique to detect nocturnal sea fog [12]. Meanwhile, [44] defined fog boundaries based on the BTD between the 3.9 μm and 10.6 μm bands [44]. To study spatiotemporal dynamics of fog using BT data from the MODIS sensor, the most frequently used channels were 3.9 μm and 10.8 μm [54] and 11 μm and 3.6 μm [19,56], as well as bands 22 (3.929–3.989 μm) and 31 (10.780–11.280 μm) [48,49].
Some studies indicated that solar radiation interferes with the BT of the bands, obscuring the signal associated with fog reflective characteristics [41,44]. During daytime, the 3.9 μm band can be contaminated by reflected solar radiation, which reduces the contrast needed for fog identification [30]. Moreover, atmospheric water vapor strongly influences the ΔBT values: as vapor content increases, the ΔBT10.8–3.9 becomes more negative, potentially leading to false positives or negatives [18]. Thus, the separation of FLS from other cloud types becomes difficult during daytime, which is why this technique is primarily used at night. Another reason for choosing nighttime data is the fog formation processes, such as in [54] the Amazon plain, where fog occurs at night and early in the morning [54]. In the Indo-Gangetic Plain, INSAT-3D data were used to distinguish fog from clouds and snow via two threshold methods: BTD between TIR1 (10.8 μm) and MIR (3.9 μm) for nighttime, and a combination of visible and TIR1 bands for daytime detection [54]. Although the study did not report formal accuracy metrics, it qualitatively compared satellite-derived fog with visibility data from METAR stations, showing consistent temporal patterns, especially at night. This highlights the need for future studies to incorporate quantitative validation using reanalysis or LIDAR data.
For daytime fog detection in the Arctic, measurements from MODIS band 31 (10.7 μm) and surface temperature provided by standard MODIS data products were used [59]. Based on this information, it is possible to detect an FLS event if the temperature difference between the cloud top and the surface exceeds the established threshold for a given region. The threshold test using visible and near-infrared data was another technique used in TM. Studies in the Yellow Sea in China used a combination of MODIS band 3 (479 nm), band 6 (1.652 nm), and band 7 (2.155 nm) to distinguish between cloud types, as liquid water absorbs more red and shortwave infrared radiation [36]. Other studies opted for data from MODIS channels 1 (620–670 nm), 2 (841–876 nm), 18 (931–941 nm), and 19 (915–965 nm) to differentiate between fog, high clouds, and the sea surface reflected in water vapor [15]. Although TM is widely used for being stable and simple, some authors believe that simple threshold combinations are insufficient to monitor maritime fog in complex scenarios [38]. As a result, other studies have used multiple threshold combinations with more statistical analysis and a combination of other data types and techniques. In northern China, three different methodologies were applied using data from the Advanced Himawari Imager (AHI) aboard the Himawari-8 satellite, considering that fog has consistent spatial and temporal characteristics within adjacent 30 min intervals [39]. The texture and spectral difference, BTD, and visual interpretation methodologies were employed to recover daytime, nighttime, and twilight fog, respectively.
One promising approach is a hybrid pipeline that integrates TM with convolutional neural networks (CNNs). For example, BTD values derived from thermal bands can serve as pre-classified inputs or feature maps to train CNNs capable of distinguishing fog from other low-level clouds [62]. This combined architecture leverages the physical interpretability of TM and the pattern recognition power of ML. A dual-branch neural network applied to geostationary satellite data has been shown to improve fog detection accuracy when compared to traditional TM, as demonstrated in a recent study using GOCI imagery [41].
It was observed that in all the studies included in this review, the methodologies validated fog detection using reanalysis data such as ERA-5, data from active satellites like LIDAR, meteorological stations, and ground-based observations. It was clear that the purpose of the analyzed research was to define combinations of fog detection techniques according to the processes and areas studied. Despite recent progress, fog detection using satellite imagery still faces key limitations, particularly in distinguishing fog from low stratus and in detecting nocturnal fog due to sensor spectral constraints. For example, while high-resolution sensors such as Sentinel-2 offer detailed spatial information and advanced cloud masking algorithms, their lack of thermal infrared bands limits their applicability for detecting FLS during nighttime periods [54].

4. Conclusions

A total of 38 studies were considered in this literature review. While our search strategy was methodologically rigorous and broad in scope, the exclusion of non-English studies and papers with inaccessible full texts may have constrained the geographical and linguistic diversity of the included literature. This is especially relevant given the high volume of fog detection research conducted in China. Future reviews would benefit from the integration of multilingual search strategies and translation tools to ensure more comprehensive global representation. The country with the most publications was China, followed by Germany and India. The methodologies found varied according to the type of coverage, research objective, type of satellite, sensor characteristics, and detection techniques. Seven thematic clusters were identified, grouping publications based on the fog formation process studied and the research objective.
The primary objective of the studies was fog forecasting in the sea and large urban centers, motivated by the impact on maritime, air, and land transportation activities. Fewer papers focused on ecosystems where the spatiotemporal dynamics of fog have high ecological importance, such as deserts, fog forests, or agricultural systems. Around 53% of the papers used data from sensors aboard geostationary satellites. The high temporal resolution of these satellites allowed the research to have shorter time series (from days to up to four years). A total of 47.34% of the studies worked with observations from sensors aboard polar-orbiting satellites, with the MODIS sensor being the most frequently used in this category. These studies, unlike the ones mentioned earlier, investigated fog distribution overtime series ranging from five to more than 15 years. The fog detection techniques found did not differentiate between image types, satellite, coverage studied, or time series. The BTD technique was the most frequently used among TM and in datasets from more complex methodologies, such as those based on deep learning. It was found that more recent papers employed machine learning and deep learning methodologies, as well as CNNs. This pattern aligns with the overlay visualization, where terms related to deep learning and training appear predominantly in more recent publications. Further studies could benefit from combining data from complementary sensors—including geostationary platforms like Himawari-8, hyperspectral imagers, and active sensors such as LIDAR—to improve temporal coverage and classification accuracy in complex terrestrial environments. Although most existing works have focused on maritime fog forecasting, there are also studies addressing the effects of climate change on vulnerable ecosystems. Advancing this field requires the development of integrated methodologies that combine traditional threshold-based techniques—such as brightness temperature difference—with machine learning approaches, including convolutional neural networks. This combination can leverage the strengths of both strategies, improving classification accuracy by coupling physically grounded indicators with data-driven pattern recognition. Identifying these methodologies can help generate new research that provides information on fog patterns in vulnerable ecosystems, one of the most recent and least explored themes found in this review.

Supplementary Materials

The following supporting information can be downloaded at https://www.mdpi.com/article/10.3390/cli13060110/s1: Table S1. Sensors used in the studies included in the literature review.

Author Contributions

Methodology, A.G.A.C. and K.C.T.; formal analysis, A.G.A.C., K.C.T. and R.H.T.; investigation, A.G.A.C.; writing—original draft, A.G.A.C.; writing—review and editing, A.G.A.C., K.C.T. and R.H.T.; supervision, K.C.T. All authors have read and agreed to the published version of the manuscript.

Funding

This work was financial supported by Coordenação de Aperfeiçoamento de Pessoal de Nível Superior (CAPES)—CODE 001, Brazilian National Council for Scientific and Technological Development (CNPq)—grant 312562/2021-7 and the São Paulo Research Foundation (FAPESP)—grant 2021/11697-9.

Data Availability Statement

The data that support the findings of this study are available from the corresponding author upon reasonable request.

Conflicts of Interest

The authors declare no conflicts of interest.

References

  1. World Meteorological Organization. International Meteorological Vocabulary; World Meteorological Organization: Geneva, Switzerland, 1992; Volume 182. [Google Scholar]
  2. Bruijnzeel, L.A.; Mulligan, M.; Scatena, F.N. Hydrometeorology of Tropical Montane Cloud Forests: Emerging Patterns. Hydrol. Process. 2011, 25, 465–498. [Google Scholar] [CrossRef]
  3. Gultepe, I.; Tardif, R.; Michaelides, S.C.; Cermak, J.; Bott, A.; Bendix, J.; Müller, M.D.; Pagowski, M.; Hansen, B.; Ellrod, G.; et al. Fog Research: A Review of Past Achievements and Future Perspectives. Pure Appl. Geophys. 2007, 164, 1121–1159. [Google Scholar] [CrossRef]
  4. Gultepe, I.; Sharman, R.; Williams, P.D.; Zhou, B.; Ellrod, G.; Minnis, P.; Trier, S.; Griffin, S.; Yum, S.S.; Gharabaghi, B.; et al. A Review of High Impact Weather for Aviation Meteorology. Pure Appl. Geophys. 2019, 176, 1869–1921. [Google Scholar] [CrossRef]
  5. Hameed, S.; Mirza, M.I.; Ghauri, B.M.; Siddiqui, Z.R.; Javed, R.; Khan, A.R.; Rattigan, O.V.; Qureshi, S.; Husain, L. On the Widespread Winter Fog in Northeastern Pakistan and India. Geophys. Res. Lett. 2000, 27, 1891–1894. [Google Scholar] [CrossRef]
  6. Gupta, S.K.; Elumalai, S.P. Adverse Impacts of Fog Events during Winter on Fine Particulate Matter, CO and VOCs: A Case Study of a Highway near Dhanbad, India. Weather 2018, 73, 396–402. [Google Scholar] [CrossRef]
  7. Martin, A.E. Mortality and Morbidity Statistics and Air Pollution. R. Soc. Med. 1964, 57, 969–975. [Google Scholar] [CrossRef] [PubMed]
  8. Holder, C.D. Fog Precipitation in the Sierra de Las Minas Biosphere Reserve, Guatemala. Hydrol. Process. 2003, 17, 2001–2010. [Google Scholar] [CrossRef]
  9. Bruijnzeel, L.S.; Eugster, W.; Burkard, R. Fog as a Hydrologic Input. In Encyclopedia of Hydrological Sciences; Anderson, M.G., Ed.; John Wiley & Sons, Ltd.: Hoboken, NJ, USA, 2005. [Google Scholar]
  10. Bruijnzeel, L.A.; Scatena, F.N.; Hamilton, L.S. Tropical Montane Cloud Forests: Science for Conservation and Management; Cambridge University Press: Cambridge, UK, 2011; ISBN 9780511778384. [Google Scholar]
  11. García-Santos, G.; Bruijnzeel, L.A. Rainfall, Fog and Throughfall Dynamics in a Subtropical Ridge Top Cloud Forest, National Park of Garajonay (La Gomera, Canary Islands, Spain). Hydrol. Process. 2011, 25, 411–417. [Google Scholar] [CrossRef]
  12. Amani, M.; Mahdavi, S.; Bullock, T.; Beale, S. Automatic Nighttime Sea Fog Detection Using GOES-16 Imagery. Atmos. Res. 2020, 238, 104712. [Google Scholar] [CrossRef]
  13. Baguskas, S.A.; Clemesha, R.E.S.; Loik, M.E. Coastal Low Cloudiness and Fog Enhance Crop Water Use Efficiency in a California Agricultural System. Agric. For. Meteorol. 2018, 252, 109–120. [Google Scholar] [CrossRef]
  14. Yuan, Y.; Qiu, Z.; Sun, D.; Wang, S.; Yue, X. Daytime Sea Fog Retrieval Based on GOCI Data: A Case Study over the Yellow Sea. Opt. Express 2016, 24, 787. [Google Scholar] [CrossRef] [PubMed]
  15. Wu, D.; Lu, B.; Zhang, T.; Yan, F. A Method of Detecting Sea Fogs Using CALIOP Data and Its Application to Improve MODIS-Based Sea Fog Detection. J. Quant. Spectrosc. Radiat. Transf. 2015, 153, 88–94. [Google Scholar] [CrossRef]
  16. Zhang, S.; Yi, L. A Comprehensive Dynamic Threshold Algorithm for Daytime Sea Fog Retrieval over the Chinese Adjacent Seas. Pure Appl. Geophys. 2013, 170, 1931–1944. [Google Scholar] [CrossRef]
  17. Bari, D.; Bergot, T.; El Khlifi, M. Numerical Study of a Coastal Fog Event over Casablanca, Morocco. Q. J. R. Meteorol. Soc. 2015, 141, 1894–1905. [Google Scholar] [CrossRef]
  18. Obregon, A.; Gehrig-Downie, C.; Gradstein, S.R.; Bendix, J. The Potential Distribution of Tropical Lowland Cloud Forest as Revealed by a Novel MODIS-Based Fog/Low Stratus Night-Time Detection Scheme. Remote Sens. Environ. 2014, 155, 312–324. [Google Scholar] [CrossRef]
  19. Lehnert, L.W.; Thies, B.; Trachte, K.; Achilles, S.; Osses, P.; Baumann, K.; Schmidt, J.; Samolov, E.; Jung, P.; Leinweber, P.; et al. A Case Study on Fog/Low Stratus Occurrence at Las Lomitas, Atacama Desert (Chile) as a Water Source for Biological Soil Crusts. Aerosol Air Qual. Res. 2018, 18, 254–269. [Google Scholar] [CrossRef]
  20. Andersen, H.; Cermak, J.; Fuchs, J.; Knippertz, P.; Gaetani, M.; Quinting, J.; Sippel, S.; Vogt, R. Synoptic-Scale Controls of Fog and Low-Cloud Variability in the Namib Desert. Atmos. Chem. Phys. 2020, 20, 3415–3438. [Google Scholar] [CrossRef]
  21. Parde, A.N.; Ghude, S.D.; Dhangar, N.G.; Bhautmage, U.P.; Wagh, S.; Lonkar, P.; Govardhan, G.; Kumar, R.; Biswas, M.; Chen, F. Challenges in Simulating Prevailing Fog Types Over Urban Region of Delhi. J. Geophys. Res. Atmos. 2024, 129, e2023JD039772. [Google Scholar] [CrossRef]
  22. Hunt, G.E. Radiative Properties of Terrestrial Clouds at Visible and Infra-red Thermal Window Wavelengths. Q. J. R. Meteorol. Soc. 1973, 99, 346–369. [Google Scholar] [CrossRef]
  23. Eyre, J.R.; Brownscombe, J.L.; Allam, R.J. Detection of Fog at Night Using Advanced Very High Resolution Radiometer (AVHRR) Imagery. Meteorol. Mag. 1984, 113, 266–271. [Google Scholar]
  24. Turner, J.; Allam, R.J.; Maine, D.R. AA Case Study of the Detection of Fog at Night Using Channel 3 and 4 on the Advanced Very High Resolution Radiometer (AVHRR). Meteorol. Mag. 1986, 115, 285–290. [Google Scholar]
  25. Bendix, J. A Case Study on the Determination of Fog Optical Depth and Liquid Water Path Using AVHRR Data and Relations to Fog Liquid Water Content and Horizontal Visibility. Int. J. Remote Sens. 1995, 16, 515–530. [Google Scholar] [CrossRef]
  26. Bendix, J.; Bachmann, M. A Method for Detection of Fog Using AVHRR-Imagery of NOAA Satellites Suitable for Operational Purposes. Meteorol. Rundsch. 1991, 43, 169–178. [Google Scholar]
  27. Ellrod, G. Advances in the Detection and Analysis of Fog at Night Using GOES Multispectral Infrared Imagery. Weather. Forecast. 1995, 4, 606–619. [Google Scholar] [CrossRef]
  28. Wetzel, M.A.; Borys, R.D.; Xu, L.E. Satellite Microphysical Retrievals for Land-Based Fog with Validation by Balloon Profiling. J. Appl. Meteorol. 1996, 5, 810–829. [Google Scholar] [CrossRef]
  29. Greenwald, T.J.; Christopher, S.A. The GOES I-M Imagers: New Tools for Studying Microphysical Properties of Boundary Layer Stratiform Clouds. Bull. Am. Meteorol. Soc. 2000, 81, 2607–2620. [Google Scholar] [CrossRef]
  30. Bendix, J.; Thies, B.; Cermak, J.; Nauß, T. Ground Fog Detection from Space Based on MODIS Daytime Data-A Feasibility Study. Am. Meteorol. Soc. 2005, 20, 989–1005. [Google Scholar] [CrossRef]
  31. Bendix, J. A Satellite-Based Climatology of Fog and Low-Level Stratus in Germany and Adjacent Areas. Atmos. Res. 2002, 64, 3–18. [Google Scholar] [CrossRef]
  32. Page, M.J.; McKenzie, J.E.; Bossuyt, P.M.; Boutron, I.; Hoffmann, T.C.; Mulrow, C.D.; Shamseer, L.; Tetzlaff, J.M.; Akl, E.A.; Brennan, S.E.; et al. The PRISMA 2020 Statement: An Updated Guideline for Reporting Systematic Reviews. BMJ 2021, 372, n71. [Google Scholar]
  33. Pranckutė, R. Web of Science (WoS) and Scopus: The Titans of Bibliographic Information in Today’s Academic World. Publications 2021, 9, 12. [Google Scholar] [CrossRef]
  34. van Eck, J.N.; Waltman, L. Manual for VOSviewer, Version 1.6.20; 2023. Available online: https://www.vosviewer.com/documentation/Manual_VOSviewer_1.6.20.pdf (accessed on 13 January 2024).
  35. Fu, D.; Wang, S.; Chen, D.; Pang, H.; Li, P. Comparison Study between Observation and Simulation for Sea Fog over the Yellow Sea in May 2009. J. Ocean Univ. China 2012, 11, 290–300. [Google Scholar] [CrossRef]
  36. Fu, G.; Li, P.; Crompton, J.G.; Guo, J.; Gao, S.; Zhang, S. An Observational and Modeling Study of a Sea Fog Event over the Yellow Sea on 1 August 2003. Meteorol. Atmos. Phys. 2010, 107, 149–159. [Google Scholar] [CrossRef]
  37. Guo, Y.; Xu, T.; Cheng, J.; Wei, G.; Lin, Y. Above- and Belowground Biodiversity Drives Soil Multifunctionality along a Long-Term Grassland Restoration Chronosequence. Sci. Total Environ. 2021, 772, 145010. [Google Scholar] [CrossRef]
  38. Lu, H.; Ma, Y.; Zhang, S.; Yu, X.; Zhang, J. Daytime Sea Fog Identification Based on Multi-Satellite Information and the ECA-TransUnet Model. Remote Sens. 2023, 15, 3949. [Google Scholar] [CrossRef]
  39. Ran, Y.; Ma, H.; Liu, Z.; Wu, X.; Li, Y.; Feng, H. Satellite Fog Detection at Dawn and Dusk Based on the Deep Learning Algorithm under Terrain-Restriction. Remote Sens. 2022, 14, 4328. [Google Scholar] [CrossRef]
  40. Yan, H.; Su, S.; Wu, M.; Xu, M.; Zuo, Y.; Zhang, C.; Huang, B. SeaMAE: Masked Pre-Training with Meteorological Satellite Imagery for Sea Fog Detection. Remote Sens. 2023, 15, 4102. [Google Scholar] [CrossRef]
  41. Zhou, Y.; Chen, K.; Li, X. Dual-Branch Neural Network for Sea Fog Detection in Geostationary Ocean Color Imager. IEEE Trans. Geosci. Remote Sens. 2022, 60, 4208617. [Google Scholar] [CrossRef]
  42. Chen, C.; Zhang, M.; Perrie, W.; Chang, R.; Chen, X.; Duplessis, P.; Wheeler, M. Boundary Layer Parameterizations to Simulate Fog Over Atlantic Canada Waters. Earth Space Sci. 2020, 7, 2019EA000703. [Google Scholar] [CrossRef]
  43. Mahdavi, S.; Amani, M.; Bullock, T.; Beale, S. A Probability-Based Daytime Algorithm for Sea Fog Detection Using GOES-16 Imagery. IEEE J. Sel. Top. Appl. Earth Obs. Remote Sens. 2021, 14, 1363–1373. [Google Scholar] [CrossRef]
  44. Gultepe, I.; Pardyjak, E.; Hoch, S.W.; Fernando, H.J.S.; Dorman, C.; Flagg, D.D.; Krishnamurthy, R.; Wang, Q.; Gaberšek, S.; Creegan, E.; et al. Coastal-Fog Microphysics Using In-Situ Observations and GOES-R Retrievals. Boundary Layer. Meteorol. 2021, 181, 203–226. [Google Scholar] [CrossRef]
  45. Ahmed, R.; Dey, S.; Mohan, M. A Study to Improve Night Time Fog Detection in the Indo-Gangetic Basin Using Satellite Data and to Investigate the Connection to Aerosols. Meteorol. Appl. 2015, 22, 689–693. [Google Scholar] [CrossRef]
  46. Banerjee, S.; Padmakumari, B. Spatiotemporal Variability and Evolution of Day and Night Winter Fog over the Indo Gangetic Basin Using INSAT-3D and Comparison with Surface Visibility and Aerosol Optical Depth. Sci. Total Environ. 2020, 745, 140962. [Google Scholar] [CrossRef] [PubMed]
  47. Saraf, A.K.; Bora, A.K.; Das, J.; Rawat, V.; Sharma, K.; Jain, S.K. Winter Fog over the Indo-Gangetic Plains: Mapping and Modelling Using Remote Sensing and GIS. Nat. Hazards 2011, 58, 199–220. [Google Scholar] [CrossRef]
  48. Singh, M.K.; Gautam, R. Developing a Long-Term High-Resolution Winter Fog Climatology over South Asia Using Satellite Observations from 2002 to 2020. Remote Sens. Environ. 2022, 279, 113128. [Google Scholar] [CrossRef]
  49. Gautam, R.; Singh, M.K. Urban Heat Island Over Delhi Punches Holes in Widespread Fog in the Indo-Gangetic Plains. Geophys. Res. Lett. 2018, 45, 1114–1121. [Google Scholar] [CrossRef]
  50. Cereceda, P.; Larrain, H.; Osses, P.; Farías, M.; Egaña, I. The Spatial and Temporal Variability of Fog and Its Relation to Fog Oases in the Atacama Desert, Chile. Atmos. Res. 2008, 87, 312–323. [Google Scholar] [CrossRef]
  51. Bari, D.; Bergot, T. Influence of Environmental Conditions on Forecasting of an Advection-Radiation Fog: A Case Study from the Casablanca Region, Morocco. Aerosol Air Qual. Res. 2018, 18, 62–78. [Google Scholar] [CrossRef]
  52. Baldocchi, D.; Waller, E. Winter Fog Is Decreasing in the Fruit Growing Region of the Central Valley of California. Geophys. Res. Lett. 2014, 41, 3251–3256. [Google Scholar] [CrossRef]
  53. Haensler, A.; Cermak, J.; Hagemann, S.; Jacob, D. Will the Southern African West Coast Fog Be Affected by Future Climate Change?: Results of an Initial Fog Projection Using a Regional Climate Model. Erdkunde 2011, 65, 261–275. [Google Scholar] [CrossRef]
  54. Pohl, M.J.; Lehnert, L.; Bader, M.Y.; Gradstein, S.R.; Viehweger, J.; Bendix, J. A New Fog and Low Stratus Retrieval for Tropical South America Reveals Widespread Fog in Lowland Forests. Remote Sens. Environ. 2021, 264, 112620. [Google Scholar] [CrossRef]
  55. Pohl, M.J.; Lehnert, L.W.; Thies, B.; Seeger, K.; Berdugo, M.B.; Gradstein, S.R.; Bader, M.Y.; Bendix, J. Valleys Are a Potential Refuge for the Amazon Lowland Forest in the Face of Increased Risk of Drought. Commun. Earth Environ. 2023, 4, 198. [Google Scholar] [CrossRef]
  56. Schulz, H.M.; Thies, B.; Chang, S.C.; Bendix, J. Detection of Ground Fog in Mountainous Areas from MODIS (Collection 051) Daytime Data Using a Statistical Approach. Atmos. Meas. Tech. 2016, 9, 1135–1152. [Google Scholar] [CrossRef]
  57. Schulz, H.M.; Li, C.F.; Thies, B.; Chang, S.C.; Bendix, J. Mapping the Montane Cloud Forest of Taiwan Using 12 Year MODIS-Derived Ground Fog Frequency Data. PLoS ONE 2017, 12, E0172663. [Google Scholar] [CrossRef]
  58. Garland, R.M.; Altieri, K.E.; Dawidowski, L.; Gallardo, L.; Mbandi, A.; Rojas, N.Y.; Touré, N.E. Opinion: Strengthening Research in the Global South—Atmospheric Science Opportunities in South America and Africa. Atmos. Chem. Phys. 2024, 24, 5757–5764. [Google Scholar] [CrossRef]
  59. Yi, L.; Li, K.F.; Chen, X.; Tung, K.K. Arctic Fog Detection Using Infrared Spectral Measurements. J. Atmos. Ocean. Technol. 2019, 36, 1643–1656. [Google Scholar] [CrossRef]
  60. Wang, J.L.; Li, S.M.; Liu, X.L.; Wu, X.J. An Analysis of the Fog Distribution in Beijing for the 2001-2005 Period Using NOAA and FY Data. Atmos. Res. 2010, 96, 575–589. [Google Scholar] [CrossRef]
  61. Guo, J.; Xu, J.; Xu, X. An Observational and Modeling Study of a Sea Fog Event over the Yellow and East China Seas on 17 March 2014. Trop. Cyclone Res. Rev. 2021, 10, 182–190. [Google Scholar] [CrossRef]
  62. Kim, Y.; Ryu, H.S.; Hong, S. Data-to-Data Translation-Based Nowcasting of Specific Sea Fog Using Geostationary Weather Satellite Observation. Atmos. Res. 2023, 290, 106792. [Google Scholar] [CrossRef]
  63. Ball, L.; Tzanopoulos, J. Interplay between Topography, Fog and Vegetation in the Central South Arabian Mountains Revealed Using a Novel Landsat Fog Detection Technique. Remote Sens. Ecol. Conserv. 2020, 6, 498–513. [Google Scholar] [CrossRef]
  64. Li, H.J.; Lo, M.H.; Juang, J.Y.; Wang, J.; Huang, C. Assessment of Spatiotemporal Dynamics of Diurnal Fog Occurrence in Subtropical Montane Cloud Forests. Agric. For. Meteorol. 2022, 317, 108899. [Google Scholar] [CrossRef]
  65. Egli, S.; Thies, B.; Bendix, J. A Hybrid Approach for Fog Retrieval Based on a Combination of Satellite and Ground Truth Data. Remote Sens. 2018, 10, 628. [Google Scholar] [CrossRef]
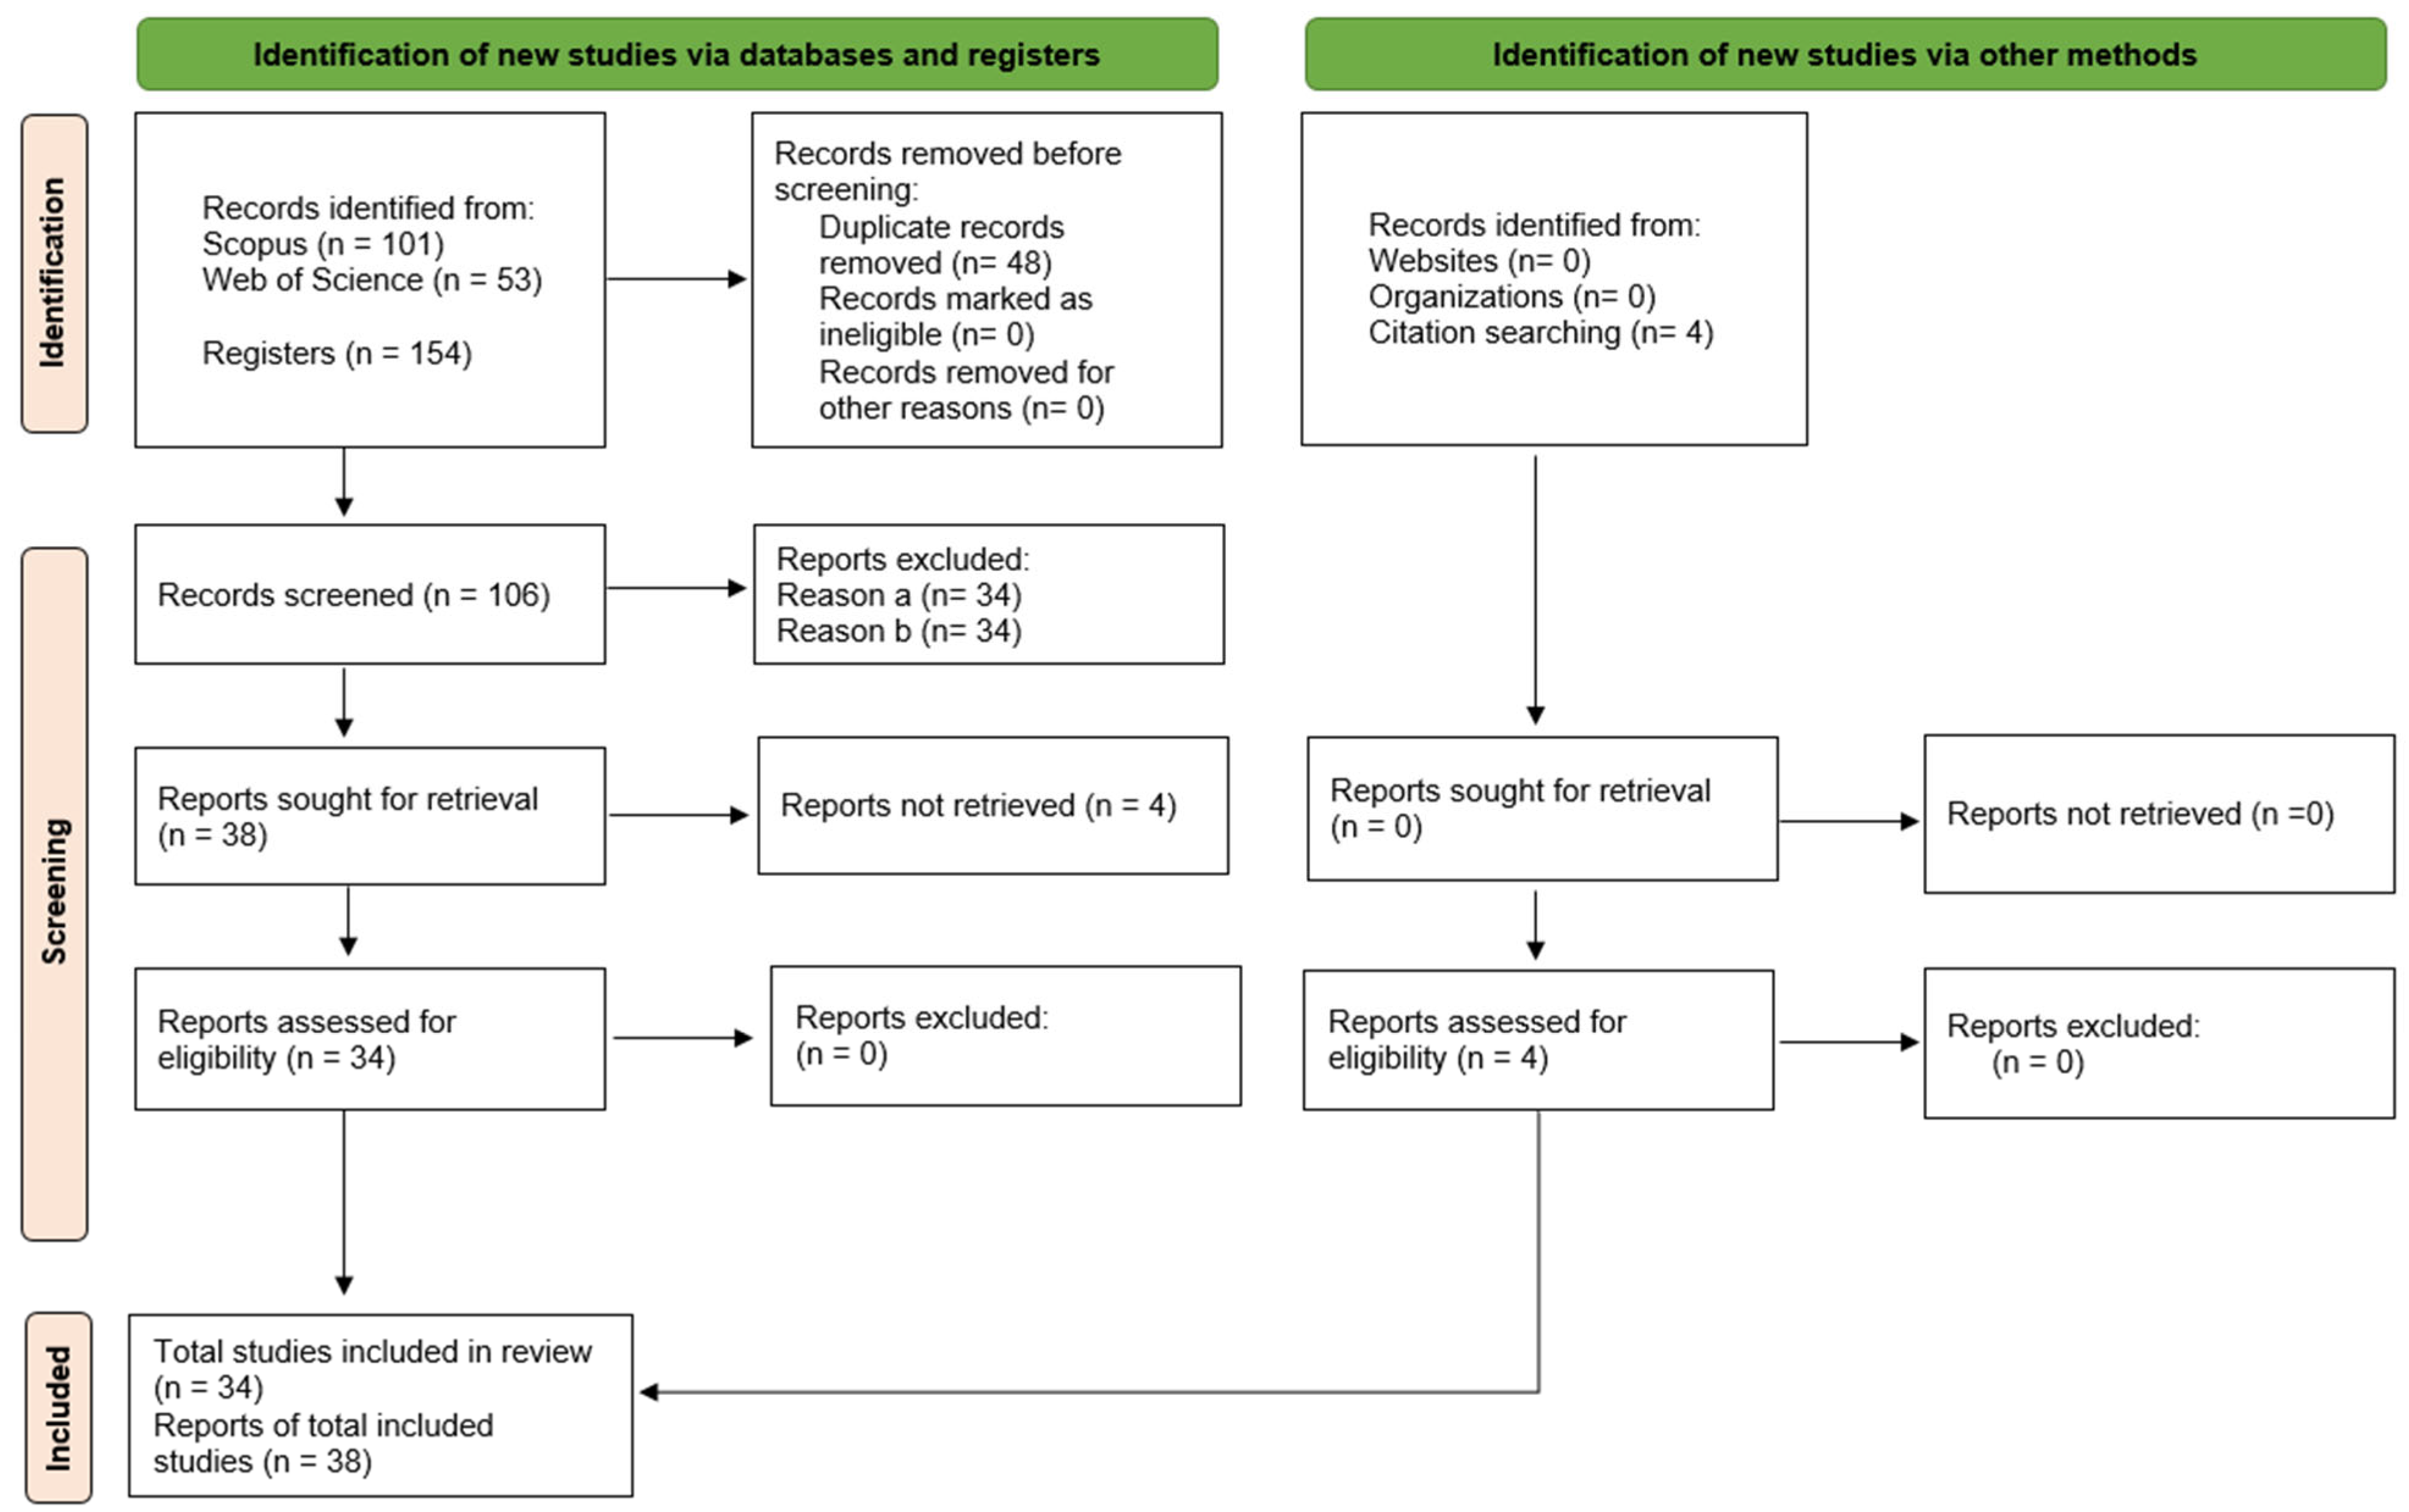
Figure 1. Flowchart of paper selection for the review. Source: Adapted from [32].
Climate 13 00110 g001
Figure 2. Distribution of the number of publications by the country of the lead author of each paper.
Climate 13 00110 g002
Figure 3. Distribution of studies by year of publication.
Climate 13 00110 g003
Figure 4. Network visualization map based on text data.
Climate 13 00110 g004
Figure 5. Network visualization map with the overlay of paper publication years.
Climate 13 00110 g005
Figure 6. Thematic connections of the term brightness temperature.
Climate 13 00110 g006
Table 1. Query parameters used in the Scopus and Web of Science databases.
DatabaseKeywords
Scopus:TITLE-ABS-KEY (“fog water” OR “fog interception” OR “fog characteristic” OR “fog intensity” OR “fog event” OR “fog occurrence” OR “fog formation” OR “fog frequency”) AND TITLE-ABS-KEY (“remote sensing” OR “satellite imagery” OR “remote-sensing” OR “hyperspectral” OR “GIS” OR “image enhancement” OR “remote sensing images”) AND (LIMIT-TO (DOCTYPE, “ar”))
Web of Science:(TS = (“fog water” OR “fog interception” OR “fog characteristic” OR “fog intensity” OR “fog event” OR “fog occurrence” OR “fog formation” OR “fog frequency”)) AND (TS = (“remote sensing” OR “satellite imagery” OR “remote-sensing” OR “hyperspectral” OR “GIS” OR “image enhancement” OR “remote sensing images”)) AND (DT = (“ARTICLE”))
Disclaimer/Publisher’s Note: The statements, opinions and data contained in all publications are solely those of the individual author(s) and contributor(s) and not of MDPI and/or the editor(s). MDPI and/or the editor(s) disclaim responsibility for any injury to people or property resulting from any ideas, methods, instructions or products referred to in the content.