Abstract
The present contribution addresses the Heat Waves (HWs) which occurred in Portugal’s mainland during the first 24 years of the XXI century: the number of HWs, their frequency, duration and geographic localization, among other impacts, are described. In a complementary perspective, due to the significant impacts of the 2003 HW, specifically in terms of mortality, a more detailed analysis of this event is performed. For the present analysis, HWs were identified using a modified version of the Heat Wave Duration Index (HWDI) proposed by the World Meteorological Organization (WMO). During the XXI century, between 2001 and 2024, 95 HWs occurred in the Portuguese mainland. In 2024, eight HWs occurred, followed by 2009, 2015 and 2017, with seven HWs each; in terms of monthly distribution, August (17) and May (16) displayed the highest values. HWs are now included in the World Health Organization agenda of natural hazards, enhancing the importance of these events. It is time to start considering HWs and their significant impacts as an important issue, especially in countries with older populations, like Portugal.
1. Introduction
Climate change and global warming are no longer discussed as future and uncertain projections; on the contrary, they are now undeniable facts closely linked to extreme weather events, which are expected to increase sharply in the future. The room for doubt about global warming has disappeared. Over time, with increasing warnings about climate change, the arguments for neglecting potential risks have come to an end. It is now time to face the dangers and to deal with the consequences.
Undoubtedly, we live in an increasingly hotter world, which is prone to triggering Heat Waves (HWs), which are becoming increasingly frequent. The Intergovernmental Panel on Climate Change (IPCC) predicts that hot seasons will get even hotter due to global climate change. Worldwide, HWs are now a part of our everyday life. According to the World Health Organization, across the world, between 1998 and 2017, more than 166,000 people died due to HWs.
In this period, the HW that spanned Europe during the summer of 2003 caused a very significant excess of deaths, namely in France (14,802), Italy (3134), England and Wales (20,145), and in Portugal (2003). In the case of Portugal, around 95% of the excess of deaths were of people over 65 years old [1]. The World Health Organization (WHO) and the World Meteorological Organization (WMO) published a report highlighting that the 2003 European HW was one of the most serious in terms of mortality. The WHO decision to include HWs among the group of the most dangerous natural disasters is a very clear recognition of their damaging potential. Furthermore, in 2022, the WMO at COP27 and the Sendai Risk Reduction Framework mandated an “Early Warnings for All” framework, in which four main weather hazards (i.e., storms, floods, droughts and HWs) must be covered by a global Early Warning System by 2027 [2,3,4].
In 2010, 11,000 excess deaths were observed during a two-week HW in Moscow [5,6]. In 2016, during a HW that scorched the Middle East for months, temperatures in Iraq surpassed 37 °C in May, 43 °C in June and 48 °C in July; on most days, temperatures dropped below 37 °C only overnight. In Africa, HWs in the period between 1981 and 2015 were addressed by [7]; also in Africa, the year 2019 saw the strongest HW in terms of intensity and duration since 1981 [8]; in addition, the effects of extreme heat on human health in tropical Africa were assessed by [9]. An outstanding HW occurred in Israel in May of 2019; extremely high temperatures were recorded on the 23rd and 24th, some of them record-breaking; on 23 May, temperatures reached 43–45 °C in many places. In China, the 2022 summer brought three HWs that have buckled roads, melted tar, and popped off roof tiles; the Shanghai Xujiahui Observatory, where records have been kept since 1873, recorded its highest temperature ever: 40.9 °C on 13 July; high humidity and dewpoints, along with warm overnight temperatures, created potentially deadly conditions [10]. According to a study performed in six US states, HWs are becoming more frequent and may acutely increase the risk of stillbirth, a rare and severe pregnancy outcome [11]. In 2018, more than 220 million vulnerable people were exposed to HWs [12].
Unfortunately, this is not a story or a bad dream—these events and numbers reflect facts that are becoming increasingly common and widely distributed all over the five continents. In this case, almost uniquely, no one is being left behind; humankind, as a whole, will have to face and deal with all the upcoming consequences. The impact of HWs on our societies will be so widespread that it is difficult to predict the outcome.
Heat waves can occur anytime across the year, but their impacts are much more harmful in summertime. The high air temperatures commonly associated with HWs can lead to heat stress conditions, which is a growing risk for people around the world [4,13], thus affecting human health. According to the International Labour Organization [14], in all regions of the world, climate change is already having serious impacts on the safety and health of workers. Even when working conditions are hard and dangerous, the option of stopping work is often not available to workers, so they are among those most exposed to climate change hazards, thus facing increasing mortality and morbidity in occupational settings. In addition, in their report on “Ensuring safety and health at work in a changing climate”, published in 2024, ILO estimates that more than 2.4 billion workers, of a global workforce of 3.4 billion, might be exposed to excessive heat. Moreover, the latest report of the United Nations Office for Disaster Risk Reduction [15], states that heat stress is causing impacts on health and economies, and that heat stress will cost USD 2.4 billion in lost productivity by 2030, the equivalent of 80 million full-time jobs, assuming a 1.5 °C global temperature increase. So, we might wonder how much of the cost remains uncounted. In agriculture, for instance, an assessment was performed by [16], and concluded that, without adaptation, labour output would be reduced in large parts of the world. It might be impossible to assess or even to estimate productivity losses due to heat stress. However, these examples represent attempts that are being made. In tourism, an activity sector with a significant impact on the gross domestic product of many countries, including Portugal, frequent HWs may reduce tourist flows by the mid XXI century [17].
In a complementary perspective, global warming also has its impacts on energy demand [18], which has been increasing consistently; in the USA, these increased energy requirements might cause blackouts that are being linked with an amplified risk of mortality and morbidity [19]. Energy demands, as well as impacts on human health, agriculture, water resources, regional economies, and forest ecosystems were analysed by [20] during the first 20 years of the XXI century, in a study about the biometeorology of HWs and warm extremes in Europe. They concluded that the current climate models suggest an increase in the frequency, duration, and intensity of HWs in the future, thus with devastating effects on those different systems.
Therefore, interactions between global warming, occurrence of HWs and risk of occupational heat stress in many activities are expected to rise significantly in the coming future. As stated by [4], extreme heat is an important aspect of global warming and our changing climate. Furthermore, both the scientific community and most of the population now recognize that HWs lead to an excess of deaths and health effects. The United Nations Office for Disaster Risk Reduction [21], states that HWs have increased faster than all other types of climate-related disasters in the last two decades; between 1980–1999 and 2000–2019, globally, HWs increased by over 230%. As shown in Figure 1, among the regions most affected, both in terms of occurrences and severity of impact, Eastern and Western Europe and Eastern and Western Asia have been the hardest hit.
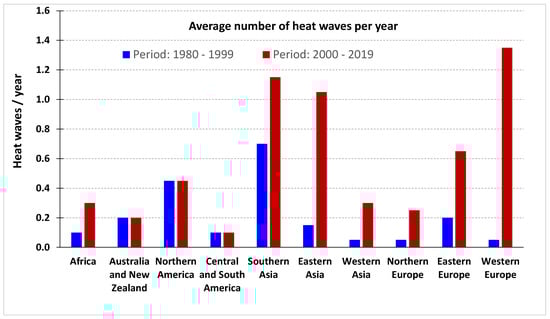
Figure 1.
Average number of heat waves per year, between 1980–1999 and 2000–2019, declared by state authorities. Data obtained from Emergency Events Database (EMDAT), available at: https://public.emdat.be (accessed on April 2025).
In recent years, all over the world, these phenomena have been documented and extensively monitored and studied [22,23,24,25,26,27]. Even in the specific context of the COVID-19 pandemic, challenges for the healthcare systems and for high-risk groups for heat-related health problems as well as for high-risk COVID-19, were addressed by [28].
In the authors’ opinion, the mentioned interactions, despite being commonly studied in isolation, will have to be considered through complementary assessments. The present contribution represents the outcome of the first preliminary studies in the field carried out by the authors [29,30,31] now enhanced with a more detailed and comprehensive analysis. Therefore, the HWs that occurred in the Portuguese mainland in the XXI century during the 2001–2024 period are addressed; their number is defined under a modified version of the HWDI, and their frequency, duration and geographic localization are detailed. Furthermore, the mortality associated with HWs is also addressed, particularly for the 2003 HW.
2. Materials and Methods
Heat waves generally correspond to the exceedance of predefined temperature thresholds over a period of several days, with great variations in the definitions and a lack of international consensus on how a heat wave should actually be defined [32,33,34]. While there is no agreed international definition, HWs and warm spells are periods characterised by several days of very warm temperatures compared to local or regional averages; in a warm spell, the temperatures are not as high as in a HW, a term that is used in exceptional circumstances. Different regions and countries may use varying thresholds for HWs based on local impacts [35]. A summary list of HW definitions can be found elsewhere [36,37,38].
In fact, a universal definition of Heat Wave (HW) has not yet been established, which is understandable due to the wide range of geographic and climatic characteristics across the globe; one commonly considered by the World Meteorological Organization (WMO) (https://public.wmo.int/en, 29 December 2024), called Heat Wave Duration Index (HWDI), is that a HW occurs when “for a period of at least five consecutive days, the maximum air temperatures are 5 °C higher than the average maximum temperatures in the reference period”. This index was assumed by the Portuguese meteorological service [IPMA—Instituto Português do Mar e da Atmosfera; Portuguese Institute for Sea and Atmosphere (www.ipma.pt, 29 December 2024)], but considering a period of six days, instead of five. The average maximum temperature refers to the average for both time of the year, (i.e., days of a given month under HW) and geographic location. This modified version of the HWDI was considered for the present analysis.
According to the information disclosed by IPMA, in Portugal there are 68 meteorological weather stations spread across the country. These weather stations are almost evenly distributed: 23 in the north, 21 in the centre, 19 in the south (plus two in Madeira and three in the Azores islands). For each of them, IPMA publishes a formal document called “Climate Normal”, which refers to a given climatic element (like the mean value of the maximum daily air temperature, the mean value of the minimum daily air temperature, the mean value of the average daily air temperature, among others), at those 68 places. In the case of maximum temperature, the daily maximum temperatures during a month are considered, and thus a monthly average is obtained. In addition, the World Meteorological Organization (WMO) establishes that a number of years large enough to be considered as representative of the prevailing value of that element at the place under consideration should be taken for reference (in the present analysis, 30 years are considered); in short, for each month, the average value of the daily maximum temperatures is considered, and then the average of the 30 years is calculated. This is the value defined in the “Climate Normal” formal document and represents the threshold value to establish the criterion to define a HW. Thus, for a given meteorological weather station and for a given month, the threshold value is obtained from the Climate Normal document; finally, whenever for a period of at least six consecutive days, the maximum air temperatures in that weather station are 5 °C higher than the threshold value of that month, that weather station is considered in HW. It takes only one weather station in HW to be counted as a HW in Portugal, and if two different weather stations are in HW but the dates overlap, only one HW is counted; such a reduced number of weather stations in HW is rare, but it might occur.
To give an insight into Portuguese climate evolution, the IPMA’s Annual Climatology Bulletins release data for each year (including the period under analysis, 2001–2024) highlighting the mean temperature deviations from the normal (called “zero line”), assumed as the average weather in the period 1971–2000 [39]. Those data show that 16 of the first 24 years of the XXI century have a positive temperature deviation. Only 2001, 2002, 2008, 2010, 2012, 2013, 2018 and 2019 show values below the “zero line”. We might add that the awareness that the average temperature in Portugal is increasing has become common sense, but data from the IPMA covering a large and representative period, namely between 1931 and 2024, do not leave any doubts. Consequently, the occurrence of HWs is expected to become much more frequent.
3. Results
During the 2001 to 2024 period, 95 HWs occurred in the Portuguese mainland. It must be emphasized that the HWDI is not specifically addressed; otherwise, the definition given to it by the Portuguese meteorological service is considered. If the definition of the HWDI proposed by the WMO was adopted, the number of HWs might, obviously, be different. Additionally, both approaches represent a criterion for the existence or non-existence of a HW. So, the present results are addressed in terms of the official number of HWs considered in Portugal. Figure 2a shows their absolute frequency and highlights that in the years of 2001, 2002, 2004, 2007 and 2008 no HWs occurred, while in 2009, 2015, 2017, 2020 and 2023 seven HWs were registered, followed by 2022 with six and by 2011, 2012, 2016 and 2018 with five events each. The year 2024 was the hottest ever recorded: accordingly, last year, a new absolute record was beaten and in 2024 eight HWs were officially registered. After 2009, i.e., in the last fifteen years considered in this work, in every year at least three HWs occurred in the Portuguese mainland.
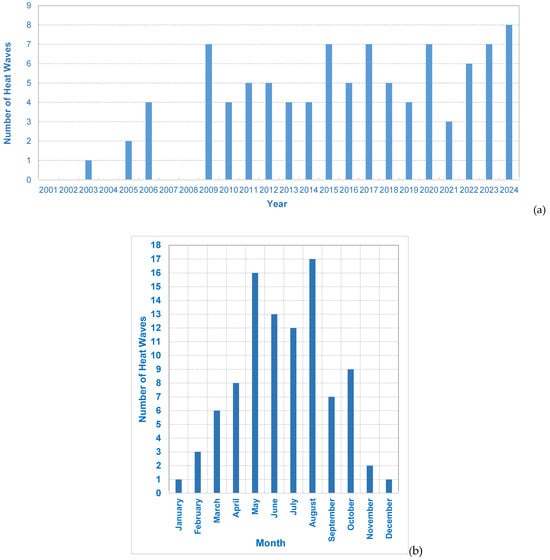
Figure 2.
Absolute frequencies of heat waves in the Portuguese mainland during the 2001–2024 period, aggregated (a) by year, (b) by month. Data obtained from [39].
Moreover, Figure 2b depicts the 95 HWs in terms of monthly occurrences, showing that August and May had the highest values with 17 and 16 HWs, respectively. It is important to point out that a HW might begin in a certain month and end in the next; in the present analysis, that happened sometimes, and the respective HWs were allocated to the beginning month. For instance, of the HWs counted as occurring in May, some were prolonged to June, while others occurred exclusively in May, namely in the years of 2009, 2010, 2011, 2012, 2015 and 2017. In terms of occurrences, June (13) and July (12) come next. Therefore, we can conclude that, during the period March–September, i.e., in the spring (20 March–20 June) and summer (21 June–21 September), Portugal’s mainland is very prone to heat waves; during these seasons, 83.2% of the HWs have occurred, while the remaining 16.8% have occurred in the autumn (22 September–20 December) and winter (21 December–19 March).
There are some peculiarities to the two HWs that occurred in November and to the one that occurred in December. In the case of the former, the first happened in 2015 (6–14 November) and the second in 2017 (16–24 November); 2015 was the 7th hottest year since 1931 and the 2nd since 2000, and November 2015 was the hottest November in 34 years, i.e., in the period 1981–2015, with a maximum air temperature of 28.5 °C, measured in the village of Pegões, in the south of Portugal; 2017 was the 2nd hottest year since 1931, and Autumn 2017 was the 5th hottest since 2000, with a maximum air temperature of 26.2 °C, also measured in the village of Pegões. In the HW of December, that started on the 26th of December and finished on the 3rd of January 2022, the absolute minimum value measured during the HW was registered in Mirandela, in the north) (−7.5 °C); in December, the maximum air temperature value was 26.4 °C (in Zambujeira, in the south) and the corresponding value in January was equal to 24.5 °C (also in Zambujeira).
Figure 3a–c shows the absolute maximum and the absolute minimum air temperature (Ta) values registered in Portugal’s mainland during each month of every HW. It should be mentioned that the absolute monthly values were not necessarily obtained during a HW period, in fact that happened more often in the case of the absolute minimum values. As mentioned before, some HWs started in a given month and finished in the next; in these cases, the maximum and the minimum Ta values are listed for both months. For instance, the 1st HW of 2005 started at the end of 30 May and finished in 11 June, so both maximum and minimum values are shown [May (Tamax = 35.2 °C, Mirandela, in the north of Portugal, 26th; Tamin = 0.6 °C, Penhas Douradas, in the north, 16th); June (Tamax = 42.0 °C, Alvega, in the centre, 17th; Tamin = 6.0 °C, Montalegre, in the north, 8th June)]. Therefore, the reference code adopted for the “X” axis puts in evidence, in the first part, the month of the HW (1st number), followed by the year; thus, for the mentioned 2005 HW, the codes “5:2005” and “6:2005” refer to May and June of 2005, respectively, and two pairs of Tamax and Tamin values are presented.
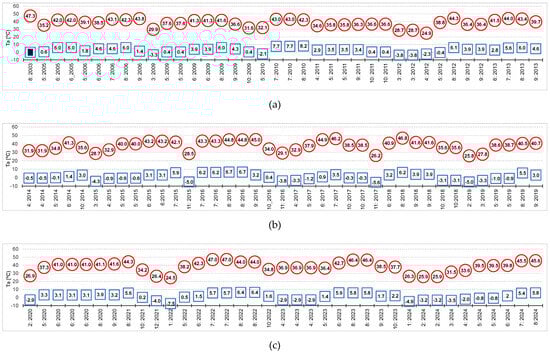
Figure 3.
Maximum (O) and minimum ( ) air temperature values registered in Portugal’s mainland during each month(s) [first number(s)] of every HW. (a) HWs from 2003–2013; (b) 2014–2019; (c) 2020–2024. Data obtained from [39].
) air temperature values registered in Portugal’s mainland during each month(s) [first number(s)] of every HW. (a) HWs from 2003–2013; (b) 2014–2019; (c) 2020–2024. Data obtained from [39].
The absolute maximum value was 47.3 °C, a value that still represents the maximum value measured in Portugal (2003, 1st of August); 44.7% of the maximum temperatures were higher or equal to 40 °C and 74.6% were higher or equal to 35 °C, a value that is often admitted as the lower limit of a high-temperature living environment. The absolute minimum value was equal to −7.5 °C (3rd HW of 2021, that started on the 26th of December and finished on the 3rd of January 2022). Finally, Figure 3 presents a broad perspective of the maximum and minimum temperatures during the Portuguese HWs. Particularly in the case of the summer HW, it also represents a portrayal of the severity of the HW, with maximum temperatures often above 40 °C.
To provide a complete overview of the XXI century Portuguese HWs, Table 1 shows the period of each HW, with the district (see Figure 4) and date of occurrence of the maximum and minimum air temperature values. In this case, for HWs that occurred in two different months, only the absolute maximum and the absolute minimum registered during the HW are detailed (if the maximum and the minimum values of the HW that occur in two months were listed, as well as the specific places of occurrence, the length of the table would increase even more, without additional relevant information). The reference code in Table 1 is similar to the one adopted for Figure 3, but whenever a HW occurs in two months, the respective two numbers are specified [e.g., HW of 7 July 2003 + 8 August 2003].

Table 1.
Maximum and minimum air temperature values in Portugal’s mainland: HW period and district of occurrence.
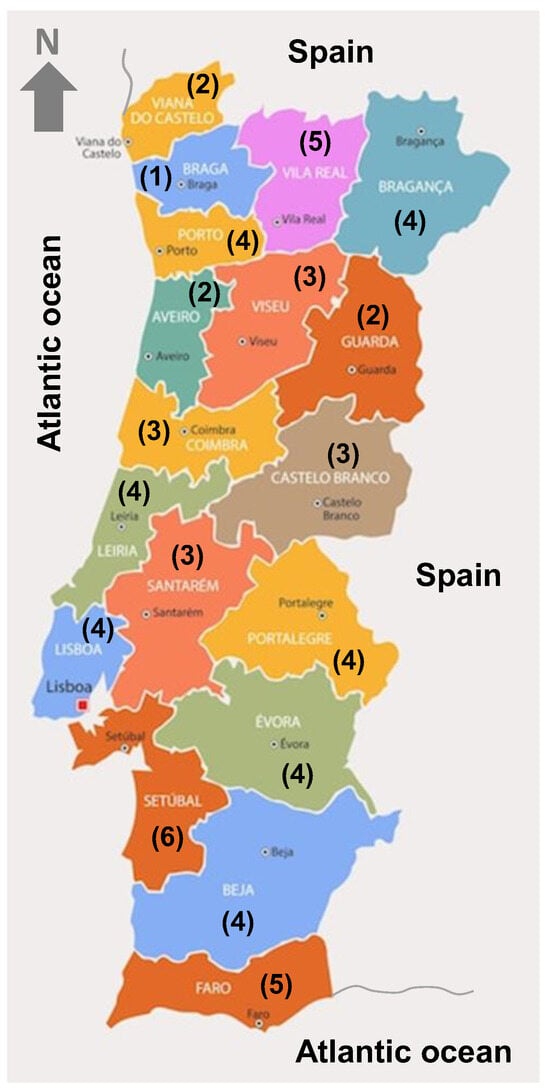
Figure 4.
Districts of Portugal and respective number of weather stations.
Figure 4 shows the map of the Portuguese mainland, with its formal division into districts, and the respective number of meteorological weather stations. For the present purposes, it was considered that Portugal is divided into three regions: North, with eight districts (Viana do Castelo, Vila Real, Bragança, Braga, Porto, Aveiro, Viseu and Guarda); Centre, with six districts (Coimbra, Leiria, Castelo Branco, Lisboa, Santarém and Portalegre); and South, with four districts (Setúbal, Évora, Beja and Faro). As mentioned before and shown in detail in Figure 4, the meteorological weather stations are quite evenly distributed across the country.
The importance of a given HW can be justified based on different criteria. Still, in Portugal the excess of deaths, i.e., the difference between the observed and expected number of deaths, is used to demonstrate its relevance [40,41]. Under this context and since records began, the 1981 (10–20 June), the 1991 (10–18 July), the 2003 (29 July–15 August), and the 2022 (2–18 July) HWs are commonly highlighted; the 1981 HW was associated with an excess of deaths of around 1900 [40], the 1991 HW was responsible for an excess of about 1000 deaths [42], and the 2003 HW registered an excess of deaths of around 2000 [1,41].
The 2003 HW was the longest that occurred in Portugal since 1941 [39] with very significant impacts; it started on 29th July and ended on 15th August (17 days) and its geographic distribution affected the interior north and central and part of the southern region of the Portuguese mainland. Therefore, these facts justify a more comprehensive analysis of the 2003 HW in the Portuguese mainland.
Figure 5 depicts the maximum daily temperatures measured in meteorological weather stations, located in the main cities of the 18 districts of the mainland of Portugal, during the 2003 HW. Three different symbols are used—triangles, squares and circles—to distinguish the north, centre and south Portuguese districts, respectively. This representation highlights that in the south region, namely in Évora and Beja, the temperatures are typically higher (Faro, located on the south coast, is an exception). Moreover, in the north of Portugal, the temperatures are usually lower. Among the 339 values available, approximately 21% (72 values) are equal or higher than 30.0 °C and lower than 35.0 °C, while ≅56% (190 values) are equal or higher than 35.0 °C. During this HW, the highest value recorded in the main city of a given district was 45.4 °C (Beja, 1st of August); however, during this event, the highest value recorded in Portugal was 47.3 °C (1 August 2003, Amareleja, district of Beja). This score still represents the highest value ever measured in Portugal (www.ipma.pt, 29 December 2024) up until today. The highest minimum temperature during the 2003 HW was measured in Portalegre (30.7 °C), also on August 1st, a value that corresponds to the highest minimum temperature ever measured in that city. The minimum temperatures were higher than 25 °C in most of the country and, in some places, even higher than 30 °C, as in Proença-a-Nova (district of Castelo Branco), Caramulo (district of Viseu) and Portalegre [43].
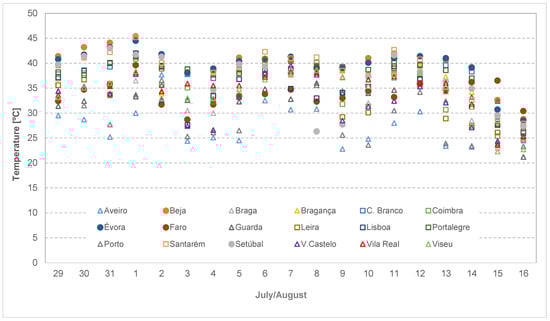
Figure 5.
Maximum daily temperatures of the main cities of the 18 districts of Portugal’s mainland during the 2003 HW (adapted from [1,41]).
Seven districts (Beja, Bragança, Castelo Branco, Évora, Guarda, Vila Real, and Viseu) had 16 consecutive days or more with maximum temperatures higher than 32 °C; also, Beja, Évora, Santarém and Setúbal had four or more days with maximum temperatures higher than 40 °C [41].
The occurrence over a significant period of time of temperatures higher than 35 °C can be associated with the number of deaths. During the entire year 2003, 108,795 deaths occurred in the country (Portuguese mainland + Azores and Madeira islands) (www.pordata.pt, 29 December 2024), and 6669 of them happened between 29 July and 15 August, which means that approximately 6.13% of the deaths took place in those 18 days (4.93%) of the year; Lisboa was the district with the highest number of occurrences. In that year, at the European level, Germany was the country with the highest number of deaths, followed by Italy and France; Portugal was placed in the 11th position (www.pordata.pt, 29 December 2024). Figure 6a shows the geographic distribution of the HW (the different colours represent different durations of the HW depending on its location) and Figure 6b depicts the daily deaths in the entire country during the 2003 HW and shows that the mean value of deaths in 2003 was 298.1 per day (grey line in the graph), a value that was not exceeded only in the first three days and in the last day of the HW.
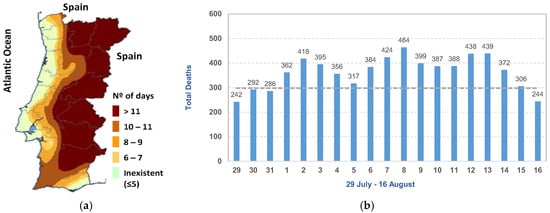
Figure 6.
July–August 2003 Heat Wave: (a) duration (adapted from [39]); (b) deaths in the entire country (Portuguese mainland + Azores and Madeira islands). Portuguese mainland: Latitude [≅36°6′–42°9′ N]; Longitude [≅6°1′–9°3′ W].
The results show that the highest values were 418 (2 August), 424 (7 August), 464 (8 August), 438 (12 August) and 439 (13 August), obtained in the middle of the HW. Accordingly, if we compare the data of the years 2000 and 2001 in July and August (1 July–30 August) with the corresponding period of 2003, we conclude that the daily number of deaths in 2000 and 2001 were relatively stable, between 200 and 300 [1,41], thus highlighting the significant increase in deaths during the 2003 HW.
4. Discussion
Figure 2a shows that 7/95 of the HWs occurred between 2001 and 2008 and that 88/95 occurred after 2009. Thus, we might argue about whether a major change is happening in the frequency of HWs after 2009 and whether this corresponds to a new trend. This scenario can be linked with [44,45], who stated that Portugal has been identified as a climate change hotspot, exposing human and natural systems to new sources of risk. In France, since 2015, HWs have been observed every year, a pattern without historical precedent [6]. In addition, if we look at Figure 2b, we also might wonder if the surveillance period for HWs should be extended in order to include the spring and the autumn seasons, despite being more common and severe in the summer. In France, temporal changes are happening, with events observed early in June for the first time in 2015, then 2017 and 2019, and late in September for the first time in 2016 [6].
Despite the brief references to France, mentioned just to stress that Portugal is not a single case, the results observed in Portugal highlight that, under the present definition of HWs, this kind of event can occur in any time of the year, but its impacts on the population are much higher in summertime; it also highlights that the definition of HWs adopted by the Portuguese meteorological organization (www.ipma.pt, 29 December 2024) is more related to studies and analysis of climatic variability than to the impacts of high temperatures in public health. Once again, it is important to remember that the definition adopted by IPMA differs slightly from the official HWDI definition and that different HW definitions are being used in different studies [27,33,43,46,47,48,49,50,51,52]. Moreover, despite not being an exhaustive analysis, Table 2 shows a sample of studies that address different aspects of HW impacts on a human being, namely in terms of vulnerability, health, death, and productivity, but also in terms of buildings overheating, energy and water consumption, agriculture and livestock production, forests and wild animals. Besides underlining that HWs are a global phenomenon, the goal is to demonstrate that the consequences of HWs are spread across a myriad of aspects of our everyday lives. Only studies within the period under analysis (2001–2024) and which address at least two aspects of impacts were considered.
Table 2.
Studies (●) on the impacts of HWs and their mitigation.
Among those different impacts, the assessment of HW mortality represents one of the most frequently highlighted topics. The 2003 HW already mentioned in the previous section hit Portugal hard, but also affected several European countries; [71] point out that, in 2003, an excess of deaths occurred in France (14,800) only between the 1st and the 15th August [6,72], in Italy (3134) and in England and Wales (20,145) and, according to [28,73], seventy thousand deaths in Europe were claimed due to the 2003 heat wave. This major event drew the attention of the World Health Organization (WHO) and now HWs are included in the agenda of natural hazards (https://public.wmo.int/en, 29 December 2024). The World Meteorological Organization (WMO) and the World Health Organization (WHO) even published a report that states that the European heatwaves in the northern hemisphere during the summer of 2003 were responsible for the deaths of tens of thousands of people [43].
The last severe HW that occurred in Portugal was in 2022, between the 2nd and the 18th of July; the mean value of deaths during the HW was 363, higher than the mean value of deaths in that July (346) and much higher than the mean value of deaths in July of the previous (284) and of the following (280) years. According to the Portuguese meteorological service, the highest number of days in HW was 918, which occurred in the summer of 2022; this value represents the sum of all days of all weather stations during the four HWs of the 2022 summer. With the exception of the coastal regions of Portugal, almost all territory was affected, with higher impacts observed in the inland regions, particularly in the northeast (in the summer of 2003, the number of days in HW was 687). The highest value of the maximum air temperature was 47.0 °C, which occurred at the Pinhão (district of Viseu) weather station, on the 14th; this value represents a new July extreme in the Portuguese mainland. Moreover, between the 7th and 14th of July, 98 new records of maximum air temperature were achieved, with the highest number of absolute records on the 14th. If we now look at the number of deaths in July, between 2001 and 2023, July 2022 registered the highest number of deaths (10,698), followed by July 2020 (10,393). The 2022 HW was also analysed in Spain [74] and in a broader European context by [63]. Finally, and according to the European State of the Climate—Summary of 2022, summer HWs led to a record number of days with very strong heat stress in southern Europe.
One characteristic of the HWs is the occurrence of high minimum temperature values during the night. This topic has already been emphasised by the IPCC which stresses that hot days, HWs and tropically warm nights are already occurring and will continue to occur more frequently and for longer periods [13,75]. In general, HWs with tropically warm nights impose greater strain on the human organism, and they are particularly stressful for the old and chronically ill [28,61,76,77]. Therefore, despite the higher attention usually given to maximum temperatures, the authors also wish to stress the extra burden caused by higher minimum temperatures; as stated, these values can be as high as 30 °C, such as the ones observed in the 2003 HW in Portugal.
Table 3 lists the Observed (OD), Expected (ED) and Excess of Deaths (EoD) in the 18 districts of Portugal’s mainland between 30 July and 15 August of 2003. The excess of deaths is an estimated parameter, obtained by comparison between the deaths observed and the number of deaths expected if the population had been exposed to the average rate of mortality. According to [26], excess mortality refers to the number of deaths that exceed what would be expected during a specific period, often compared to historical data or a baseline. Following the study published by the Portuguese General Health Directorate (DGS) and the National Health Institute’s Dr. Ricardo Jorge (INSA) (DGS-INSA, 2004), the biennium 2000–2001 was considered the most adequate period for that comparison. However, others were addressed, namely the five-year period 1997–2001, the year 2001 and the period between 12 and 28 of July 2003. These other periods have shown estimated excess of deaths that varied between 1848 and 2229 [1].
Table 3.
Observed, Expected and Excess of Deaths in the 18 districts of Portugal’s mainland during 30 July and 15 August 2003 (adapted from [1]).
During the mentioned period (30 July–15 August) of the 2003 HW, 6452 individuals died (3490 women and 2962 men) [41]. The excess of deaths associated with the HW was 2009.8—a value that corresponds to a relative excess of 45% of the expected deaths in that period [39,41]–1340.8 women and 662.7 men [1]. This shows that women are more vulnerable to heat; only in three districts (Aveiro, Braga and Vila Real) was the number of men who died higher than the number of women. In Spain, according to [78], the 2003 HW was responsible for an estimated excess mortality of 3166 deaths, while more recently, in 2022 and 2023, the excessive heat mortality was 3012 deaths over a period of 28 days, and 2155 over a period of 18 days, respectively. As mentioned before, [63], addressed the 2022 HW and estimated over 60 thousand deaths in Europe between 30 May and 4 September.
If we look at the total values of the ratio (OD/ED), the districts with the lowest excess of deaths were Aveiro (1.18) and Vila Real (1.24), districts where a warm spell occurred (in these regions, since the maximum air temperatures were 5 °C higher than the average maximum temperatures in the reference period for a period shorter than 6 days, a HW was considered inexistent under the definition adopted by IPMA) (see Figure 2 and Figure 3a). The districts with the highest values are Portalegre (1.89) and Guarda (1.85), inland districts where the HW lasted longer than 11 days. Furthermore, it should be emphasized that the financial resources of families that live in these regions are scarcer and thus the number of houses with Heating, Ventilation and Air-Conditioning (HVAC) systems is much lower. This Portuguese reality might be linked with the study carried out by [19] which concluded that there is an amplified risk of mortality and morbidity caused by blackouts in the USA.
On the other hand, in absolute terms, the scenario is quite different; in fact, Portugal is a very asymmetric country in terms of its population distribution. The Portuguese population is around 10 million and about 40% live in Lisboa and Porto districts; therefore, in absolute terms, the excess of deaths is higher in those districts (≅396 in Lisboa and ≅183 in Porto). We might add that, in urban areas, due to the heat island effect, the air temperature in city centres might be several degrees higher than in rural areas; therefore, the consequences of HWs are more harmful for people living in urban areas, which are increasing in number worldwide, being 6.3 million (61%) in Portugal [79].
People more than 75 years old are more vulnerable to excess heat, showing the highest ratios (OD/OE) in both genders. Among the 2009.8 global excess of deaths, 86.7% occurred in the group >75 years old, and 8.0% in the group 65–74 years old [1], which means that people over 65 years old represents 94.7% of the excess of deaths. Accordingly, [64], in a study that gathered 854 European cities, concluded that vulnerability to heat increased with age and also that, overall, the population older than 85 years contributed around 40% of the total mortality burden. In Portugal, according to 2018 official data provided by the Statistical Portugal Official Portal (www.ine.pt, 29 December 2024), more than 20% of the population is over 65 years old. In 2003, the life expectancy was 80.2 years for women and 73.6 years for men, so there were more women than men in all age ranges >65 years old (65–69; 70–74; 75–79; 80–84 and >85 years old). Table 3 highlights that in the Portuguese mainland, with the exception of three districts (Aveiro, Braga and Vila Real), the number of observed deaths among women was higher than among men; accordingly, the excess of deaths was higher among women, now with only two exceptions (Aveiro and Braga, coastal districts where the environmental conditions were not so hot). This trend, shown in Table 3, might be justified by the higher lifespan of women. Thus, during prolonged heat events, a greater sensitivity of women is expected. Furthermore, considering that Portugal is among the countries of the world with the oldest population, one can anticipate the significant impacts of future HWs. As stressed by [26], vulnerable populations, such as the elderly, are often most at risk during extreme weather events. Even at lower ages, mortality might increase during HWs; in this regard, [80] pointed out that for the 50+ age group, the percentage increase in daily mortality during HW days was 22% higher in Rome and 8% higher in Stockholm compared to normal summer days.
From another perspective, the Epidemiology Division of the Portuguese General Directorate of Health assessed all the death certificates and assigned each according to the 10th Revision of the International Statistical Classification of Diseases, Injuries and Causes of Death (CID-10). The place of death was classified as “Home”, “Hospital” or “Other Place”. However, it is not easy to assign the deaths that occur during a HW to a specific cause. Additionally, they are seldom attributed to the exposure to excess heat. The majority of deaths that occurred during the 2003 HW were classified, in both genders, as “Circulatory Diseases” (758; CID-10: I000-I999) and only a small number were attributed to “Heat Stroke” (13.8; CID-10: X309). furthermore, Heat Stroke (HS) has shown the highest respective ratio OD/OE (70.00), followed at a long distance by Dehydration and Other Metabolic Disturbances (8.65; CID-10: E860-E879). These last two were the only causes of death with values of respective OD/OE higher than 2; all the other causes show lower ratios, the highest of these being equal to 1.92 (“Mellitus Diabetes”; CID-10: E100-E149) [1,41]. Boretti (2024) [26], in a study that revisited the analysis performed by [64] in 854 European cities mentioned above, observed that mortality during HWs exceeded that on non-heat wave days, particularly in the categories of total mortality, cardiovascular mortality, and respiratory mortality. A comparison of mortality data between HWs and non-heat wave days was also performed by [19] in three large United States cities (Atlanta, Detroit and Phoenix) in a study that also addressed how blackouts amplify mortality and morbidity; it was concluded that, with HW conditions, the estimated rate of heat-related mortality more than doubled. Accordingly, [33] assessed the impact of HWs on the same days compared to non-heat wave days in a study carried out in France and considering 18 alternative HW definitions; they concluded that associations between HWs and mortality differed greatly depending on the definition.
In terms of place of death, in the Portuguese 2003 HW, 52.6% of deaths occurred in “Hospital” while in the corresponding period of 2000–2001 this value was 56.0%. “Home” obtained very similar percentages in both periods, 32.2% in 2003 and 32.6% in 2000–2001, while in the case of “Other Place” these values were 15.2% in the 2003 HW and 11.3% in 2000–2001 [41].
Finally, inside cities, there is a specific climate phenomenon, the urban heat island (UHI), that contributes to an increase of deaths during HWs. The UHI is characterized by higher night-time air temperatures inside cities than outside, and by a slower air temperature drop. The UHI effect is practically non-existent during daytime, which leads to similar maximum daily temperatures in cities as in the countryside. As the intensity of the UHI phenomenon depends on a wide range of city characteristics (namely its latitude, size, density of buildings and population), there are reports in the literature of maximum urban–rural differences of up to 3 °C, up to 9 °C, and even up to 18 °C [53]. Additionally, the UHI phenomenon is further intensified during extreme heat events [81]. Most Portuguese weather stations are located in the vicinity of, rather than inside of, cities. Thus, due to the UHI effect, the minimum night-time air temperature in city centres is certainly higher than the values measured by the meteorological stations, shown in Figure 3 and Table 1.
Throughout intense HW periods, the night-time outdoor environmental conditions are not cold enough for an appropriate regeneration of non-acclimatized buildings and their residents. Some regeneration occurs for people living in buildings with an active cooling system, but at the expense of a huge amount of energy [18]. These aspects are amplified by the UHI phenomenon. Therefore, during HWs, the health risk to vulnerable people living in non-acclimatized buildings located in dense urban areas is exacerbated by the UHI effect [47,53,82]. This is why there are more excess deaths in cities than in the countryside during HWs.
5. Conclusions
The main goal of the present work was to perform a holistic portrayal of the occurrence of HWs in Portugal. The World Meteorological Organization (WMO) and the World Health Organization (WHO) already consider HWs an important phenomenon with a great impact on population morbidity [43]. Accordingly, the Intergovernmental Panel on Climate Change (IPCC) states that extreme weather events will be more severe and more frequent in the near future [75]. Episodes of heat stress are thus expected to increase significantly, with serious consequences in terms of morbidity and mortality. Moreover, productivity losses and socio-economic costs could be unprecedented.
Therefore, we might ask whether we are prepared to mitigate HWs, together with other extreme weather events, in order to minimize their impacts, which span a range of very different domains. The awareness of the world’s population of the impacts of those events is now undeniable, and this fact can be considered as positive: we know that the danger is close so we might more easily accept the changes that will be required. In addition, in Portugal, a relevant fact is the considerable amount of the population over 65 years old, who are more prone to the drastic consequences of HWs. According to [83], by the late 2070s, the number of persons aged 65 years and over globally is projected to reach 2.2 billion, surpassing the number of children (under age 18); by the mid-2030s, it is projected that there will be 265 million persons aged 80 years or older, more than the number of infants (1 year of age or less).
Our country has already experienced major HW events, which have had very significant impacts on people and the economy. This should be enough to represent a serious warning. In fact, past events in Portugal have drawn the attention of our health authorities, namely the Portuguese General Health Directorate, which has been developing contingency plans for adverse extreme temperatures and respective evaluation reports. Continuous monitoring of HWs in Portugal is, in our opinion, recommended and required. However, this is far behind what we need to do. A lot of questions still remain unanswered, among which are the following: “Are we looking the other way to avoid seeing what is happening?”; “Have we reached our last chance to shift our mindset and focus on endeavours to try to mitigate future catastrophic events?”; or even, “Do we want to preserve our way of life or to face an unknown new one?” These questions might sound useless, but it would be interesting to begin to acknowledge some answers.
Author Contributions
All authors contributed to the study’s conception and design. Material preparation, data collection and analysis were performed by A.V.M.O., A.M.R., A.R.G. and D.A.Q. The first draft of the manuscript was written by A.V.M.O. and all authors commented on previous versions of the manuscript. All authors have read and agreed to the published version of the manuscript.
Funding
No funding was received to assist with the preparation of this manuscript.
Data Availability Statement
All datasets used in this analysis are available.
Conflicts of Interest
The authors declare that they have no known competing financial or personal conflicts that could have influenced the work reported in this paper. The authors disclose that there are no conflicts of interest related to their manuscript, whether actual or potential, including any financial, personal or other relationships with other people or organizations.
Intellectual Property
We confirm that the manuscript has been read and approved by all named authors and that there are no other persons who satisfied the criteria for authorship. We further confirm that the order of authors listed in the manuscript has been approved.
Ethics Approval and Consent to Participate
The research did not involve any humans or animals.
References
- DGS-INSA. Heat Wave of August 2003, Its Effects over Mortality in the Portuguese Population; General Health Directorate (DGS) and National Health Institute Dr. Ricardo Jorge (INSA): Lisbon, Portuguese, 2004. [Google Scholar]
- UNISDR United Nations Office for Disaster Risk Reduction. Sendai Framework for Disaster Risk Reduction (UNISDR) 2015–2030. Sendai. 2015. Available online: https://www.unisdr.org/files/4291_sendaiframeworkfordrren.pdf (accessed on 1 January 2025).
- WMO, World Meteorological Organization. Early Warnings for All Executive Action Plan; WMO: Geneva, Switzerland, 2022. [Google Scholar]
- Brimicombe, C.; Gao, C.; Otto, I.M. Vulnerable to heat stress: Gaps in international standard metric thresholds. Int. J. Biometeorol. 2024, 68, 2495–2506. [Google Scholar] [CrossRef]
- Shaposhnikov, D.; Revich, B.; Bellander, T.; Bedada, G.B.; Bottai, M.; Kharkova, T.; Kvasha, E.; Lezina, E.; Lind, T.; Semutnikova, E.; et al. Mortality related to air pollution with the Moscow heat wave and wildfire of 2010. Epidemiology 2014, 25, 359–364. [Google Scholar] [CrossRef]
- Pascal, M.; Lagarrigue, R.; Tabai, A.; Bonmarin, I.; Camail, S.; Laaidi, K.; Tertre, A.L.; Denys, S. Evolving heat waves characteristics challenge heat warning systems and prevention plans. Int. J. Biometeorol. 2021, 65, 1683–1694. [Google Scholar] [CrossRef]
- Ceccherini, G.; Russo, S.; Ameztoy, I.; Marchese, A.F.; Carmona-Moreno, C. Heat waves in Africa 1981–2015, observations and reanalysis. Nat. Hazards Earth Syst. Sci. 2017, 17, 115–125. [Google Scholar] [CrossRef]
- Igun, E.; Xu, X.; Hu, Y.; Jia, G. Strong heatwaves with widespread urban-related hotspots over Africa in 2019. Atmos. Ocean. Sci. Lett. 2022, 15, 100195. [Google Scholar] [CrossRef]
- Kunda, J.J.; Gosling, S.N.; Foody, G.M. The effects of extreme heat on human health in tropical Africa. Int. J. Biometeorol. 2024, 68, 1015–1033. [Google Scholar] [CrossRef]
- NASA. Heatwaves and Fires Scorch Europe, Africa, and Asia; NASA Earth Observatory: Washington, DC, USA, 2022. Available online: https://earthobservatory.nasa.gov/images/150083/heatwaves-and-fires-scorch-europe-africa-and-asia (accessed on 1 January 2025).
- Richards, M.; Huang, M.; Strickland, M.J.; Newman, A.J.; Warren, J.L.; D’Souza, R.; Chang, H.H.; Darrow, L.A. Acute association between heatwaves and stillbirth in six US states. Environ. Health 2022, 21, 59. [Google Scholar] [CrossRef] [PubMed]
- WMO, World Meteorological Organization. Heatwave. Available online: www.wmo.int/topics/heatwave (accessed on 15 April 2025).
- IPCC; Masson-Delmotte, V.; Zhai, P.; Pirani, A.; Connors, S.L.; Péan, C.; Berger, S.; Caud, N.; Chen, Y.; Goldfarb, L.; et al. (Eds.) Climate Change 2021, The Physical Science Basis. Contribution of Working Group I to the Sixth Assessment Report of the Intergovernmental Panel on Climate Change; Cambridge University Press: Cambridge, UK; Available online: https://www.ipcc.ch/report/ar6/wg1/ (accessed on 1 May 2025).
- ILO. Ensuring Safety and Health at Work in a Changing Climate, Global Report; International Labour Organization: Geneva, Switzerland, 2024; ISBN 9789220405079 (web PDF). 9789220405062 (print). [Google Scholar]
- UNDRR. Global Assessment Report on Disaster Risk Reduction: Our World at Risk: Transforming Governance for a Resilient Future. United Nations Office for Disaster Risk Reduction. 2022. Available online: www.undrr.org/GAR2022 (accessed on 1 January 2025).
- Nelson, G.C.; Vanos, J.; Havenith, G.; Jay, O.; Ebi, K.L.; Hijmans, R.J. Global reductions in manual agricultural work capacity due to climate change. Glob. Change Biol. 2024, 30, e17142. [Google Scholar] [CrossRef] [PubMed]
- MedECC. Climate and Environmental Change in the Mediterranean Basin: Current Situation and Risks for the Future. First Mediterranean Assessment Report; Cramer, W., Guiot, J., Marini, K., Eds.; MedECC—Mediterranean Experts on Climate and Environmental Change: Marseille, France, 2020; ISBN 978-2-9577416-0-1. [Google Scholar] [CrossRef]
- Raimundo, A.M.M.; Oliveira, A.V.M.; Quintela, D.A.A. Assessment of Heat Stress Indoors Residential Buildings During a Summer Heat Wave. In Proceedings of the VI International Congress on Risks: Risks and Territorial Conflicts. From Natural Disasters to Geopolitical Tensions 2023, Coimbra, Portugal, 23–26 May 2023. [Google Scholar]
- Stone, B.; Gronlund, C.J.; Mallen, E.; Hondula, D.; O’Neill, M.S.; Rajput, M.; Grijalva, S.; Lanza, K.; Harlan, S.; Larsen, L.; et al. How Blackouts during Heat Waves Amplify Mortality and Morbidity Risk. Environ. Sci. Technol. 2023, 57, 8245–8255. [Google Scholar] [CrossRef]
- Basarin, B.; Lukić, T.; Matzarakis, A. Review of Biometeorology of Heatwaves and Warm Extremes in Europe. Atmosphere 2020, 11, 1276. [Google Scholar] [CrossRef]
- UNDRR. Heatwaves: Addressing a sweltering risk in Asia-Pacific. 2022. Available online: https://www.undrr.org/publication/heatwaves-addressing-sweltering-risk-asia-pacific (accessed on 1 January 2025).
- Chapman, C.L.; Schlader, Z.J. Extreme heat stress in older adults: A punch to the gut, kidneys or more? Exp. Physiol. 2024, 110, 11–12. [Google Scholar] [CrossRef] [PubMed]
- Brimicombe, C.; Runkle, J.D.; Tuholske, C.; Domeisen, D.I.V.; Gao, C.; Toftum, J.; Otto, I.M. Preventing heat-related deaths: The urgent need for a global early warning system for heat. PLoS Climate 2024, 3, e0000437. [Google Scholar] [CrossRef]
- Eggeling, J.; Gao, C.; An, D.; Cruz-Cano, R.; He, H.; Zhang, L.; Wang, Y.; Sapkota, A. Spatiotemporal link between El Nino Southern Oscillation (ENSO), extreme heat, and thermal stress in the Asia-Pacific region. Sci. Rep. 2024, 14, 7448. [Google Scholar] [CrossRef] [PubMed]
- Hanse, B.; Alam, S.M.; Krishnan, S.; Bhattacharjee, M.; Sinha, A.; Sundareswaran, L.; Kalita, J. Occupational heat stress its health impacts an overview of research status need for further research in Southeast Asia with special emphasis on mitigation strategies in North East India. Int. J. Biometeorol. 2024, 68, 2477–2493. [Google Scholar] [CrossRef]
- Boretti, A. Revisiting Masselot et al. (2023): Assessing the share of excess mortality linked to cold and hot weather in Europe. Int. J. Biometeorol. 2024, 68, 527–533. [Google Scholar] [CrossRef] [PubMed]
- Papadopoulos, G.; Keppas, S.C.; Parliari, D.; Kontos, S.; Papadogiannaki, S.; Melas, D. Future Projections of Heat Waves and Associated mortality Risk in a Coastal Mediterranean City. Sustainability 2024, 16, 1072. [Google Scholar] [CrossRef]
- Bose-O’Reilly, S.; Daanen, H.; Deering, K.; Gerrett, N.; Huynen, M.M.T.E.; Lee, J.; Karrasch, S.; Matthies-Wiesler, F.; Mertes, H.; Schoierer, J.; et al. COVID-19 and heat waves: New challenges for healthcare systems. Environ. Res. 2021, 198, 111153. [Google Scholar] [CrossRef]
- Oliveira, A.V.M.; Nunes, T.S.; Yermakova, I.; Raimundo, A.M.; Gaspar, A.R.; Quintela, D.A. Heat Waves in Portugal during the 2001–2018 period. In Proceedings of the ICB 2021, 22nd International Congress of Biometeorology, International Society of Biometeorology, Virtual, 21–22 September 2021. [Google Scholar]
- Oliveira, A.V.M.; Raimundo, A.M.M.; Quintela, D.A.A. Heat Waves effects on people: Should we be concerned? In International Symposium on Occupational Safety and Hygiene: Proceedings Book of the SHO; CRC Press: Boca Raton, FL, USA, 2023; Volume 1, pp. 40–42. ISBN 978-989-54863-4-2. [Google Scholar]
- Oliveira, A.V.M.; Gao, C.; Eggeling, J.; Raimundo, A.M.M.; Quintela, D.A.A. Heat Waves in Portugal During the First 22 Years of the XXI Century: An Analysis. In Proceedings of the VI International Congress on Risks: Risks and Territorial Conflicts. From Natural Disasters to Geopolitical Tensions, Coimbra, Portugal, 23–26 May 2023. [Google Scholar]
- Di Napoli, C.; Pappenberger, F.; Cloke, H.L. Verification of Heat Stress Thresholds for a Health-Based Heat-Wave Definition. J. Appl. Meteorol. Climatol. 2019, 58, 1177–1194. [Google Scholar] [CrossRef]
- Kanti, F.S.; Alari, A.; Chaix, B.; Benmarhnia, T. Comparison of various heat waves definitions and the burden of heat-related mortality in France: Implications for existing early warning systems. Environ. Res. 2022, 215, 114359. [Google Scholar] [CrossRef]
- Boni, Z.; Bienkowska, Z.; Chwalczyk, F.; Jancewicz, B.; Marginean, I.; Serrano, P.Y. What is a heat (wave)? An interdisciplinary perspective. Clim. Change 2023, 176, 129. [Google Scholar] [CrossRef]
- Copernicus. Copernicus, Europe’s eyes on Earth, Climate Change Service. Programme of the European Union. Available online: www.copernicus.eu (accessed on 10 April 2025).
- Chen, K.; Bi, J.; Chen, J.; Chen, X.; Huang, L.; Zhou, L. Influence of heat wave definitions to the added effect of heat waves on daily mortality in Nanjing, China. Sci. Total Environ. 2015, 506–507, 18–25. [Google Scholar] [CrossRef] [PubMed]
- Perkins, S.E. A review on the scientific understanding of heatwaves—Their measurement, driving mechanisms, and changes at the global scale. Atmos. Res. 2015, 164–155, 242–267. [Google Scholar] [CrossRef]
- Brimicombe, C.; Porter, J.J.; Di Napoli, C.; Pappenberger, F.; Cornforth, R.; Petty, C.; Cloke, H.L. Heatwaves: An invisible risk in UK policy and research. Environ. Sci. Policy 2021, 116, 1–7. [Google Scholar] [CrossRef]
- IPMA. 2001–2024 Annual Climatological Bulletins. Portuguese Institute for Sea and Atmosphere; IPMA: Lisbon, Portugal, 2025; Available online: https://www.ipma.pt/pt/index.html (accessed on 10 April 2025). (In Portuguese)
- Garcia, C.P.; Nogueira, P.; Falcão, J.M. Heat Wave of June of 1981, Effects on Mortality. Rev. Port. Saúde Pública 1999, 1, 67–77. (In Portuguese) [Google Scholar]
- Calado, R.; Nogueira, P.J.; Catarino, J.; Paixão, E.J.; Botelho, J.; Carreira, M.; Falcão, J.M. The august 2003 heat wave and its effects on the mortality of the Portuguese population. Rev. Port. Saúde Pública 2004, 22, 7–20. (In Portuguese) [Google Scholar]
- Paixão, E.J.; Nogueira, P.J. Effects of a Heat Wave on Mortality. Rev. Port. Saúde Pública 2003, 21, 41–54. (In Portuguese) [Google Scholar]
- WMO-WHO. Heatwaves and Health: Guidance on Warning-System Development; World Meteorological Organization and World Health Organization, McGregor, G.R., Bessemoulin, P., Ebi, K.L., Menne, B., Eds.; WMO Report n° 1142; WMO: Geneva, Switzerland, 2015. [Google Scholar]
- Turco, M.; Palazzi, E.; von Hardenberg, J.; Provenzale, A. Observed climate change hotspots. Geophys. Res. Lett. 2015, 42, 3521–3528. [Google Scholar] [CrossRef]
- Cardoso, R.M.; Lima, D.C.A.; Soares, P.M.M. How persistent and hazardous will extreme temperature events become in a warming Portugal? Weather Clim. Extrem. 2023, 41, 100600. [Google Scholar] [CrossRef]
- Tong, S.; FitzGerald, G.; Wang, X.Y.; Aitken, P.; Tippett, V.; Chen, D.; Wang, X.; Guo, Y. Exploration of the health risk-based definition for heatwave: A multi-city study. Environ. Res. 2015, 142, 696–702. [Google Scholar] [CrossRef]
- Zuo, J.; Pullen, S.; Palmer, J.; Bennettes, H.; Chileshe, N. Impacts of heat waves and corresponding measures: A review. J. Clean. Prod. 2015, 92, 1–12. [Google Scholar] [CrossRef]
- Xu, Z.; FitzGerald, G.; Guo, Y.; Jalaludin, B.; Tong, S. Impact of heatwave on mortality under different heatwave definitions: A systematic review and meta-analysis. Environ Int. 2016, 89–90, 193–203. [Google Scholar] [CrossRef] [PubMed]
- Zhang, J.; Liu, S.; Han, J.; Zhou, L.; Liu, Y.; Yang, L.; Zhang, J.; Zhang, Y. Impact of heat waves on nonaccidental deaths in Jinan, China, and associated risk factors. Int. J. Biometeorol. 2016, 60, 1367–1375. [Google Scholar] [CrossRef]
- Pogačar, T.; Žnidaršič, Z.; Bogataj, L.K.; Flouris, A.D.; Poulianiti, K.; Črepinšek, Z. Heat Waves Occurrence and Outdoor Workers’ Self-assessment of Heat Stress in Slovenia and Greece. Int. J. Environ. Res. Public Health 2019, 16, 597. [Google Scholar] [CrossRef] [PubMed]
- Lim, Y.H.; Lee, K.S.; Bae, H.J.; Kim, D.; Yoo, H.; Park, S.; Hong, Y.C. Estimation of heat-related deaths during heat wave episodes in South Korea (2006–2017). Int. J. Biometeorol. 2019, 63, 1621–1629. [Google Scholar] [CrossRef]
- Tran, D.N.; Doan, V.Q.; Nguyen, V.T.; Khan, A.; Thai, P.K.; Cunrui, H.; Chu, C.; Schak, E.; Phung, D. Spatial patterns of health vulnerability to heatwaves in Vietnam. Int. J. Biometeorol. 2020, 64, 863–872. [Google Scholar] [CrossRef]
- Koppe, C.; Kovats, S.; Jendritzky, G.; Menne, B. Heat-Waves: Risks and Responses, Health and Global Environmental Change; Series n° 2. World Health Organization: Geneva, Switzerland, 2004; Available online: https://www.who.int/publications/i/item/heat-waves-risks-and-responses (accessed on 1 January 2025).
- Vandentorren, S.; Bretin, P.; Zeghnoun, A.; Mandereau-Bruno, L.; Croisier, A.; Cochet, C.; Ribéron, J.; Siberan, I.; Declercq, B.; Ledrans, M. August 2003 Heat Wave in France: Risk Factors for Death of Elderly People Living at Home. Eur. J. Public Health 2006, 16, 583–591. [Google Scholar] [CrossRef]
- Vellei, M.; Ramallo-González, A.P.; Coley, D.; Lee, J.; Gabe-Thomas, E.; Lovett, T.; Natarajan, S. Overheating in vulnerable and non-vulnerable households. Build. Res. Inf. 2017, 45, 102–118. [Google Scholar] [CrossRef]
- Zhang, Y.; Nitschke, M.; Krackowizer, A.; Dear, K.; Pisaniello, D.; Weinstein, P.; Tucker, G.; Shakib, S.; Bi, P. Risk factors for deaths during the 2009 heat wave in Adelaide, Australia: A matched case-control study. Int. J. Biometeorol. 2017, 61, 35–47. [Google Scholar] [CrossRef]
- Mayrhuber, E.A.-S.; Dückers, M.L.A.; Wallner, P.; Arnberger, A.; Allex, B.; Wiesböck, L.; Wanka, A.; Kolland, F.; Eder, R.; Hutter, H.-P.; et al. Vulnerability to heatwaves and implications for public health interventions—A scoping review. Environ. Res. 2018, 166, 42–54. [Google Scholar] [CrossRef]
- Nicholls, L.; Strengers, Y. Heatwaves, cooling and young children at home: Integrating energy and health objectives. Energy Res. Soc. Sci. 2018, 39, 1–9. [Google Scholar] [CrossRef]
- Can, G.; Sahin, Ü.; Sayılı, U.; Dubé, M.; Kara, B.; Acar, H.C.; Barıs Inan, B.; Sayman, Ö.A.; Lebel, G.; Bustinza, R.; et al. Excess Mortality in Istanbul during Extreme Heat Waves between 2013 and 2017. Int. J. Environ. Res. Public Health 2019, 16, 4348. [Google Scholar] [CrossRef] [PubMed]
- Kownacki, K.L.; Gao, C.; Kuklane, K.; Wierzbicka, A. Heat Stress in Indoor Environments of Scandinavian Urban Areas: A Literature Review. Int. J. Environ. Res. Public Health 2019, 16, 560. [Google Scholar] [CrossRef]
- Calleja-Agius, J.; England, K.; Calleja, N. The effect of global warming on mortality. Early Hum. Dev. 2021, 155, 105222. [Google Scholar] [CrossRef]
- Foster, J.; Smallcombe, J.W.; Hodder, S.; Jay, O.; Flouris, A.; Nybo, L.; Havenith, G. An advanced empirical model for quantifying the impact of heat and climate change on human physical work capacity. Int J Biometeorol. 2021, 65, 1215–1229. [Google Scholar] [CrossRef]
- Ballester, J.; Quijal-Zamorano, M.; Turrubiates, R.F.M.; Pegenaute, F.; Herrmann, F.R.; Robine, J.M.; Basagana, X.; Tonne, C.; Antó, J.M.; Achebak, H. Heat-related mortality in Europe during the summer of 2022. Nat. Med. 2023, 29, 1857–1866. [Google Scholar] [CrossRef] [PubMed]
- Masselot, P.; Mistry, M.; Vanoli, J.; Schneider, R.; Iungman, T.; Garcia-Leon, D.; Ciscar, J.C.; Feyen, L.; Orru, H.; Urban, A.; et al. Excess mortality attributed to heat and cold: A health impact assessment study in 854 cities in Europe. Lancet Planet Health 2023, 7, e271–e281. [Google Scholar] [CrossRef]
- Moran, D.S.; DeGroot, D.W.; Potter, A.W.; Charkoudian, N. Beating the heat: Military training and operations in the era of global warming. J. Appl. Physiol. 2023, 135, 60–67. [Google Scholar] [CrossRef]
- Sheng, M.; Reiner, M.; Sun, K.; Hong, T. Assessing thermal resilience of an assisted living facility during heat waves and cold snaps with power outages. Build. Environ. 2023, 230, 110001. [Google Scholar] [CrossRef]
- Xu, Z.; Watzek, J.T.; Phung, D.; Oberai, M.; Rutherford, S.; Bach, A.J.E. Heat, heatwaves, and ambulance service use: A systematic review and meta-analysis of epidemiological evidence. Int. J. Biometeorol. 2023, 67, 1523–1542. [Google Scholar] [CrossRef]
- Zhang, G.; Han, L.; Yao, J.; Yang, J.; Xu, Z.; Cai, X.; Huang, J.; Pei, L. Assessing future heat stress across China: Combined effects of heat and relative humidity on mortality. Front. Public Health 2023, 11, 1282497. [Google Scholar] [CrossRef]
- Zhang, L.; Yu, X.; Zhou, T.; Zhang, W.; Hu, S.; Clark, R. Understanding and Attribution of Extreme Heat and Drought Events in 2022, Current Situation and future Challenges. Adv. Atmos. Sci. 2023, 40, 1941–1951. [Google Scholar] [CrossRef]
- Copernicus-WMO (2025) Copernicus Climate Change Service and World Meteorological Organization, European State of the Climate. 2024. Available online: https://climate.copernicus.eu/esotc/2024 (accessed on 16 April 2025).
- Kovats, S.; Wolf, T.; Menne, B. Heatwave of August 2003 in Europe: Provisional estimates of the impact on mortality. Eurosurveillance Wkly. 2004, 8, 2409. [Google Scholar] [CrossRef]
- Le Tertre, A.; Lefranc, A.; Eilstein, D.; Declercq, C.; Medina, S.; Blanchard, M. Impact of the 2003 heatwave on all-cause mortality in 9 French cities. Epidemiology 2006, 17, 75–79. [Google Scholar] [CrossRef] [PubMed]
- Robine, J.M.; Cheung, S.L.K.; Le Roy, S.; Van Oyen, H.; Griffiths, C.; Michel, J.P.; Herrmann, F.R. Death toll exceeded 70,000 in Europe during the summer of 2003. Comptes Rendus Biol. 2008, 331, 171–178. [Google Scholar] [CrossRef]
- Royé, D.; Ínigues, C. Heat-attributable Mortality in the Summer of 2022 in Spain. Epidemiology 2023, 34, e5–e6. [Google Scholar] [CrossRef]
- IPCC. Climate Change 2014, Synthesis Report. Contribution of Working Groups I 2021, II and III to the Fifth Assessment Report of the Intergovernmental Panel on Climate Change; Pachauri, R.K., Meyer, L.A., Eds.; IPCC: Geneva, Switzerland, 2021. [Google Scholar]
- IPCC. Global Warming of 1.5 °C; Masson-Delmotte, V., Zhai, P., Pörtner, H.-O., Roberts, D., Skea, J., Shukla, P.R., Pirani, A., Moufouma-Okia, W., Péan, C., Pidcock, R., et al., Eds.; IPCC: Geneva, Switzerland, 2018. [Google Scholar]
- van Schönthaler, P.K.; von Andrian-Werburg, S. Monitoring Report 2019 on the German Strategy for Adaptation to Climate Change—Report of the Interministerial Working Group on Adaptation Strategy of the Federal Government; Umweltbundesamt: Dessau-Rosslau, Germany, 2019. [Google Scholar]
- Tobias, A.; Ínigues, C.; Royé, D. From Research to the Development of an Innovative Application for monitoring Heat-Related Mortality in Spain. Environ. Health 2023, 1, 416–419. [Google Scholar] [CrossRef]
- United Nations. Demographic Yearbook of 2022. In Demographic Yearbook, Seventy-Third Issue; United Nations: New York, NY, USA, 2023; ISBN 978-92-1-300083-0. [Google Scholar]
- Oudin, Å.D.; Schifano, P.; Asta, F.; Lallo, A.; Michelozzi, P.; Rocklöv, J.; Forsberg, B. The effect of heat waves on mortality in susceptible groups: A cohort study of a Mediterranean and a northern European City. Environ. Health 2015, 2025, 14–30. [Google Scholar]
- Ho, J.Y.; Shi, Y.; Lau, K.K.L.; Ng, E.Y.Y.; Ren, C.; Goggins, W.B. Urban heat island effect-related mortality under extreme heat and non-extreme heat scenarios: A 2010-2019 case study in Hong Kong. Sci. Total Environ. 2023, 858, 159791. [Google Scholar] [CrossRef]
- Błażejczyk, K.; Twardosz, R.; Wałach, P.; Czarnecka, K.; Błażejczyk, A. Heat strain and mortality effects of prolonged central European heat wave—An example of June 2019 in Poland. Int. J. Biometeorol. 2022, 66, 149–161. [Google Scholar] [CrossRef]
- United Nations. World Population Prospects 2024, Summary of Results; United Nations: New York, NY, USA, 2024; ISBN 978-92-1-003169-1. [Google Scholar]
Disclaimer/Publisher’s Note: The statements, opinions and data contained in all publications are solely those of the individual author(s) and contributor(s) and not of MDPI and/or the editor(s). MDPI and/or the editor(s) disclaim responsibility for any injury to people or property resulting from any ideas, methods, instructions or products referred to in the content. |
© 2025 by the authors. Licensee MDPI, Basel, Switzerland. This article is an open access article distributed under the terms and conditions of the Creative Commons Attribution (CC BY) license (https://creativecommons.org/licenses/by/4.0/).