Article

Decadal Modulation of Summertime Northwestern Pacific Subtropical High Linked to Indian Ocean Basin Warming

Department of Earth and Planetary Sciences, Kyushu University, Fukuoka 819-0395, Japan
*
Author to whom correspondence should be addressed.
Climate 2025, 13(6), 106; https://doi.org/10.3390/cli13060106
Submission received: 31 March 2025 / Revised: 16 May 2025 / Accepted: 22 May 2025 / Published: 24 May 2025
(This article belongs to the Section Climate Dynamics and Modelling)

Abstract

:
The Northwestern Pacific Subtropical High (NPSH), usually enhanced by the basin-scale warming of the Indian Ocean (IOBW), plays a major role in controlling the summertime East Asian climate. To assess factors contributing to the decadal modulation of the NPSH and IOBW relationship in recent years, we conducted sensitivity experiments using an atmospheric general circulation model. We particularly focused on decadal-scale differences between the periods of 1982–2001 and 2002–2021, with the contribution of the climatological sea surface temperature (SST) as the background, in combination with the tropical Pacific SST anomaly in relation to the rapid or slow decay of the El Niño Southern Oscillation (ENSO). The results indicate that the IOBW-related SST anomalies in the Indian and tropical Pacific Oceans—which, overall, represent the well-known characteristics of the so-called Indo-western Pacific Ocean Capacitor effects—cooperatively enhanced the NPSH in the earlier period (1982–2001). On the other hand, the suppressed and westward-shifted SST anomalies in the tropical Pacific Ocean and the resultant changes in the diabatic heating of cumulus convection suppressed the NPSH enhancement in recent years (2002–2021). These results indicate that the modulation in the NPSH responses linked to the IOBW is primarily due to the so-called ENSO diversity rather than climatology.

1. Introduction

In order to accurately assess the risk of heavy rainfall, it is crucial to further our understanding of the governing processes as well as improve our skills in prediction. One of the key approaches to understanding these governing processes is focusing on the governing-scale interaction processes between global climate variability and regional/local phenomena. Recently, high-performance computation methods have enabled us to compile sets of large-ensemble simulations of global atmospheric models, which are useful means to discuss heavy rainfall potentials in a statistical sense in relation to global climate variability as the background changes. For example, Kawase et al. [1] and Imada and Kawase [2] recently indicated that the potential of local heavy rainfall events (i.e., the frequency of extreme events in the summer season) in western Japan is tied to two global climate variabilities: the tropical cyclone activity influenced by the central Pacific El Niño–Southern Oscillation (CP-ENSO) [3,4,5] and the moisture transport due to the Northwestern Pacific Subtropical High (NPSH) as an atmospheric response to the basin-scale warming in the Indian Ocean (referred to as Indian Ocean basin warming (IOBW)) [6,7]. Mochizuki [8] illustrated another example of the contribution of global climate variability by examining the potential amount of local heavy daily rainfall (i.e., the intensity of extreme events in the summer season). Large ensembles of global atmospheric model simulations driven by observed sea surface temperature (SST) indicate that the anomalous moisture transport corresponding to the changes in the NPSH contributes to the interannual fluctuations in intensity of the top 10 percentile heavy daily rainfall on Kyushu Island in the summer. The NPSH variability, usually accompanied by the IOBW after the wintertime El Niño events, is a good proxy for determining the potentials of local heavy rainfall in East Asia beyond differences in spatiotemporal scales.
Even before the recent focus on the potentials of heavy rainfall and extreme weather, the seasonal mean precipitation has long been investigated in East Asia. The summertime NPSH predominantly controls the seasonal mean precipitation in East Asia through changes in the moisture transport due to the monsoon circulation, referred to as the East Asian Monsoon. The NPSH variations are largely attributed to the so-called Indo-western Pacific Ocean Capacitor (IPOC) effect [6,7] in relation to the summertime IOBW, which usually accompanies an ENSO event in the preceding winter [9,10]. When the SST in the central and/or eastern tropical Pacific is high, it corresponds to an El Niño event in boreal winter; for example, the Indian Ocean SST usually exhibits high and low SST anomalies in the western and eastern areas, respectively. This zonal SST contrast in the Indian Ocean is replaced by the basin-scale warming of the ocean through the oceanic wave propagation in the spring and summer. When the SST is high in the Indian Ocean (particularly in the northern Indian Ocean), the tropical atmospheric response in the lower troposphere represents cyclonic anomalies in the western Indian Ocean and anomalous easterly winds along the equator around the Maritime Continent. At the same time, the divergent flow elicited north of this anomalous easterly wind pattern forms an anomalous high pressure around Southeast Asia [6]. The negative vorticity simulated south of Japan leads to the enhancement of the NPSH [6,7], which is sometimes referred to as the Pacific–Japan teleconnection pattern [11]. These mechanisms might also work to control the heavy rainfall potentials [1,2,8].
The relationship between the NPSH and the IOBW is a key factor in clarifying the impacts on the East Asian summer monsoon in post-El Niño summer. Mochizuki [8] indicated possible low-frequency (i.e., decadal-scale) modulation in 1981–2010, particularly in the spatiotemporal structures of the influential SST anomalies, and its impact on the NPSH. In addition to the direct effects of the IOBW on atmospheric circulation, two key issues related to this modulation were found in regard to the usually accompanying SST anomalies in the tropical Pacific: the so-called ENSO diversity and the strength of the decaying tendency on the seasonal timescales. Wintertime El Niño events were observed prior to the IOBW in the spring and summer [6,7], as well as in the Maritime Continent and South China Sea [12]. In recent years, the SST anomaly of the wintertime El Niño has shifted to the central Pacific more than before, while that in the eastern tropical Pacific has rapidly decayed on a seasonal timescale. As a result, the IOBW is accompanied by a weaker and CP-ENSO-like anomaly of the tropical Pacific SST in recent years, compared with the strong eastern Pacific ENSO (EP-ENSO)-like anomaly in earlier years. Yim et al. [13] and Park et al. [14] indicated that the spatial pattern of the tropical SST anomaly controlling the summertime NPSH shifted from EP-ENSO to CP-ENSO in the mid-1990s. The periodicity of NPSH variations also shifted from 4–5 years to 2–3 years [14,15], corresponding to the shift in the location of the influential SST anomaly from the Maritime Continent to the northwestern Pacific [16]. It should be noted that the EP-ENSO and CP-ENSO patterns in these earlier studies [13,15] were observed in a post-El Niño summer and during the developing phase of El Niño, respectively, and that the different patterns of the Indo-Pacific SST forcing between the decaying and developing ENSO phases played a major role. In contrast, Mochizuki [8] detected the ENSO diversity in the decadal modulation of heavy daily rainfall potentials during a post-El Niño summer. With the recent increase in CP-ENSO-type fluctuations [12,17,18,19], it is possible that the interdecadal trend, mainly arising from the positive-to-negative phase change in the Interdecadal Pacific Oscillation (IPO) [20,21], can form a zonal contrast as a low-frequency difference in the influential SST pattern [22]. Fujiwara and Kawamura [23] recently found that the amplitude of the interannual fluctuations in summertime rainfall observed in Japan had increased, possibly due to the basin-scale warming tendency in the Indian Ocean. They suggested that the IPO phase modified the background states of the IPOC, and the resultant changes in the Indo-Pacific Walker circulation might have contributed to the NPSH response to the IOBW. Even when focusing on the IOBW-related SST conditions, decadal shifts in the influences of the ENSO diversity and periodicity were observed.
In this study, as we focus on the decadal modulation of NPSH variations accompanying the IOBW, the IPOC effect is a dominant factor that influences the NPSH response to the IOBW. Thus far, the decadal modulation of the IPOC has usually been discussed as a response to the ENSO [24]. Previous rain-gauge and ship observations and reanalysis data suggested a dominant role of natural variability for these modulations, at least in the mid- and late 20th century [25,26]. While the wintertime ENSO is considered a major cause of IOBW and NPSH variability in boreal summer, the strength of the ENSO forcing determines the magnitude of the IPOC in the following summer [27]. Focusing on the Indian Ocean’s response to the ENSO, some studies have suggested that the Indian Ocean has become more sensitive to the ENSO forcing in recent years; for example, the shoaling tendency of the thermocline in the southwestern equatorial Indian Ocean makes the local SST more sensitive to oceanic Rossby waves [25]. It may also be because the atmosphere–ocean thermal coupling, particularly the wind–evaporation–SST feedback [28,29], can be enhanced through a nonlinear SST–evaporation relationship under the observed warming tendency in the upper Indian Ocean [30]. In addition, possible feedback from the Indian Ocean to the tropical Pacific has been discussed. Since a strong signal from the IOBW can dampen the ENSO signal in the equatorial Pacific [31], consequently, the ENSO event that is accompanied by a strong IOBW decays rapidly in spring and summer [32]. In fact, the recent stronger warming tendency of the Indian Ocean, which modifies the Indo-Pacific SST gradient, can modulate the anomalous Indo-Pacific Walker circulation response due to the IOBW [33,34]. In recent years, the IOBW following a wintertime El Niño event occurred earlier, possibly due to the enhanced sensitivity of the Indian Ocean, and the high SST anomalies in the equatorial Pacific might also decay more rapidly.
The above knowledge regarding the IPOC and ENSO relationship can provide insights into the NPSH and IOBW relationship, although our understanding of its decadal modulation mechanism is quite limited at this stage. For example, there is no consensus in future climate projects regarding the changes in the IPOC and ENSO relationship. The projected changes in the NPSH tendency during the post-El Niño summer show inconsistent results for the Coupled Model Intercomparison Project phase 5 (CMIP5) [35,36,37]. Some analyses have found that both the IOBW and NPSH anomalies in the post-El Niño summer would be enhanced under a warmer climate [35,38]. The NPSH in the post-El Niño summer is expected to be enhanced with the rapidly decaying El Niño in the future [39], consistent with the tendency observed in the late 20th century described above. Meanwhile, contrary to this, Jiang et al. [37] concluded that the post-El Niño summer NPSH will weaken in the future due to the weaker anomalies in the local SST in the northwestern Pacific and associated inter-basin SST contrast. He et al. [40] indicated that the Kelvin wave response to the IOBW will be suppressed due to enhanced dry static stability, which can also reduce the NPSH anomaly in the future. The background states can work to control the characteristics of the NPSH and IOBW anomalies, including the seasonal evolution of the atmospheric and oceanic anomalies [41,42].
As described above, the IOBW is usually accompanied by tropical SST anomalies even in the summer, which should be regarded as a remnant of the wintertime ENSO signal. The circulation anomaly in East Asia is also formed directly by this summertime remnant of the ENSO signal (i.e., tropical Pacific SST anomaly), and it can work as strong noise for the IPOC-induced circulation anomaly. In other words, we can speculate that while the wintertime ENSO anomaly can form the summertime NPSH anomaly primarily through the IOBW and IPOC effect as a signal, at the same time, the summertime remnant of the ENSO anomaly can directly modify the convective activity in the western Pacific Ocean. The summertime NPSH variations are not an alternative result of the IOBW or the direct forcing of the accompanying ENSO signal. In this regard, an important issue to consider in order to further our understanding of the decadal modulation of the NPSH and IOBW relationship is the combined effects of the coexisting IOBW and tropical Pacific SST anomalies. In addition to changes in the background states, a key factor is the potential contribution of the tropical Pacific SST anomaly that may accompany the rapidly or slowly decaying ENSO. Therefore, in this study, we conducted sensitivity experiments using an atmospheric general circulation model and assessed the factors that potentially contribute to the recent decadal modulation of the NPSH and IOBW relationship. Following a recent study [23], we focused on the SST differences between the first and second halves of the past four decades (i.e., 1982–2001 and 2002–2021), considering the background SST states, the IOBW anomalies, and the accompanying SST anomalies in the tropical Pacific Ocean.
The remainder of this paper is organized as follows: Section 2 describes the data, the atmospheric model, and the designs of the sensitivity experiments in this study. In Section 3.1, differences in the atmospheric responses to the climatological SST in each of the periods, 1981–2001 and 2002–2021, are described. Section 3.2 defines the atmospheric responses of the IOBW-related SST anomalies in both the Indian Ocean and the tropical Pacific Ocean for each period. Additional sensitivity experiments were performed, and the influential contributors to the differences between the two periods are discussed in Section 3.3. The conclusions are presented in Section 4.

2. Materials and Methods

We used version 2 of the Atmospheric Model for the Earth Simulator (AFES2) for the sensitivity experiments [43,44], which is a T42 spectral model and has 56 levels. The AFES model provides useful information for examining sensitivity in the climate state; for example, it has been used in studies on the Asian summer monsoon as an atmospheric component of the coupled model [45,46,47], where T42 resolution cannot directly represent local phenomena such as heavy daily rainfall events. As we assessed the potential impacts of regional and global SST conditions, with a particular focus on the climatological states and the IOBW and accompanying anomalies in the tropical Pacific during the periods of 1982–2001 (referred to as Period 1) and 2002–2021 (referred to as Period 2), we used identical conditions (e.g., in terms of the concentration of atmospheric composition and solar insolation) regarding the climatologies from June to July. In this regard, our simulations could be referred to as perpetual early summer experiments for June–July. The initial conditions were also identical for all experiments, defined as the atmospheric states at 00 UTC on 1 July 2001 derived from the 6-hourly Japanese Reanalysis for Three Quarters of a Century (JRA-3Q) dataset at a 1.25° horizontal resolution and 45 vertical levels [48]. For each sensitivity experiment, we performed 3270-day-long simulations (i.e., nearly 109 months) using fixed SST and sea ice values taken from the objective analysis, cobe-sst2 [49,50] as the boundary conditions.
We compared the averages over the last 3000 days (i.e., nearly 100 months) of the simulations; in practice, the definition of the initial conditions should have negligible influences on the conclusions of the study. First, we performed two simulations as references (referred to as CL1 and CL2 simulations) (Table 1) using the observed SST climatology in June–July of 1982–2001 (Period 1) and 2002–2021 (Period 2), respectively. The SSTs used in CL1 and CL2 show interdecadal differences (Figure 1A), which can contribute as a background change in the evaluation of the IOBW-related NPSH variability. The SST in CL2 is overall higher than that in CL1 due to the global warming tendency, while the tropical SST difference shows zonal contrast. While the Indian and western Pacific Oceans have recently exhibited stronger warming, the eastern Pacific Ocean exhibits a neutral or cooling tendency, mainly due to the positive-to-negative phase changes of the IPO in late 1990s.
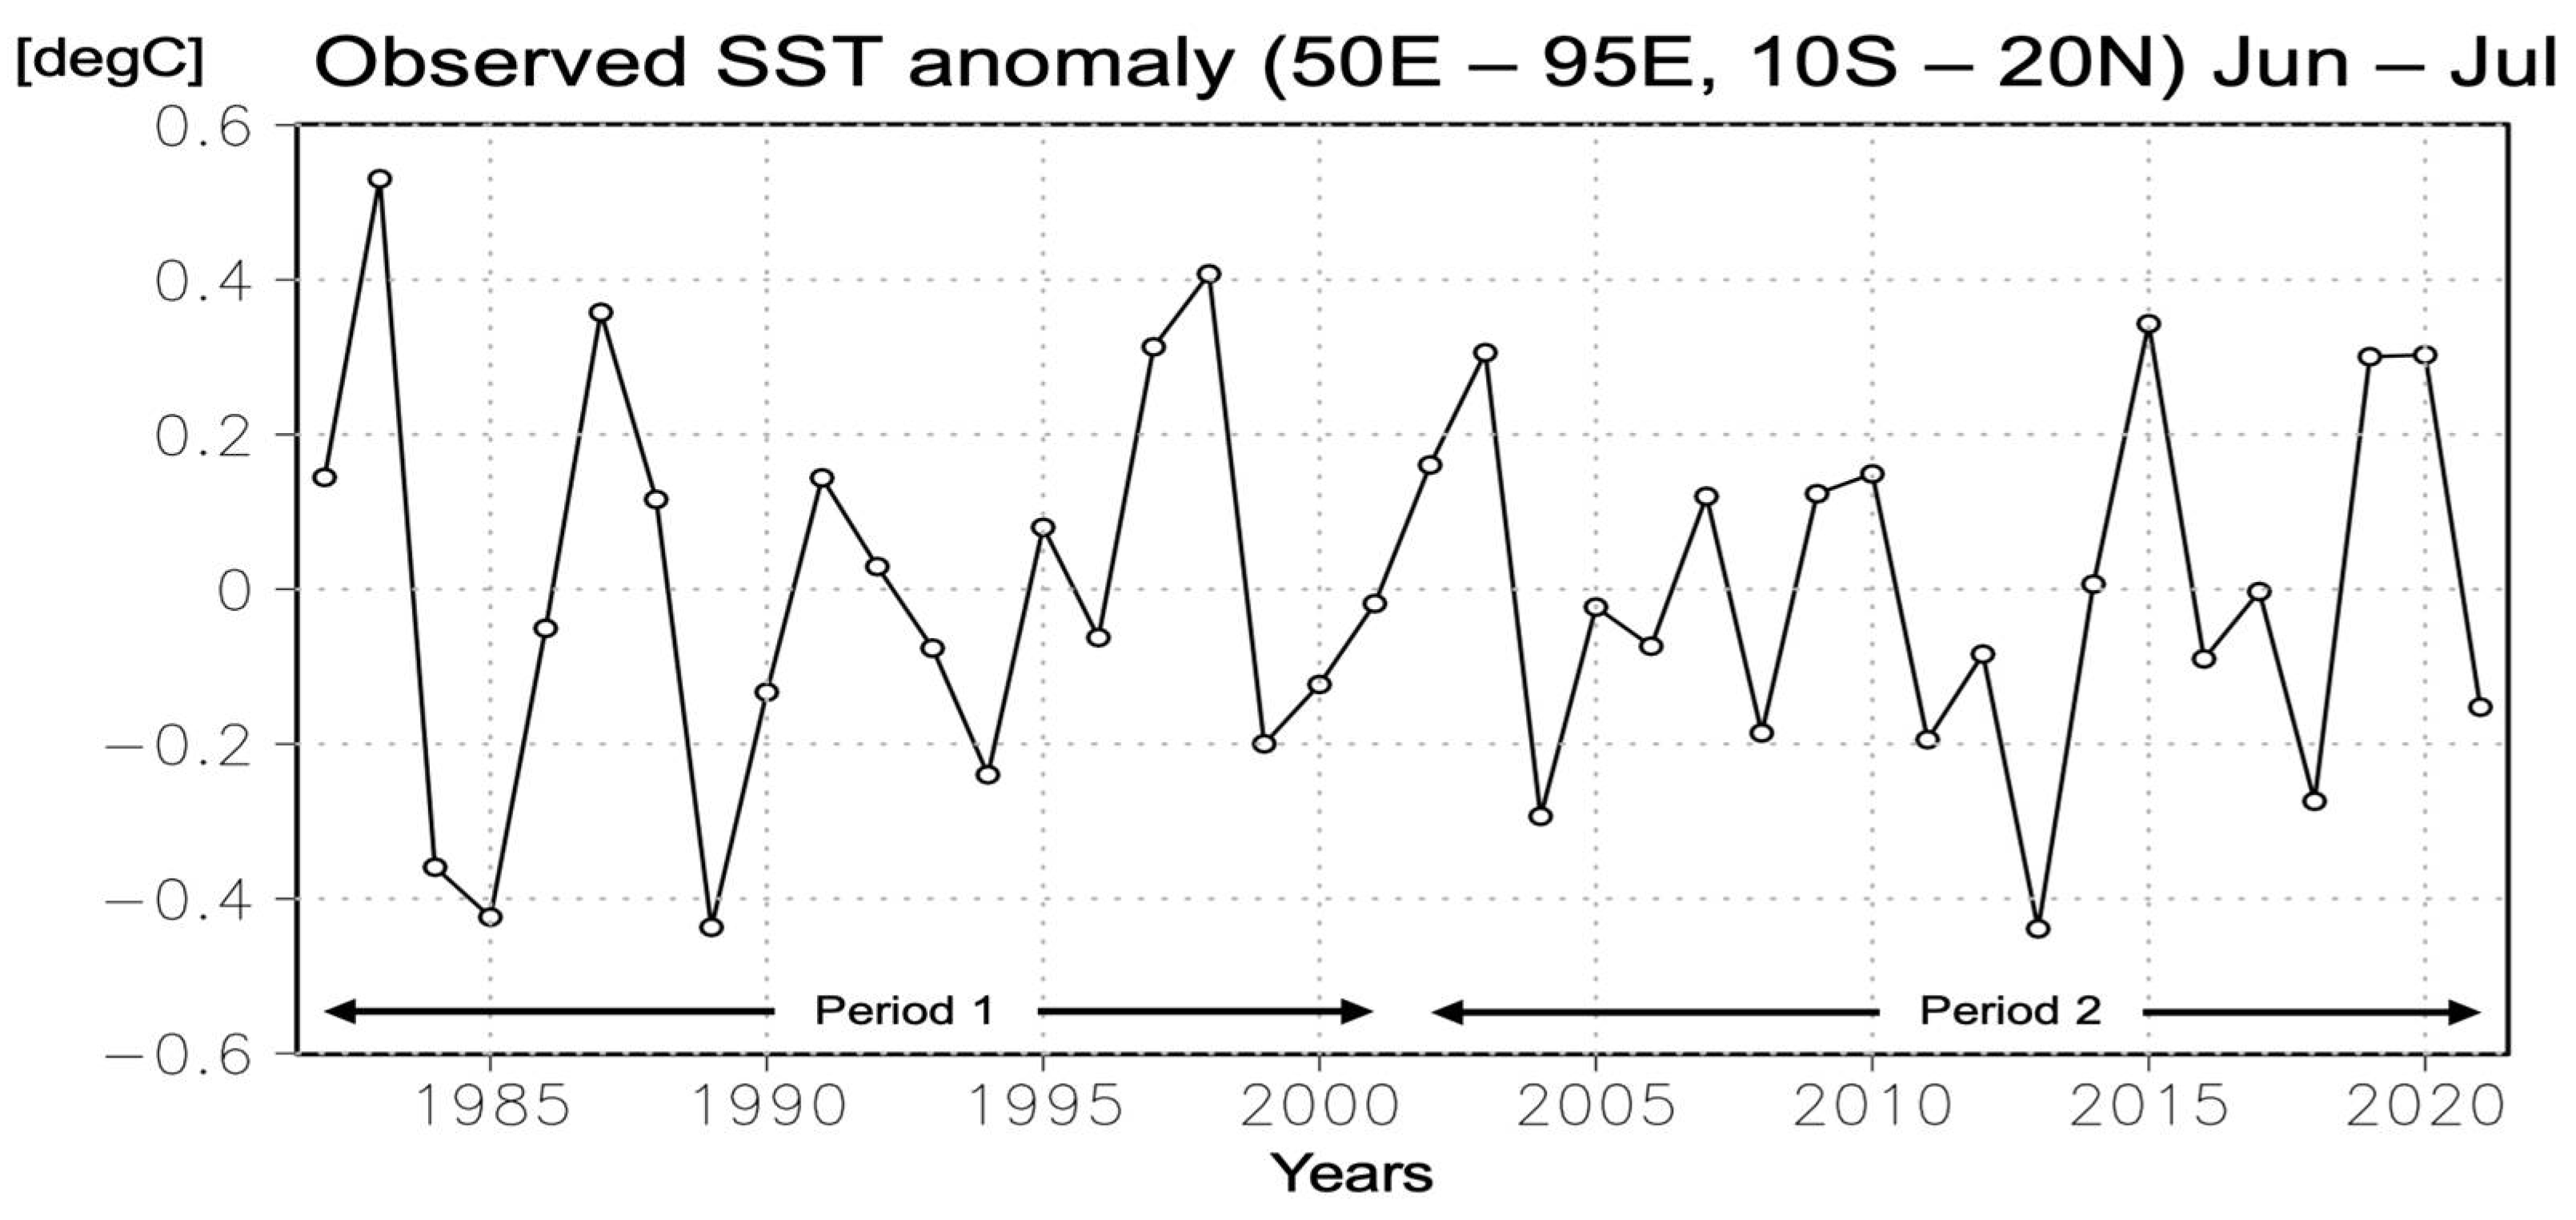
In addition to the above SST climatology, for each period (Period 1 and Period 2), we defined the IOBW-related SST anomalies in the tropics (20° S–20° N) (Figure 1C,D). We removed the linear trend at each grid point for 20 years (i.e., for each interval of Period 1 and Period 2) and then calculated the SST regressions onto the Indian Ocean SST anomalies averaged over an area of 10° S–20° N, 50° E–95° E, which predominantly exhibits interannual fluctuations (Figure 2). While the zonal SST anomaly contrast, similar to that observed with an El Niño event, coincides with the basin-scale warming of the Indian Ocean in both periods (Figure 1C,D), a close examination indicates that the coexisting Pacific SST anomalies show similar patterns to the EP- and CP-ENSO patterns in Period 1 and Period 2, respectively. Besides the spatial pattern, the magnitudes of the IOBW-related SST anomalies in the tropical Pacific are larger in Period 1, and consequently, the differences between the two periods are noticeable, particularly in the eastern Pacific (Figure 1B). To assess the atmospheric response to the Indian Ocean SST anomaly that arise from the IOBW in Period 1, we performed a 3270-day-long simulation (referred to as CL1BW1) using the sum of the global SST climatology in Period 1 and the IOBW-related SST anomaly in an area of the Indian Ocean (20°S–20° N, 50°E–95° E) during this period (see Figure 1C) as the boundary conditions (Table 1). As a result, the differences between CL1BW1 and CL1 should represent the impact of the IOBW in Period 1. In addition, to assess the combined effects of the IOBW-related Indian Ocean SST anomaly and the accompanying tropical Pacific SST anomaly, we performed a 3270-day-long simulation (referred to as CL1TR1) using the sum of the global SST climatology in Period 1 and the IOBW-related SST anomaly in the whole tropical ocean (20° S–20° N, 180° W–180° E) during this period (Figure 1C) as the boundary conditions (Table 1). The differences between CL1TR1 and CL1BW1 should represent the impact of the Pacific SST anomaly on the atmospheric response to the IOBW in Period 1. In a similar manner, another set of simulations were performed for Period 2, using the IOBW-related SST anomaly in an area of the Indian Ocean only (CL2BW2) and in the whole tropical ocean (CL2TR2), together with the global SST climatology.
To evaluate potential contributors to the differences between Period 1 and Period 2, we performed four additional sensitivity experiments. For the CL1BW2 and CL2BW1 experiments, we defined the SST values as the sum of the global climatology for one period and the IOBW-related SST anomaly in the Indian Ocean for the other period. In a similar manner, for the CL1TR2 and CL2TR1 experiments, we defined the SST values as the sum of the climatology for one period and the IOBW-related SST anomaly in the whole tropical ocean for the other period. For example, when comparing CL2BW2 to CL1BW2, we explored the potential impact of the differences in the background SST states on the atmospheric responses to the IOBW anomaly observed in Period 2.

3. Results

3.1. Atmospheric Responses to Climatological SST States

Before discussing the details of the NPSH responses to IOBW-related anomalies, we illustrate the impact of the background change between the first and second halves of the most recent 40-year period by comparing the results of the CL1 and CL2 simulations (Figure 3). In recent years, precipitation increased in the Indian and western Pacific Oceans, while it was suppressed in East Asia (Figure 3B), which is consistent with the observations reported in previous research [51]. With the increasing tendency of the Indian Ocean SST, the observed NPSH shows a decreasing tendency, inconsistent with the flamework of the contribution of the IPOC. Precipitation in the northwestern Pacific is increased mainly due to the high SST anomalies in the area [14,15,16], and the enhanced convective activity can induce the Pacific–Japan pattern [51]. Building on these results regarding SST differences in climatology, we aimed to advance our understanding of the impact of the IOBW-related SST anomalies in the Indian and Pacific Oceans by performing sensitivity experiments, as described in the following sections.

3.2. Combined Effects of IOBW Anomalies and Accompanying Tropical SST Anomalies

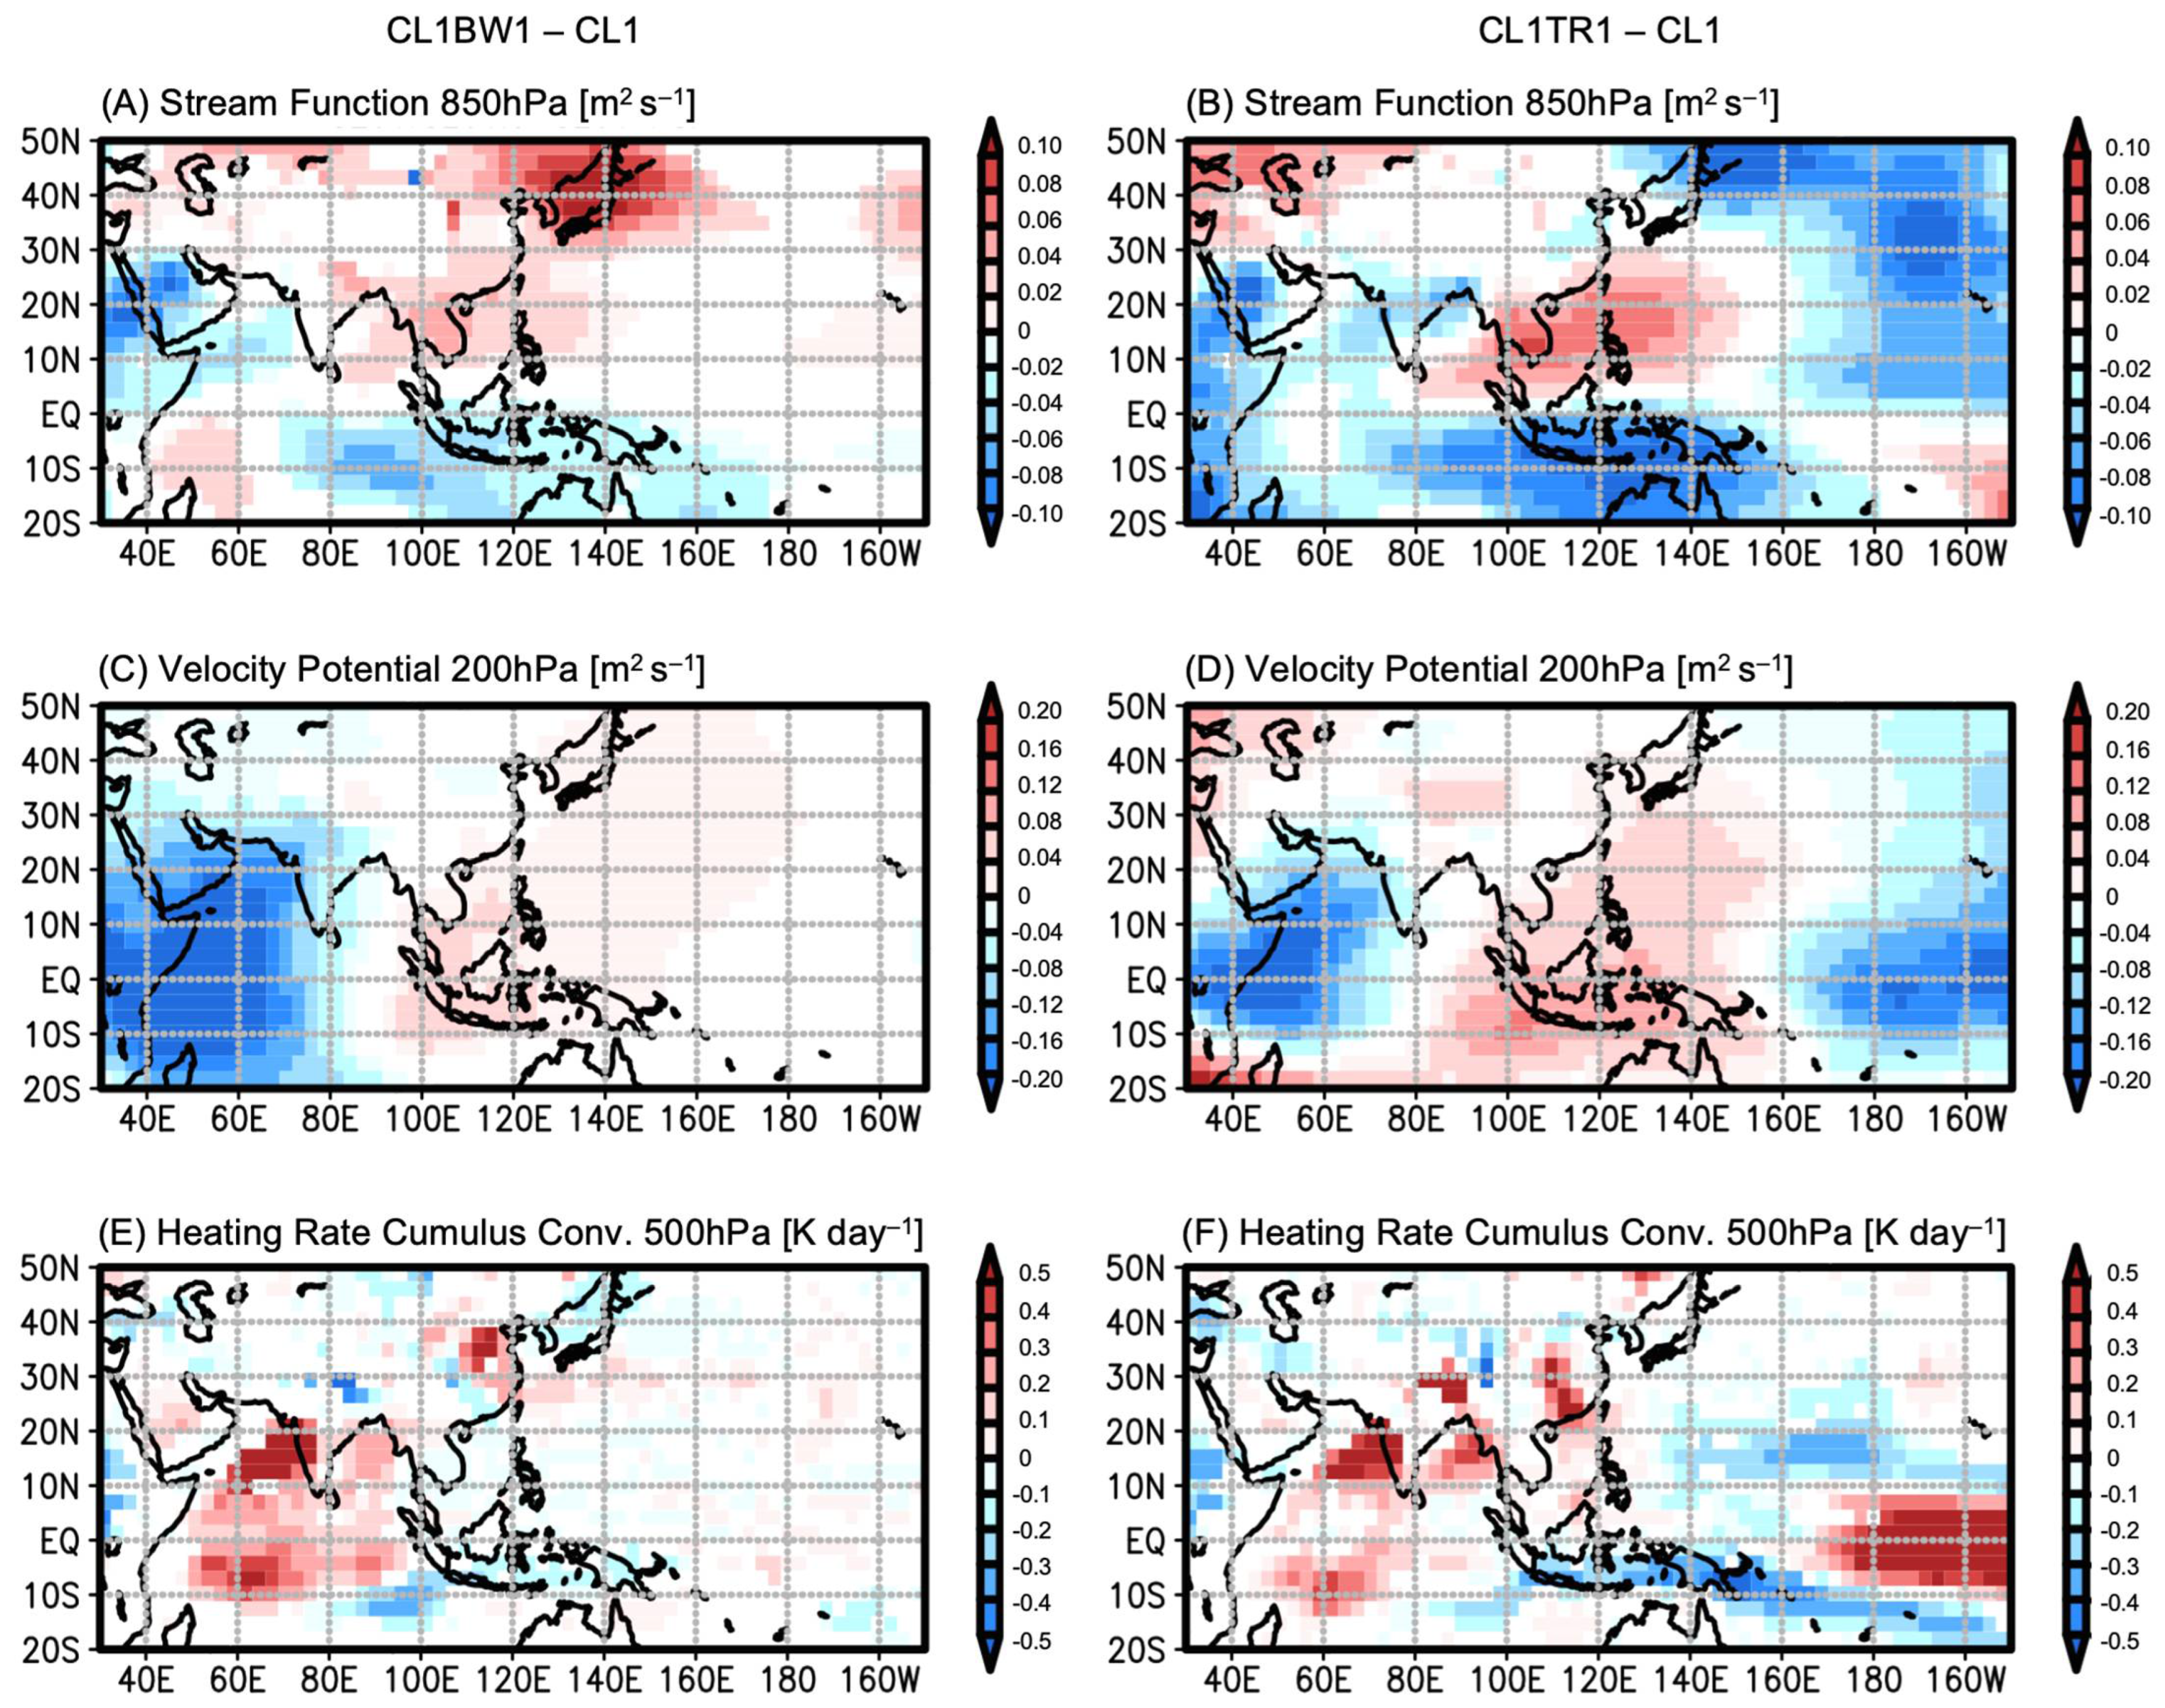
From the experimental designs, the differences between CL1BW1 and CL1 should represent the atmospheric responses to the high SST in the Indian Ocean in relation to the IOBW in Period 1 (left panels of Figure 4). As we examined atmospheric circulation responses to SST anomalies, stream function at 850 hPa and velocity potential at 200 hPa were plotted to explore the impact on the horizonal winds in the low and high troposphere, respectively. We also plotted the heating rate estimated by the cumulus convection scheme at 500 hPa, as a good proxy for the vertical motion excited by the given SST anomalies.
The high SST in the Indian Ocean enhances the cumulus convection (Figure 4E) and triggers the so-called Matsuno–Gill response in the atmosphere [52,53]. In the low-level atmosphere (Figure 4A), twin cyclonic anomalies are formed in the off-equatorial areas of the western Indian Ocean, and a westward wind anomaly forms along the equator in the eastern Indian Ocean. When focusing on the northern hemisphere, a zonally elongated high-pressure anomaly is simulated over the Bay of Bengal, the South China Sea, and the Philippine Sea, suggesting the IPOC effect. Consistent with these responses, the upper troposphere shows anomalous eastward winds over the Indian Ocean (Figure 4C). Consequently, the Walker circulation anomaly is generated over the Indian Ocean and the Maritime Continent (Figure 4A,C). The difference between CL1TR1 and CL1 leads to similar responses in the atmosphere over the Indian Ocean (right panels of Figure 4). Additionally, in the tropical Pacific, corresponding with the SST anomalies displaying an EP-ENSO-like pattern (Figure 1B), convective heating is suppressed and enhanced in the western and central Pacific, respectively (Figure 4F). These forcings of the heating rate contribute to the twin anticyclonic anomalies in the off-equatorial areas of the western Pacific Ocean and the eastward wind anomaly along the equator in the equatorial central Pacific Ocean (Figure 4B). The upper troposphere shows anomalous westward winds, suggesting changes in the Walker circulation in the tropics (Figure 4D). When examining the combined effects of the high Indian Ocean SST in relation to the IOBW and the accompanying SST anomaly in the tropical Pacific in Period 1, the high-pressure anomaly around the South China Sea and the Philippine Islands is extended further eastward due to the Pacific SST anomaly (Figure 4B), enhancing the NPSH.
In Period 2, the tropospheric atmosphere also responds to the high SST in the Indian Ocean in a similar manner to that observed in Period 1 (left panels of Figure 4). The enhanced convective heating over the Indian Ocean (Figure 5E) excites the Matsuno–Gill-type circulation anomalies in both the low and high troposphere over the Indian Ocean and the Maritime Continent (Figure 5A,C). It should be noted that the Walker circulation anomaly is further extended to the central Pacific Ocean (Figure 5C), like the trans-basin changes in the decadal-scale trend [33,34], and the accompanying high-pressure anomaly at 850 hPa in the northern hemisphere is also extended (Figure 5A). In fact, the zonal wind anomalies along the equator at 850 hPa show the trans-basin contrast between the Indian and Pacific Oceans: the Indian Ocean SST anomaly (i.e., CL1BW1 and CL2BW2 simulations) triggers eastward and westward anomalies in the Indian and Pacific Oceans, respectively (solid lines in Figure 6A). Overall, the tropical Pacific SST, showing a CP-ENSO-like spatial pattern in Period 2 (Figure 1D), also triggers Matsuno–Gill-type responses with the Walker circulation anomaly in the Pacific Ocean, as in Period 1 (right panels of Figure 5). When looking at the NPSH east of the Philippine Islands, on the other hand, the combined effects modify the IOBW influences differently from those seen in Period 1. The tropical Pacific SST anomaly accompanying the IOBW weakens the high-pressure anomaly east of the Philippine Islands, thereby suppressing the positive NPSH anomaly (Figure 5B). Compared with Period 1 (right panels of Figure 4), the enhanced heating anomaly in the central Pacific (i.e., east of the international dateline) is weaker, and the suppressed heating anomaly in the off-equatorial western Pacific is westward-shifted (i.e., the location is around 160° E in Figure 5F, but 170° E in Figure 4F), probably due to the relatively small and westward-shifted SST anomaly in the tropical Pacific in Period 2 (Figure 1D). Corresponding with the tropical SST differences, the zonal wind anomaly along the equator is also shifted westward (broken lines in Figure 6A). The anomalous westerly wind is simulated east of 130° E in Period 2 and east of 160°E in Period 1. In this regard, the concurrent effects of the tropical Pacific SST anomalies on the NPSH in relation to the IOBW are different between Period 1 and Period 2, probably due to the differences in the intensity and location of the tropical Pacific SST anomaly (Figure 1B). In accordance with the different impacts on the NPSH, the zonal contrast of the convective heating between west and east of the Philippine Islands, which is key to the summertime rainfall in East Asia [54], also shows a difference in magnitude between the two periods (broken lines in Figure 6B).

3.3. Influential Contributors to Differences Between Period 1 and Period 2

In this section, based on the results of the additional sensitivity experiments, we attempt to clarify the major contributors to the differences observed in the concurrent effects of the tropical Pacific SST anomalies on the NPSH between Period 1 and Period 2 (Figure 4 and Figure 5). We explore two possible contributors: differences in the IOBW-related tropical SST anomalies working as oceanic forcing and differences in the background SST states which may modulate the sensitivity of the atmospheric response.
First, we discuss the contribution of the IOBW-related tropical Pacific SST anomalies, which exhibit the EP- and CP-ENSO patterns in Period 1 and Period 2 (Figure 1C,D), respectively. The Pacific SST anomalies in Period 2 are much lower in the eastern Pacific, higher in the western Pacific, and very slightly lower in the Indian Ocean than in Period 1 (Figure 1B). Regardless of the definition of the climatological states (i.e., Period 1 or Period 2), convective heating is suppressed along the equator and enhanced in the off-equatorial areas in the central Pacific (Figure 7E,F). These tripole patterns of heating rate are consistent with the results of the moist linear baroclinic model simulation that illustrated the atmospheric response to an SST anomaly in the eastern Pacific [55]. These upward motions directly induce the meridional circulation anomalies in the upper atmosphere around the international dateline (Figure 7C,D). The low-level atmosphere shows low-pressure anomalies in the subtropical areas of the western Pacific, particularly over the Philippine Sea (i.e., around 10° N–30° N, 120° E–150° E) (Figure 7A,B), demonstrated as a combined effect of the contrast between the equatorial western and eastern Pacific SST anomalies in the moist linear baroclinic model [55]. Therefore, the concurrent effects of the accompanying tropical Pacific SST anomalies induce an anticyclonic anomaly at 850 hPa over the South China Sea and the Philippine Sea in Period 2 (Figure 7A,B). The above results indicate that the NPSH response to the IOBW-related SST anomalies (Figure 4 and Figure 5) is strongly modulated by the so-called ENSO diversity. This effect is realized by the westward shifts in the SST anomalies in addition to the small magnitude of the SST anomalies due to the relatively rapid decay of the tropical SST anomalies in recent years [8,31,32].
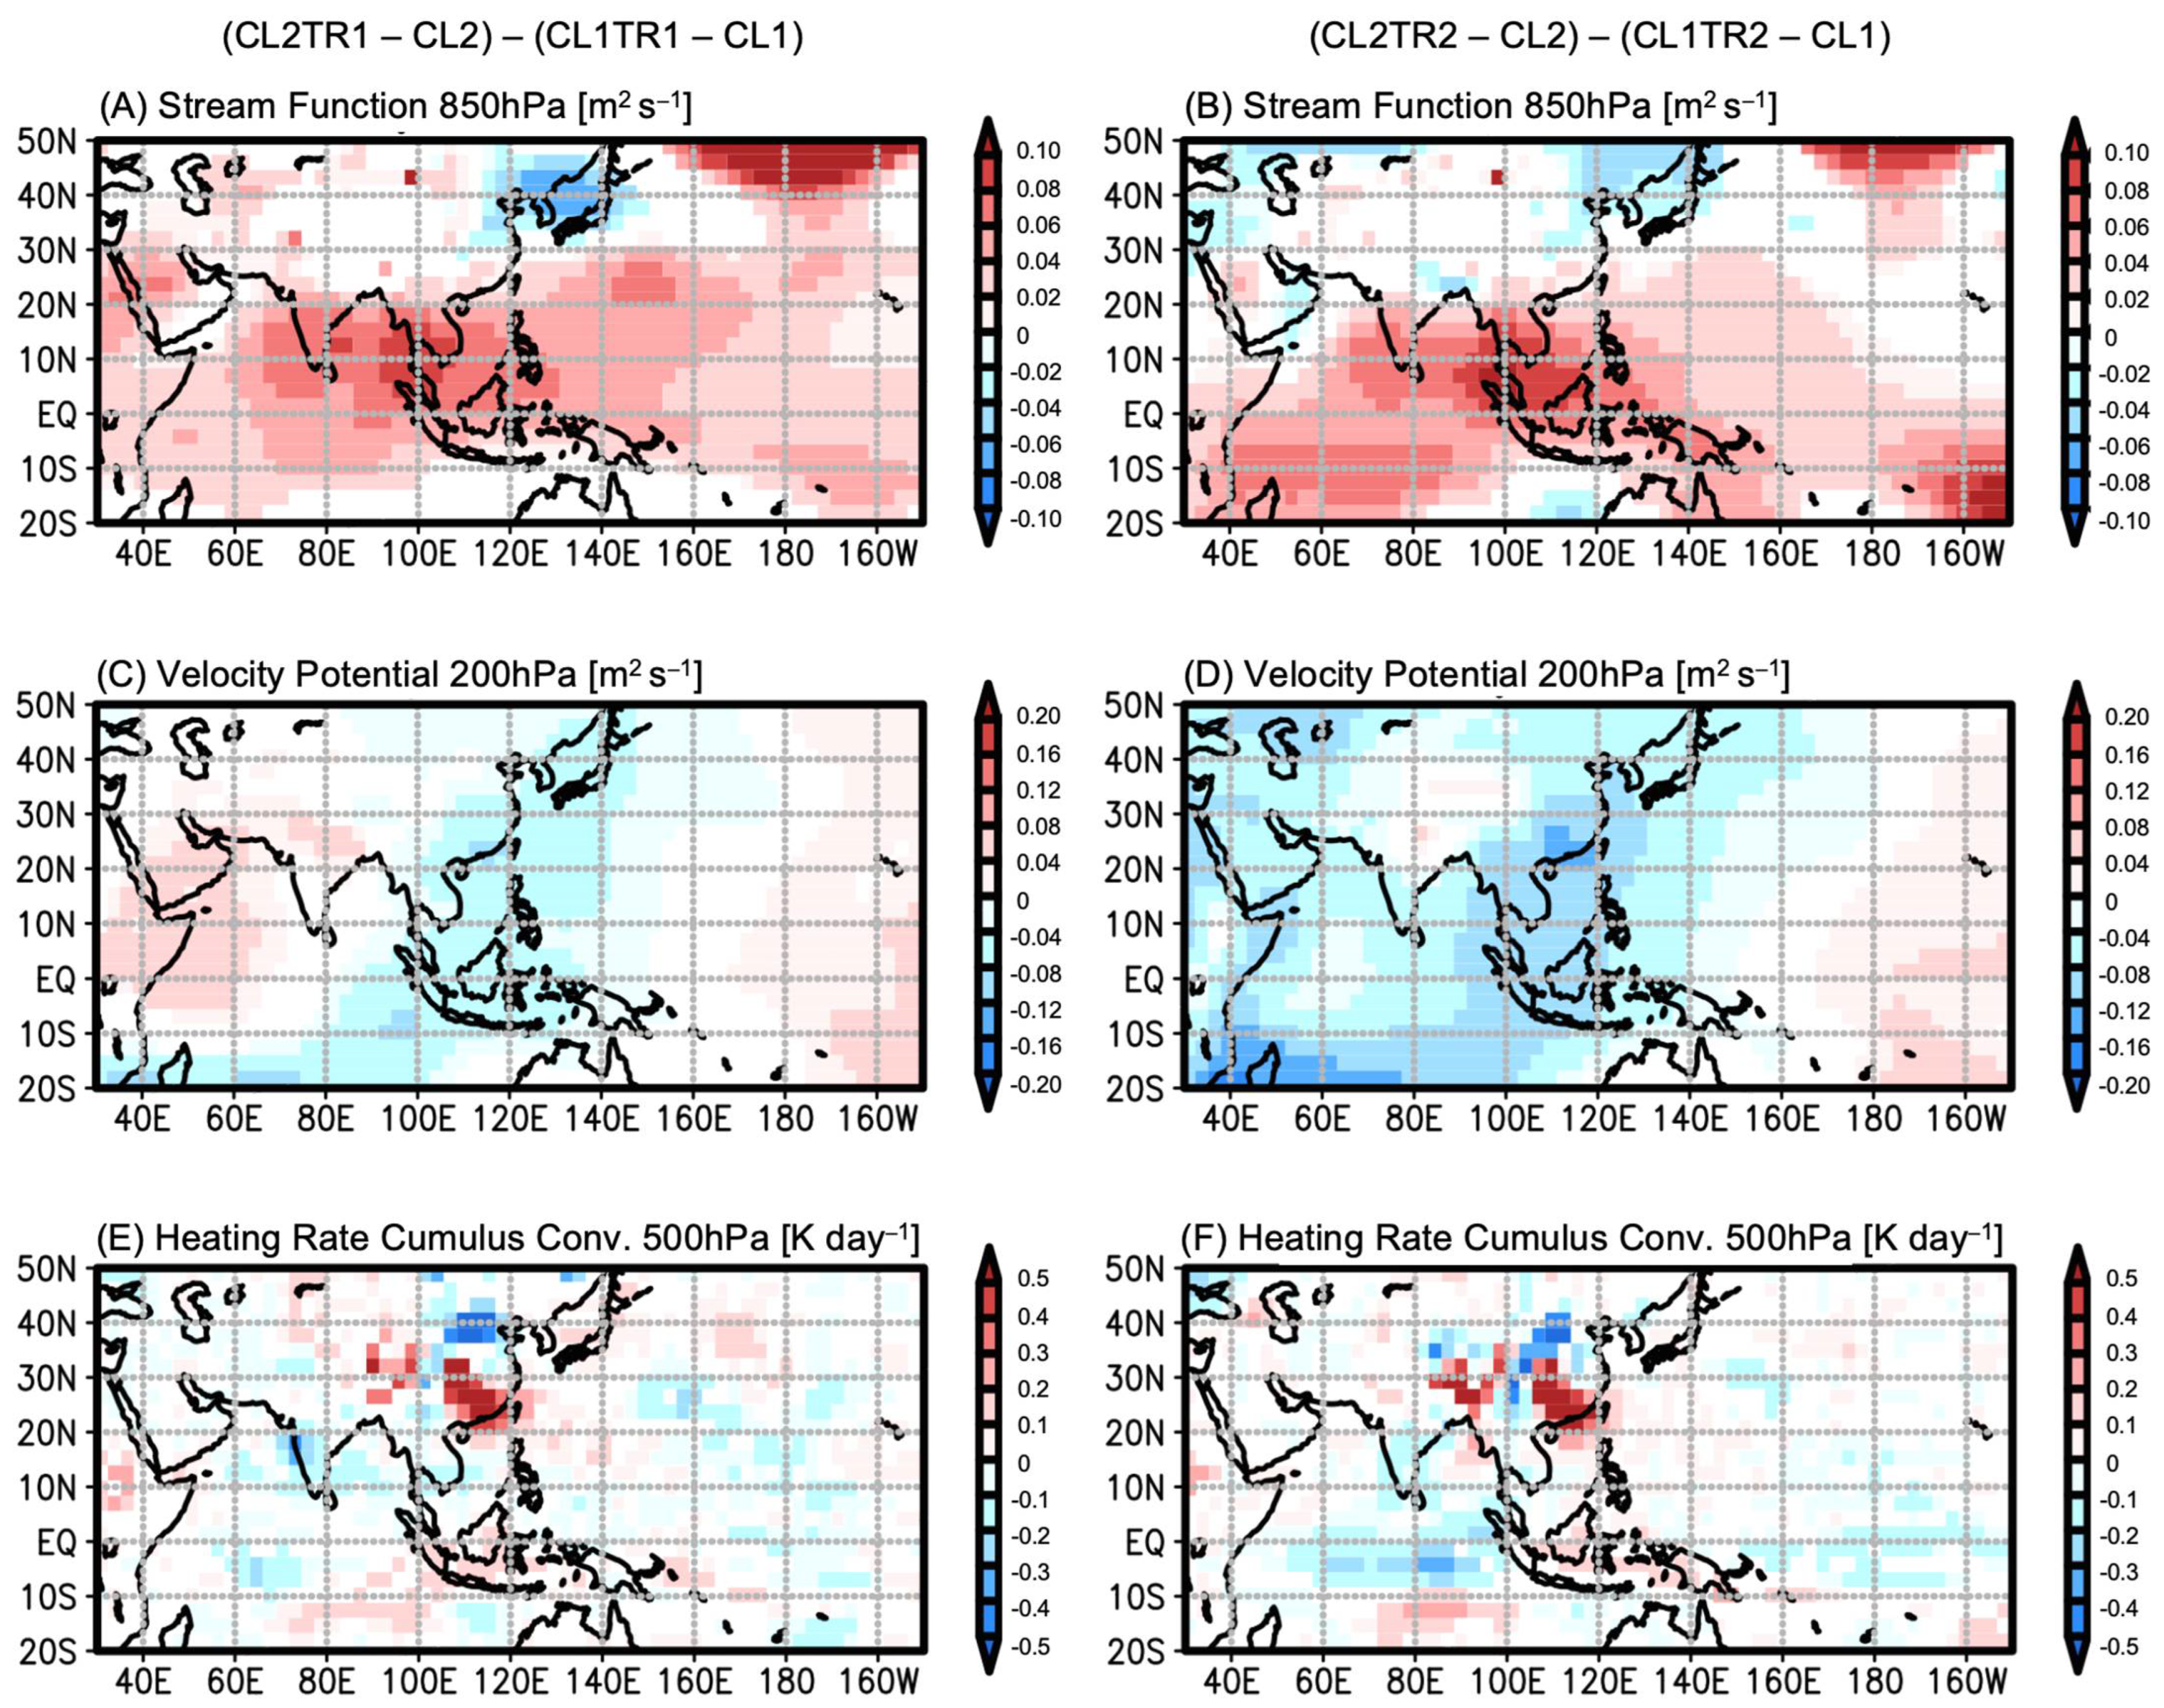
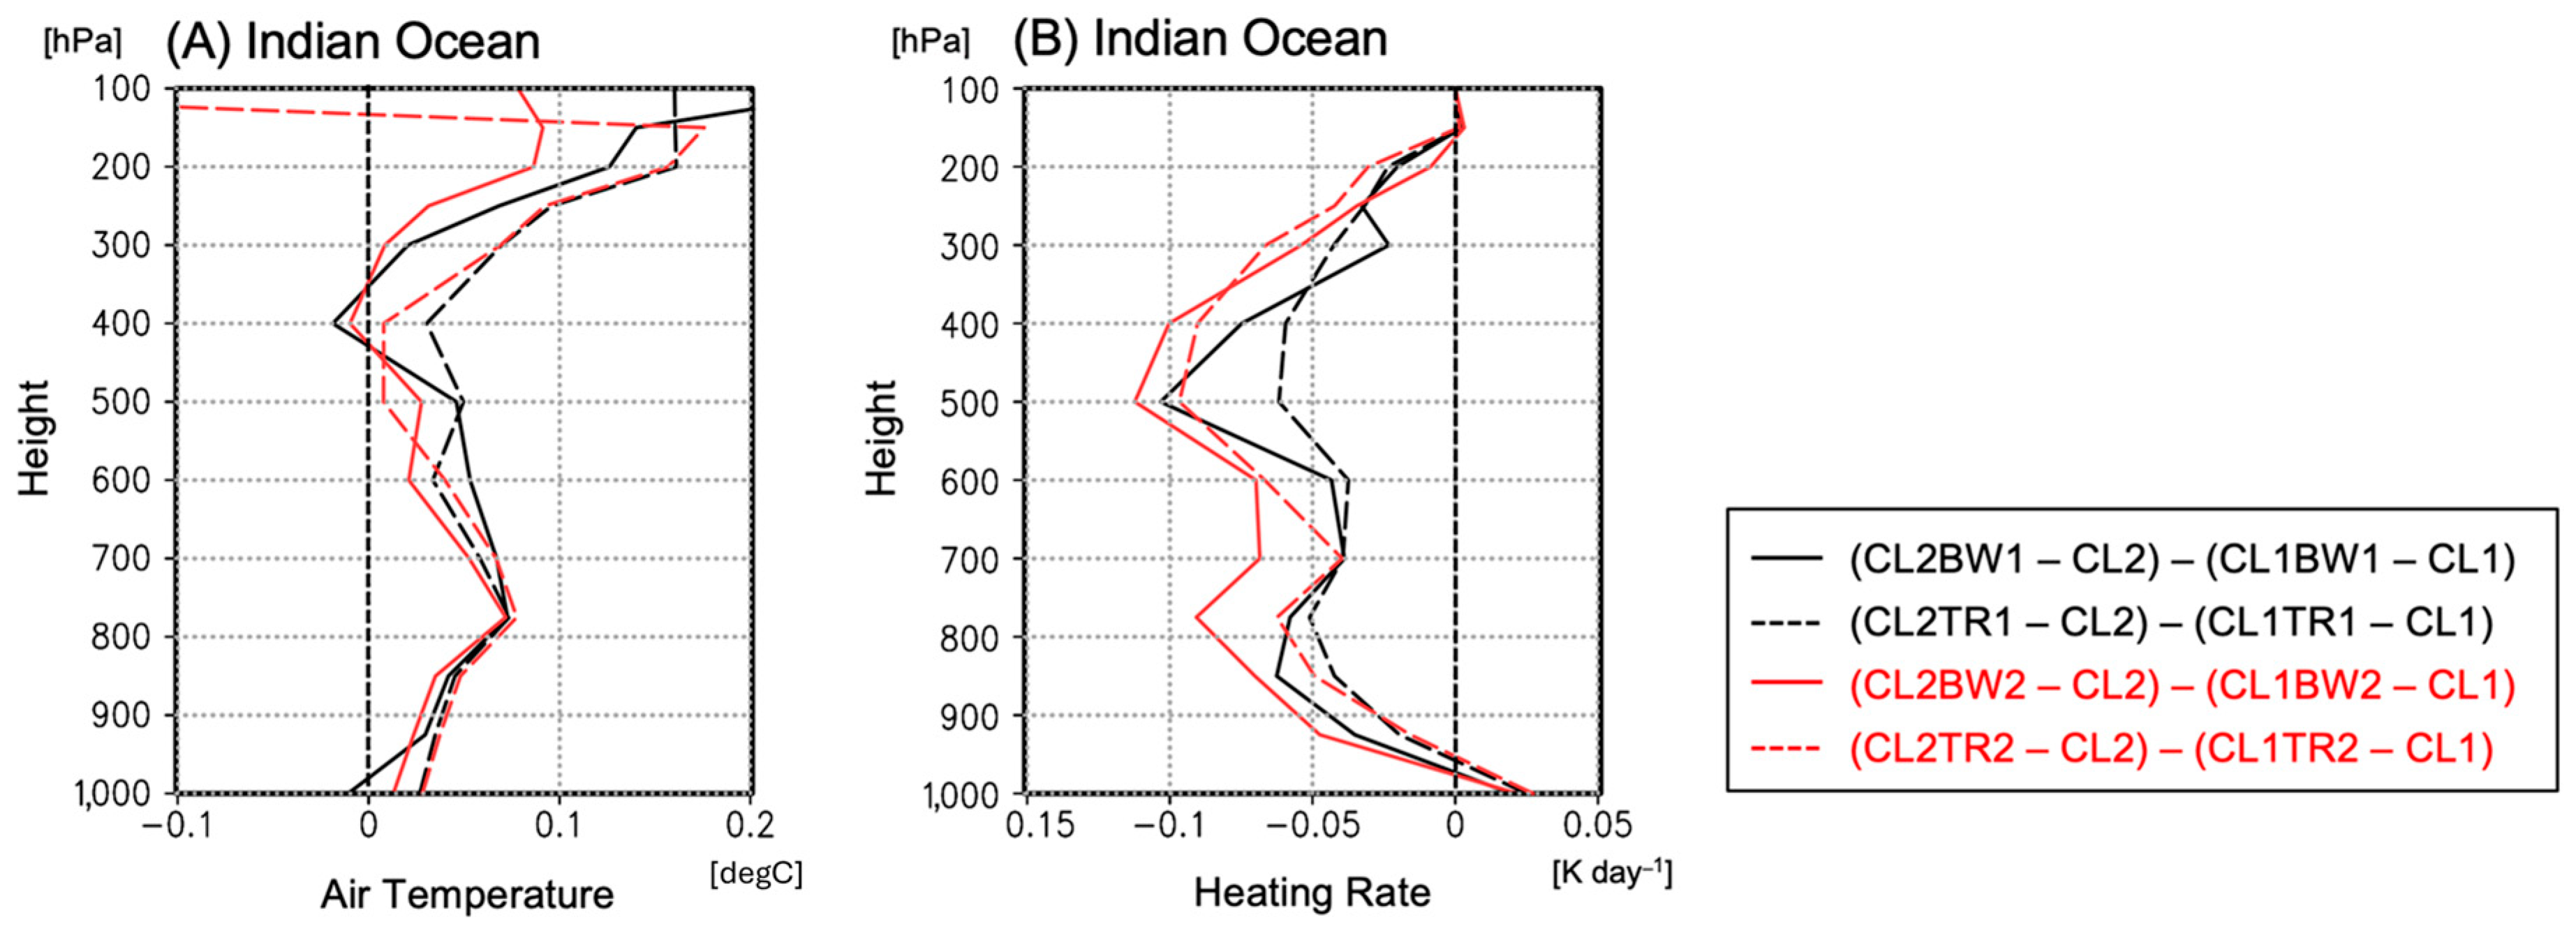
In addition to the oceanic forcing of the IOBW-related SST anomalies, the background states can modulate the influences of the IOBW by modifying the sensitivity of the atmosphere to the IOBW [40], regardless of the spatial patterns of the coexisting tropical SST anomalies. Overall, the influences of the definition of SST climatology on the atmospheric responses in terms of low-level winds and vertical motion (i.e., the stream function at 850 hPa and the convective heating rate) (Figure 8A,B,E,F) are similar to the influences of the SST differences in climatology (Figure 3A,B). In other words, the suppressed positive NPSH anomaly in Figure 5B is not related to the difference in SST climatology between Period 1 and Period 2. Although a nonlinear SST–evaporation relationship that enhances the atmospheric responses to the IOBW under the observed warming tendency of the Indian Ocean SST [30] can be speculated upon, the convective activity is suppressed in the Indian Ocean (Figure 8E,F), and the zonal winds in the upper troposphere exhibit anomalous convergence and divergence in the Indian Ocean and the Maritime Continent, respectively (Figure 8C,D). As shown in the AFES results, because the high SST increases the tropospheric air temperature (Figure 9A) and can enhance the static stability of the atmosphere over the Indian Ocean [40], the diabatic heating due to convective activity is reduced and enhanced above and below the atmospheric boundary layer, respectively (Figure 9B).

4. Conclusions

To further our understanding of the decadal modulation of the NPSH and IOBW relationship relevant to the summertime East Asian climate, we aimed to clarify the combined effects of the coexisting IOBW and tropical Pacific SST anomalies. We conducted sensitivity experiments using the AFES model, dividing the most recent four decades into two periods. We assessed potential contributing factors to the decadal modulation of the NPSH and IOBW relationship, particularly focusing on the contribution of the climatological SST states as the background and the accompanying tropical Pacific SST anomaly in relation to the rapid or slow decay of the ENSO.
The results indicate that the IOBW-related SST anomalies in the Indian and tropical Pacific Oceans—which, overall, represent the well-known characteristics of the IPOC effects—cooperatively enhanced the NPSH in Period 1 (1982–2001). On the other hand, the suppressed and westward-shifted SST anomalies and the resultant changes in the diabatic heating of cumulus convection in the tropical Pacific weakened the positive NPSH anomaly in Period 2 (2002–2021). The additional experiments indicated that the modulation in the NPSH responses in relation to the IOBW is primarily due to the so-called ENSO diversity, rather than the background states; specifically, the SST anomalies accompanying the IOBW observed mainly in the central equatorial Pacific in Period 2 exhibited the combined effects in a different manner to those observed in the eastern equatorial Pacific in Period 1. Our simulations suggested the potential contribution of decadal changes in the background states, as the enhancement in convective activity with the IOBW was suppressed in the Indian Ocean in Period 2, possibly due to the enhanced static stability of the atmosphere.
From the viewpoint of the warming tendency of the IOBW, we have gained knowledge of the combined effects, rather than individual effects, of the associated SST anomalies over the Indian and Pacific Oceans on decadal timescales. These results have implications for decadal climate prediction [56]. The decadal variability and predictability of the East Asian Monsoon and the NPSH have garnered attention with respect to both the internally generated and externally forced climate variabilities [57,58]. Some studies have reported that hindcast skills are improved for East Asian Monsoon variability in the Coupled Model Intercomparison Project phase 6 (CMIP6) [59,60]. In addition to the mean state over several years, the decadal modulation in the relationship between the NPSH and IOBW is an issue that can advance decadal prediction. It should help us to not only understand the underlying physical mechanism but also to obtain local and/or regional climate information accurately over East Asia, such as precipitation and surface air temperature, through direct and probabilistic estimations with advanced techniques such as finer-resolution climate models and large-ensemble simulations built upon the knowledge of large-scale climate variability.

Author Contributions

T.M. performed all analyses and wrote the paper. T.M. and Y.A. conceptualized the study. All authors have read and agreed to the published version of the manuscript.

Funding

This work was supported by JSPS KAKENHI, grant numbers JP24K00707, JP24H00369, and JP24H02229.

Data Availability Statement

The atmospheric reanalysis, JRA-3Q, is accessible from the Center for Computational Sciences, University of Tsukuba, at http://gpvjma.ccs.hpcc.jp/~jra3q/ (accessed on 27 April 2024). The objective analysis of SST and sea ice, cobe-sst2, is available at https://climate.mri-jma.go.jp/pub/ocean/cobe-sst2/ (accessed on 28 December 2024).

Acknowledgments

The authors thank R. Inoue for the fruitful discussion. We also express our gratitude to A. Yamazaki, T. Enomoto, and Y. Baba for their support in the use of the AFES model.

Conflicts of Interest

The authors declare no conflicts of interest.

Abbreviations

The following abbreviations are used in this manuscript:
SSTSea surface temperature
NPSHNorthwestern Pacific Subtropical High
CP-ENSOCentral Pacific El Niño–Southern Oscillation
IOBWIndian Ocean basin warming
IPOCIndo-western Pacific Ocean Capacitor
EP-ENSOEastern Pacific El Niño–Southern Oscillation
IPOInterdecadal Pacific Oscillation
CMIP5Coupled Model Intercomparison Project phase 5
AFESAtmospheric Model for the Earth Simulator
JRA-3QJapanese Reanalysis for Three Quarters of a Century
CMIP6Coupled Model Intercomparison Project phase 6

References

  1. Kawase, H.; Imada, Y.; Sasaki, H.; Nakaegawa, T.; Murata, A.; Nosaka, M.; Takayabu, I. Contribution of historical global warming to local-scale heavy precipitation in western Japan estimated by large ensemble high-resolution simulations. J. Geophys. Res. 2019, 124, 6093–6103. [Google Scholar] [CrossRef]
  2. Imada, Y.; Kawase, H. Potential seasonal predictability of the risk of local rainfall extremes estimated using high-resolution large ensemble simulations. Geophys. Res. Lett. 2021, 48, e2021GL096236. [Google Scholar] [CrossRef]
  3. Ashok, K.; Behera, S.K.; Rao, S.A.; Weng, H.; Yamagata, T. El Niño Modoki and its possible teleconnection. J. Geophys. Res. 2007, 112, C11007. [Google Scholar] [CrossRef]
  4. Kug, J.-S.; Jin, F.-F.; An, S.-I. Two types of El Niño events: Cold tongue El Niño and warm pool El Niño. J. Clim. 2009, 22, 1499–1515. [Google Scholar] [CrossRef]
  5. Song, J.; Klotzbach, P.J.; Duan, Y. Differences in western north Pacific tropical cyclone activity among three El Niño phases. J. Clim. 2020, 33, 7983–8002. [Google Scholar] [CrossRef]
  6. Xie, S.-P.; Hu, K.; Hafner, J.; Tokinaga, H.; Du, Y.; Huang, G.; Sampe, T. Indian Ocean capacitor effect on Indo-western Pacific climate during the summer following El Niño. J. Clim. 2009, 22, 730–747. [Google Scholar] [CrossRef]
  7. Xie, S.-P.; Kosaka, Y.; Du, Y.; Hu, K.; Chowdary, J.S.; Huang, G. Indo-western Pacific ocean capacitor and coherent climate anomalies in post-ENSO summer: A review. Adv. Atmos. Sci. 2016, 33, 411–432. [Google Scholar] [CrossRef]
  8. Mochizuki, T. Interannual Fluctuations and Their Low-Frequency Modulation of Summertime Heavy Daily Rainfall Potential in Western Japan. Atmosphere 2024, 15, 814. [Google Scholar] [CrossRef]
  9. Stuecker, M.F.; Jin, F.-F.; Timmermann, A.; McGregor, S. Combination mode dynamics of the anomalous Northwest Pacific anticyclone. J. Clim. 2015, 28, 1093–1111. [Google Scholar] [CrossRef]
  10. Zhang, W.; Jin, F.-F.; Stuecker, M.F.; Wittenberg, A.T.; Timmermann, A.; Ren, H.-L.; Kug, J.-S.; Cai, W.; Cane, M. Unraveling El Niño’s impact on the East Asian Monsoon and Yangtze River summer flooding. Geophys. Res. Lett. 2016, 43, 11375–11382. [Google Scholar] [CrossRef]
  11. Nitta, T. Global features of the Pacific-Japan oscillation. Meteor. Atmos. Phys. 1989, 41, 5–12. [Google Scholar] [CrossRef]
  12. Xie, M.; Wang, C.; Chen, S. The role of the maritime continent SST anomalies in maintaining the Pacific–Japan pattern on decadal time scales. J. Clim. 2022, 35, 1079–1095. [Google Scholar] [CrossRef]
  13. Yim, S.-Y.; Hjun, J.-G.; Yeh, S.-W. Decadal change in the relationship between east Asian–western North Pacific summer monsoons and ENSO in the mid-1990s. Geophys. Res. Lett. 2008, 35, L20711. [Google Scholar] [CrossRef]
  14. Park, J.-Y.; Jhun, J.-G.; Yim, S.-Y.; Kim, W.-M. Decadal changes in two types of the western North Pacific subtropical high in boreal summer associated with Asian summer monsoon/El Niño–Southern Oscillation connections. J. Geophys. Res. 2010, 115, D21129. [Google Scholar] [CrossRef]
  15. Chen, X.; Zhou, T. Relative role of tropical SST forcing in the 1990s periodicity change of the Pacific-Japan pattern interannual variability. J. Geophys. Atmos. 2014, 119, 13043–13066. [Google Scholar] [CrossRef]
  16. Sui, C.-H.; Chung, P.-H.; Li, T. Interannual and interdecadal variability of the summertime western North Pacific subtropical high. Geophys. Res. Lett. 2007, 34, L11701. [Google Scholar] [CrossRef]
  17. Zhao, H.; Wang, C. On the relationship between ENSO and tropical cyclones in the western North Pacific during the boreal summer. Clim. Dyn. 2019, 52, 275–288. [Google Scholar] [CrossRef]
  18. Mochizuki, T.; Watanabe, M. Observed and hindcasted subdecadal variability of the tropical Pacific climate. ICES J. Marine Sci. 2019, 76, 1271–1279. [Google Scholar] [CrossRef]
  19. Mochizuki, T.; Watanabe, M. Atlantic impacts on subdecadal warming over the tropical Pacific in the 2000s. Front. Clim. 2022, 4, 1040352. [Google Scholar] [CrossRef]
  20. Meehl, G.A.; Hu, A.; Santer, B.D.; Xie, S.-P. Contribution of the Interdecadal Pacific Oscillation to twentieth-century global surface temperature trends. Nat. Clim. Change 2016, 6, 1005–1008. [Google Scholar] [CrossRef]
  21. Kosaka, Y.; Xie, S.-P. The tropical Pacific as a key pacemaker of the variable rates of global warming. Nat. Geosci. 2016, 9, 669–673. [Google Scholar] [CrossRef]
  22. Liu, F.; Zhang, W.; Jin, F.F.; Hu, S. Decadal modulation of the ENSO-Indian Ocean basin warming relationship during the decaying summer by the Interdecadal Pacific Oscillation. J. Clim. 2021, 34, 2685–2699. [Google Scholar] [CrossRef]
  23. Fujiwara, K.; Kawamura, R. Appearance of a quasi-quadrennial variation in Baiu precipitation in southern Kyushu, Japan, after the beginning of this century. Sci. Online Lett. Atmos. 2022, 18, 181–186. [Google Scholar] [CrossRef]
  24. Chowdary, J.S.; Xie, S.-P.; Tokinaga, H.; Okumura, Y.M.; Kubota, H.; Johnson, N.; Zheng, X.T. Interdecadal variations in ENSO teleconnection to the Indo-Western Pacific for 1870–2007. J. Clim. 2012, 25, 1722–1744. [Google Scholar] [CrossRef]
  25. Xie, S.-P.; Du, Y.; Huang, G.; Zheng, X.-T.; Tokinaga, H.; Hu, K.; Liu, Q. Decadal shift in El Niño influences on Indo-Western Pacific and East Asian climate in the 1970s. J. Clim. 2010, 23, 3352–3368. [Google Scholar] [CrossRef]
  26. Wang, B.; Yang, J.; Zhou, T.; Wang, B. Interdecadal changes in the major modes of Asian-Australian monsoon variability: Strengthening relationship with ENSO since the late 1970s. J. Clim. 2008, 21, 1771–1789. [Google Scholar] [CrossRef]
  27. Wang, C.-Y.; Xie, S.-P.; Kosaka, Y. Indo-Western Pacific climate variability: ENSO forcing and internal dynamics in a tropical Pacific pacemaker simulation. J. Clim. 2018, 31, 10123–10139. [Google Scholar] [CrossRef]
  28. Kawamura, R.; Matsuura, T.; Iizuka, S. Role of equatorially asymmetric sea surface temperature anomalies in the Indian Ocean in the Asian summer monsoon and El Nino-Southern Oscillation coupling. J. Geophys. Res. 2001, 106, 4681–4693. [Google Scholar] [CrossRef]
  29. Chen, S.; Chen, W.; Xie, S.-P.; Yu, B.; Wu, R.; Wang, Z.; Lan, X.; Graf, H.-F. Strengthened impact of boreal winter North Pacific Oscillation on ENSO development in warming climate. Npj Clim. Atmos. Sci. 2024, 7, 69. [Google Scholar] [CrossRef]
  30. Eade, R.; Smith, D.; Scaife, A.; Wallace, E.; Dunstone, N.; Hermanson, L.; Robinson, N. Do seasonal-to-decadal climate predictions underestimate the predictability of the real world? Geophys. Res. Lett. 2014, 41, 5620–5628. [Google Scholar] [CrossRef]
  31. Annamalai, H.; Xie, S.-P.; McCreary, J.P.; Murtugudde, R. Impact of Indian Ocean Sea surface temperature on developing El Niño. J. Clim. 2005, 18, 302–319. [Google Scholar] [CrossRef]
  32. Chen, W.; Lee, J.-Y.; Ha, K.; Yun, K.-S.; Lu, R. Intensification of the Western North Pacific anticyclone response to the short decaying El Niño event due to greenhouse warming. J. Clim. 2016, 29, 3607–3627. [Google Scholar] [CrossRef]
  33. Luo, J.-J.; Sasaki, W.; Masumoto, Y. Indian Ocean warming modulates Pacific climate change. Proc. Natl. Acad. Sci. USA 2012, 109, 18701. [Google Scholar] [CrossRef] [PubMed]
  34. Mochizuki, T.; Kimoto, M.; Watanabe, M.; Chikamoto, Y.; Ishii, M. Interbasin effects of the Indian Ocean on Pacific decadal climate change. Geophys. Res. Lett. 2016, 43, 7168–7175. [Google Scholar] [CrossRef]
  35. Hu, K.; Huang, G.; Zheng, X.-T.; Xie, S.-P.; Qu, X.; Du, Y.; Liu, L. Interdecadal variations in ENSO Influences on Northwest Pacific-East Asian early summertime climate simulated in CMIP5 models. J. Clim. 2014, 27, 5982–5998. [Google Scholar] [CrossRef]
  36. Jiang, W.; Huang, G.; Hu, K.; Wu, R.; Gong, H.; Chen, X.; Tao, W. Diverse relationship between ENSO and the Northwest Pacific summer climate among CMIP5 models: Dependence on the ENSO decay pace. J. Clim. 2017, 30, 109–127. [Google Scholar] [CrossRef]
  37. Jiang, W.; Huang, G.; Huang, P.; Hu, K. Weakening of northwest Pacific anticyclone anomalies during post-El Niño summers under global warming. J. Clim. 2018, 31, 3539–3555. [Google Scholar] [CrossRef]
  38. Tao, W.; Huang, G.; Hu, K.; Qu, X.; Wen, G.; Gong, H. Interdecadal modulation of ENSO teleconnections to the Indian Ocean Basin Mode and their relationship under global warming in CMIP5 models. Int. J. Climatol. 2015, 35, 391–407. [Google Scholar] [CrossRef]
  39. Srinivas, G.; Chowdary, J.S.; Gnanaseelan, C.; Parekh, A.; Dandi, R.; Prasad, K.V.S.R.; Naidu, C.V. Impact of differences in the decaying phase of El Niño on South and East Asia summer monsoon in CMIP5 models. Int. J. Climatol. 2019, 39, 5503–5521. [Google Scholar] [CrossRef]
  40. He, C.; Zhou, T.; Li, T. Weakened anomalous Western North Pacific anticyclone during an El Niño-decaying summer under a warmer climate: Dominant role of the weakened impact of the tropical Indian Ocean on the atmosphere. J. Clim. 2019, 32, 213–230. [Google Scholar] [CrossRef]
  41. Tao, W.; Huang, G.; Hu, K.; Gong, H.; Wen, G.; Liu, L. A study of biases in simulation of the Indian Ocean basin mode and its capacitor effect in CMIP3/CMIP5 models. Clim. Dyn. 2016, 46, 205–226. [Google Scholar] [CrossRef]
  42. Gong, H.; Wang, L.; Chen, W.; Wu, R.; Huang, G.; Nath, D. Diversity of the Pacific- Japan pattern among CMIP5 models: Role of SST anomalies and atmospheric mean flow. J. Clim. 2018, 31, 6857–6877. [Google Scholar] [CrossRef]
  43. Ohfuchi, W.; Nakamura, H.; Yoshioka, M.K.; Enomoto, T.; Takaya, K.; Peng, X.; Yamane, S.; Nishimura, T.; Kurihara, Y.; Ninomiya, K. 10-km Mesh Meso-scale Resolving Simulations of the Global Atmosphere on the Earth Simulator—Preliminary Outcomes of AFES (AGCM for the Earth Simulator). J. Earth Simulator 2004, 1, 8–34. [Google Scholar]
  44. Enomoto, T.; Kuwano-Yoshida, A.; Komori, N.; Ohfuchi, W. Description of AFES 2: Improvements for High-Resolution and Coupled Simulations. In High Resolution Numerical Modelling of the Atmosphere and Ocean; Hamilton, K., Ohfuchi, W., Eds.; Springer: New York, NY, USA, 2008; pp. 77–97. [Google Scholar] [CrossRef]
  45. Annamalai, H.; Taguchi, B.; McCreary, J.P.; Nagura, M.; Miyama, T. Systematic errors in South Asian monsoon simulation: Importance of equatorial Indian Ocean processes. J. Clim. 2017, 30, 8159–8178. [Google Scholar] [CrossRef]
  46. Mochizuki, T.; Igarashi, H.; Sugiura, N.; Masuda, S.; Ishida, N.; Awaji, T. Improved coupled GCM climatologies for summer monsoon onset studies over Southeast Asia. Geophys. Res. Lett. 2007, 34, L01706. [Google Scholar] [CrossRef]
  47. Mochizuki, T.; Sugiura, N.; Awaji, T.; Toyoda, T. Seasonal climate modeling over the Indian Ocean by employing a 4D-VAR coupled data assimilation approach. J. Geophys. Res. 2009, 114, C11003. [Google Scholar] [CrossRef]
  48. Kosaka, Y.; Kobayashi, S.; Harada, Y.; Kobayashi, C.; Naoe, H.; Yoshimoto, K.; Harada, M.; Goto, N.; Chiba, J.; Miyaoka, K.; et al. The JRA-3Q reanalysis. J. Meteor. Soc. Japan 2024, 102, 49–109. [Google Scholar] [CrossRef]
  49. Hirahara, S.; Ishii, M.; Fukuda, Y. Centennial-scale sea surface temperature analysis and its uncertainty. J. Clim. 2014, 27, 57–75. [Google Scholar] [CrossRef]
  50. Ishii, M.; Fukuda, Y.; Hirahara, S.; Yasui, S.; Suzuki, T.; Sato, K. Accuracy of global upper ocean heat content estimation expected from present observational data sets. Sci. Online Lett. Atmos. 2017, 13, 163–167. [Google Scholar] [CrossRef]
  51. Ueda, H.; Kamae, Y.; Hayasaki, M.; Kitoh, A.; Watanabe, S.; Mikiand, Y.; Kumai, A. Combined effects of recent Pacific cooling and Indian Ocean warming on the Asian monsoon. Nat. Commun. 2015, 6, 8854. [Google Scholar] [CrossRef]
  52. Matsuno, T. Quasi-geostrophic motions in the equatorial area. J. Meteor. Soc. Japan 1966, 44, 25–43. [Google Scholar] [CrossRef]
  53. Gill, A.E. Some simple solutions for heat-induced tropical circulation. Quart. J. R. Met. Soc. 1980, 106, 447–462. [Google Scholar] [CrossRef]
  54. Kawamura, R.; Matsuura, T.; Iizuka, S. Interannual atmosphere-ocean variations in the tropical western North Pacific relevant to the Asian summer monsoon-ENSO coupling. J. Meteor. Soc. Japan 2001, 79, 883–898. [Google Scholar] [CrossRef]
  55. Watanabe, M.; Jin, F.F. A moist linear baroclinic model: Coupled dynamical-convective response to El Niño. J. Clim. 2003, 16, 1121–1139. [Google Scholar] [CrossRef]
  56. Boer, G.J.; Smith, D.M.; Cassou, C.; Doblas-Reyes, F.; Danabasoglu, G.; Kirtman, B.; Kushnir, Y.; Kimoto, M.; Meehl, G.A.; Msadek, R.; et al. The Decadal Climate Prediction Project (DCPP) contribution to CMIP6. Geosci. Model Dev. 2016, 9, 3751–3777. [Google Scholar] [CrossRef]
  57. Dong, X.; Xue, F. Phase transition of the Pacific decadal oscillation and decadal variation of the east Asian summer monsoon in the 20th century. Adv. Atmos. Sci. 2016, 33, 330–338. [Google Scholar] [CrossRef]
  58. Wang, B.; Jin, C.H.; Liu, J. Understanding future change of global monsoons projected by CMIP6 models. J. Clim. 2020, 33, 6471–6489. [Google Scholar] [CrossRef]
  59. Si, D.; Ding, Y.H. Oceanic forcings of the interdecadal variability in East Asian summer rainfall. J. Clim. 2016, 29, 7633–7649. [Google Scholar] [CrossRef]
  60. Jiang, D.B.; Si, D.; Lang, X.M. Evaluation of East Asian Summer Climate Prediction from the CESM Large-Ensemble Initialized Decadal Prediction Project. J. Meteor. Res. 2020, 34, 252–263. [Google Scholar] [CrossRef]
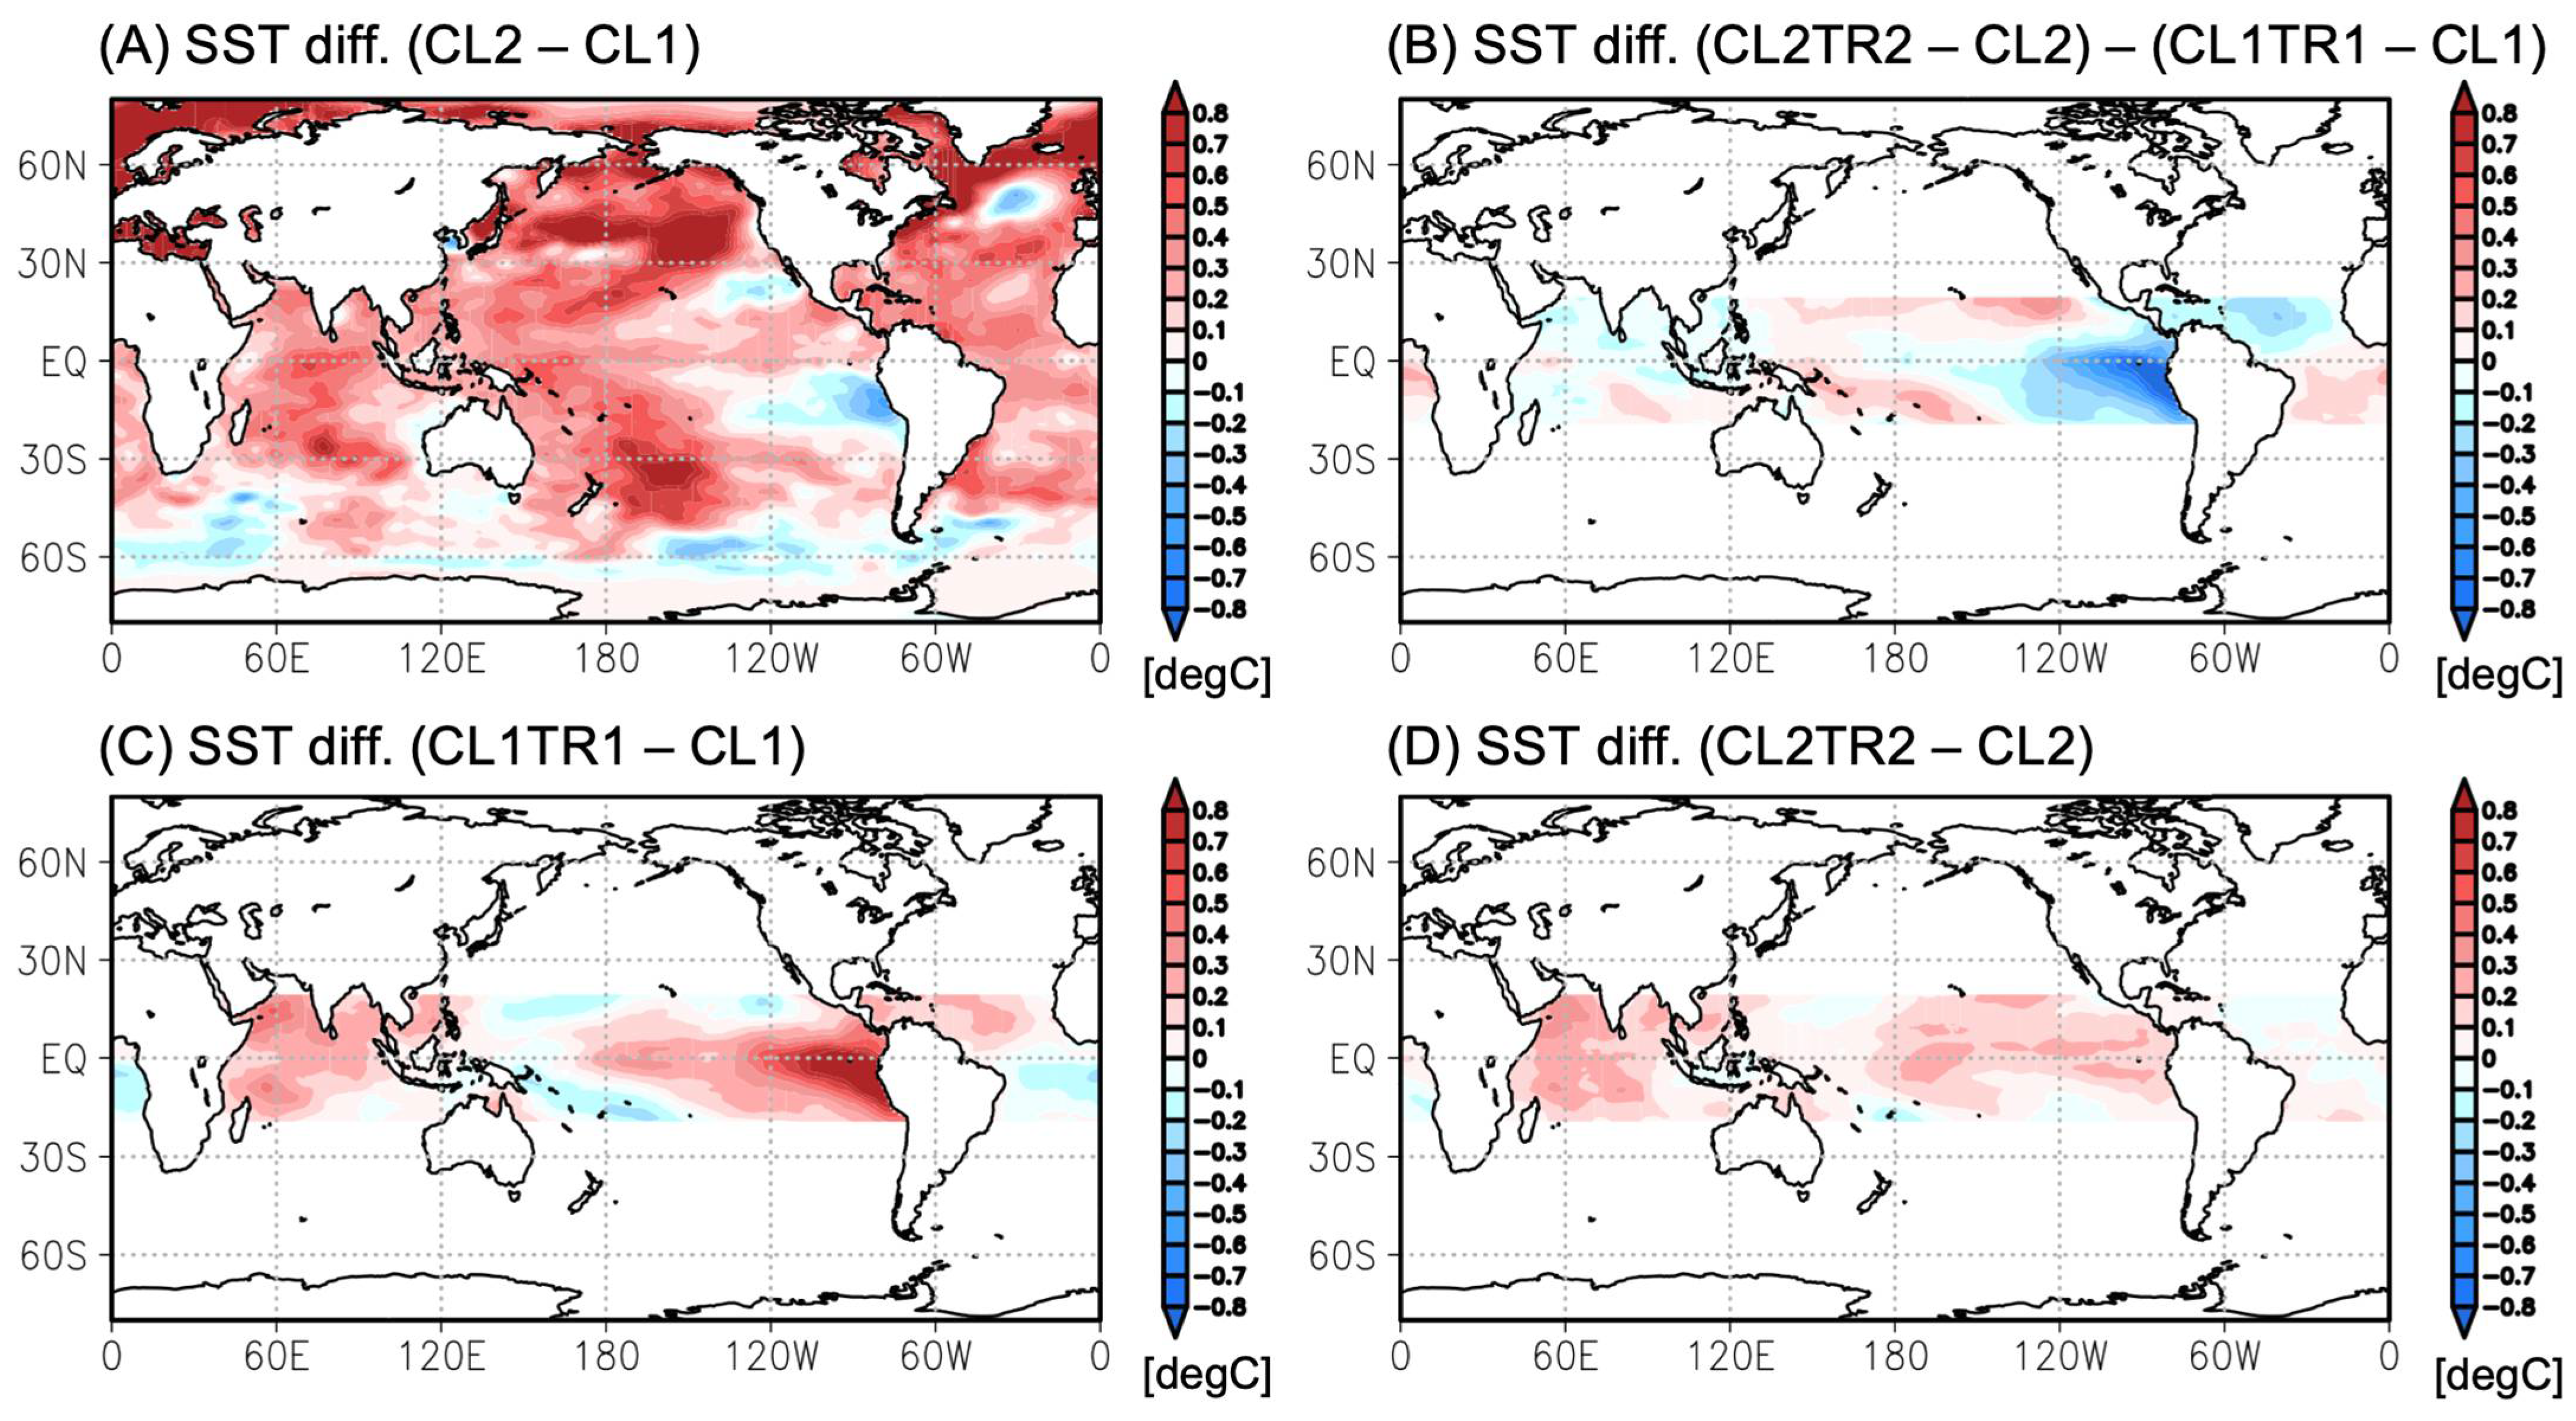
Figure 1. (A) SST differences used as boundary conditions in CL2 and CL1 simulations. The plotted values show differences in the summertime (June–July) SST climatology between Period 2 and Period 1. (B) Same as in (A), except showing the differences between panels (C,D). (C) The same as in (A), except showing the differences between CL1TR1 and CL1 simulations. The plotted values are SST regressions in the tropics (20° S–20° N) onto the Indian Ocean SST anomalies averaged over 10° S–20° N, 50° E–95° E in Period 1. (D) Same as in (C), except showing the differences between CL2TR2 and CL2 simulations.
Climate 13 00106 g001
Figure 2. Observed Indian Ocean SST anomalies averaged over 10° S–20° N, 50° E–95° E. The linear trend is removed at each grid point for Period 1 and Period 2 defined in this study.
Climate 13 00106 g002
Figure 3. (A) Differences in stream function at a height of 850 hPa between Period 1 and Period 2. The plotted areas indicate significant differences at a 95% confidence level. (B) Same as in (A), except showing the differences in precipitation.
Climate 13 00106 g003
Figure 4. (A) Differences in stream function at a height of 850 hPa between the CL1BW1 and CL1 simulations. The plotted areas indicate significant differences at a 95% confidence level. (C,E) Same as in (A), except showing velocity potential at a height of 200 hPa and heating rate estimated by the cumulus convection scheme in the model at a height of 500 hPa, respectively. (B,D,F) Same as in (A,C,E), except showing the differences between the CL1TR1 and CL1 simulations.
Climate 13 00106 g004
Figure 5. Same as in Figure 4 but showing differences between the CL2BW2 and CL2 simulations (left panels) and between the CL2TR2 and CL2 simulations (right panels).
Climate 13 00106 g005
Figure 6. (A) Zonal winds at a height of 850 hPa along the equator (i.e., averages over 10° S–10° N). (B) Vertical profile of zonal contrast of heating rate by cumulus convection between west and east of the Philippine Islands (i.e., averages over 10° N–20° N, 110° E–120° E and averages over 10° N–20° N, 130° E–150° E).
Climate 13 00106 g006
Figure 7. Same as in Figure 4 but showing differences between the CL1TR2 and CL1TR1 simulations (left panels) and between the CL2TR2 and CL2TR1 simulations (right panels).
Climate 13 00106 g007
Figure 8. Same as in Figure 4 but showing differences between the CL2TR1-CL2 and CL1TR1-CL1 simulations (left panels) and between the CL2TR2-CL2 and CL1TR2-CL1 simulations (right panels).
Climate 13 00106 g008
Figure 9. (A) Vertical profile of air temperature differences averaged over the central Indian Ocean at 10° S–10° N, 50° E–80° E. (B) Same as in (A), except showing the heating rate estimated by the cumulus convection scheme of the AFES model.
Climate 13 00106 g009
Table 1. Definition of SST values for each climatology and anomaly experiment. The top 6 simulations are the core experiments, and the bottom 4 simulations are additional experiments.
Name of SimulationSST ClimatologySST Anomaly
CL1Period 1None
CL1BW1Period 1Indian Ocean in Period 1
CL1TR1Period 1Tropical Oceans in Period 1
CL2Period 2None
CL2BW2Period 2Indian Ocean in Period 2
CL2TR2Period 2Tropical Oceans in Period 2
CL1BW2Period 1Indian Ocean in Period 2
CL1TR2Period 1Tropical Ocean in Period 2
CL2BW1Period 2Indian Ocean in Period 1
CL2TR1Period 2Tropical Ocean in Period 1
Disclaimer/Publisher’s Note: The statements, opinions and data contained in all publications are solely those of the individual author(s) and contributor(s) and not of MDPI and/or the editor(s). MDPI and/or the editor(s) disclaim responsibility for any injury to people or property resulting from any ideas, methods, instructions or products referred to in the content.