3.1. Assessment of the Effect of Macrophyte Beach Wrack on Gas Flows
During measurements of greenhouse gas emissions from the soil, the results of the carbon dioxide flux values were obtained for plots with and without storm emissions. During the measurement, it was revealed that the value of methane concentrations according to the statistical evaluation of the data did not actually change and was within the error range. Therefore, the calculation according to Equation (1) was performed for the flow of carbon dioxide.
As a result of measurements carried out on the coast of Kievka Bay on 3 August, it was noted that plots with a macrophyte beach wrack have a significantly higher CO
2 flux value compared to plots without a macrophyte beach wrack (
Figure 3,
Table 1).
Table 1 shows the mean and median values for CO
2 flux.
In plots without macrophyte beach wrack (CR and ST), the lowest mean CO
2 flux was observed in CR. These plots consisted of pebble beaches with almost complete or partially absent washed-up marine macrophytes. During storm periods, these plots were flooded with water and, together with their constituent material, did not allow for the formation of stable microbiological communities that could contribute to CO
2 production. ST plots had higher CO
2 flux values compared to CR plots. This was because ST plots were higher relative to sea level and composed of sand fraction and sparse grass areas. This indicates more stable soil conditions and, consequently, the existence of microbiological processes leading to CO
2 release. In areas with the presence of marine macrophytes, CO
2 flux values were obtained comparable to the values of CO
2 fluxes in August from typical arable soils of Primorsky Krai Luvic Anthrosol, which we noted earlier [
36]. In DM plots, the CO
2 value was 20% higher than in WM plots.
The CO2 fluxes we measured in August on plots with marine macrophytes (WM and DM) were more than an order of magnitude higher than those on plots without marine macrophytes (CR and ST). This excess is significant; however, we assume that with long-term seasonal monitoring, this indicator will be lower in measurements.
To assess the contribution of carbon dioxide and methane to the gas exchange between the atmosphere and the soil, a statistical analysis was performed, showing the reliability of the effect of the contribution of each of the gases on the total flow from the soil.
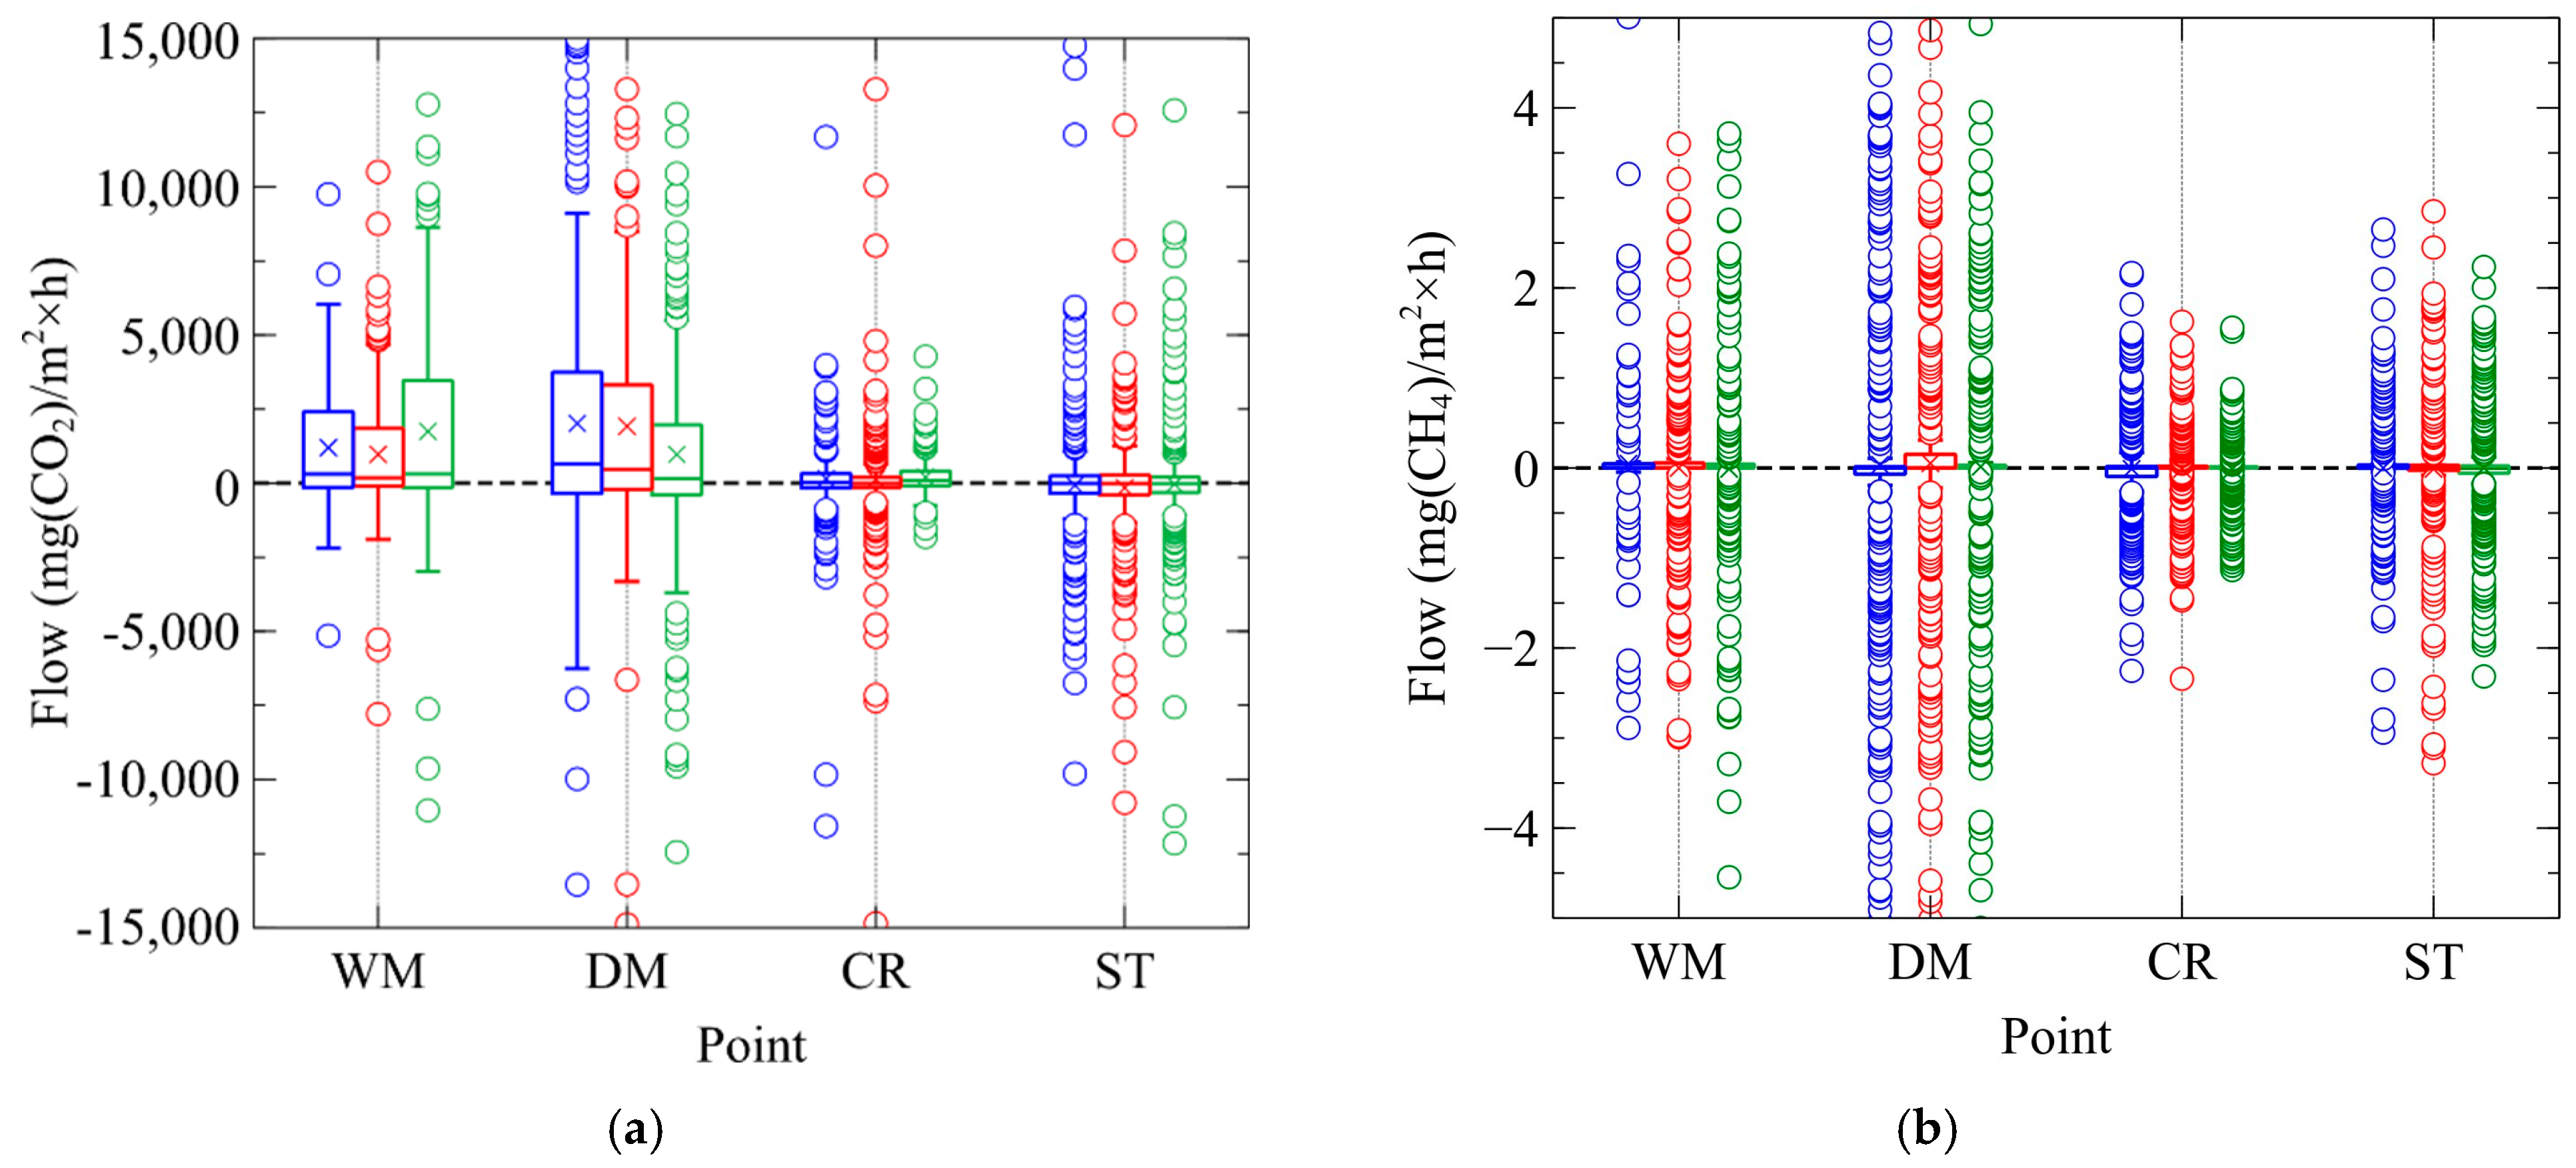
Figure 3 shows experimental data on carbon dioxide and methane fluxes (Equations (2) and (3)) obtained at research plots in the form of a box plot that demonstrates the spread and distribution of data. Visual analysis of the diagrams allows us to conclude that the distribution of experimental values significantly deviates from the normal one.
Table 2 shows the results of paired comparisons of the CO
2 flux datasets for three repetitions at each point. Since the samples of values deviated from the normal distribution, the Wilcoxon criterion was used for paired analysis. The analysis showed that for the WM, CR, and ST points, the results of repeated measurements of the CO
2 flux did not differ statistically (
p > 0.05). At the same time, a significant deviation in the third repetition was found for the DM point, which indicates the presence of statistically significant differences (
p < 0.05).
Table 3 shows the average and median values for carbon dioxide emissions.
Table 4 shows the results of a pairwise comparison of the methane emission datasets for three independent replicates at each sampling point. The analysis revealed the absence of statistically significant differences between the experimental samples (
p > 0.05), which indicates a high reproducibility of the results. The data obtained allow us to conclude that methane emissions are uniform, which is probably due to the low velocity of the gas flow in the system under study.
For carbon dioxide (CO2), high emission values are observed in the DM plot, which is due to the active processes of aerobic decomposition of plant residues during long-term stay on the shore. In the case of methane (CH4), all values are close to zero, which indicates the absence of a stable flow of this gas.
Table 5 shows the average and median values calculated after combining the repeats into a single sample. The exception was repetition number 3 for the DM point, which showed a statistically significant difference from the other two samples. For carbon dioxide (CO
2), high emission values are observed at the DM plot, which is due to the active processes of aerobic decomposition of plant residues during a prolonged stay on the shore. In the case of methane (CH
4), all values are close to zero, which indicates the absence of a stable flow of this gas.
Table 6 presents the results of the comparison of methane and carbon dioxide fluxes using the Mann–Whitney U-test. The test was applied to assess the statistical significance of differences between independent samples, as the data did not meet the assumptions of normal distribution. To improve the accuracy of the analysis, the table includes the U-statistic, significance level (
p-value), and effect size (rank-biserial correlation), which reflects the magnitude of differences between the groups.
According to the analysis, there are no statistically significant differences only for the WM-DM pair (
p > 0.05), which indicates that there is no effect of macrophyte beach wrack humidity on CO
2 flux. Thus, a decrease in CO
2 emissions is observed exclusively during the transition from the macrophyte beach wrack zone to the coastline. For methane (CH
4), all samples do not differ statistically (
Table 6), which indicates that there is no dependence of the emission level on the location of the measurement points.
Since we have proven that macrophyte beach wrack can affect the flow of greenhouse gases from soils, we conducted an experiment to assess the stability and intensity of the flow when removing storm emissions from the soil surface. Therefore, in September, a comparison of CO2 fluxes at plots with macrophyte beach wrack (WM) and after their manual removal (HM) was carried out. As for the measurements in August, it was revealed that the value of methane concentrations, according to the statistical assessment of the data, did not actually change and was within the error range.
Three of the five plots showed a decrease in the CO
2 flux after the manual removal of macrophytes from the measured surface. On average, the flow value in the plots after manual collection of macrophytes was 1.8 times lower than in the areas with macrophytes (
Figure 4,
Table 7). It is worth noting that the values of the CO
2 flux in the WM plots differed significantly from each other. As noted in the literature, this may be due to the different intensity of coastal emissions of marine macrophytes; their temperature, humidity, and species composition [
7,
9,
14]; and the degree of decomposition.
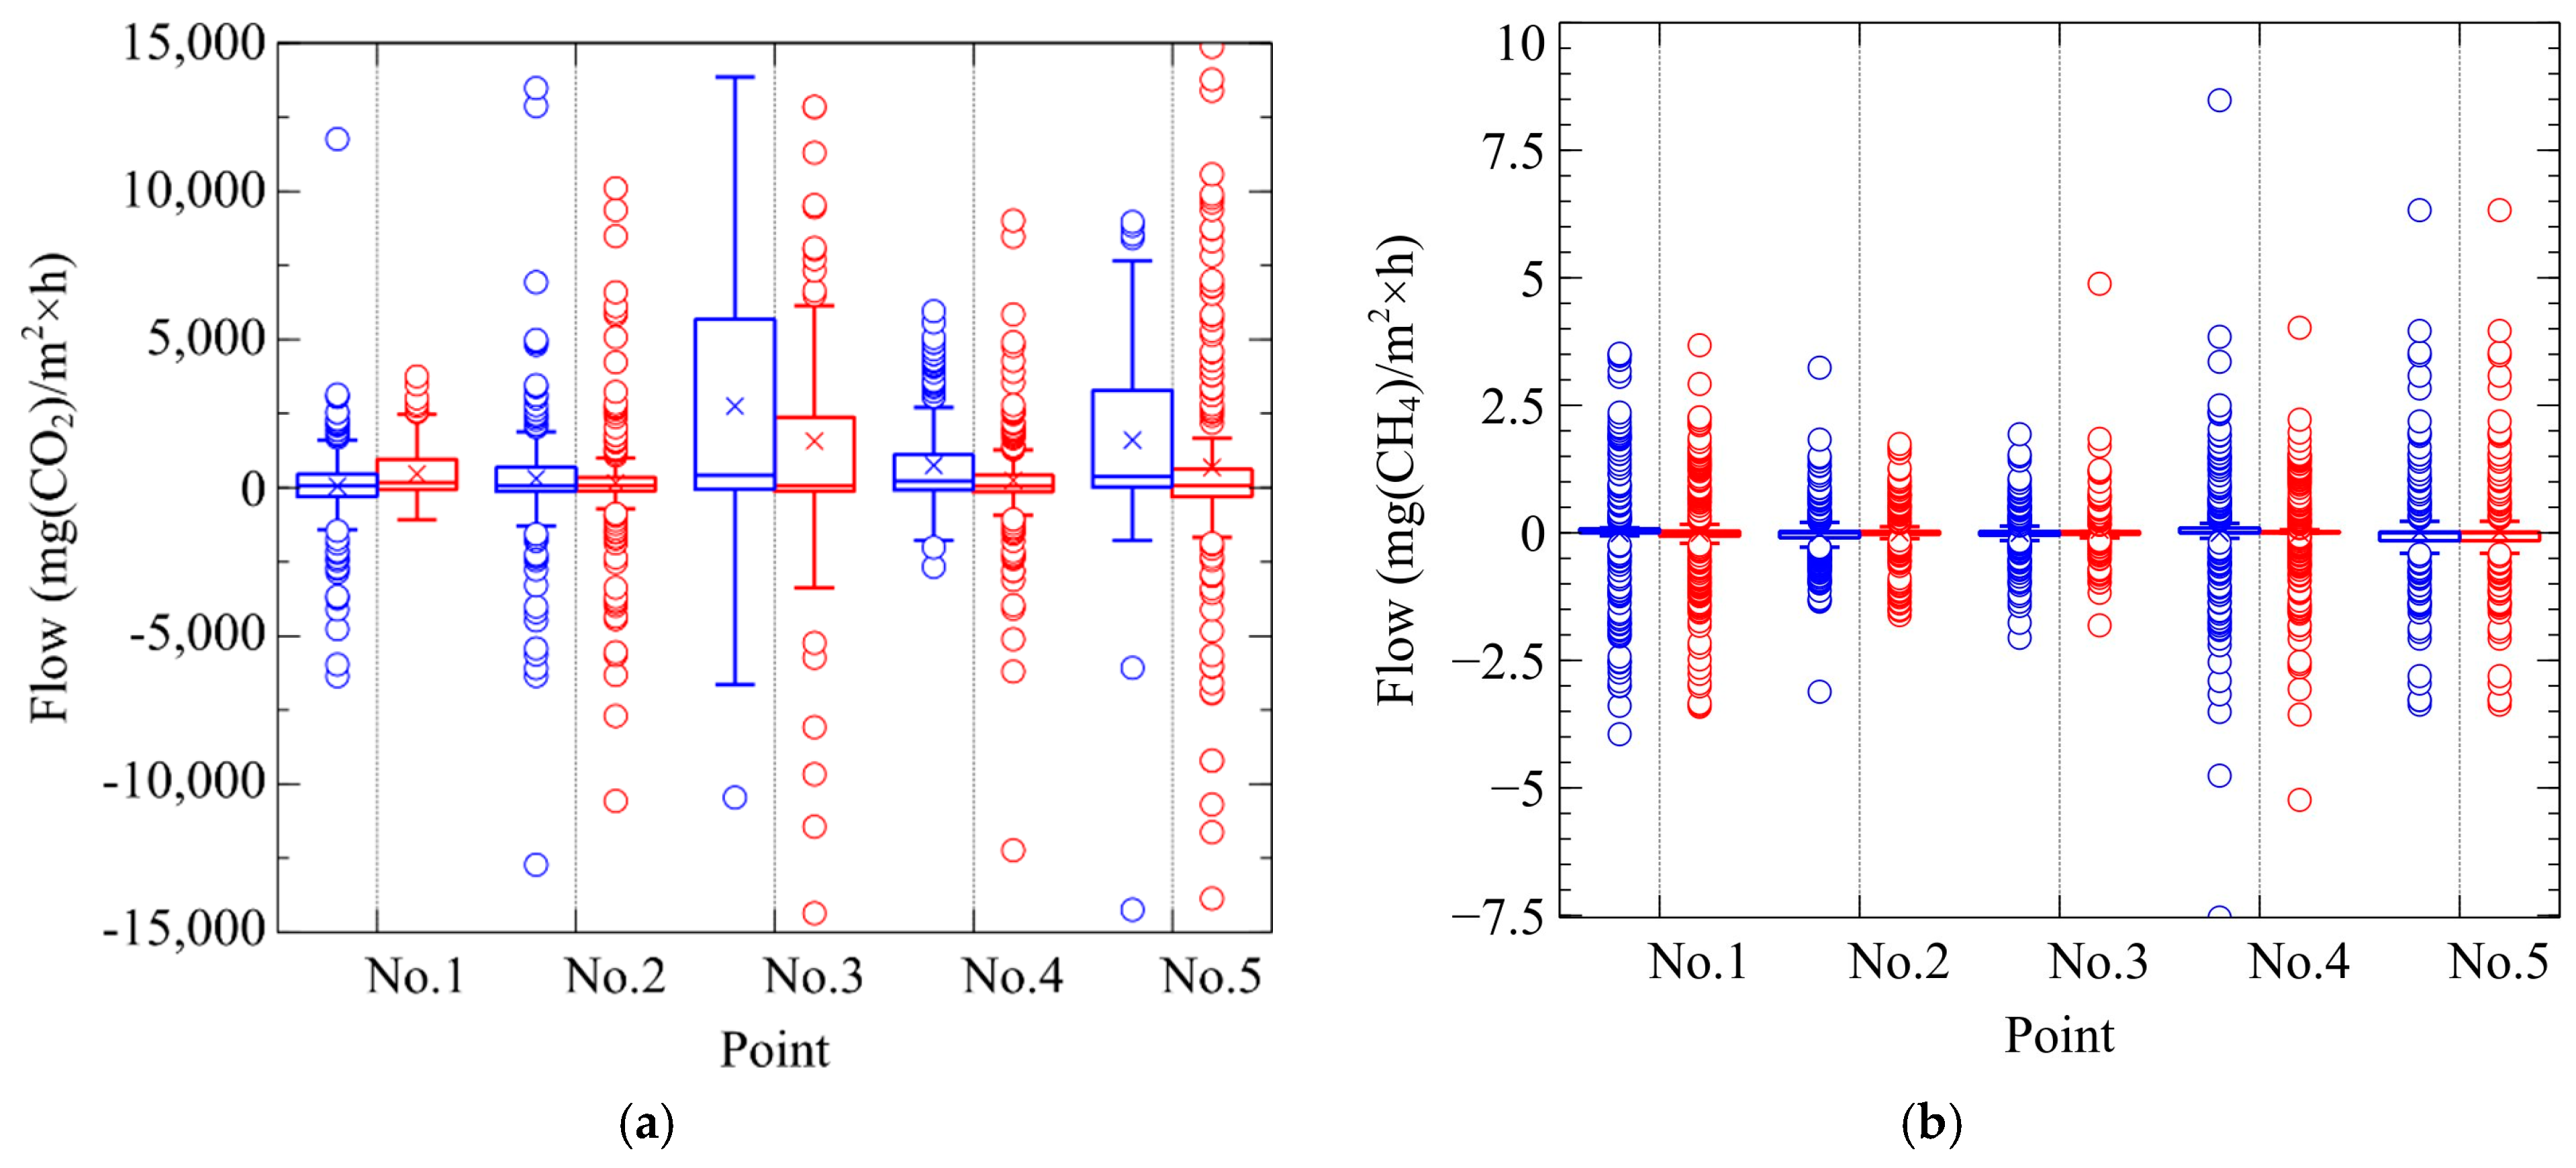
Figure 4 shows experimental data on CO2 and CH4 fluxes obtained at research plots in the form of a box plot that clearly demonstrates the spread and distribution of data. Visual analysis of the diagrams allows us to conclude that the distribution of experimental values significantly deviates from the normal one. This deviation may be due to a number of factors, such as the presence of a macrophyte beach wrack, the heterogeneity of measurement conditions, or the influence of external influences characteristic of the plots under study.
Table 7 and
Table 8 provide summary statistical characteristics of CO
2 and CH4 fluxes, including mean and median values, standard deviation, and standard error, before and after removal of the macrophyte beach wrack. These data allow us to assess the impact of outlier removal on the distribution and variability of flows. The average values reflect the overall flow rate for each gas, while the median values show a central trend resistant to the influence of the macrophyte beach wrack.
Methane is characterized by extremely low flow values, which largely assume negative values, indicating the predominance of gas absorption (sorption) processes over its flow (
Table 8). At the same time, the median values of the flow for most measurements are close to zero. This pattern may indicate instability or the absence of a pronounced source of methane in the system under study.
Thus, the observed characteristics of the methane flow reflect the predominance of its absorption processes over production under the studied conditions. This is consistent with data for many terrestrial ecosystems, where methane plays a secondary role in the carbon cycle compared to carbon dioxide. To confirm the hypotheses about the mechanisms of CH4 absorption, it is advisable to conduct additional microbiological and soil studies.
The experimental data are characterized by a significant variation in values, which may indicate a high spatial and temporal heterogeneity of the gas flows. Such variability may be due to a few factors, including the heterogeneous thickness of the macrophyte beach wrack and the time they were on land, the different composition and number of living organisms living in these areas, the composition and properties of the soils located above, geochemical conjugation, etc.
Thus, the observed variability of experimental values reflects the complexity and versatility of the processes affecting the gas flows and requires careful analysis to understand their nature and account for further research.
Table 9 shows the magnitude of the effects exerted by the removal of the macrophyte beach wrack on methane and carbon dioxide fluxes.
According to the presented results, the removal of macrophyte beach wrack has a heterogeneous effect on the amount of CO2 flux. In the case of CH4, no statistically significant changes were detected before and after the removal of the macrophyte beach wrack, which confirms the hypothesis that the CH4 flux tends to zero and is independent of the external factors studied.
Ambiguous results are also observed for the CO2 flux, in particular, the removal of the macrophyte beach wrack reduces the flux only for points No. 3, No. 4, and No. 5. For point No. 1, on the contrary, an increase in the CO2 flux is observed, while for point No. 2, no statistically significant effect was found.
The results of the calculation of the rank-biserial correlation show that the greatest positive effect when comparing pairs of samples with and without macrophyte litter is observed for point No. 3. This indicates that removing the macrophyte beach wrack at this point reduces the CO2 flux to the greatest extent. If we consider the points in descending order of the positive effect on reducing the CO2 flux, they can be arranged as follows: No. 3 > No. 5 > No. 4 > No. 2. Thus, point No. 3 shows the most pronounced effect of removing the macrophyte beach wrack, while point No. 2 is the least sensitive to this effect. At the same time, point No. 1 demonstrates the opposite effect, when the CO2 flux increases by almost 10 times after the removal of the macrophyte beach wrack.


 ,
, 

