Article

Spatiotemporal Analysis of Urban Heat Islands in Kisangani City Using MODIS Imagery: Exploring Interactions with Urban–Rural Gradient, Building Volume Density, and Vegetation Effects

by
Julien Bwazani Balandi
1,2,*,
Trésor Mbavumoja Selemani
2,
Jean-Pierre Pitchou Meniko To Hulu
3,
Kouagou Raoul Sambieni
1,2,
Yannick Useni Sikuzani
4,*,
Jean-François Bastin
2,
Prisca Tshomba Wola
1,
Jacques Elangilangi Molo
1,
Joël Mobunda Tiko
1,
Bill Mahougnon Agassounon
2,5 and
Jan Bogaert
2
1
Ecole Régionale Postuniversitaire d’Aménagement et de Gestion Intégrés des Forêts et Territoires Tropicaux, Kinshasa P.O. Box 15373, Democratic Republic of the Congo
2
Unité Biodiversité et Paysage, Gembloux Agro-Bio Tech, Université de Liège, 4000 Liège, Belgium
3
Institut Facultaire des Sciences Agronomiques de Yangambi, Kisangani P.O. Box 1232, Democratic Republic of the Congo
4
Unité Ecologie, Restauration Ecologique et Paysage, Faculté des Sciences Agronomiques, Université de Lubumbashi, Lubumbashi P.O. Box 1825, Democratic Republic of the Congo
5
Laboratoire d’Ecologie, de Botanique et de Biologie Végétale (LEB), Université de Parakou, Parakou 03 BP125, Benin
*
Authors to whom correspondence should be addressed.
Climate 2025, 13(5), 89; https://doi.org/10.3390/cli13050089
Submission received: 7 March 2025 / Revised: 25 April 2025 / Accepted: 28 April 2025 / Published: 29 April 2025

Abstract

The urban heat island (UHI) effect has emerged in the literature as a major challenge to urban well-being, primarily driven by increasing urbanization. To address this challenge, this study investigates the spatiotemporal pattern of the UHI in the fast-growing city of Kisangani and within its urban–rural gradient from 2000 to 2024 using land surface temperature (LST) data from the MODIS 11A2 V6.1 product. Inferential and descriptive statistics were applied to examine the patterns of UHI and the relationships between the LST, building volume density (BVD), and vegetation density expressed by the Normalized Difference Vegetation Index (NDVI). The results showed that the spatial extent of the moderate UHI gradually increased from 16 km2 to 38 km2, while the high UHI increased from 9 km2 to 19 km2. Furthermore, although high UHI values (0.2 < UHI ≤ 0.3) are observed in urban areas and significant differences in UHI variations are detected across urban, peri-urban, and rural zones, the results indicate that the mean UHI in Kisangani’s urban areas remains below 0.2. Therefore, based on average UHI variations, Kisangani’s urban zones exhibit moderate disparities in LST compared to rural areas. Moreover, the LST variations significantly correlate with the building volume and vegetation densities. However, the influence of vegetation density as a predictor of LST gradually decreases while the influence of building volume density increases over time, suggesting the need to implement a synergistic development pathway to manage the interactions between urbanization, landscape change, and ecosystem service provision. This integrated approach may represent a crucial solution for mitigating the UHI effect in regions categorized as high-temperature zones.

1. Introduction

Increasing global, regional, and local urbanization fosters various environmental challenges, including urban heat islands (UHIs) [1,2]. This phenomenon arises from the temperature contrast between rural and urban zones, whereby the daily thermal amplitude of urban zones is decreased due to the diurnal absorption of solar energy, which gradually dissipates during the night [3]. Several factors, including land-use and land cover changes [4], urban architecture [5,6], and human activities, are closely linked to the UHI phenomenon, which shapes local environmental conditions [7]. The increased use of materials such as asphalt in urban landscapes increases heat retention [4], while changes in urban architecture in terms of building geometry, particularly construction patterns with tall buildings situated closely together in small spaces, create “urban canyons” that trap heat [5,6]. Additionally, emissions from transport and industry further amplify UHI effects [7,8].
Beyond environmental impacts, UHIs pose significant social and economic challenges, including increased energy consumption, deteriorating air quality, heightened health risks, and reduced water availability [7,9,10,11]. These impacts align with several United Nations Sustainable Development Goals (SDGs), particularly SDG 11 (Sustainable Cities and Communities), SDG 3 (Good Health and Well-being), and SDG 13 (Climate Action) [12]. Furthermore, the UHI effect disrupts not only the environmental equilibrium but also social dynamics, limiting outdoor activities and reducing the quality of urban life. In tropical regions, such as Kisangani City in the Democratic Republic of the Congo (DRC), where high baseline temperatures constrain livelihoods, the UHI phenomenon may exacerbate existing vulnerabilities, including food security (SDG 2) [12]. Elevated temperatures alter local microclimates [7], increase the spread of diseases, intensify the need for irrigation, and accelerate the decomposition of soil organic matter, thus reducing agricultural productivity and urban resilience. Due to these cross-cutting impacts, understanding and mitigating UHI effects is critical for advancing sustainable urban development and climate resilience in line with the 2030 Agenda.
Previous studies highlight the factors influencing UHI dynamics and their impacts across diverse geographic contexts. For example, extreme heat events, such as the 2003 European heatwave, have been linked to significant mortality increases, as observed in France, where excess deaths rose by 60% [13]. In rapidly urbanizing areas like Shanghai and Kolkata [14,15], reduced green spaces, population growth, and land cover changes have intensified UHI effects, leading to higher surface temperatures than in surrounding regions. Different mitigation strategies have emerged in response: In the UK, for example, building design and reflective materials help reduce heat accumulation [16], while in tropical cities like Kampala, well-managed urbanization has shown the potential to counteract rising temperatures [17]. However, some cities, like Accra, continue to face worsening extreme heat due to unchecked urban sprawl [18]. These findings underscore the need for tailored urban planning strategies to mitigate UHI effects in different climatic and socio-economic contexts.
Despite global research efforts, the manifestation and impact of UHI in Kisangani, DRC, remain largely unexplored. As a rapidly expanding tropical city, Kisangani has undergone significant land cover changes between 1987 and 2021 [19,20,21]. In contrast to the densely populated megacities, Kisangani presents a unique case where urban growth occurs in a tropical context with distinct climatic and land-use dynamics. While most previous UHI studies have predominantly focused on densely populated megacities, emphasizing land cover change, vegetation loss, and surface temperature patterns as primary drivers of urban heat dynamics, fewer have examined the role of urban morphology, particularly the volumetric characteristics of built environments. This research addresses this gap by integrating a spatiotemporal analysis of surface urban heat island (SUHI) dynamics with an assessment of the interactions between land surface temperature (LST) and building volume density (BVD), accounting for both building footprint and height, to provide insights into how urban morphology modulates thermal dynamics. Furthermore, spatial variations are explored across urban–rural gradients, revealing how vertical and horizontal expansion contribute to heat accumulation. This dual approach offers a more comprehensive understanding of UHI formation in rapidly expanding tropical cities, highlighting key factors for urban planning and climate adaptation strategies.
Therefore, we hypothesize that LST will vary significantly over time, accompanied by a progressive expansion of areas with moderate and high UHI intensity due to spatial transformations influencing Kisangani’s local thermal environment. Along the urbanization gradient, we expect that LST and UHI intensity in 2024 will significantly differ between zones, with higher values in urban areas likely resulting from increased landscape artificialization. Additionally, we anticipate that when analyzing the period from 2000 to 2024, LST and UHI fluctuations will show significant spatiotemporal differences across the three zones and within each zone over time. Furthermore, we expect that building volume density (BVD) and vegetation density significantly modulate the spatiotemporal patterns of LST, with the impact of BVD growing over time as Kisangani’s urban architecture changes towards denser and taller buildings.

2. Materials and Methods
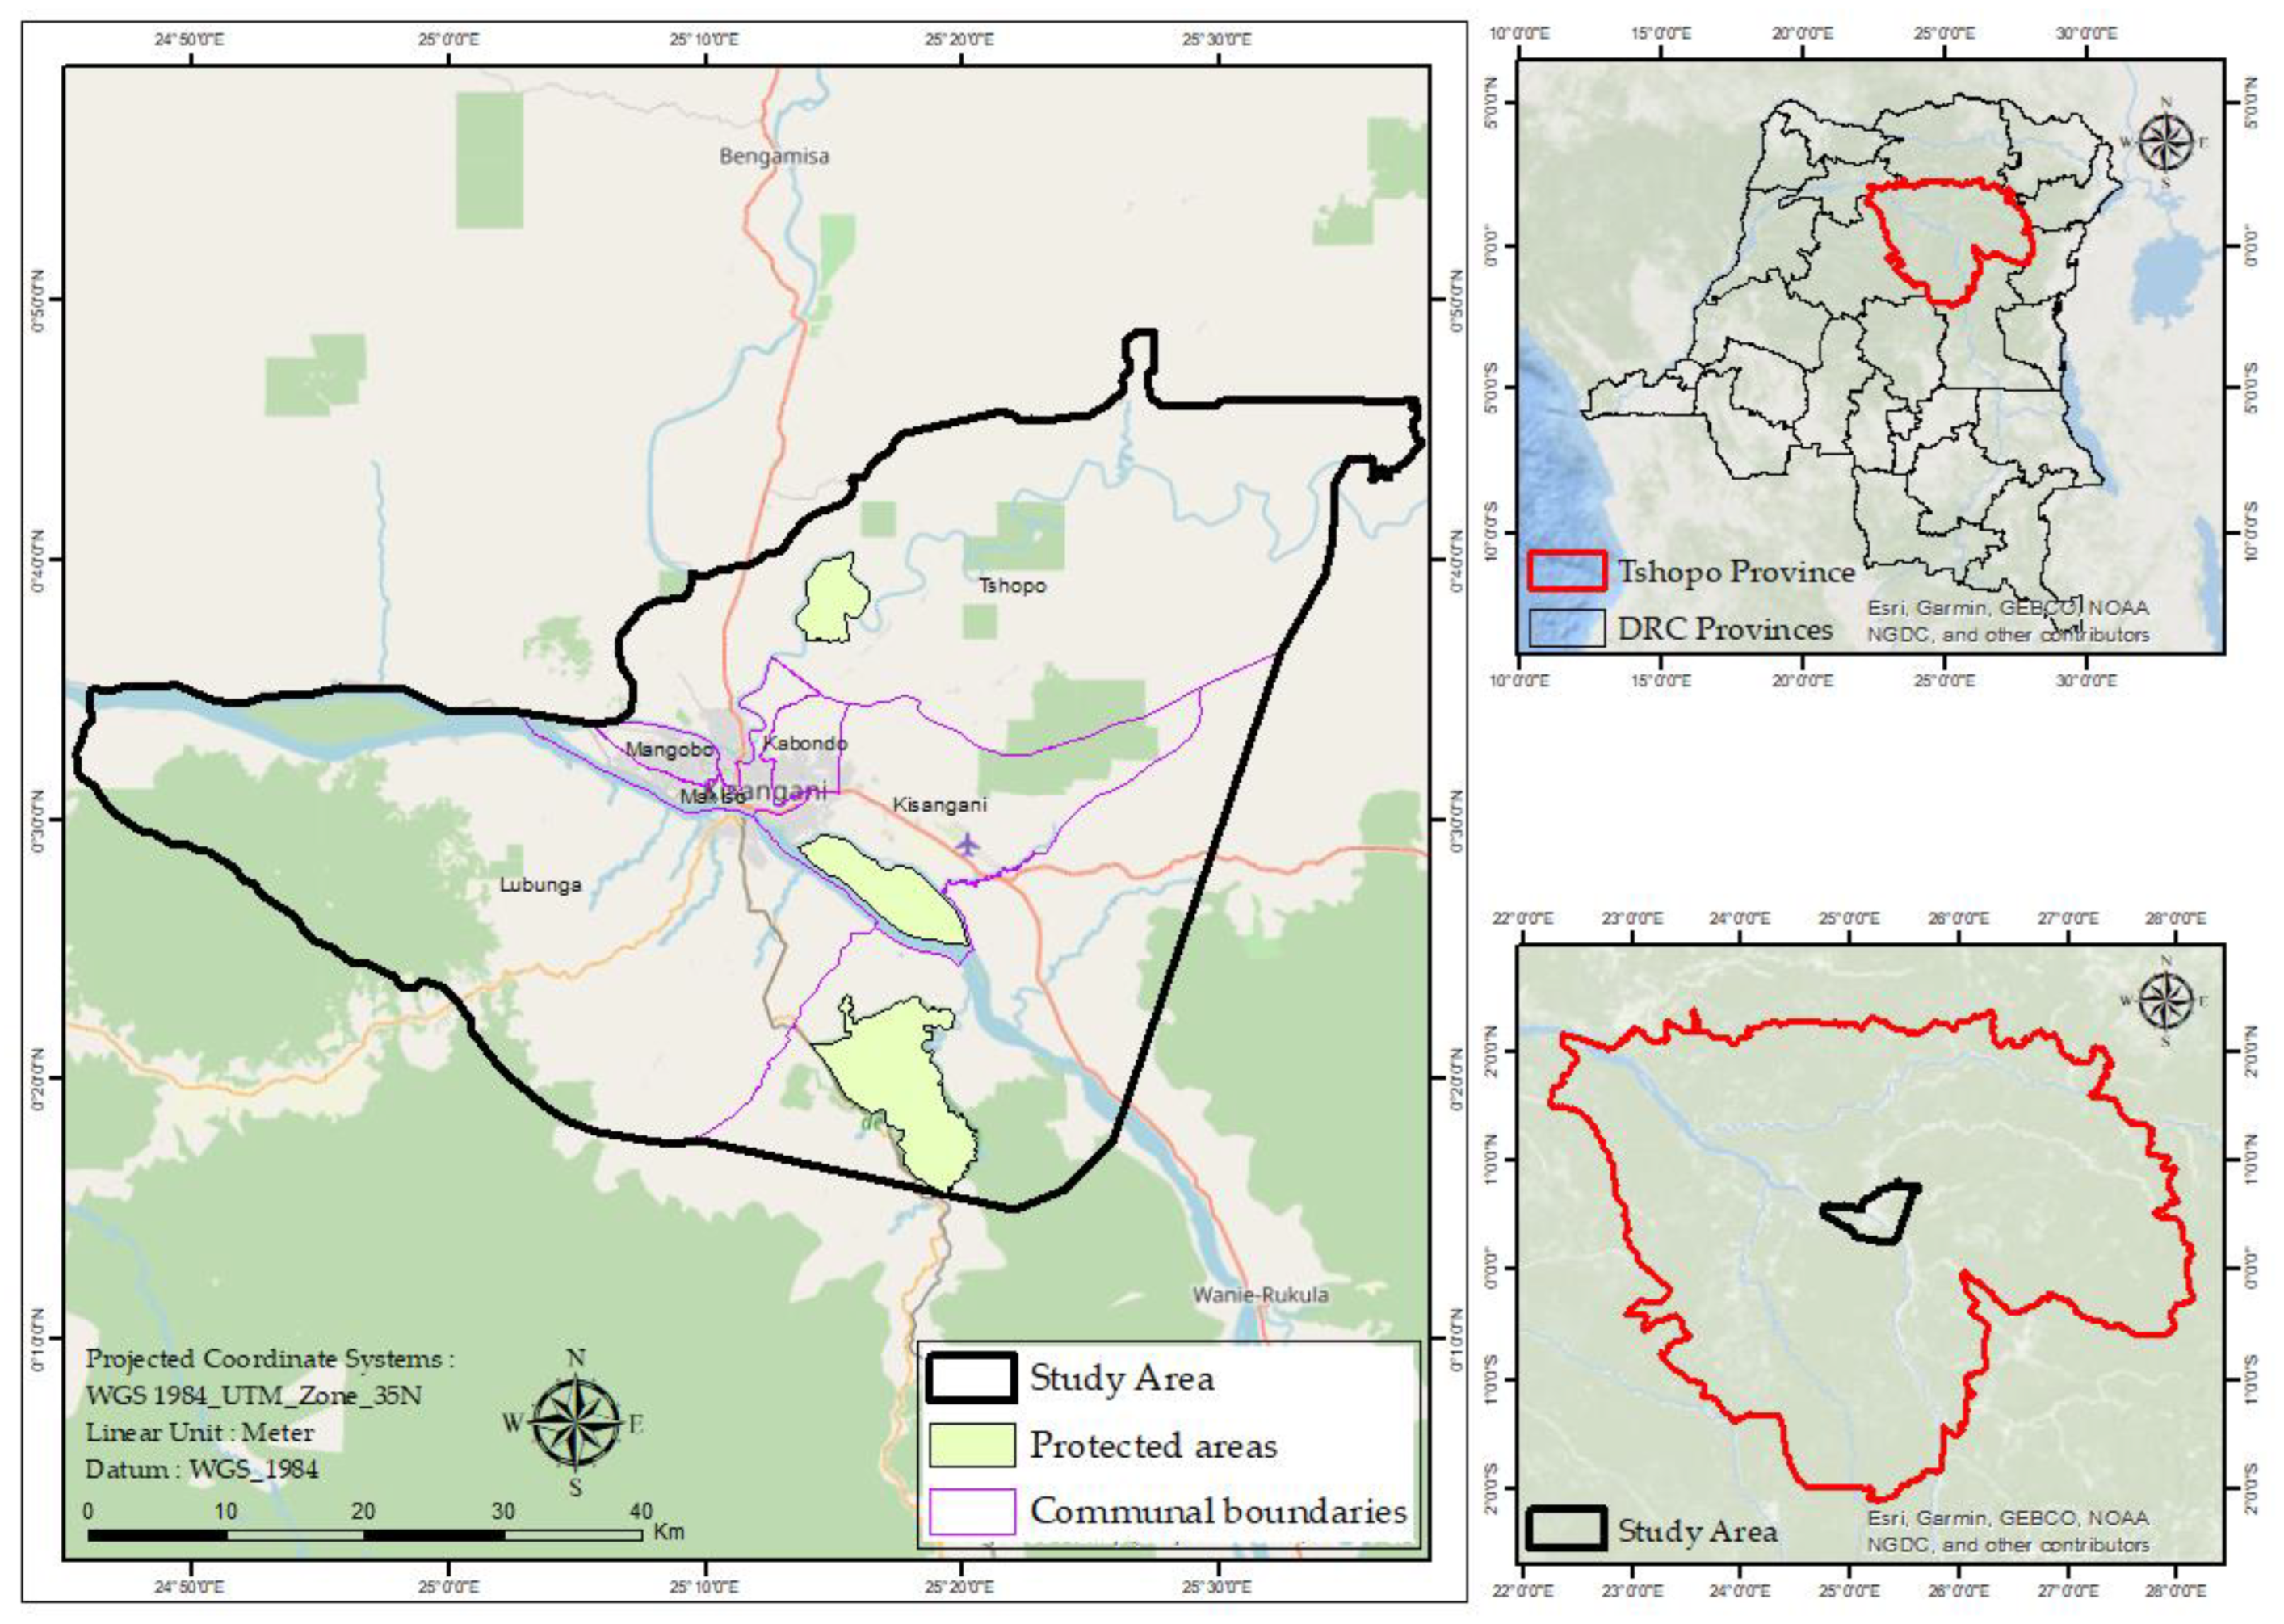
2.1. Study Area

The area examined comprises the city of Kisangani and its surroundings in north-eastern DRC (Figure 1). Covering an area of 2947.9 km2, the studied region includes six municipalities. Five of these municipalities are on the right bank of the Congo River, while one is on the left. Over 50 years (1956–2005), the region recorded an average annual rainfall of 1724 mm and a mean annual temperature of 25.3 °C [22]. Monthly rainfall consistently surpasses 60 mm year-round [22], classifying Kisangani as an Af climate type under the Köppen classification system [22,23]. Kisangani has reported substantial population growth in recent years. According to the National Statistics Institute, the city’s population surpassed 2,184,096 in 2021 [19]. A diverse mix of ethnic groups from different regions of the DRC and neighboring countries characterizes the city. Most residents sustain their livelihoods through agriculture, fishing, and trade [24]. The rising demand for social infrastructure has driven significant urban and peri-urban expansion in recent years [19].

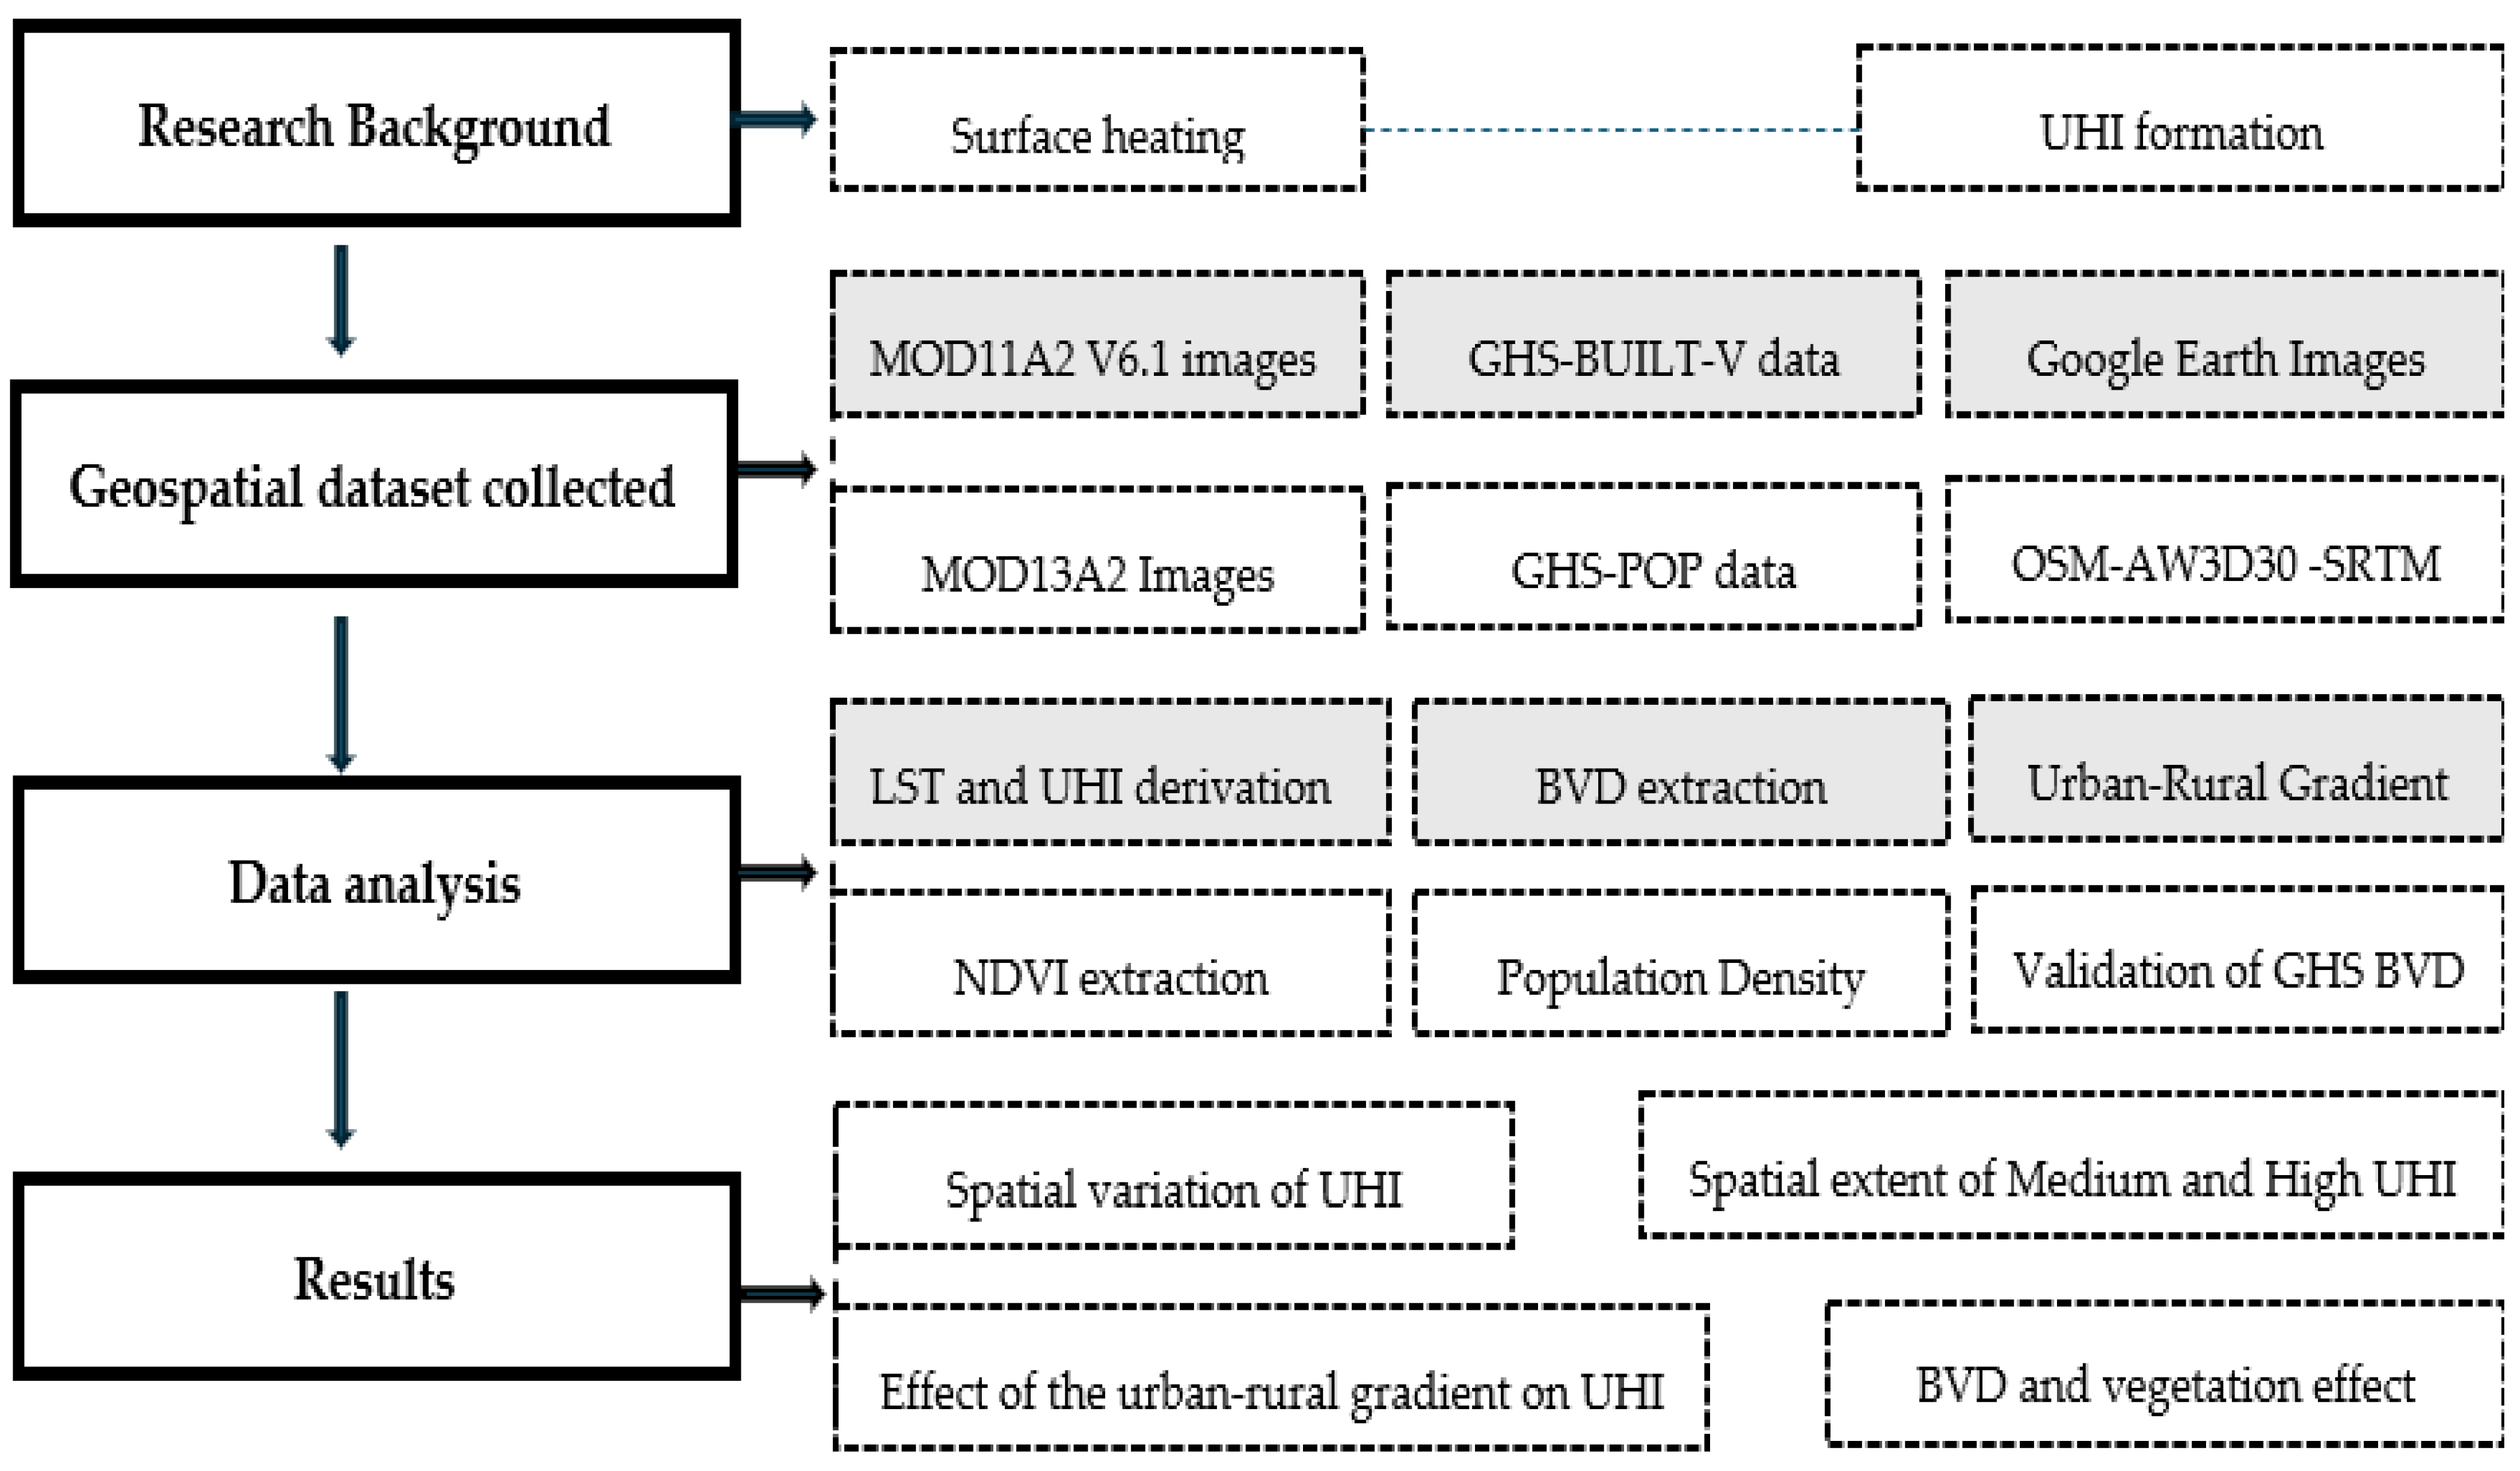
2.2. Methodological Flowchart

This methodological framework (Figure 2) outlines the research process for analyzing urban heat island (UHI) patterns, providing a structured approach for a comprehensive assessment of UHI effects across different urban contexts.

2.3. Data Used

The spatiotemporal pattern analysis of urban heat island (UHI) and vegetation density as measured by NDVI was performed using MODIS satellite data available in Google Earth Engine. Data regarding building volume and population density were obtained from the Global Human Settlement Layer (GHSL) project of the Joint Research Centre (JRC), as updated in 2023 [25].
Furthermore, high-resolution satellite imagery from Google Earth was employed to identify and characterize urban, peri-urban, and rural zones along the urbanization gradient. Table 1 below describes the data used.

2.4. Data-Processing

The Google Earth Engine (GEE) platform provides access to MODIS Land Surface Temperature (LST) products through the “MOD11A2 V6.1” image collection. Each pixel in MOD11A2 represents the mean value derived from all corresponding MOD11A1 LST pixels recorded over the 8-day interval [26]. This approach reduces the effects of punctual anomalies, such as clouds or sensor errors, by averaging data. It is, therefore, more reliable than products based on a single daily or instantaneous observation. In addition, MODIS LST data (including MOD11A2) have been extensively validated through comparisons with in situ measurements, which have consistently shown high accuracy under clear and stable atmospheric conditions [27,28]. Although MODIS offers a coarser spatial resolution (1 km) than other sensors such as Sentinel-2 or Landsat, which provide data at 10 to 30 m, it was deliberately chosen in this study for its high temporal coverage; consistent data processing algorithms that minimize anomalies; and suitability for large-scale analyses, such as urban–rural gradient assessments. With its 1 km spatial resolution, MOD11A2 remains well adapted for medium-scale studies examining thermal variations across broader spatial patterns, such as urban expansion and land-use transitions.
We extracted NDVI from the “MODIS/061/MOD13A2” dataset to assess vegetation density. This dataset provides NDVI values at a 1 km spatial resolution with a 16-day temporal resolution. Positive NDVI values indicate vegetated areas, while values near or below zero represent bare soil or water bodies [29,30].
Geospatial data on building volume and population density were obtained through the Global Human Settlement Layer (GHSL) project [25]. The GHSL building volume dataset provides a global distribution of built-up volumes (in cubic meters) at a 1 km spatial resolution. These estimates are based on data from Advanced World 3D 30 m (AW3D30), Shuttle Radar Topography Mission (SRTM30), Sentinel-2, and Landsat composites, distinguishing between total and non-residential (NRES) building volumes [25]. Since GHSL data can be subject to interpolation errors, especially in rapidly urbanizing areas, we cross-validated them with building volume estimates derived from OpenStreetMap footprints and building height values computed by subtracting digital terrain model (DTM) values (SRTM30) from digital surface model (DSM) values (AW3D30). The absence of a significant difference (p < 0.05) between GHSL building volume data and estimates derived from OpenStreetMap footprints combined with ALOS World 3D and SRTM models supports the reliability of GHSL-based analyses for Kisangani.
Furthermore, data on population density depict the distribution of the human population expressed as the number of people per cell [25]. These data cover the period from 1975 to 2030 and are spatiotemporally interpolated at five-year intervals. Intermediate-year estimates were derived using each pixel’s annual percentage change calculated between consecutive five-year periods. Thus, for example, data on building volume and population density per pixel for 2001, 2002, 2003, and 2004 were obtained by applying the annual percentage change calculated between 2000 and 2005 within each pixel.

2.5. Land Surface Temperature (LST) and Urban Heat Island (UHI) Derivation

The daily MOD11A1 LST product is generated using pixel-level LST data from individual granules, derived under clear-sky conditions through the generalized split-window algorithm. This method adjusts LST values in two thermal infrared bands, 31 and 32, to compensate for atmospheric influences. Surface emissivity values are assigned based on a reference knowledge base informed by MODIS ancillary products, including land cover and vegetation indices such as NDVI [26,27,28,29]. As such, NDVI may influence LST estimates through its role in emissivity determination, and this possible interdependence should be considered when interpreting correlations between LST and vegetation metrics.
The land surface temperature (LST) data from the MOD11A2 product were initially converted from Kelvin to Celsius by applying a scale factor of 0.02 and subtracting 273.15 [15,16,17,18,19,20,21,22,23,24,25,26]. We adopted a relative UHI approach to analyze the urban heat island (UHI) intensity, where temperature differences are expressed as a proportion of the rural background temperature [31,32]. This method allows for standardized comparison across various urbanization gradient zones and periods, making the metric more robust to seasonal and interannual variations. In this context, the average LST in rural zones served as the reference temperature (Ts), representing the baseline thermal condition of the study area [14,31,32,33]. The relative UHI intensity was then calculated using the following formula [31,32,33].
U H I = Δ T /   T s   = ( T i T s ) / T s
where UHI refers to the urban heat island intensity (UHI), measured as the relative LST in the area; ΔT is the difference between the i-th pixel LST (Ti) in °C and the average rural LST (Ts) in °C.
This method allows for evaluating temperature fluctuations across the urban–rural gradient, distinguishing thermal anomalies specific to urban areas. To facilitate the interpretation of UHI patterns, UHI values were classified into five intensity levels, as summarized in Table 2. These thresholds were adapted from previous studies [31,32,33] and contextualized to the thermal characteristics of our study region.
This classification enables a spatial and temporal mapping of UHI hotspots, contributing to a better understanding of thermal risks and urban planning needs.

2.6. Spatial Analysis and Delineation of Urban–Rural Gradient Zones

An analysis of urban heat islands (UHIs) was conducted within the urban–rural gradient of Kisangani city. In many cases, spatiotemporal analyses of the UHI effect across the urban–rural gradient are conducted using either a transect-based approach [34] or a concentric zone method [15]. However, to improve our understanding of the UHI phenomenon across the urban–rural gradient, we used a methodology that captures the spatial complexity inherent in the landscape. To achieve this, a strategic randomized sampling approach was adopted, selecting plots in different directions within each defined gradient area: north, south, east, and west, as well as northeast, northwest, southeast, and southwest. This approach enriches the data collected and accounts for the significant spatial variation that can occur perpendicular to a traditional transect. By capturing and incorporating variations at short distances, this approach avoids potential oversights that a concentric zone methodology might introduce [20].
The decision tree of Marie André et al. [19,35,36] based on morphological criteria was preferred to delineate the urbanization gradient zones because of its ability to reflect reality. These morphological criteria include vegetation, agricultural, and built-up areas, representing one of the most precise, consistent, and evolving morphological indicators [19,20,37,38]. Thus, for each date from 2000 to 2024, high-resolution satellite data available on Google Earth were used. Using a Geographic Information System (GIS), the intensity level of each pixel was highlighted in a range from 0 to 255. Built-up pixels, characterized by impermeable surfaces (roads, roofs, and compacted floors), were characterized by intensity values ranging from 80 to 255. Agricultural and grassland pixels were represented by intensity values between 50 and 80, depending on their stage of development (cultivated land or fallow land). In contrast, forest pixels were characterized by intensity values below 50. Data on population density supported the morphological criteria, increasing the credibility of the urbanization gradient. The increase or decrease in population density affects the landscape configuration and composition, and this variable is expected to decrease from urban to rural areas [19,37,39].
Thus, for each year, a plot is classified as urban if more than 50% of its area is covered by built-up pixels [19,35,36,38] within a cell with a population density greater than 100 inhabitants per km2 [19]. The population density threshold of 100 inhabitants per km2 was chosen as it represents one of the lowest densities observed near Kisangani’s urban center from 2000 to 2024. It serves as a practical marker to identify areas transitioning to urban characteristics and distinguish them from rural zones. Conversely, a parcel with 50% or fewer built-up pixels in a cell with a population density greater than or equal to 100 inhabitants per km2 is considered peri-urban, as long as the remaining pixels do not exclusively represent forest or agricultural zones [19,20,21,22,23,24,25,26,27,28,29,30,31,32,33,34,35,36]. On the other hand, a parcel is considered rural if it consists mainly of vegetation pixels [19,35,36].
A total of 86 plots (Figure 3), each covering a spatial dimension of 1 km2, corresponding to the spatial resolution of the MODIS data used, were randomly selected from each zone in the reference year (2024). The random sampling technique was employed to reduce potential bias and improve the applicability of the results on the landscape scale. This method is essential to objectively assess the variability present in the landscape and provide a complete view of the impact of urbanization on the UHI phenomenon across the urban–rural gradient. However, it is important to note that spatial features in these observation plots have evolved, reflecting the dynamic properties of urban, peri-urban, and rural zones.
As samples have satisfied the key assumptions for parametric tests, including data normality and homogeneity of variances, we applied an analysis of variance (ANOVA) test to assess the spatial variations in the LST and the UHI effect across urban, peri-urban, and rural zones. Additionally, this approach was employed to assess the temporal effects of various years on LST and UHI variations. Furthermore, we conducted linear regression analyses to assess the impacts of building volume density (BVD) and vegetation density. The historical trends observed in the slope and coefficient of determination from these regressions have enhanced our understanding of the roles of building volume density and vegetation density as predictors of LST.

3. Results

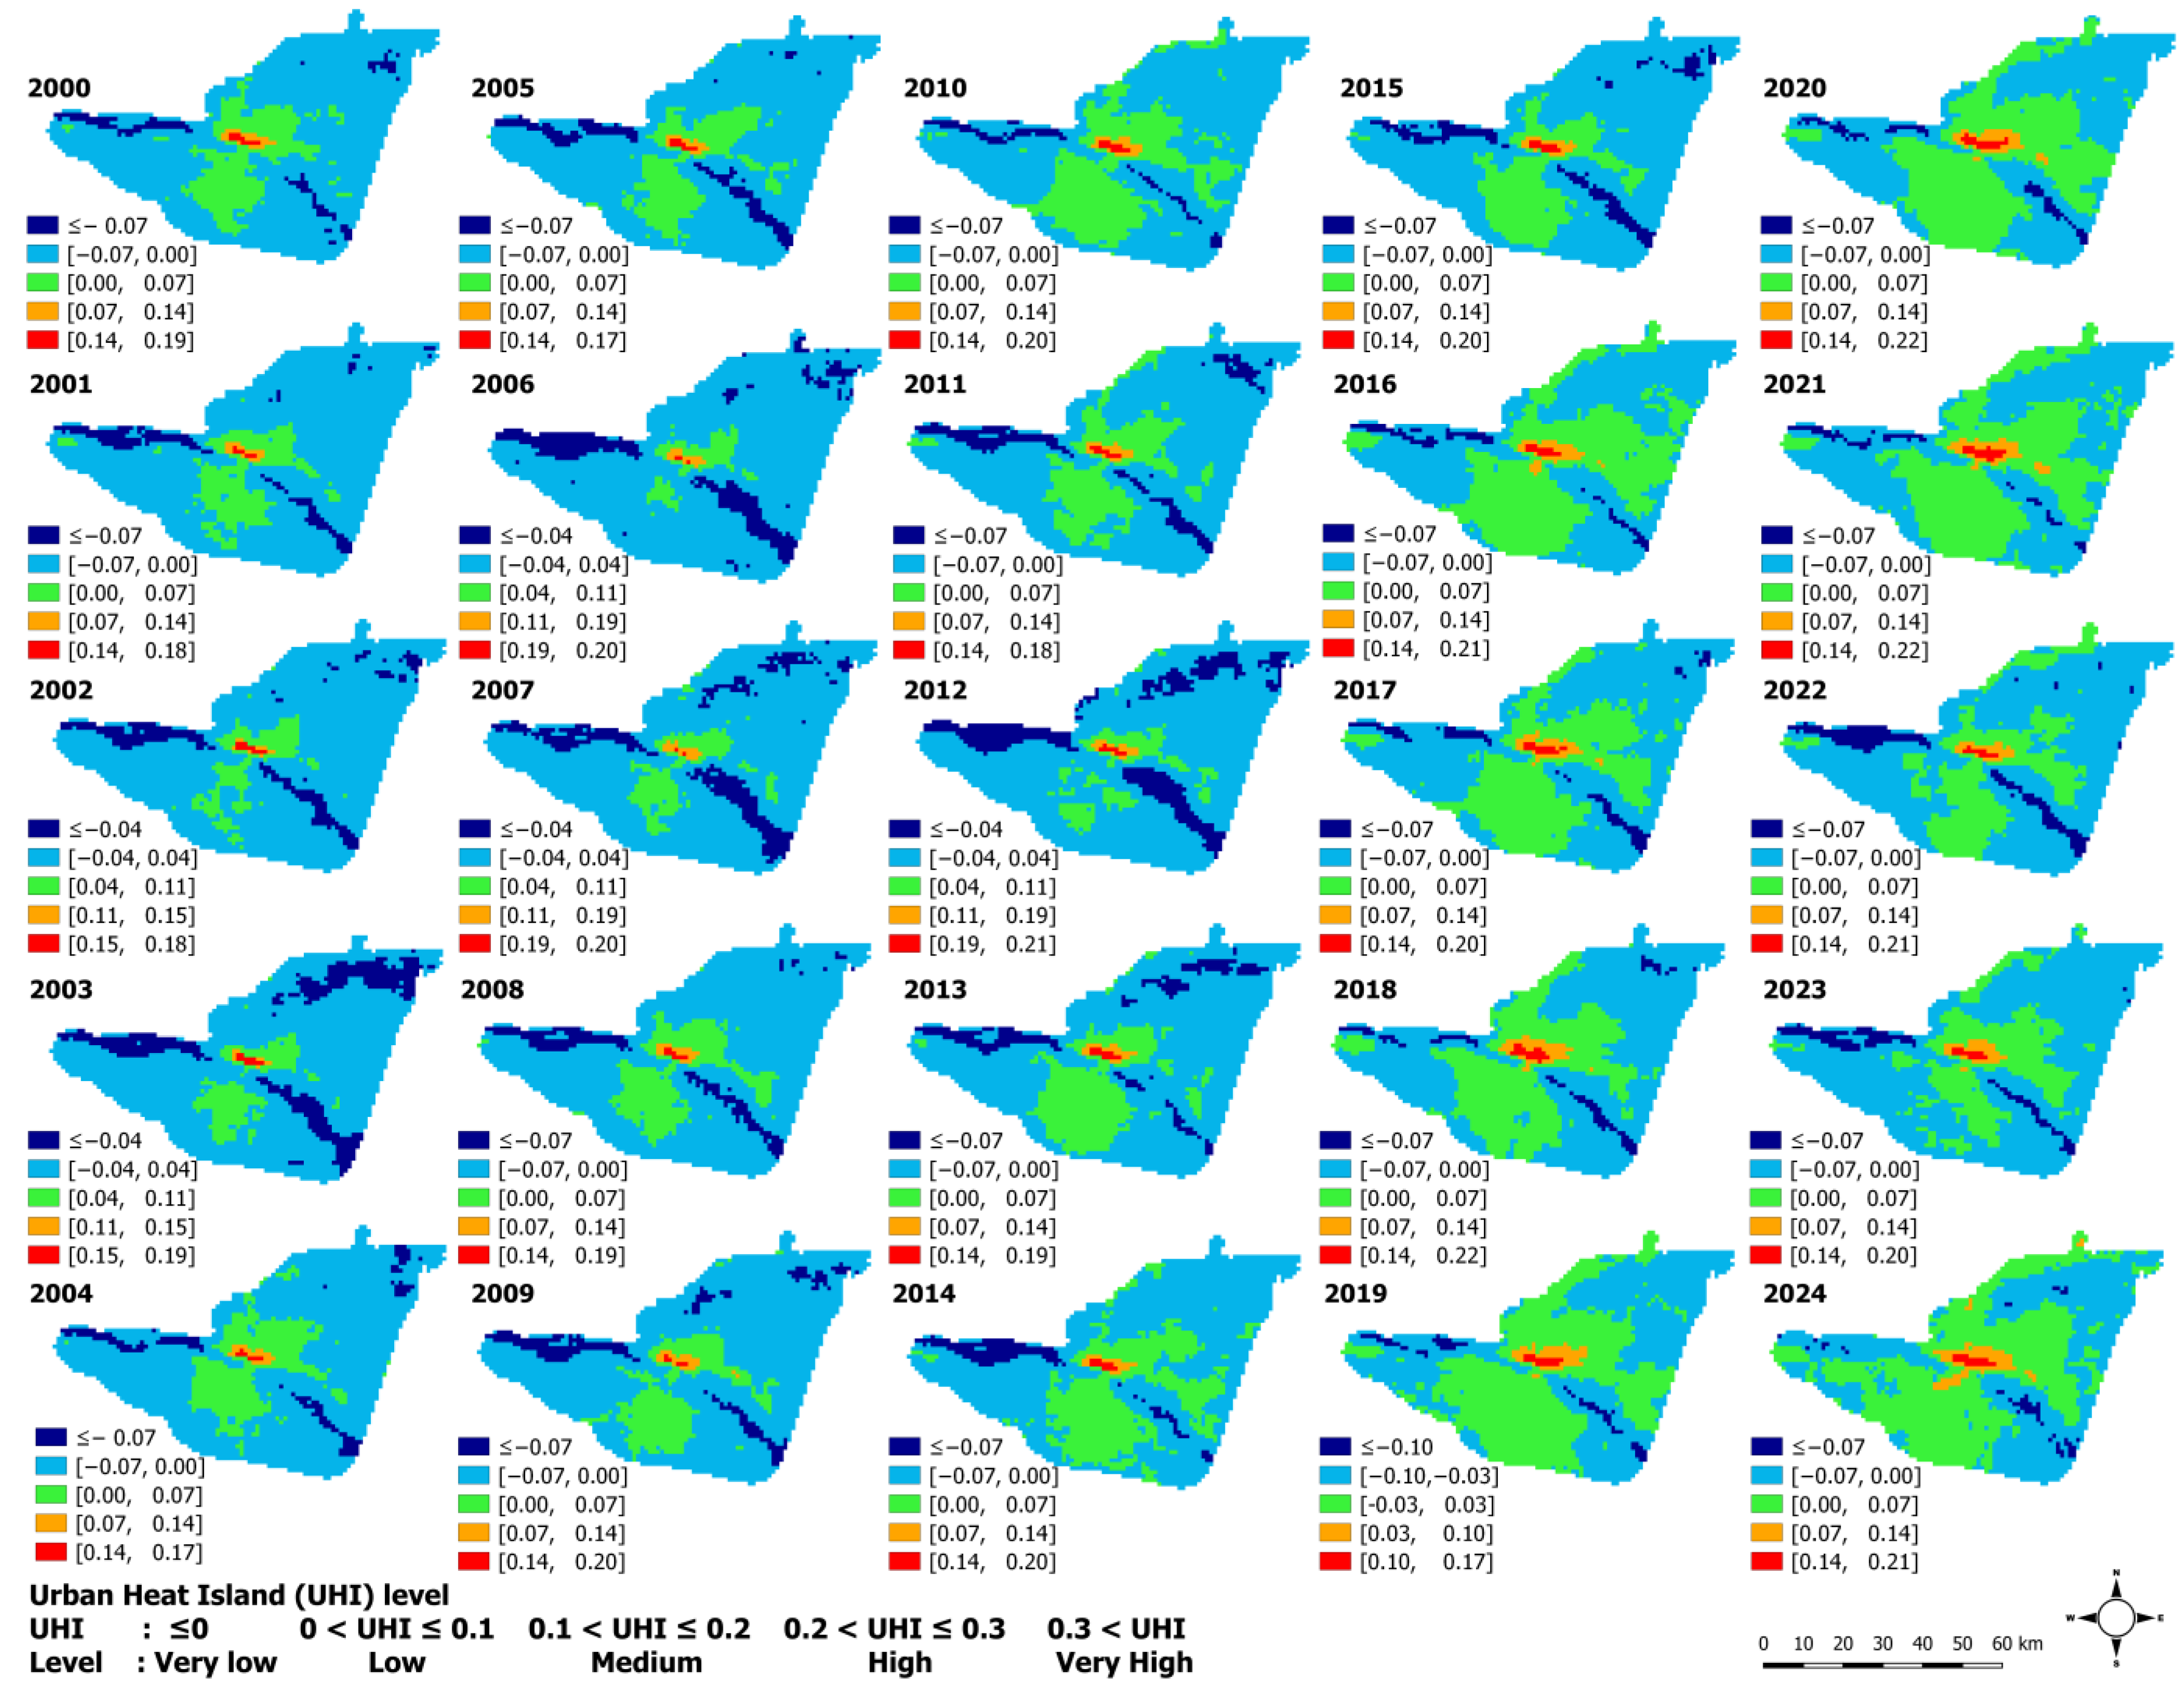
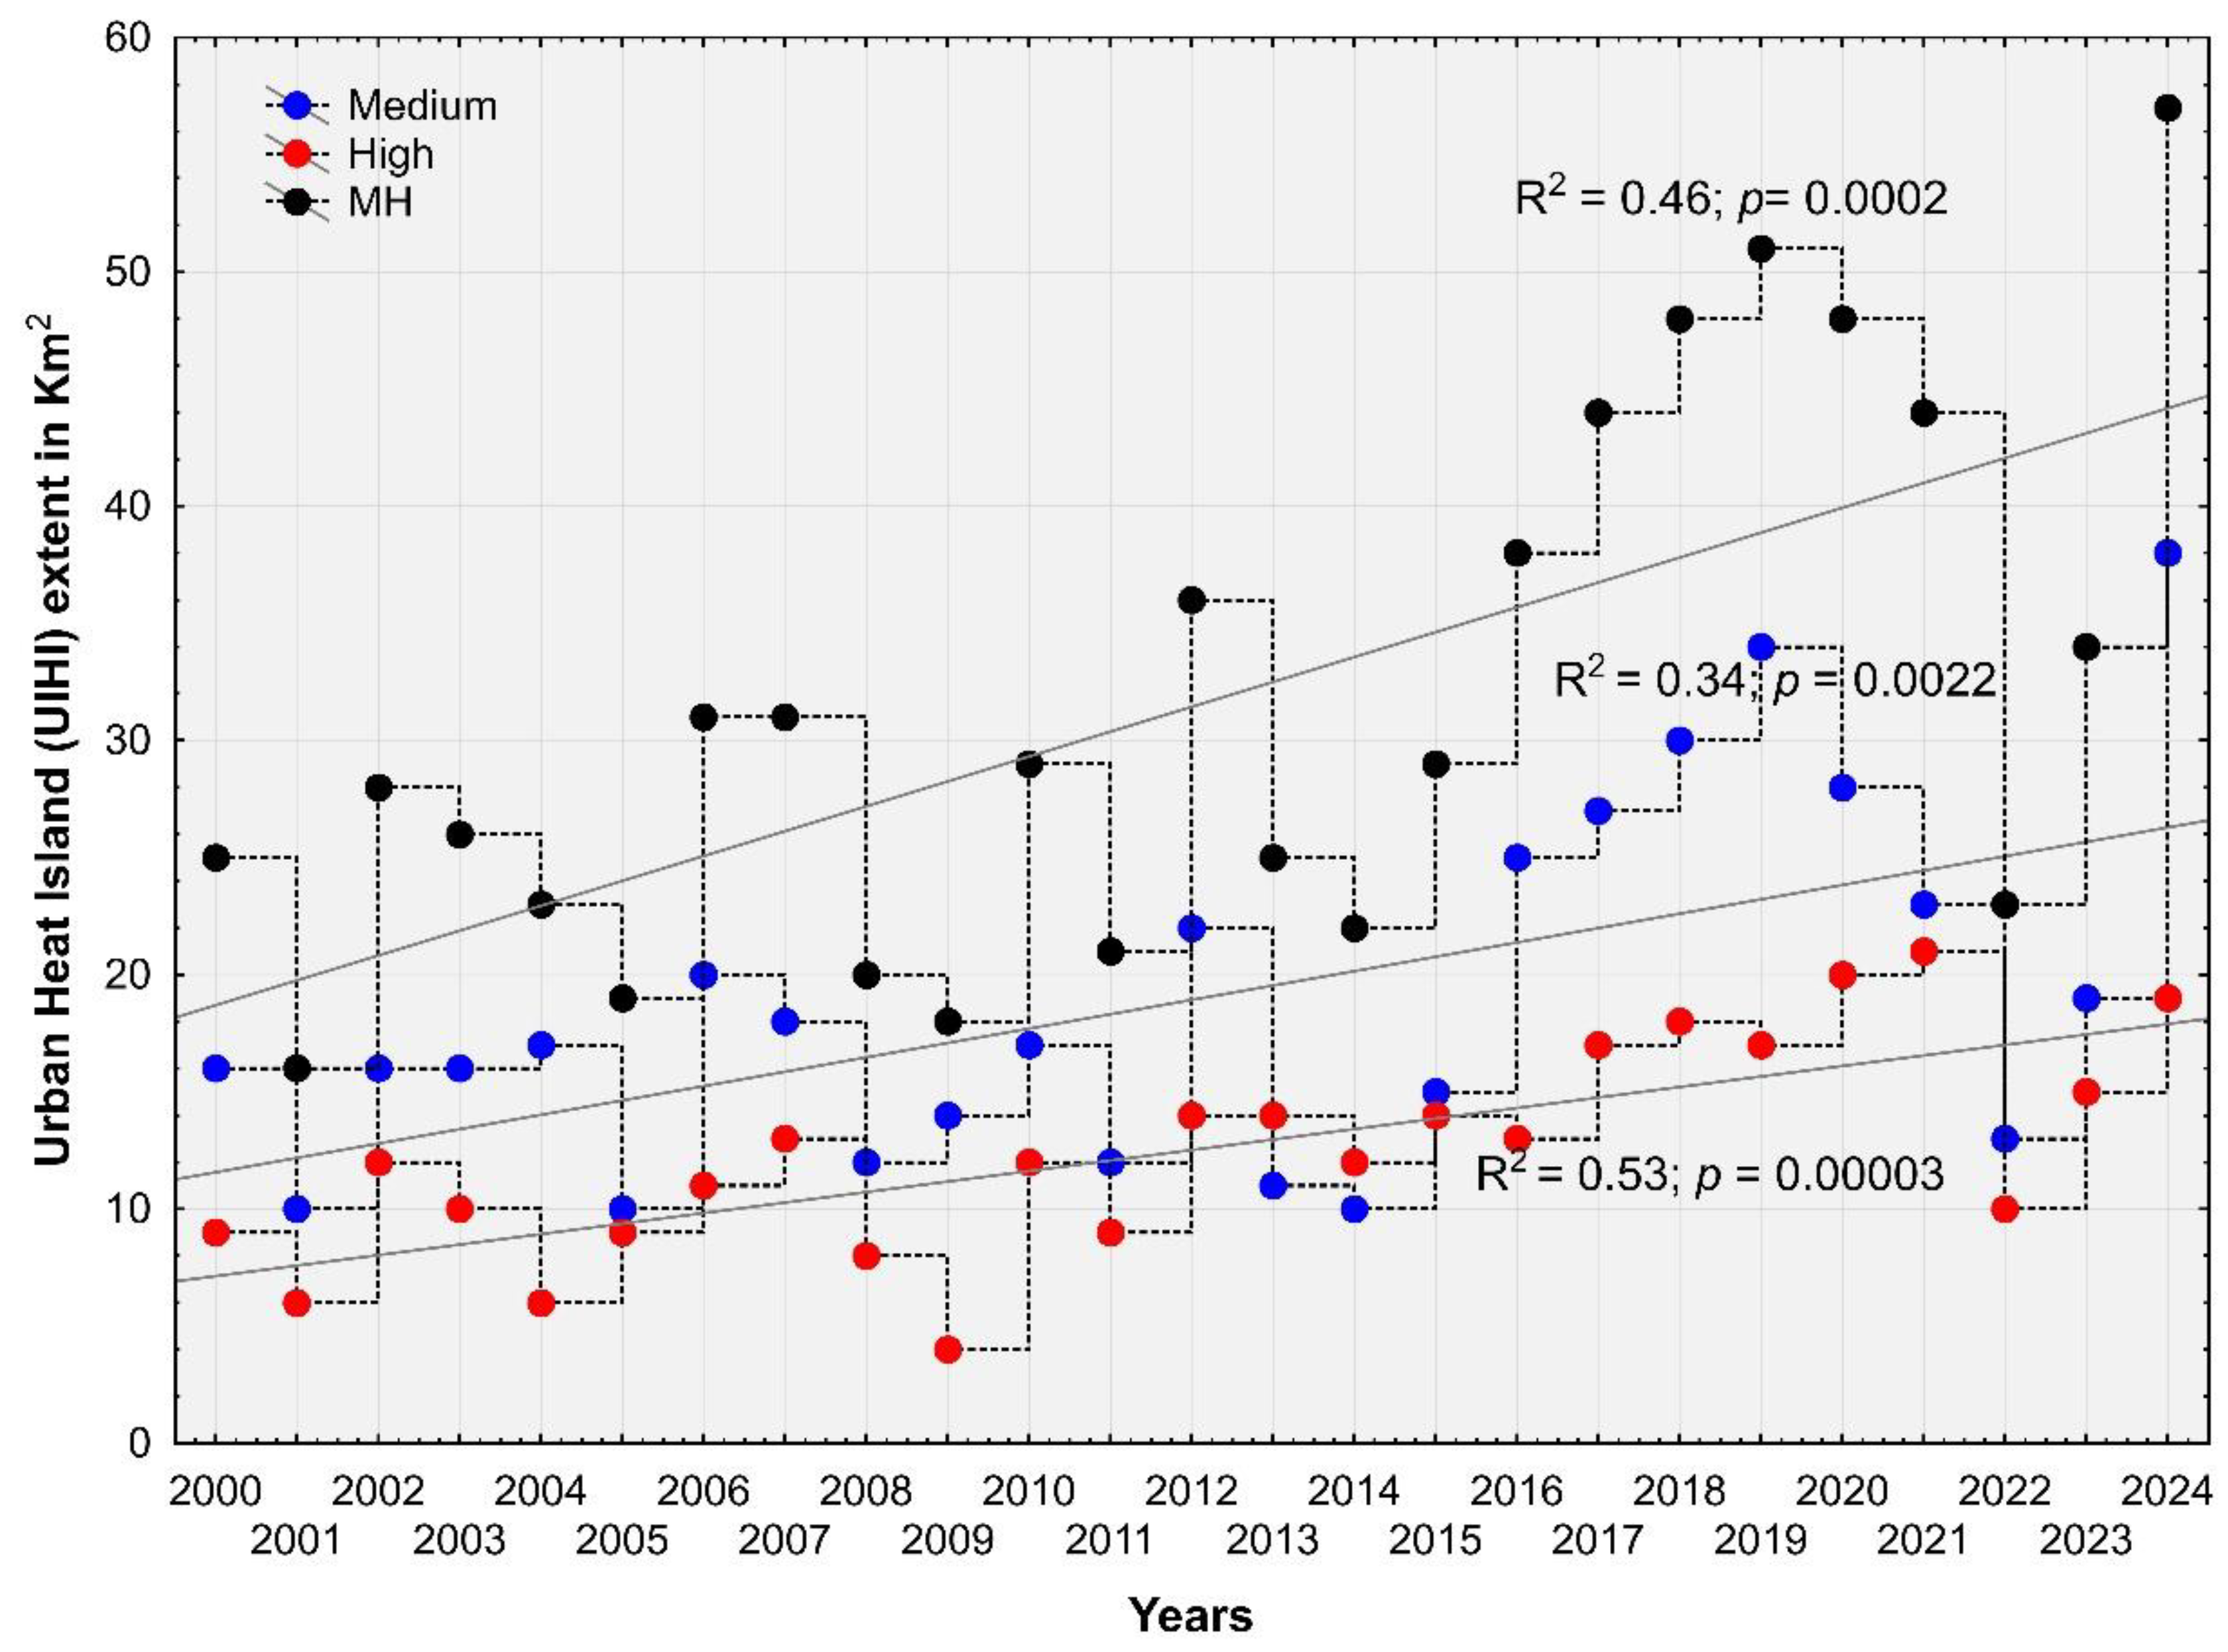
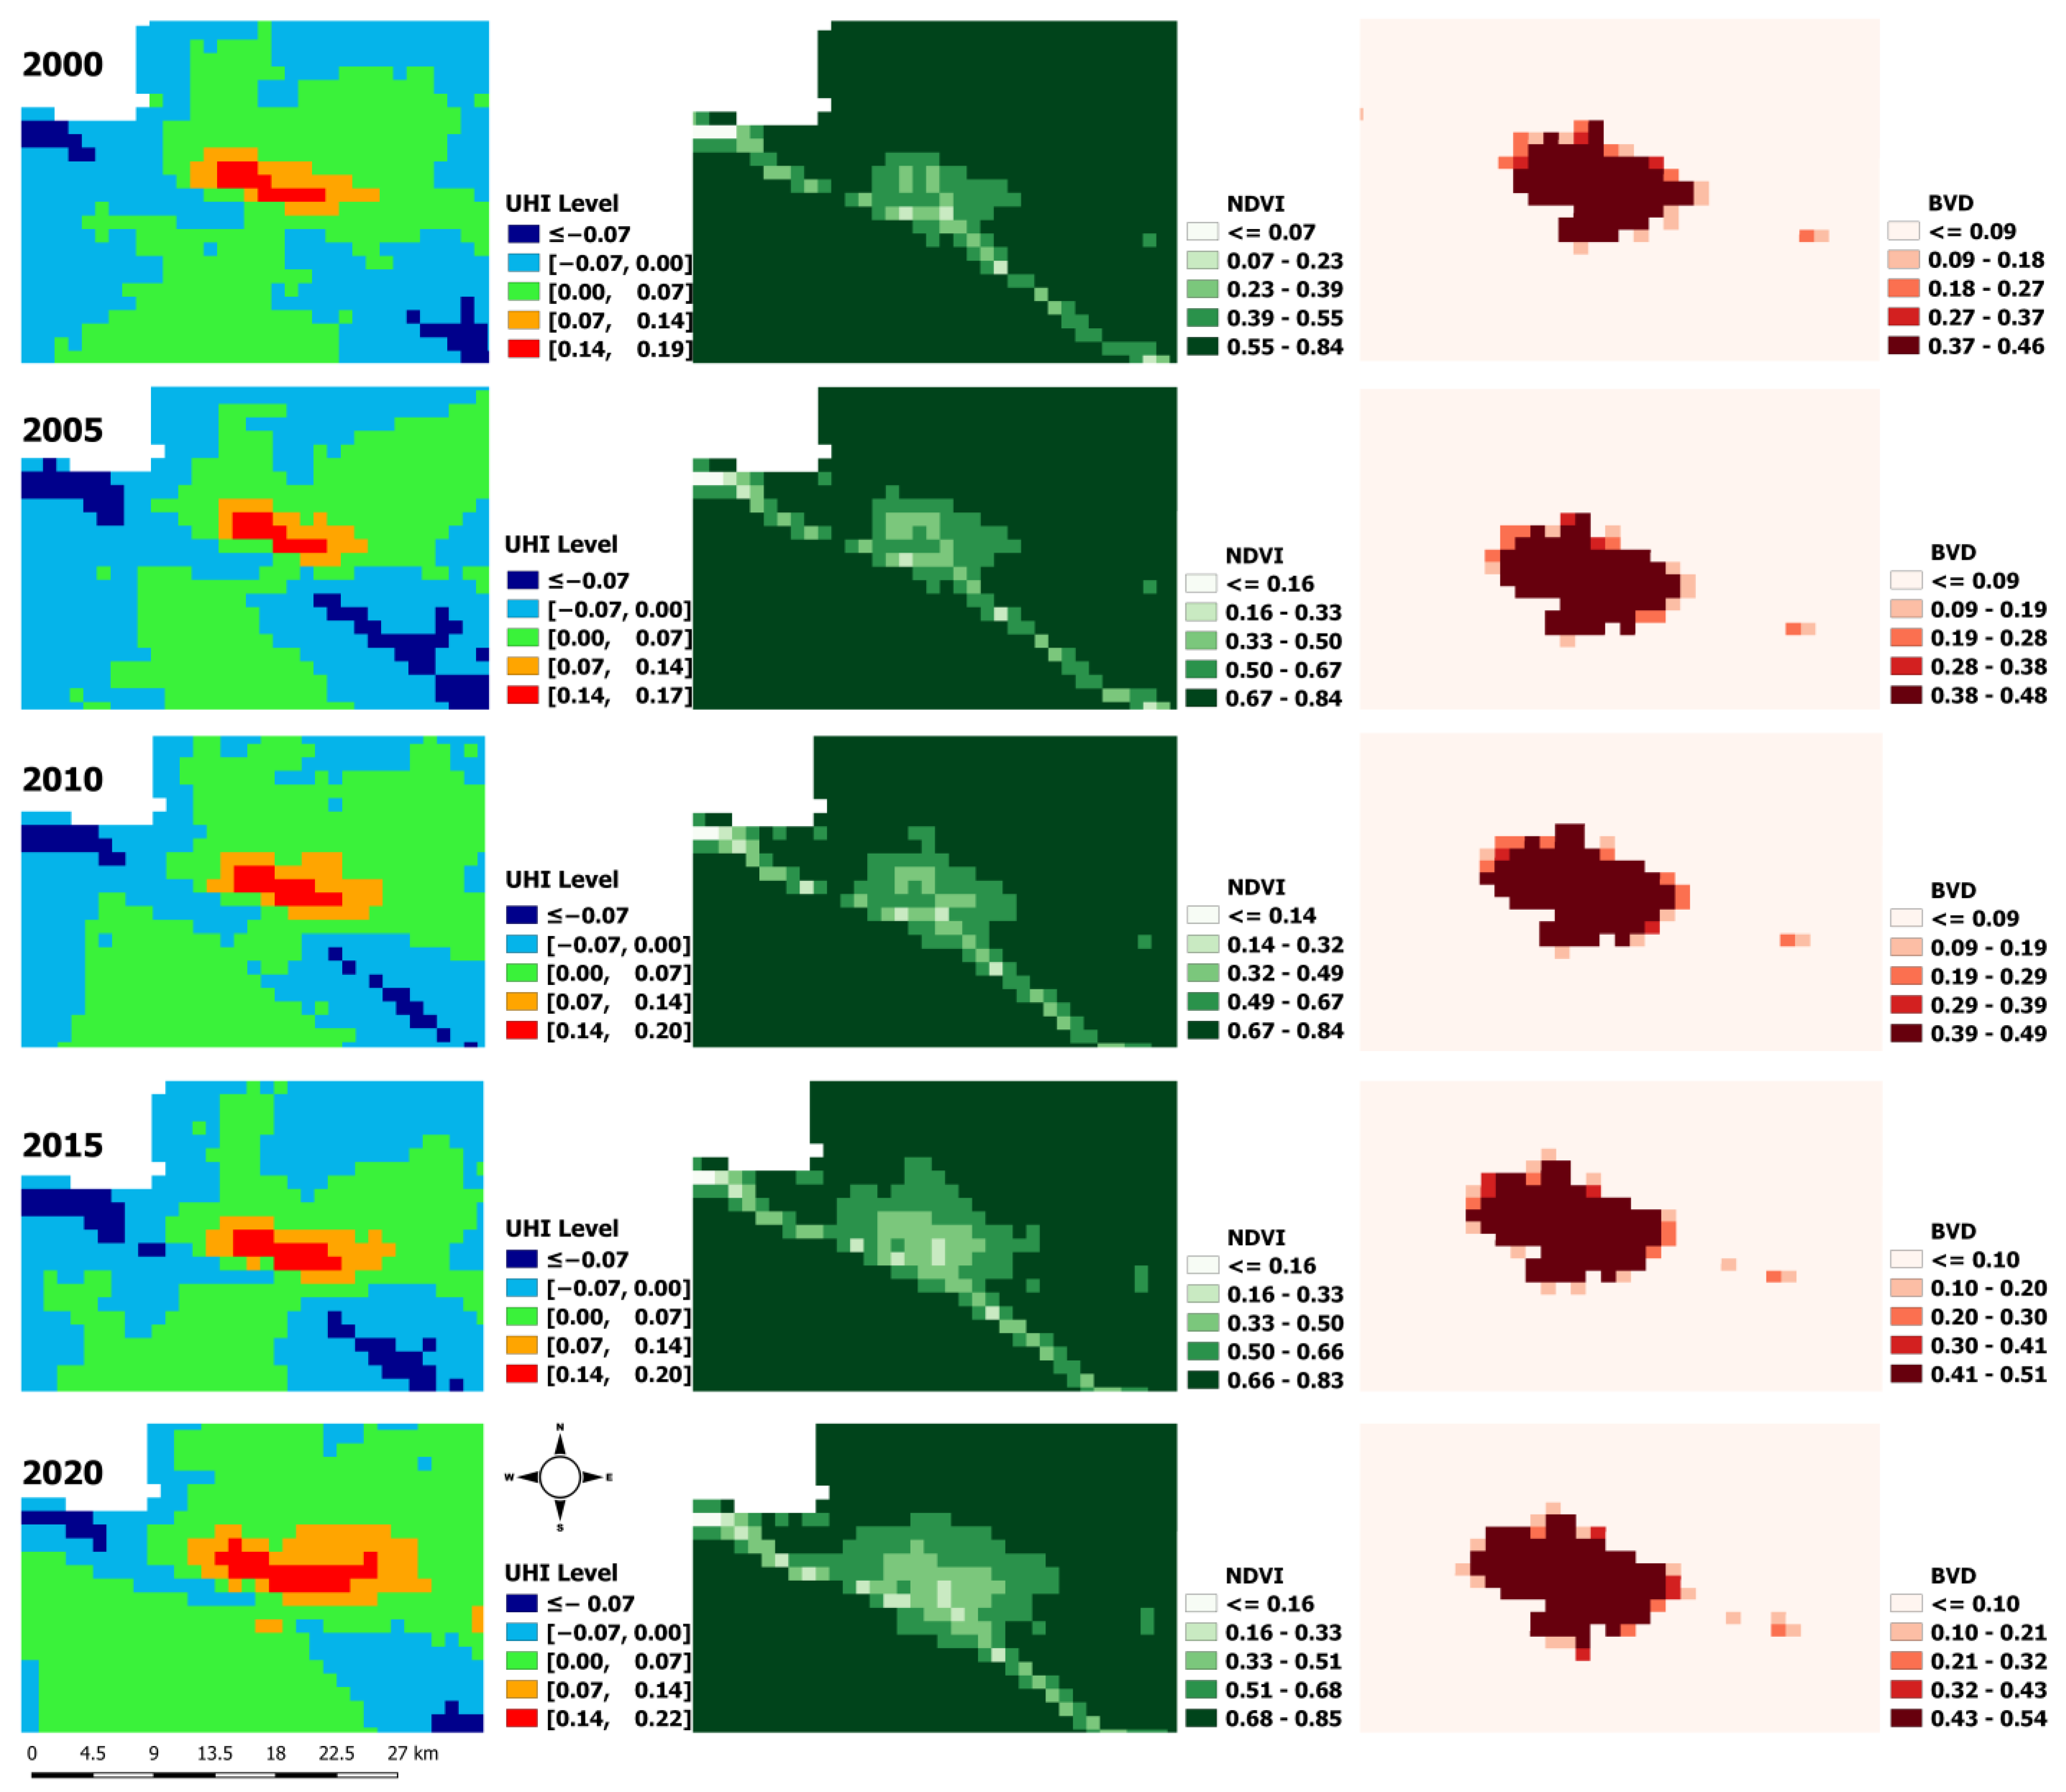
3.1. Spatiotemporal Patterns of Urban Heat Island (UHI)

The spatial pattern of urban heat islands (UHIs) exhibits significant temporal variation. From 2000 to 2009, the landscape of Kisangani was predominantly dominated by areas with UHI values at or below 0, with the lowest UHI values consistently observed along river corridors. In contrast, between 2010 and 2024, areas with UHI values exceeding 0 expanded considerably, and significant annual UHI values, exceeding 0.1 and 0.2, were consistently observed in the city center (Figure 4). Furthermore, the spatial extent of medium UHI gradually expanded from 16 km2 to 38 km2, while high UHI increased from 9 km2 to 19 km2. Consequently, the total extent of UHIs greater than 0.1 reached more than 50 km2 in 2024 (Figure 5).

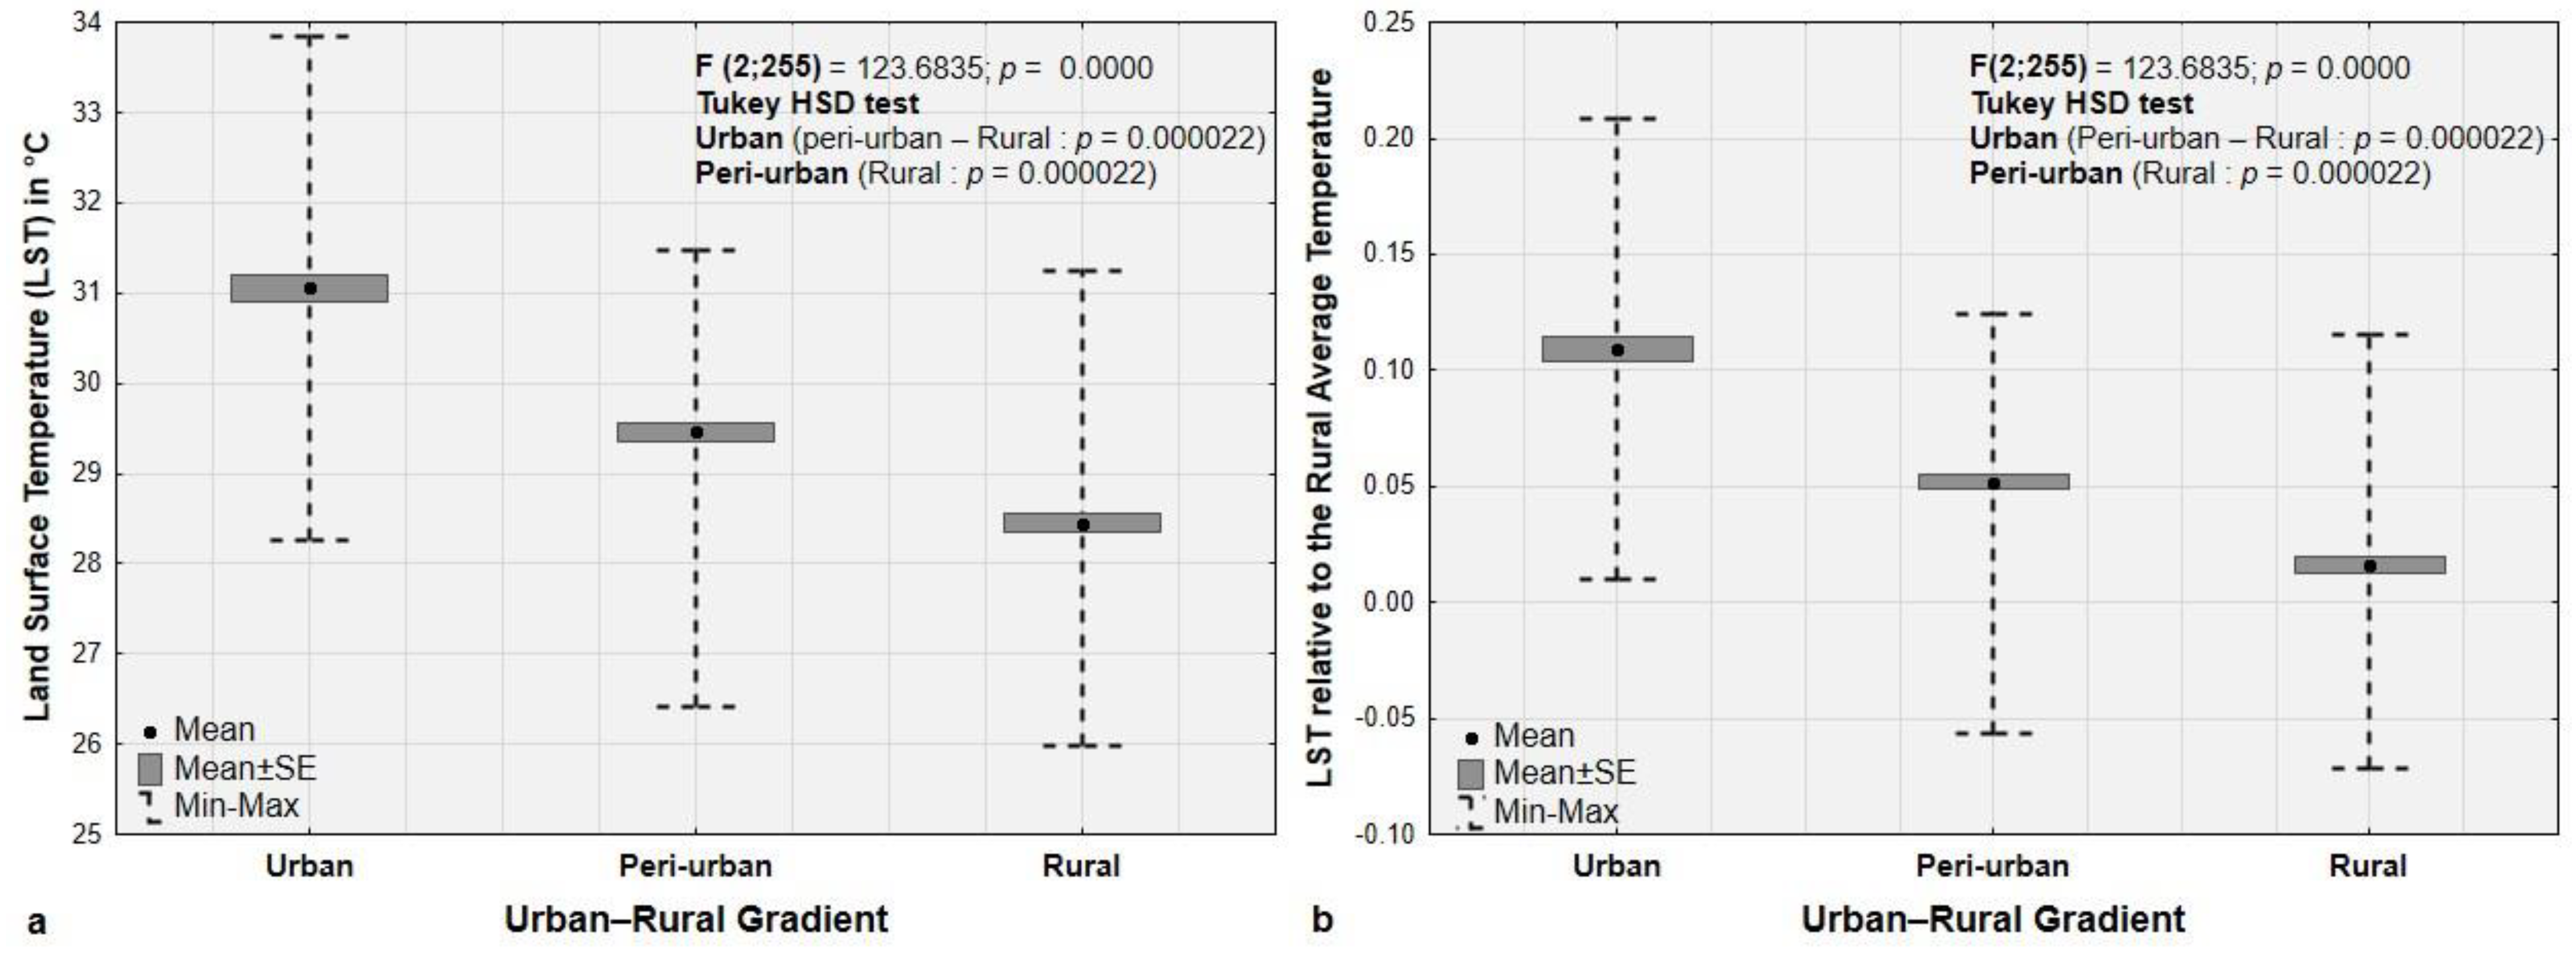
3.2. Variation in LST and UHI Across the Urban–Rural Gradient in 2024

Within the urban–rural gradient, significant variations in both land surface temperature (LST) and urban heat island effect (UHI) are observed in 2024, with urban zones exhibiting substantially higher averages than peri-urban and rural zones (Figure 6). LST and UHI variations in peri-urban areas also differ significantly from those observed in rural areas. Furthermore, areas with a maximum LST around 34 °C and maximum UHI values of more than 0.2 are observed in urban zones. In comparison, peri-urban and rural zones reach a maximum LST of 31 °C and maximum UHI values of slightly more than 0.1.

3.3. Historical Variations in LST and UHI Across the Urban–Rural Gradient

Statistical analysis (Figure 7) revealed significant historical trends in annual land surface temperature (LST) and urban heat island (UHI) variations within each urbanization gradient zone from 2000 to 2024 (p < 0.05). Tukey’s post hoc tests identified specific years with significant differences within each gradient, indicating notable temporal shifts. In urban areas, notable differences in LST were observed between earlier years (e.g., 2000, 2003, 2006) and more recent years, such as 2018, 2019, and 2021. For instance, 2000 significantly differs from 2012, and 2003 differs from 2018, 2019, and 2021. Additionally, 2012 shows significant variations compared to a broader range of years, including 2017, 2018, 2019, 2020, and 2024. UHI variations similarly highlight significant differences between earlier years (e.g., 2000, 2002, 2003) and recent periods, such as 2019 and 2022, with 2022 also differing significantly from 2024.
In peri-urban zones, significant differences in LST (land surface temperature) were observed across multiple time intervals. The early years, such as 2000 and 2001, showed significant differences with later years, including 2002, 2003, 2006, 2007, 2012, 2013, and 2022. For example, 2002 differed significantly from 2010, 2016 to 2020, and 2024, while 2003 differed from earlier years, like 2004 and later years such as 2016–2020, 2023, and 2024. Similarly, more recent years, such as 2012–2015, showed significant variations compared to 2016–2024, and 2022 differed significantly from 2024. There were also significant temporal differences in the urban heat island (UHI) variations. The early years, such as 2000 and 2002, showed notable differences with years like 2013–2019 and 2022. For example, 2002 differed significantly from a range of years spanning 2005–2022. Later years, such as 2013–2015, exhibited significant differences from 2016 to 2024, while 2016–2018 differed from 2019 and 2022. Notable contrasts also emerged between more recent years; for instance, 2022 differed significantly from 2024.
Rural areas showed the widest range of differences in LST and UHI variations. LST differences spanned several pairs of years, such as 2000 vs. 2002, 2006 and 2022, and 2006 vs. 2008, 2017, and 2024. More recent years, such as 2016–2020, consistently differed from earlier periods (e.g., 2012–2015) and from later years, such as 2022 and 2024. For example, LST in 2016 differed significantly from 2022, while 2023 differed from 2024. Similarly, UHI variations in rural areas revealed significant differences between earlier years (e.g., 2000 and 2002) and later periods, such as 2019, 2022, and 2023. For instance, UHI in 2006 and 2007 showed significant differences from multiple years, including 2008, 2016, and 2024. Additionally, 2022 and 2023 exhibited consistent contrasts with 2024, indicating persistent changes in rural thermal environments.
Furthermore, as expected, the results of the annual comparison of the urban heat island (UHI) effect from 2000 to 2024 across Kisangani’s urbanization gradients reveal significant differences. Annual UHI variations in urban zones consistently differed from those in peri-urban and rural zones (p < 0.05). Moreover, UHI variations in peri-urban zones were significantly distinct from those observed in rural zones throughout the study period. These findings highlight clear and consistent disparities in UHI dynamics across the urban, peri-urban, and rural gradients.

3.4. Building Volume Density (BVD) and Vegetation Effects

As expected, the LST variations are significantly correlated with building volume density (BVD) and vegetation density (Figure 8a1,a2). Over time, the influence of BVD as a predictor of LST increases, as shown by progressively higher slope and R2 values in the regression analyses (Figure 8b1,c1), highlighting the growing role of urban development in shaping thermal patterns. Conversely, the influence of vegetation density decreases, which is mainly reflected in the significant reduction in regression slope values (Figure 8b2), indicating a declining sensitivity of LST to vegetation cover. However, it is essential to note that the change in the coefficient of determination (R2) over time is not statistically significant (Figure 8c2), suggesting that while the relationship weakens in strength (slope), the overall model fit remains relatively stable.

4. Discussion

4.1. Spatiotemporal Patterns of Urban Heat Island

In this study, we observed significant temporal variations in the spatial patterns of urban heat islands between 2000 and 2024. During this period, the extent of medium UHI (0.1 < UHI < 0.2) gradually expanded from 16 km2 to 38 km2, while high UHI (0.2 < UHI ≤ 0.3) increased from 9 km2 to 19 km2. Furthermore, the UHI intensity gradually increased between 2000 and 2024, reaching maximum values of more than 0.21 in the last four years (2020, 2021, 2023, and 2024) compared to maximum values of 0.17 and 0.18 observed in 2001, 2004, and 2005.
However, despite observing maximum values exceeding 0.21 and significant differences across urban, peri-urban, and rural areas, the findings indicate that the average UHI values in the urban zones of Kisangani remain below 0.2. Consequently, on average, Kisangani’s urban zones exhibit moderate disparities in LST when compared to rural areas. Various factors associated with urban development, land use, land cover, land cover change, and socio-economic transformation may elucidate the coexistence of maximum UHI values exceeding 0.21 in certain regions while maintaining an overall average below 0.2 which is relatively low compared to other urban centers.
Rural landscapes are generally covered by vegetation, whereas urban areas are characterized by impervious surfaces such as concrete, asphalt, pavements, rooftops, and compacted soils [19,38,40]. This land cover conversion profoundly alters the local microclimate and urban thermal environment, notably by increasing heat absorption and reducing ventilation [40,41]. In Kisangani, the rapid population growth observed between 2000 and 2021 [42] has driven the expansion of urban and peri-urban zones at the expense of natural areas [19,20]. These spatial transformations may have altered the thermal properties, as artificial materials such as concrete and asphalt absorb and retain more solar radiation than natural surfaces. This process is a key driver of the urban heat island (UHI) phenomenon [43,44,45]. The continued spread of built-up areas has likely contributed to the progressive UHI intensification in certain Kisangani zones between 2000 and 2024, with maximum recorded values exceeding 0.21. In parallel, there has been a notable increase in the spatial extent of moderate and high UHI zones.
These observations are consistent with trends documented in other urban contexts. For instance, Li et al. [17] reported that Kampala, Uganda, experienced rapid urban expansion from 12,133 hectares in 1995 to 25,389 hectares in 2016, which was accompanied by an increase in the UHI extent from 22,910 hectares in 2003 to 27,900 hectares in 2016. Similar findings were reported in Accra, Ghana, where Wemegah et al. [18] demonstrated that land surface temperatures (LSTs) were significantly higher in urbanized and bare soil areas compared to vegetated zones and water bodies. The mitigating effect of water bodies on UHI intensity, as observed in Accra, may help explain the relatively low average UHI values (<0.2) recorded along Kisangani’s urbanization gradient, in contrast to cities like Seoul (South Korea), where mean UHI intensities exceed 0.2 [46]. Kisangani’s unique hydrographic context, with the Congo River to the south and the Tshopo and Lindi Rivers to the north and northwest, contributes to this moderation, as water bodies possess high specific heat capacities and facilitate evaporative cooling [47].
Although land artificialization is less pronounced in peri-urban zones compared to urban zones, the findings of this study highlight its influence on the urban heat island (UHI) effect relative to rural areas. Indeed, in peri-urban zones, the progressive conversion of natural landscapes into semi-artificial areas such as intensive agricultural fields and informal settlements reduces the connectivity of vegetative cover, thereby weakening its ability to moderate local temperatures through evaporation and transpiration, as well as passively providing shade [48]. Moreover, peri-urban zones are also influenced by the thermal effects of adjacent urban centers. The UHI effect generated within the city can extend to these peripheral areas through heat transfer driven by mixed convection, a phenomenon that is exacerbated by local atmospheric currents that transport warm air from the urban core to the surrounding zones [49,50].
It is crucial to emphasize that variations in LST within urban, peri-urban, and rural environments directly influence fluctuations in the urban heat island (UHI), given that UHI is fundamentally dependent on LST. This explains the same level of significance as that observed in Figure 6. Therefore, strategies to mitigate high LST values should also be instrumental in narrowing the temperature disparities observed between urban, peri-urban, and rural areas.

4.2. Impact of Building Architecture on the LST

This study has shown that the influence of building volume density (BVD) on the LST increases over time in Kisangani. This trend is evidenced by progressively higher slopes and coefficients of determination. This increasing correlation suggests that as urban areas expand, with changes in urban architecture involving building geometry, particularly construction patterns with tall buildings situated closely together (as illustrated in Figure 9 for a typical area (the urban center)), the capacity of these densely built environments to retain and emit heat intensifies. Combined with the degradation of vegetation, as reflected in increasingly low NDVI values in the urban center (Figure 8), this architectural model contributes to the phenomenon referred to as the “urban canyon” [5,6]. In fact, since the end of the armed conflict (1990–2000) [51], Kisangani has experienced continuous spatial growth [19], largely driven by economic operators who exploit the interstitial spaces by constructing large commercial complexes and high-rise hotels. This installation of buildings accentuates their spatial footprint and, thus, the canyon effect. This urban canyon effect influences local conditions, including wind patterns, light availability, air quality, and temperature, significantly exacerbating urban heat islands’ intensification [7]. In Kisangani, this could affect urban residents in various ways, shaping their comfort, air and water quality, access to ecological services, opportunities for recreation, and overall living conditions [9,10].
However, it is essential to note that NDVI and BVD may be interrelated, potentially introducing interaction or confounding effects when analyzing their influences on LST. Future studies should aim to distinguish the specific impact of each factor better, as their potential interdependence may obscure or exaggerate observed patterns in LST variations. Additionally, while NDVI and BVD are key indicators, they do not fully explain LST variability. Other variables, such as albedo, surface moisture, soil type, topography, and land cover composition, should be integrated to comprehensively understand the mechanisms driving LST dynamics in evolving urban environments.

4.3. Effective and Resilient Mitigation Strategies of UHI

It should be noted that if properly managed, urbanization does not necessarily lead to environmental degradation [17]. However, mitigating the urban heat island (UHI) effect in Kisangani requires a set of strategies carefully tailored to its unique socioeconomic, environmental, and climatic realities. Located in a humid equatorial zone and undergoing rapid urban growth with limited planning [19,20], Kisangani faces challenges such as informal settlements and loss of vegetation cover. Therefore, proposed solutions must be both effective and locally adaptable. In addition, it is crucial to integrate climate change projections into urban planning to develop more robust and long-term mitigation and adaptation strategies. Climate models from the Coupled Model Intercomparison Project Phase 6 (CMIP6), especially under Shared Socioeconomic Pathways (SSPs), indicate that temperatures will increase in all future emissions scenarios and all regions of Africa. By the end of the century, under RCP8.5 or SSP5-8.5, all African areas will likely experience a warming larger than 3 °C. In Central Africa, warming is expected to exceed 2.5 °C [52]. Such warming trends are expected to intensify the urban heat island effect, particularly in rapidly urbanizing contexts like Kisangani.
Therefore, integrating green infrastructure stands out as a key strategy. In Kisangani, where the proximity to the Congo rainforest offers access to a wide range of native plant species, expanding urban green spaces such as parks, urban forests, roadside vegetation, and green corridors can significantly lower surface and air temperatures. These effects are driven by increased shading and evapotranspiration [46,47,48,49,50,51,52,53], especially on hotter days. Previous studies have shown that in cities with a UHI effect, such as Hong Kong or Lisbon, the cooling effect of urban green spaces is more accentuated on hot and dry days [54,55]. In drier environments, rising temperatures and higher transpiration rates amplify the vegetation’s humidifying effects [46,47]. This cost-effective approach aligns with local biodiversity and can provide co-benefits such as improved air quality and recreational areas. However, to be effective, these green spaces must be strategically located in dense urban cores, along heat-prone transportation corridors, and in peri-urban buffer zones to ensure ecological connectivity. Restoring and preserving peri-urban vegetation in Kisangani City may provide a dual benefit: controlling urban sprawl and reinforcing the cooling potential of peripheral green belts. Moreover, leveraging community engagement is essential to the success of such strategies. In Kisangani, many peri-urban areas are shaped by customary land tenure and community-based land management. Mobilizing local residents in the planning and maintenance of green spaces through urban gardening projects, awareness campaigns, and participatory zoning can ensure the long-term sustainability and foster stewardship of the urban environment. Regarding urban form, Malley et al. [16] highlighted that building design, including form, orientation, and layout, plays a crucial role in mitigating the urban heat island effect. Additionally, incorporating high-albedo (reflective) materials for structures and roadways can significantly decrease heat absorption in Kisangani.
Effectively implementing these strategies requires the reinforcement of land-use planning and governance frameworks. This includes the spatial delineation of priority areas for green infrastructure, the establishment of urban growth boundaries, and the integration of ecological criteria into zoning regulations. Coordinating action between governmental and traditional authorities in Kisangani’s rural and peri-urban areas is essential. Such collaboration enhances the enforcement of spatial planning measures and contributes to achieving the Sustainable Development Goals (SDGs). By supporting the development of climate-resilient infrastructure, mitigating heat-related health risks, and promoting sustainable land-use practices, this approach directly aligns with SDG 11 (Sustainable Cities and Communities) while also advancing progress on SDG 13 (Climate Action) and SDG 3 (Good Health and Well-Being). This study thus underscores the pivotal role of locally coordinated governance in translating global sustainability agendas into effective territorial action.
Scientific research plays a critical role in guiding these efforts. Local institutions should prioritize interdisciplinary studies on the cooling effects of green infrastructure in Kisangani’s microclimates. Scenario modeling can help project the long-term benefits of sustainable land-use strategies. Although Kisangani is largely spared from major natural disasters, rising UHI intensity due to urbanization and climate change could increase the city’s vulnerability to heat-related risks. Addressing these emerging challenges requires capacity-building through training programs focused on climate-sensitive urban design, participatory land-use planning, and ecosystem-based adaptation. Strengthening partnerships with international institutions can also enhance technical expertise, attract funding, and promote the development of context-specific solutions.

5. Conclusions

This paper analyzes MOD11A2 V6.1 data to map urban heat islands (UHIs) in Kisangani from 2000 to 2024. The findings reveal a significant temporal shift in the spatial pattern of UHI, with an increase in areas exhibiting UHI values above 0.1 over the study period. Specifically, areas of moderate UHI (0.1 < UHI < 0.2) increased from 16 km2 to 38 km2, while areas of high UHI (0.2 <UHI ≤ 0.3) increased from 9 km2 to 19 km2. Furthermore, although maximum UHI values exceeding 0.21 were observed in urban zones and significant differences in UHI variations are noted across urban, peri-urban, and rural zones, the findings indicate that the average UHI in Kisangani’s urban zones remains below 0.2. Therefore, based on the average UHI variations, the urban zones of Kisangani exhibit moderate disparities in LST compared to rural areas.
Moreover, regression analyses show that variations in land surface temperatures (LSTs) are significantly correlated with building volume density (BVD) and vegetation density, as measured by the Normalized Difference Vegetation Index (NDVI). In addition, the influence of BVD on LST variation has increased over time, as indicated by increasing slopes and the coefficients of determination. This trend suggests that urban expansion and architectural changes, particularly the construction of large, closely spaced buildings, enhance the heat retention and emission capacity of these dense environments.
These findings highlight the importance of integrated development policies to effectively manage the interface between urbanization, changes in landscape patterns, and the supply of ecosystem services. As urban and peri-urban areas expand, vegetation faces loss and fragmentation, weakening its ability to regulate the urban heat island (UHI) effect, especially in regions with UHI values equal to or exceeding 0.21, categorized as high-temperature zones.
However, the UHI mitigating strategies tailored to the specific socio-economic, environmental, and climatic context of Kisangani are increasingly essential. These effective and resilient solutions should integrate green infrastructure, urban planning, and community engagement. Indeed, expanding green spaces, including parks, urban forests, roadside vegetation, and green corridors linking urban, peri-urban, and rural areas, should lower surface and air temperatures through shading and evapotranspiration. This holistic strategy offers a way to balance urban expansion and economic progress while preserving ecosystem services across the urban–rural gradient.

Author Contributions

J.B.B., T.M.S., J.-P.P.M.T.H., K.R.S., Y.U.S., J.-F.B. and J.B.: Conceptualization, methodology, and formal analysis. J.B.B.: Data collection and analysis. J.B.B. wrote the first draft of the article. J.B.B., T.M.S., P.T.W., J.E.M., J.M.T. and B.M.A. were responsible for proofreading the text. J.B.: Validation and supervision. All authors have read and agreed to the published version of the manuscript.

Funding

This research was supported by the ERAIFT-AGRINATURA consortium and funded through the Development Cooperation Instrument (DCI) No. 41928 of the European Union. The authors thank the European Union and the ERAIFT-AGRINATURA consortium for their financial support.

Data Availability Statement

Data can be made available by contacting the authors.

Conflicts of Interest

The authors declare no conflicts of interest.

References

  1. Jato-Espino, D. Spatiotemporal Statistical Analysis of the Urban Heat Island e Ff Ect in a Mediterranean Region. Sustain. Cities Soc. 2019, 46, 101427. [Google Scholar] [CrossRef]
  2. Dwivedi, A.; Khire, M.V. Application of Split- Window Algorithm to Study Urban Heat Island e Ff Ect in Mumbai through Land Surface Temperature Approach. Sustain. Cities Soc. 2018, 41, 865–877. [Google Scholar] [CrossRef]
  3. Kolokotroni, M.; Giannitsaris, I.; Watkins, R. The Effect of the London Urban Heat Island on Building Summer Cooling Demand and Night Ventilation Strategies. Sol. Energy 2006, 80, 383–392. [Google Scholar] [CrossRef]
  4. Liu, K.; Su, H.; Zhang, L.; Yang, H.; Zhang, R.; Li, X. Analysis of the Urban Heat Island Effect in Shijiazhuang, China Using Satellite and Airborne Data. Remote Sens. 2015, 7, 4804–4833. [Google Scholar] [CrossRef]
  5. Arnfield, A.J. Two Decades of Urban Climate Research: A Review of Turbulence, Exchanges of Energy and Water, and the Urban Heat Island. Int. J. Clim. 2003, 26, 1–26. [Google Scholar] [CrossRef]
  6. Oke, T.R. Boundary Layer Climates, 2nd ed.; Routledge: Abingdon, UK, 2002. [Google Scholar]
  7. Stewart, I.D.; Oke, T.R. Local Climate Zones for Urban Temperature Studies. Am. Meteorol. Soc. 2012, 93, 1879–1900. [Google Scholar] [CrossRef]
  8. Taha, H. Urban Climates and Heat Islands: Albedo, Evapotranspiration, and Anthropogenic Heat. Energy Build. 1997, 25, 99–103. [Google Scholar] [CrossRef]
  9. Candra, A.; Lecturer, K.; Nitivattananon, V. Factors Influencing Urban Heat Island in Surabaya, Indonesia. Sustain. Cities Soc. 2016, 27, 99–105. [Google Scholar] [CrossRef]
  10. Prilandita, N. Perceptions and Responses to Warming in an Urban Environment: A Case Study of Bandung City, Indonesia. J. Infrastruct. Built Environ. 2009, 1, 51–58. [Google Scholar]
  11. Martínez, F.; Fernando, N.; Aragonés, N.; Benítez, P.; Buitrago, M.J.; Casas, I.; Cortés, M.; Dürr, U.; Herrera, D.; Izquierdo, A.; et al. Assessment of the Impact of the Summer 2003 Heat Wave on Mortality. Gac. Sanit. 2004, 18 (Suppl. 1), 250–258. [Google Scholar]
  12. United Nations. Transforming Our World: The 2030 Agenda for Sustainable Development; United Nations: New York, NY, USA, 2015. [Google Scholar]
  13. Garcia-Herrera, R.; Díaz, J.; Trigo, R.M.; Luterbacher, J.; Fischer, E.M. A Review of the European Summer Heat Wave of 2003 A Review of the European Summer Heat Wave of 2003. Crit. Rev. Environ. Sci. Technol. 2010, 40, 267–306. [Google Scholar] [CrossRef]
  14. Zhang, H.; Qi, Z.; Ye, X.; Cai, Y.; Ma, W.; Chen, M. Analysis of Land Use/Land Cover Change, Population Shift, and Their Effects on Spatiotemporal Patterns of Urban Heat Islands in Metropolitan Shanghai, China. Appl. Geogr. 2013, 44, 121–133. [Google Scholar] [CrossRef]
  15. Mandal, J.; Pravin, P.; Samanta, S. Examining the Expansion of Urban Heat Island Effect in the Kolkata Metropolitan Area and Its Vicinity Using Multi-Temporal MODIS Satellite Data. Adv. Sp. Res. 2022, 69, 1960–1977. [Google Scholar] [CrossRef]
  16. Malley, C.O.; Piroozfarb, P.A.E.; Farr, E.R.P.; Gates, J. An Investigation into Minimizing Urban Heat Island (UHI) Effects: A UK Perspective. Energy Procedia 2014, 62, 72–80. [Google Scholar] [CrossRef]
  17. Li, X.; Stringer, L.C.; Chapman, S.; Id, M.D. How Urbanisation Alters the Intensity of the Urban Heat Island in a Tropical African City. PLoS ONE 2021, 16, e0254371. [Google Scholar] [CrossRef]
  18. Wemegah, C.S.; Yamba, E.I.; Aryee, J.N.A.; Sam, F.; Amekudzi, L.K. Assessment of Urban Heat Island Warming in the Greater Accra Region. Sci. Afr. 2020, 8, e00426. [Google Scholar] [CrossRef]
  19. Balandi, J.B.; To Hulu, J.P.; Sambieni, K.R.; Sikuzani, Y.U.; Bastin, J.-F.; Musavandalo, C.M.; Nguba, T.B.; Molo, J.E.; Selemani, T.M.; Mweru, J.P.; et al. Urban Sprawl and Changes in Landscape Patterns: The Case of Kisangani City and Its Periphery (DR Congo). Land 2023, 12, 2066. [Google Scholar] [CrossRef]
  20. Balandi, J.B.; Meniko, J.-P.P.T.H.; Sambieni, K.R.; Sikuzani, Y.U.; Bastin, J.-F.; Musavandalo, C.M.; Nguba, T.B.; Jesuka, R.; Sodalo, C.; Pika, L.M.; et al. Anthropogenic Effects on Green Infrastructure Spatial Patterns in Kisangani City and Its Urban—Rural Gradient. Land 2024, 13, 1794. [Google Scholar] [CrossRef]
  21. UN-Habitat. Habitat III RD Congo: Rapport Final; UN-Habitat: Nairobi, Kenya, 2015; pp. 1–93. [Google Scholar]
  22. Sabongo, P.Y. Etude Comparative de La Structure et de La Diversité Des Forêts à Gilbertiodendron Dewevrei (De Wild) J.Léonard Des Régions de Kisangani et de l’Ituri (RD Congo). Ph.D. Thesis, Université de Kisangani, Kisangani, Democratic Republic of the Congo, 2015. [Google Scholar]
  23. Kottek, M.; Grieser, J.; Beck, C.; Rudolf, B.; Rubel, F. World Map of the Köppen-Geiger Climate Classification Updated. Meteorol. Z. 2006, 15, 259–263. [Google Scholar] [CrossRef]
  24. Gabriel, K.B.; Omer, N.T. Etude Socio-Économique Des Conflits Des Guerres Armées Dans La Ville de Kisangani et Sa Périphérie En Province de La Tshopo (1997 à 2006). IJRDO-J. Soc. Sci. Humanit. Res. 2022, 7, 318–324. [Google Scholar]
  25. European Commission. GHSL Data Package 2023; Publications Office of the European Union: Luxembourg, 2023. [Google Scholar] [CrossRef]
  26. Wan, Z. MODIS Land Surface Temperature Products Users’ Guide; ERI, University of California: Santa Barbara, CA, USA, 2013. [Google Scholar]
  27. Lu, L.; Zhang, T.; Wang, T. Evaluation of Collection-6 MODIS Land Surface Temperature Product Using Multi-Year Ground Measurements in an Arid Area of Northwest China. Remote Sens. 2018, 10, 1852. [Google Scholar] [CrossRef]
  28. Wan, Z.; Zhang, Y.; Zhang, Q.; Li, Z. Validation of the Land-Surface Temperature Products Retrieved from Terra Moderate Resolution Imaging Spectroradiometer Data. Remote Sens. Environ. 2002, 83, 163–180. [Google Scholar] [CrossRef]
  29. Azizi, S.; Azizi, T. Urban Climate Dynamics: Analyzing the Impact of Green Cover and Air Pollution on Land Surface Temperature—A Comparative Study Across Chicago, San Francisco, and Phoenix, USA. Atmosphere 2024, 15, 917. [Google Scholar] [CrossRef]
  30. Didan, K.; Munoz, A.B.; Huete, A. MODIS Vegetation Index User’s Guide (MOD13 Series); University of Arizona: Tucson, AZ, USA, 2015. [Google Scholar]
  31. Rendana, M.; Mohd, W.; Idris, R.; Rahim, S.A.; Abdo, H.G.; Almohamad, H.; Abdullah, A.; Dughairi, A.; Al-mutiry, M. Relationships between Land Use Types and Urban Heat Island Intensity in Hulu Langat District, Selangor, Malaysia. Ecol. Process. 2023, 12, 33. [Google Scholar] [CrossRef]
  32. Jain, S.; Sannigrahi, S.; Sen, S.; Bhatt, S. Urban Heat Island Intensity and Its Mitigation Strategies in the Fast-Growing Urban Area. J. Urban Manag. 2019, 9, 54–66. [Google Scholar] [CrossRef]
  33. Huang, Q.; Huang, J.; Yang, X.; Fang, C.; Liang, Y. Quantifying the Seasonal Contribution of Coupling Urban Land Use Types on Urban Heat Island Using Land Contribution Index: A Case Study in Wuhan. Sustain. Cities Soc. 2018, 44, 666–675. [Google Scholar] [CrossRef]
  34. Marando, F.; Salvatori, E.; Sebastiani, A.; Fusaro, L.; Manes, F. Regulating Ecosystem Services and Green Infrastructure: Assessment of Urban Heat Island Effect Mitigation in the Municipality of Rome, Italy. Ecol. Model. 2019, 392, 92–102. [Google Scholar] [CrossRef]
  35. Salomon, W.; Sikuzani, Y.U.; Sambieni, K.R.; Barima, Y.S.S.; Théodat, J.M.; Bogaert, J. Land Cover Dynamics along the Urban-Rural Gradient of the Port-Au-Prince Agglomeration (Republic of Haiti) from 1986 to 2021. Land 2022, 11, 355. [Google Scholar] [CrossRef]
  36. André, M.; Mahy, G.; Lejeune, P.; Bogaert, J. Vers Une Synthèse de La Conception et Une Définition Des Zones Dans Le Gradient Urbain-Rural. Biotechnol. Agron. Soc. Environ. 2014, 18, 61–74. [Google Scholar]
  37. Sambieni, K.R. Dynamique Du Paysage de La Ville Province de Kinshasa Sous La Pression de La Périurbanisation: L’infrastructure Verte Comme Moteur d’aménagement. Ph.D. Thesis, Université de Liège, Liège, Belgium, 2019. [Google Scholar]
  38. Angel, S.; Parent, J.; Civco, D.L.; Blei, A.; Potere, D. The Dimensions of Global Urban Expansion: Estimates and Projections for All Countries, 2000-2050. Prog. Plann. 2011, 75, 53–107. [Google Scholar] [CrossRef]
  39. Bogaert, J.; Biloso, A.; Vranken, I.; André, M. Peri-Urban Dynamics: Landscape Ecology Perspectives. In Territoires Périurbains. Développement, Enjeux et Perspectives dans les pays du Sud; Bogaert, J., Halleux, J.-M., Eds.; Les presses agronomiques de gembloux asbL: Gembloux, Belgium, 2015; pp. 59–69. [Google Scholar]
  40. Wen, C.; Mamtimin, A.; Feng, J.; Wang, Y.; Yang, F.; Huo, W.; Zhou, C.; Li, R.; Song, M.; Gao, J.; et al. Diurnal Variation in Urban Heat Island Intensity in Birmingham: The Relationship between Nocturnal Surface and Canopy Heat Islands. Land 2023, 12, 2062. [Google Scholar] [CrossRef]
  41. Dutta, D.; Rahman, A.; Paul, S.K.; Kundu, A. Urban Climate Impervious Surface Growth and Its Inter-Relationship with Vegetation Cover and Land Surface Temperature in Peri-Urban Areas of Delhi. Urban Clim. 2021, 37, 100799. [Google Scholar] [CrossRef]
  42. INS. Population de La Ville de Kisangani Repartie En Sexe, de 1990 à 2021; INS: Kisangani, Democratic Republic Congo, 2022. [Google Scholar]
  43. Haodong, L.; Zheng, H.; Wu, L.; Deng, Y.; Chen, J.; Zhang, J. Spatiotemporal Evolution in the Thermal Environment and Impact Analysis of Drivers in the Beijing—Tianjin—Hebei Urban Agglomeration of China from 2000 to 2020. Remote Sens. 2024, 16, 2601. [Google Scholar] [CrossRef]
  44. Ren, J.; Shi, K.; Kong, X.; Zhou, H. On-Site Measurement and Numerical Simulation Study on Characteristic of Urban Heat Island in a Multi-Block Region in Beijing, China. Sustain. Cities Soc. 2023, 95, 104615. [Google Scholar] [CrossRef]
  45. Lima, I.; Scalco, V.; Lamberts, R. Energy & Buildings Estimating the Impact of Urban Densification on High-Rise Office Building Cooling Loads in a Hot and Humid Climate. Energy Build. 2019, 182, 30–44. [Google Scholar] [CrossRef]
  46. Kim, Y.-H.; Baik, J.-J. Maximum Urban Heat Island Intensity in Seoul. J. Appl. Meteorol. 2002, 41, 651–659. [Google Scholar] [CrossRef]
  47. Cheung, P.K.; Jim, C.Y.; Siu, C.T. Effects of Urban Park Design Features on Summer Air Temperature and Humidity in Compact-City Milieu. Appl. Geogr. 2021, 129, 102439. [Google Scholar] [CrossRef]
  48. Yan, M.; Chen, L.; Leng, S.; Sun, R. Effects of Local Background Climate on Urban Vegetation Cooling and Humidification: Variations and Thresholds. Urban For. Urban Green. 2023, 80, 127840. [Google Scholar] [CrossRef]
  49. Ziyan; Paschalis, A.; Mijic, A.; Meili, N.; Manoli, G.; Van Reeuwijk, M.; Fatichi, S. Urban Climate A Mechanistic Assessment of Urban Heat Island Intensities and Drivers across Climates. Urban Clim. 2022, 44, 101215. [Google Scholar] [CrossRef]
  50. Omidvar, H.; Bou-zeid, E.; Li, Q.; Mellado, J. Plume or Bubble? Mixed-Convection Flow Regimes and City-Scale Circulations. J. Fluid Mech. 2020, 897, A5. [Google Scholar] [CrossRef]
  51. Koluwa, S.K. De La Reparation Des Victimes de La Guerre de Six Jours à Kisangani. J. Soc. Sci. Humaniyies Res. 2020, 5, 44–56. [Google Scholar]
  52. IPCC. Climate Change 2021: The Physical Science Basis. Contribution of Working Group I to the Sixth Assessment Report of the Intergovernmental Panel on Climate Change; IPCC: Geneva, Switzerland, 2021. [Google Scholar]
  53. Cui, F.; Shao, F.; Qi, F.; Wang, Y.; Zhang, T.; Yu, H. Research Advances in the Influence of Vegetation on Urban Heat Island Effect. J. Zhejiang A F Univ. 2020, 37, 171–181. [Google Scholar]
  54. Kwan, P.; Fung, C.K.W.; Jim, C.Y. Seasonal and Meteorological Effects on the Cooling Magnitude of Trees in Subtropical Climate. Build. Environ. 2020, 177, 106911. [Google Scholar] [CrossRef]
  55. Oliveira, S.; Andrade, H.; Vaz, T. The Cooling Effect of Green Spaces as a Contribution to the Mitigation of Urban Heat: A Case Study in Lisbon. Build. Environ. 2011, 46, 2186–2194. [Google Scholar] [CrossRef]
Figure 1. Kisangani and its surrounding area. The city is organized into six municipalities and is surrounded by three protected areas. Its transport infrastructure includes both national and provincial road networks.
Climate 13 00089 g001
Figure 2. Methodological flowchart of the study.
Climate 13 00089 g002
Figure 3. Sample plots along the urban–rural gradient. A series of randomly selected sample plots were analyzed along the urban–rural gradient, encompassing various directional perspectives: north, south, east, west, northeast, northwest, southeast, and southwest. The evolving characteristics of these plots highlight the dynamic and continual shifting of urban, peri-urban, and rural areas.
Climate 13 00089 g003
Figure 4. Spatial variations of diurnal urban heat island (UHI). The UHI corresponds to the land surface temperature (LST) per pixel relative to the Rural Average Temperature. Data from the MODIS sensor (MOD11A2 V6.1) covering the period from 2000 to 2024.
Climate 13 00089 g004
Figure 5. The spatial extent of urban heat islands (UHIs) is expressed in square kilometers. Medium (0.1 < UHI < 0.2); high (0.2 < UHI ≤ 0.3); MH expresses the sum of medium and high UHI extent.
Climate 13 00089 g005
Figure 6. (a) Land surface temperature (LST) and (b) the UHI variation in urban, per-urban, and rural zones based on the landscape context of the last year studied (2024). In (b), the UHI is derived from the difference between the LST per pixel and the mean LST in rural areas (Ts = 28 °C).
Climate 13 00089 g006
Figure 7. Historical variations in land surface temperature (LST) and urban heat island (UHI) in urban areas (a1) and (a2), peri-urban areas (b1) and (b2), and rural areas (c1) and (c2).
Climate 13 00089 g007
Figure 8. Linear regression was performed between building volume density (BVD) and LST (a1); vegetation density expressed by NDVI and LST (a2); and the historical trends in the regressions’ slope (b1) and (b2) and coefficient of determination values (c1) and (c2). In a, each point corresponds to a pixel of 1 km2.
Climate 13 00089 g008
Figure 9. An illustration of the spatiotemporal evolution of the urban heat island (UHI), NDVI, and building volume density for a typical area (urban center of Kisangani).
Climate 13 00089 g009
Table 1. Spatial characteristics, time scale, and product type of the geospatial dataset used.
Product IDLayerSpatial ResolutionTime Scale
MOD11A2 V6.1LST Emissivity1 Km2000–2024
MOD13A2NDVI1 Km2000–2024
GHS-BUILT-VBuilding Volume1 Km1975–2030
GHS-POPPopulation Density1 Km1975–2030
Google EarthGE Images1 m2000–2024
Table 2. The UHI level.
UHI LevelDescription
HI ≤ 0Very lowExtreme low-temperature zone, meaning that there is no difference in LST between urban and rural areas.
0 < UHI ≤ 0.1LowLow-temperature zones mean minimal LST variation between urban and rural areas.
0.1 < UHI ≤ 0.2MediumMedium-temperature region, meaning that the LST differs moderately between urban and rural areas.
0.2 < UHI ≤ 0.3HighHigh-temperature zone, meaning large urban/rural LST difference.
0.3 < UHI Very highAn extremely high-temperature zone, meaning a huge urban/rural LST difference.
Disclaimer/Publisher’s Note: The statements, opinions and data contained in all publications are solely those of the individual author(s) and contributor(s) and not of MDPI and/or the editor(s). MDPI and/or the editor(s) disclaim responsibility for any injury to people or property resulting from any ideas, methods, instructions or products referred to in the content.

