Article

Historical and Future Windstorms in the Northeastern United States

by
Sara C. Pryor
1,*,
Jacob J. Coburn
1,
Fred W. Letson
1,
Xin Zhou
1,
Melissa S. Bukovsky
2 and
Rebecca J. Barthelmie
3
1
Department of Earth and Atmospheric Sciences, Cornell University, Ithaca, NY 14850, USA
2
Haub School of Environment and Natural Resources, University of Wyoming, Laramie, WY 82071, USA
3
Sibley School of Mechanical and Aerospace Engineering, Cornell University, Ithaca, NY 14850, USA
*
Author to whom correspondence should be addressed.
Climate 2025, 13(5), 105; https://doi.org/10.3390/cli13050105
Submission received: 7 April 2025 / Revised: 10 May 2025 / Accepted: 12 May 2025 / Published: 20 May 2025

Abstract

Large-scale windstorms represent an important atmospheric hazard in the Northeastern US (NE) and are associated with substantial socioeconomic losses. Regional simulations performed with the Weather Research and Forecasting (WRF) model using lateral boundary conditions from three Earth System Models (ESMs: Geophysical Fluid Dynamics Laboratory (GFDL), Hadley Centre Global Environment Model (HadGEM) and Max Planck Institute (MPI)) are used to quantify possible future changes in windstorm characteristics and/or changes in the parent cyclone types responsible for windstorms. WRF nested within MPI ESM best represents important aspects of historical windstorms and the cyclone types responsible for generating windstorms compared with a reference simulation performed with the ERA-Interim reanalysis for the historical climate. The spatial scale and frequency of the largest windstorms in each simulation defined using the greatest extent of exceedance of local 99.9th percentile wind speeds (U > U999) plus 50-year return period wind speeds (U50,RP) do not exhibit secular trends. Projections of extreme wind speeds and windstorm intensity/frequency/geolocation and dominant parent cyclone type associated with windstorms vary markedly across the simulations. Only the MPI nested simulations indicate statistically significant differences in windstorm spatial scale, frequency and intensity over the NE in the future and historical periods. This model chain, which also exhibits the highest fidelity in the historical climate, yields evidence of future increases in 99.9th percentile 10 m height wind speeds, the frequency of simultaneous U > U999 over a substantial fraction (5–25%) of the NE and the frequency of maximum wind speeds above 22.5 ms−1. These geophysical changes, coupled with a projected doubling of population, leads to a projected tripling of a socioeconomic loss index, and hence risk to human systems, from future windstorms.

Graphical Abstract

1. Introduction

Large-scale windstorms are an important natural hazard in many regions of the world, including the Northeastern United States (NE) [1,2,3,4] and adjacent areas of Canada [5] plus Europe [6,7]. Extreme wind speeds associated with intense cyclones can cause widespread damage to building structures [5], natural and managed ecosystems [8] and cause substantial transportation delays [9]. High wind speeds and storm surge associated with intense cyclones were responsible for the deaths of nearly one-quarter of a million people world-wide between 1995 and 2015 [10]. Severe European windstorms Lothar and Martin during 1999 resulted in economic losses of USD 8 and 3 billion each and windstorm Kyril during 2007 also caused >USD 6.7 billion losses [6]. The top-10 most widespread historical NE windstorms resulted in total cumulative economic losses of over USD 30 billion (inflation adjusted to 2020) [4]. Windstorms during 2008–2021 caused more than CAD 5.2 billions of insured losses in the Canadian provinces of Ontario and Quebec [5].
Global climate non-stationarity may change the frequency/nature/intensity of windstorms and their parent cyclones via thermodynamic feedbacks [11,12], although past pseudo-global warming research found the intensity of historical NE windstorms is relatively insensitive to increased air temperatures and specific humidity [13]. Near-surface wind speeds are also dependent on surface roughness length and thus land-use land cover (LULC) and hence changing LULC may also cause windstorms to evolve over time. Analyses of a single-model large ensemble (SMILE) generated using the Max Planck Institute (MPI) Earth System Model found that projected declines in forest cover over the NE under Shared Socioeconomic Pathway (SSP) 3–7.0 caused large reductions in surface roughness length leading to increases in the spatial scale and magnitude of future NE windstorms [14]. However, the implied deforestation of the NE included in this SSP is unprecedented and thus may not reflect realistic future land use. After corrections were applied to remove the influence of LULC change on wind speeds, regionally averaged 99th percentile wind speeds (U99) exhibit declines for SMILE members which are broadly proportional to the radiative forcing and global air temperature increase in the SSPs, with a median value of −0.15 ms−1°C−1. However, some MPI SMILE members also generated future windstorms that are unprecedented in the historical period [14].
Greenhouse gas-induced climate change may modify preferred locations of cyclogenesis/intensification [15] and cyclone tracks [16] and so may impact the frequency/intensity of regional windstorms. Detection of such changes is difficult because internal climate modes also induce both inter-annual and inter-decadal variability in mid-latitude cyclone counts and preferred tracks [17,18]. Coupled Model Intercomparison Project phase 5 (CMIP5)–generation Earth System Models (ESMs) generally project decreasing cyclone frequency in the Northern Hemisphere, including the NE [19], but changes are less pronounced in ESMs with higher historical fidelity [20,21,22]. Although transitioning tropical cyclones (TCs) comprise a small fraction of NE windstorms in the current climate [4], they tend to exhibit higher intensity than ETC [23]. Climate projections indicate TC frequency may increase along the US east coast [24], and more post-tropical cyclones may track into the NE [25]. This may lead to increased property and infrastructure damage along the entire US east coast [26] and potentially an increasing role in NE windstorms [13].
The overarching goal of this research is to make robust projections of NE windstorm characteristics. Our objectives are to quantitively explore the windstorm projection dependence on the ESM from which the lateral boundary conditions (LBCs) are drawn and to assign reliability to projections made with different LBCs based on the model chain representation of historical windstorms, cyclone climates and indices of internal climate modes. Previous research has shown dynamical downscaling with regional models almost uniformly ‘adds value’ to wind climate accuracy over North America relative to the use of direct output from ESM [27]. Thus, simulations over the domain shown in Figure 1a as performed with the Weather Research and Forecasting (WRF) at a 25 km grid spacing are analyzed herein. WRF is widely used within dynamical downscaling contexts [28,29,30] and these specific WRF simulations, that are drawn from the North American COordinated Regional Downscaling EXperiment (NA-CORDEX) archive, have been shown to be particularly skillful with respect to weather types and thus the synoptic climate [31]. The WRF simulations are nested in LBCs from three CMIP5–generation ESMs and ERA-Interim [28,32]. They are analyzed herein to quantify possible future changes in NE windstorm characteristics and resulting socioeconomic damage, plus the cyclone types that cause windstorms. The following hypotheses are tested:
(1)
Future NE windstorm characteristics will be unchanged relative to the historical period.
(2)
Cyclone types responsible for future NE windstorms will be consistent with those in the historical period.
(3)
Projected changes in a simple measure of socioeconomic losses (loss index) from future versus past NE windstorms are solely the result of projected population changes.
(4)
Differences in windstorm characteristics and their parent cyclones across simulations with different LBCs are due to differences in the ESM representation of internal climate modes.
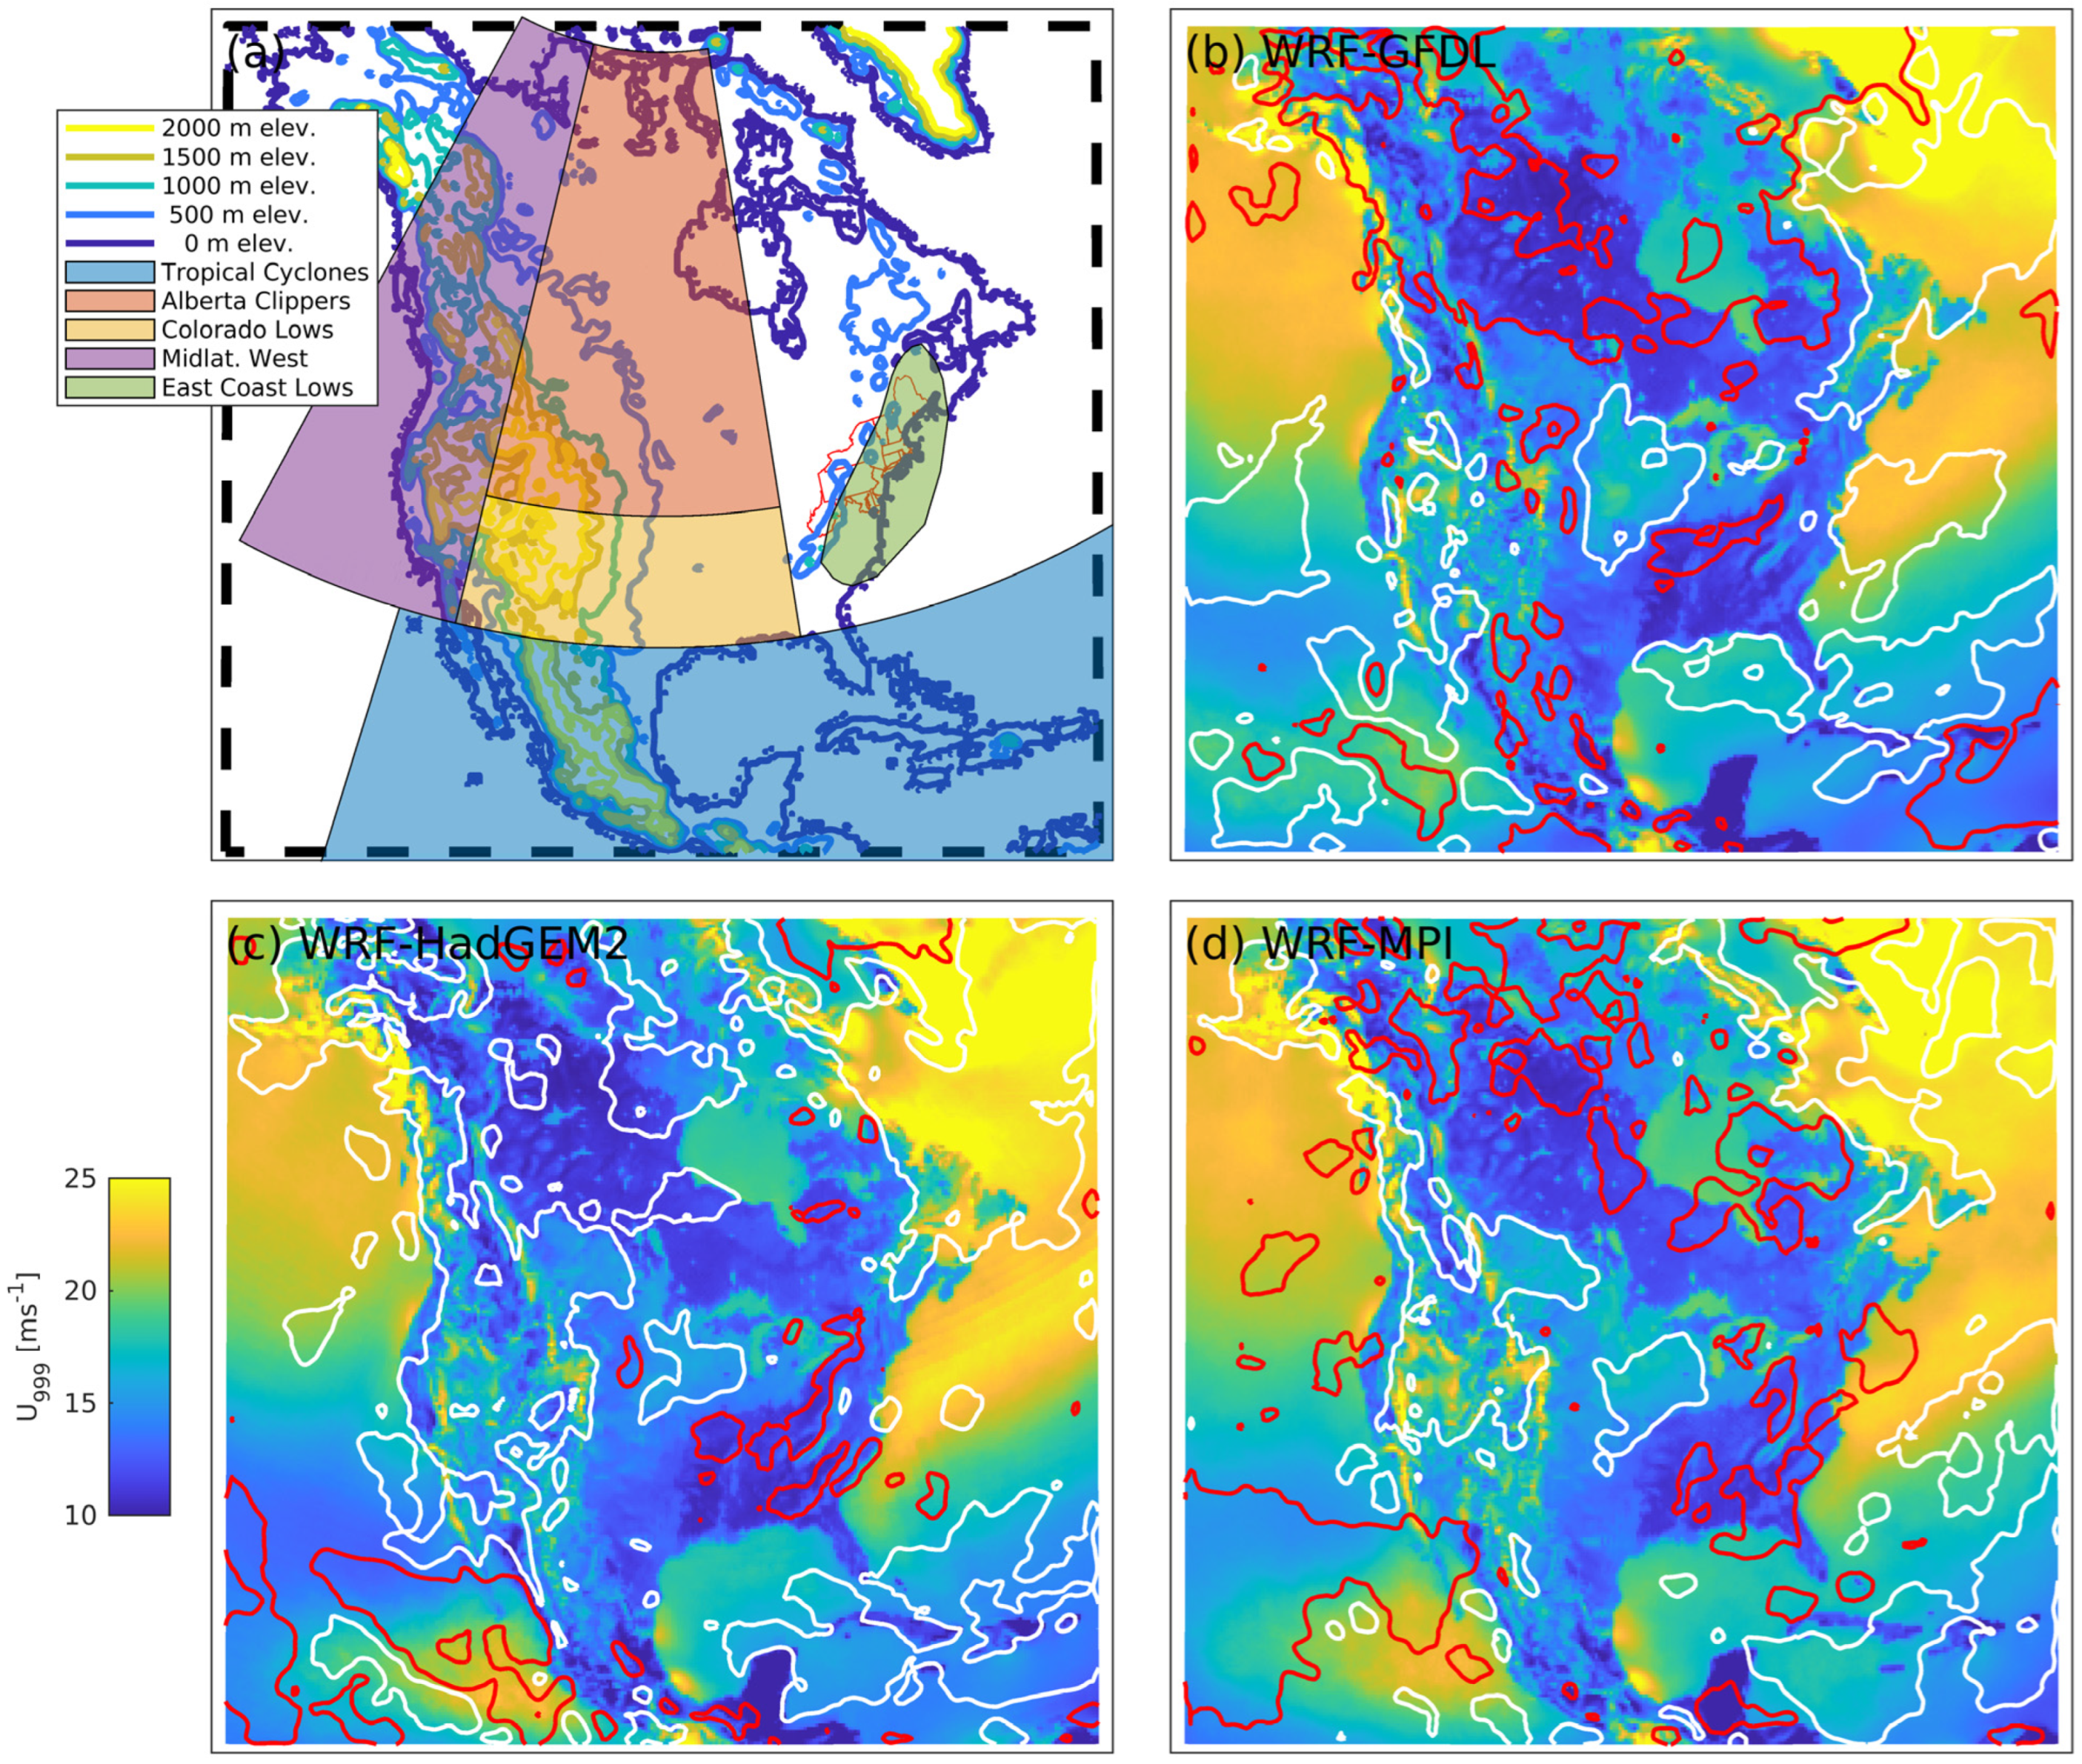
Figure 1. (a) Simulation domain (black dashed line), terrain elevation, polygons used to define cyclone origin and the 13 Northeast states (red outlines). Grid-cell 99.9th percentile wind speed, U999 at 10 m height from (b) WRF-GFDLa, (c) WRF-HadGEM2a and (d) WRF-MPIa (historical periods; 1950–2005). Red (white) contours denote areas with a >2.5% higher (lower) U999 in the future U 999 2045 2099 U 999 1950 2005 / U 999 1950 2005 .
Climate 13 00105 g001

2. Materials and Methods

2.1. Study Region

The NE, as defined in the National Climate Assessment [33], comprises 13 states (Figure 1a), covers 6% of the US land area and is home to 20% of the US population plus significant infrastructure and other assets. The NE also experiences a high frequency of cyclone passages with wintertime monthly mean extratropical cyclone (ETC) density >14 per million sq kilometers [34], high magnitude long-return-period wind speeds [35] and frequent intense wind gusts [9].

2.2. NA-CORDEX Simulations

Full details of the WRF model configuration used for all simulations presented herein are available on https://na-cordex.org/rcm-characteristics (accessed on 11 May 2025). In brief, the key model physics settings are as follows: Community Noah land surface model, Mellor–Yamada–Janjic (MYJ) planetary boundary layer model, WRF Single-Moment 3-class explicit moist physics scheme, Kain–Fritsch cumulus parameterization, the rapid radiative transfer model (RRTM) longwave radiation scheme and the Goddard shortwave scheme. Per CORDEX protocols [29], a WRF simulation with lateral boundary conditions from ERA-Interim ERA-Interim [36] (WRF-ERAI, 1980–2010) is used as a reference simulation of the historical climate. WRF simulations performed within three Earth System Models (ESMs); GFDL-ESM2M [37], HadGEM2-ES [38] and MPI-ESM-LR [39] are used to evaluate possible changes in windstorm characteristics, sources and consequences. These simulations are performed for the historical period of 1950–2005 (referred to herein as WRF-ESMa) and a future period of 2006–2099 (referred to herein as WRF-ESMb) under Representative Concentration Pathway (RCP) 8.5 Wm−2. All simulations are subject to nudging of temperature, winds and geopotential height through the full atmosphere for wavelengths greater than about 1000 km [32] and are performed with time-invariant LULC.
The ESMs span a range of equilibrium climate sensitivity (GFDL (2.4 °C), MPI (3.6 °C) and HadGEM2 (4.6 °C)) [40], are relatively independent [41,42] and exhibit different time evolutions of global mean air temperature [43,44]. A previous analysis of these CMIP5 ESM simulations [45] found MPI captures some features of the NE cyclone density and frequency during the cold season, but intensity is underestimated. NE cyclone frequency and intensity from HadGEM exhibit positive bias, while GFDL exhibits negative bias for these properties during the historical period. All three ESMs project decreases in cyclone frequency over the NE under RCP 8.5, though deep (<980 hPa) cyclones exhibit a 10–40% increase in frequency over inland NE during the cold season over the period 2039 to 2068 with reduced frequency of cyclone deepening later in the century [45].

2.3. Windstorm Identification and Characterization

Numerical simulations performed with a grid spacing (dx) of 25 km cannot capture all the features of flow fields around an extra-tropical or transitioning tropical cyclone [46,47]. However, even simulations performed at T63 resolution (approx. 210 km at the equator) can represent cyclone tracks associated with severe windstorms satisfactorily, although the cyclone intensity (minimum sea level pressure, SLP) is underestimated [48]. Regional simulations performed with dx = 25 km have previously been shown to capture some aspects of large-scale windstorms [49]. Nevertheless, use of spatially averaged 10 m height wind speeds (U) from a model output sampled once every three hours will inevitably lead to underestimation of the intensity of wind speeds relative to representative point measurements or models run with higher resolution because wind speeds are also strongly influenced by local sub-grid scale topography and LULC. For these reasons, windstorms are identified herein using a methodology predicated on wide-spread exceedance of locally determined 99.9th percentile wind speeds (U999). Use of an absolute wind speed threshold would preferentially select windstorms affecting high-altitude or low surface roughness length (z0) grid cells and may miss windstorms affecting higher-population areas [4]. Further, use of a relative threshold renders the analysis less sensitive to uncertainties in z0. Since all model ‘samples’ (i.e., each model chain) have an identical sampling interval and spatial resolution, differences in windstorm metrics across the three ESMs and through time as presented in these analyses should be robust.
To facilitate comparison of the cyclone types responsible for windstorms and sample a similarly salient (equal frequency of occurrence) set of windstorms from each model chain, N windstorms equal to the number of simulation years are drawn from each simulation. Therefore, these windstorms have an expected frequency of one per year. Hence, since the WRF-ERAI simulation covers 1980–2010, the 31 largest windstorms are selected from this simulation. The WRF-ESMa simulations cover 1950–2005, thus 56 windstorms are selected from these simulations. These top N windstorms have the largest spatial exceedance of NE land (NEland) grid-cell specific 99.9th percentile wind speed (U999) during each simulation (see Figure 1b–d for maps of U999 during 1950–2005). The time with the highest NEland extent of U > U999 was designated as peak time (tp). To avoid double counting of longer-duration windstorms, no event may be within 48 h of another. The following metrics are quantified for each windstorm:
  • Spatial scale: Fraction of NEland with simultaneous exceedance of U999 (referred to herein as U > U999Cov.) A related metric, termed windstorm size, is also computed. It is the total number of grid cells within a 1500 km radius of the sea-level pressure (SLP) minimum (cyclone centroid) with U > U999 at tp.
  • Umax [ms−1]: Maximum wind speed in NEland grid cells during tp ± 12 h. The frequency of occurrence of windstorms with Umax > 22.5 ms−1 (strong gale according to the Beaufort scale [50]) is also reported.
  • Loss index (LI): Highest U999 values from all simulations occur over water surfaces and in the complex terrain of western North America (Figure 1). However, socioeconomic damage from windstorms is a strong function of exposed assets. Thus, to provide an index of windstorm impact, we employ the LI concept that was first proposed based on data from Germany [51]. It has been widely used in quantifying windstorm socioeconomic consequences in the current and possible future climate [4,52,53]. The LI metric depends on the extent and magnitude of exceedance of locally defined wind speed thresholds, weighted by population as a proxy for assets exposed to wind damage [51]:
L I = N E L a n d p o p ( c e l l ) U m a x ( c e l l ) U 98 ( c e l l ) 1 3
where pop (cell) = population of each land-based NE grid cell, Umax (cell) = 24 h maximum U in that grid cell and U98 (cell) = grid cell-specific 98th percentile U. Per the original definition, the summation is only performed for grid cells where Umax > U98. Initial definitions of the LI used daily maximum gust wind speeds measured at stations distributed over the country scaled with the local climatological upper 2% quantile at each station (as in Equation (1)). The normalization to U98 (cell) is designed to take local vulnerability to high wind speeds into account. Conceptually, a building in a typically calm wind regime will likely have been built to withstand lower wind gust values. Subsequent research has used sustained rather than gust wind speeds [4]. Irrespective of the precise wind speed used, as the originators note, that normalization ‘permits a simple spatial interpolation of the storm field’ [51]. The weighting by population is designed to act as a proxy for the likelihood that high-value assets are impacted by high wind speeds [54]. While meteorologically derived LI (e.g., from Equation (1)) scales with insurance losses [55], and it is used within the climate impacts model CLIMADA [56], the LI is used here as an illustrative simple metric of possible socio-economic consequences and not a prediction of the absolute magnitude of losses. Population estimates used to compute LI herein represent the years 2000 and 2090 projected under SSP 5–8.5 [57] which is the only SSP that results in a radiative forcing similar to RCP 8.5. These population projections indicate a doubling of NE population between 2000 and 2090 in each NEland grid cell which, as shown in Equation (1), would cause a doubling of LI.
As described above, analyses presented herein focus on N largest windstorms from each simulation, where N is the number of years in each simulation. This decision ensures that windstorms selected from each simulation represent those with an equal probability of occurrence (i.e., are equally salient or have equal statistical rarity). To examine the robustness of findings regarding possible changes in windstorm properties to this methodological decision, results are also presented for analyses of annual windstorm frequencies where thresholds of X% coverage of U > U999Cov. over NEland are used to identify windstorms. Lower U > U999Cov. values yield higher NE windstorm annual frequencies (i.e., are more probable), while higher thresholds yield lower annual windstorm frequencies.
Two additional metrics were also quantified for NE windstorms from these NA-CORDEX simulations, but the results are not presented in detail here because no consistent tendencies could be found for either:
  • Windstorm duration [hours]: Duration of time surrounding tp during which U > U999 continuously in >10% of NEland grid cells.
  • Cyclone speed [km hr−1]: Translational velocity of the windstorm parent cyclone during the 12 h prior to tp.
Serial clustering of windstorms within individual cold seasons is an important element of societal impact [53] and is quantified using a dispersion index (D). The dispersion index is predicated on use of the (discrete) Poisson distribution to model the occurrence of rare events in a population. Specifically, the counts of an event (e.g., windstorm) in a given time interval are assumed to follow a Poisson distribution [58]. The dispersion index is computed using
D = σ 2 μ 1
where σ2 and μ are the variance and mean rate of occurrence (counts) of windstorms in each cold season. D > 0 (σ2 > μ) indicates the presence of temporal clustering [59]. This metric is useful and relevant to the insurance industry because of financial mechanisms used in the industry and also to possible compounding of losses when a second damaging event occurs before full recovery from the first event has been achieved [60].
The two-parameter Gumbel distribution [35,61] is used here to obtain estimates of the 50-year return period wind speed in NE land grid cells (URP,50). This distribution is fitted to annual maximum wind speeds (Umax) that occurred in any NEland grid cell within 12 h of U > U999Cov. > 10%:
F U m a x = e x p e x p ( U m a x μ ) β
where μ and β are the distribution parameters fitted using maximum likelihood estimation. U50,RP is first computed using each WRF-ESM pairing for the entire 150 years of simulation. Then, each rolling 20-year segment (i) of each WRF-ESM simulation is used to derive an estimate of U50,RP,i which are evaluated using 95% confidence intervals on U50,RP computed promulgation of uncertainty bounds on μ and β following prior research [35].
The concept of accumulated cyclone energy (ACE) [62] derives from the tropical cyclone community [62]. It is employed here to examine the collective strength and duration of windstorms at the annual time scale:
A C E = 10 4 t U m a x 2 ( t )
where Umax (t) = maximum wind speed in NEland grid cells for all timesteps (t) when Umax > 16.5 ms−1.

2.4. Characterization of Cyclones Responsible for Windstorms

The parent cyclone responsible for each windstorm is identified from local minima in SLP fields smoothed using a 125 × 125 km digital filter (approximating global T63 filtering used in previous work [4,63]). At tp, the minimum SLP within a rectangle surrounding the NE region (35 to 50° N, 65 to 90° W) is identified. As in past research [64,65], the deepest local minimum SLP within 375 km of the cyclone centroid is tracked back in time as at the previous time step until no local minimum is detected in that search radius. Cyclone types are classified by their region of origin: Tropical Cyclones (TCs) if the furthest location to which we can track cyclones responsible for NE windstorms lies below 25° N, Alberta Clippers (ACs), Colorado Lows (CLs), Mid-latitude West (MW) or East Coast Lows (ECs) (Figure 1a). Cyclones originating outside of these regions are classified as ‘Other’ [4,64].

2.5. Tests for Statistical Significance

Since the windstorm metrics are not drawn from Gaussian distributions, Kendall’s tau statistic is used to test for monotonic (secular) trends in them and cyclone type frequency time series [58] and the statistical significance of differences in windstorm metrics is assigned using bootstrapped confidence intervals. The sample of metric values from the last 30 years of each simulation is re-sampled with replacement 10,000 times to derive a sample of median values. If the median value derived from another (paired) simulation does not lie within the central 90% of the bootstrapped sample, then that aspect of the windstorm is deemed significantly different between the paired simulations (WRF-ESMa v. WRF-ERAI or WRF-ESMb v. WRF-ESMa). A student’s t-test [58] is used to examine the statistical significance of differences in mean indices of various internal climate modes. The cumulative probability distributions of windstorm spatial scale from the different simulations are compared using a Kolmogorov–Smirnov (K-S) test [58]. A χ2 test [58] is used to compare the proportion of windstorms allocated to each cyclone type in the different paired simulations:
χ 2 = i = 1 k x i m i m i
where x i and m i = number of cyclones per year of type i in the test and target samples; k = number of cyclone types.

2.6. Evaluation of ERA-I Nested NA-CORDEX Simulations

The WRF-ERAI simulation is the only one of the simulations that is synchronized in time to observations and is used as a reference against which the other NA-CORDEX simulations are compared. Thus, the evaluation of the wind climate and cyclone types is focused on that simulation. This evaluation involves comparison of the spatial pattern of U999 derived from the WRF simulation and 10 m height a.g.l. 2-D sonic anemometer observations from the National Weather Service (NWS) Automated Surface Observation System network (ASOS) [66,67,68,69]. It also includes evaluation of the cyclone climatology and specifically evaluation relative to the National Oceanic and Atmospheric Administration (NOAA) database of historically important Atlantic basin hurricanes [70]. Data for all eight historically important tropical cyclones that attained hurricane intensity and made landfall over the eastern US during 1980–2010 are used to determine whether cyclones that caused NE windstorms and that are identified as transitioning tropical cyclones based on the WRF-ERAI simulations accurately reproduce their location, timing and intensity.

3. Results

3.1. Evaluation of ERA-I Nested NA-CORDEX Simulation

Naturally, there is not an expectation of one-to-one correspondence in U999 values from point NWS ASOS observations and numerical simulations performed with dx = 25 km (see discussions in: [71,72,73]). However, there is clear evidence that the large-scale spatial variability in U999 is well captured in the WRF-ERAI output (Figure 2a). Further, the majority of ASOS stations where the largest disagreement in absolute terms with WRF-ERAI is manifest are grid cells that are predominately water in WRF but where the ASOS station is on land (Figure 2b). As expected, in those cases, U999 estimates from WRF-ERAI exceed those from the stations due to the much higher land surface roughness lengths and hence surface drag than is manifested in the model. The methodology used to define windstorms minimizes the effect of any biases in absolute wind speed magnitudes via the use of exceedance of local U999 thresholds.
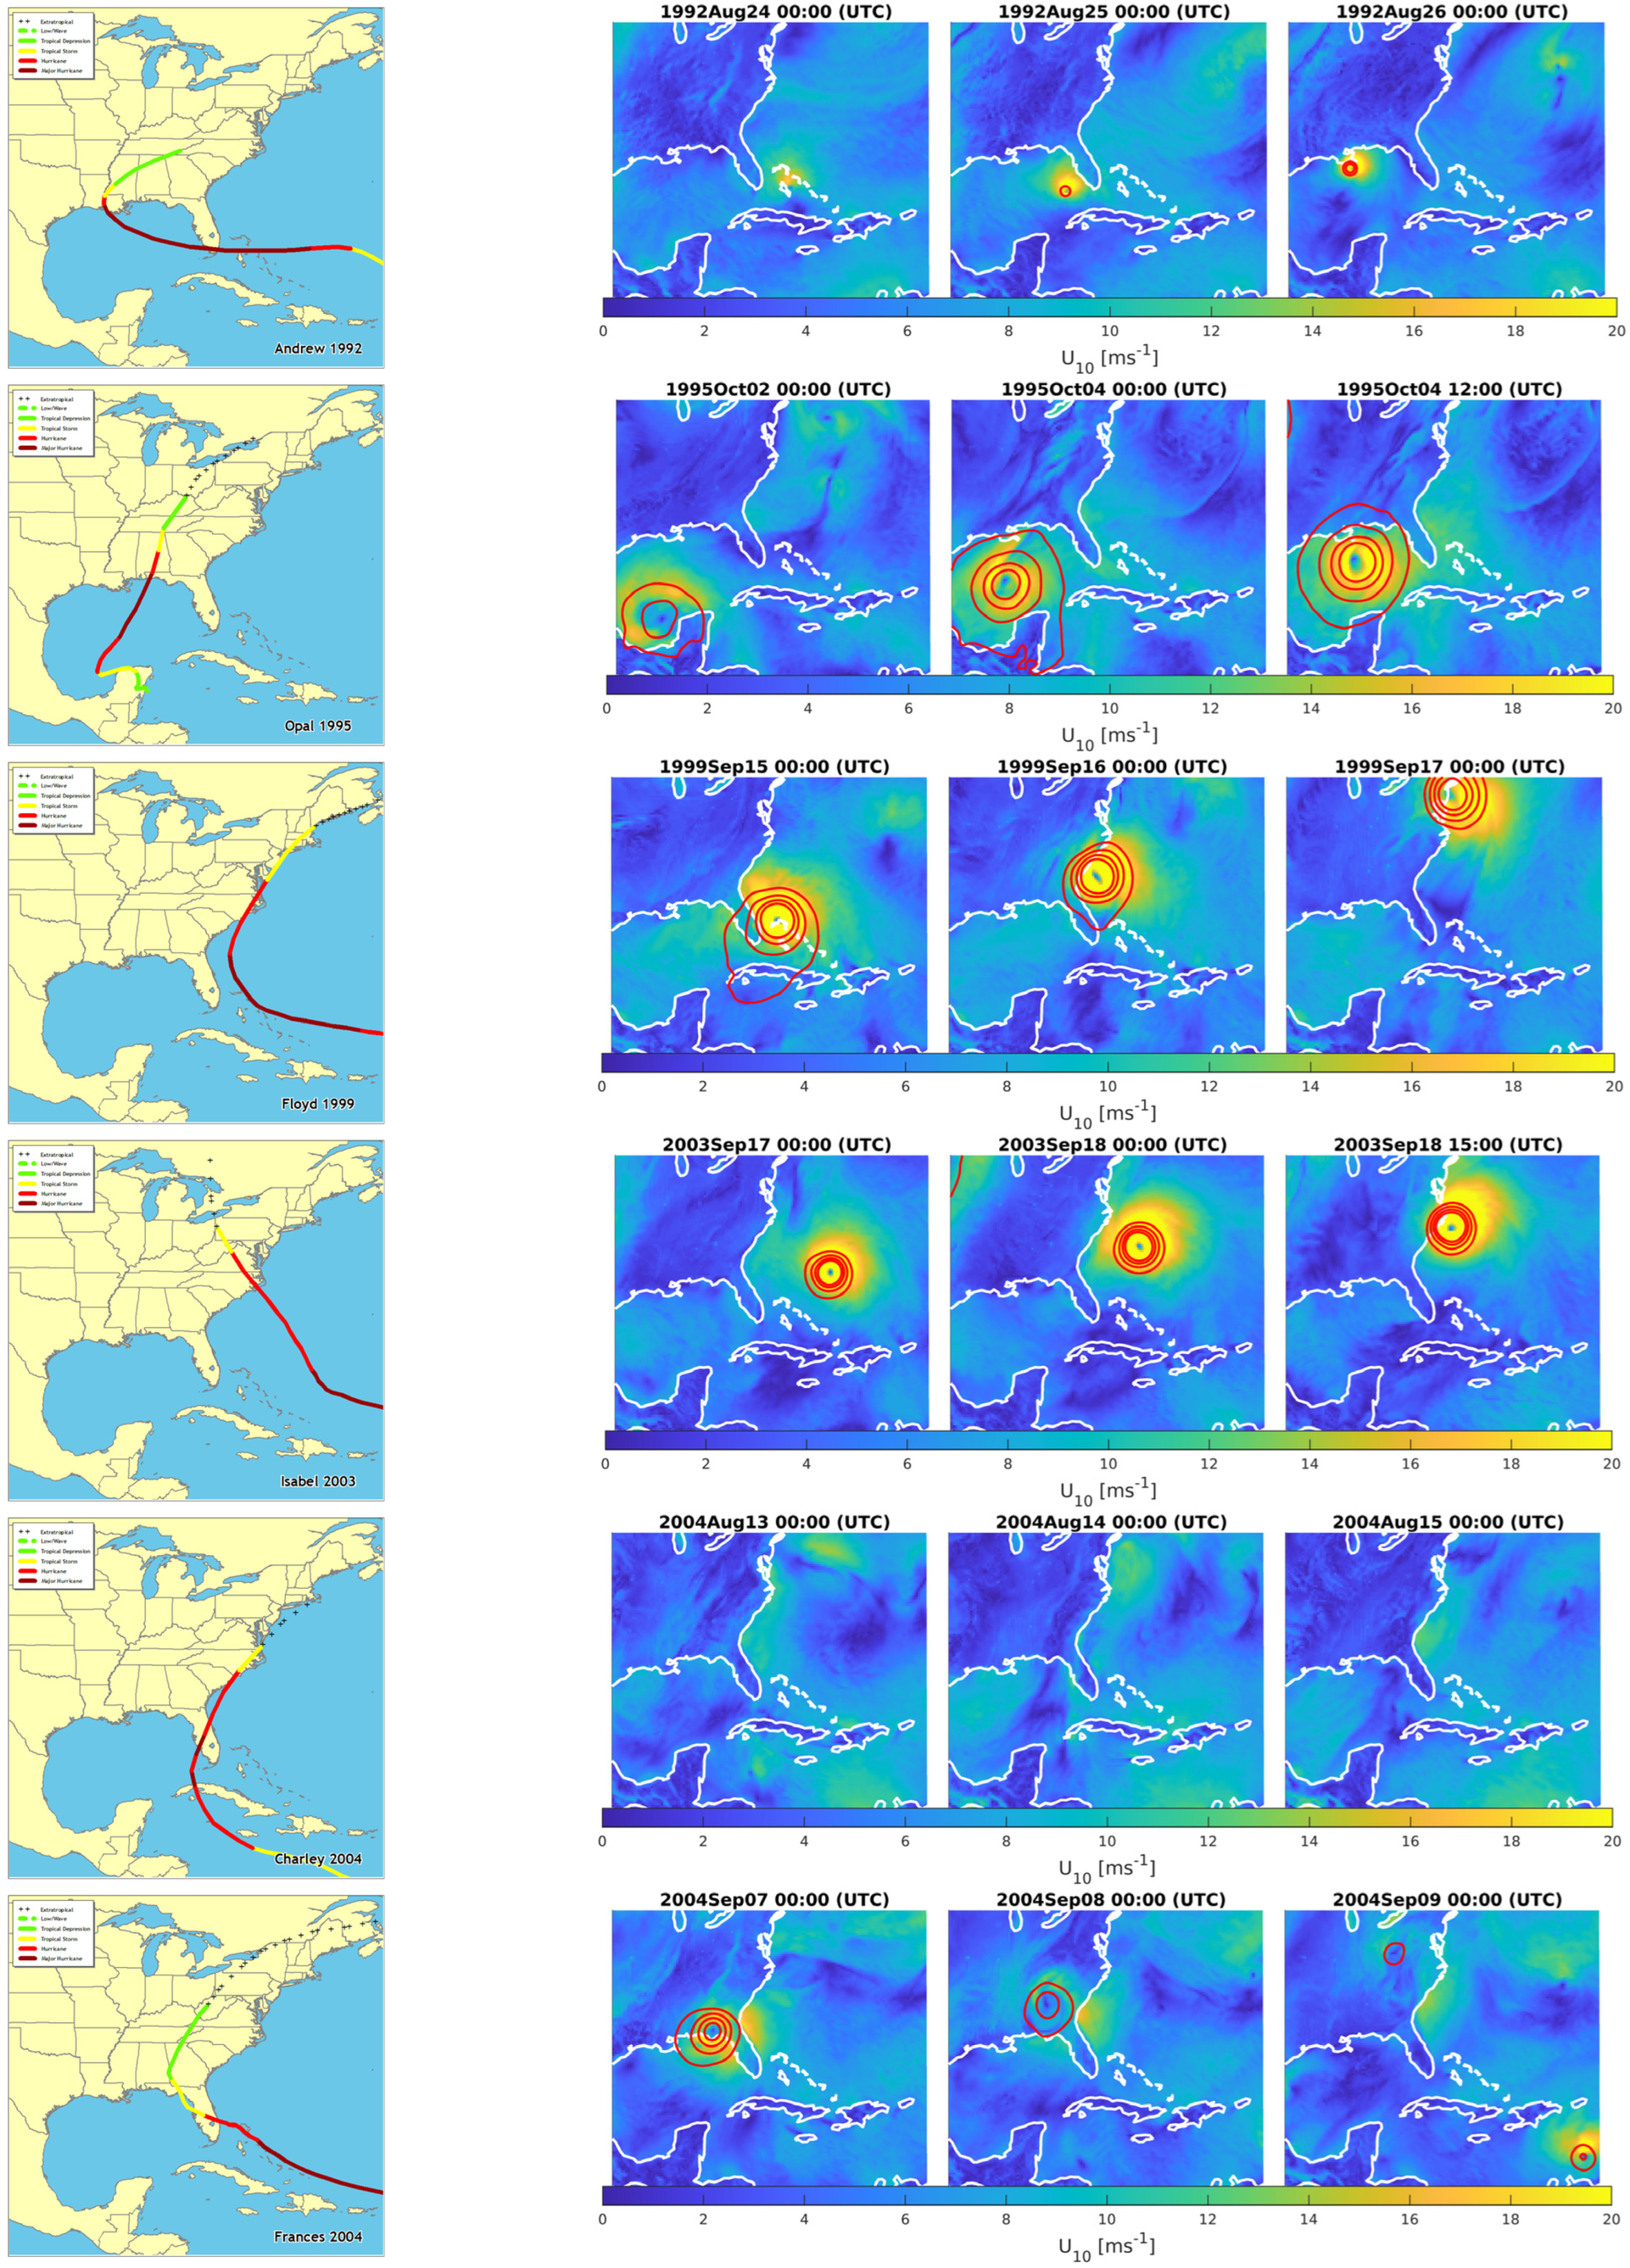
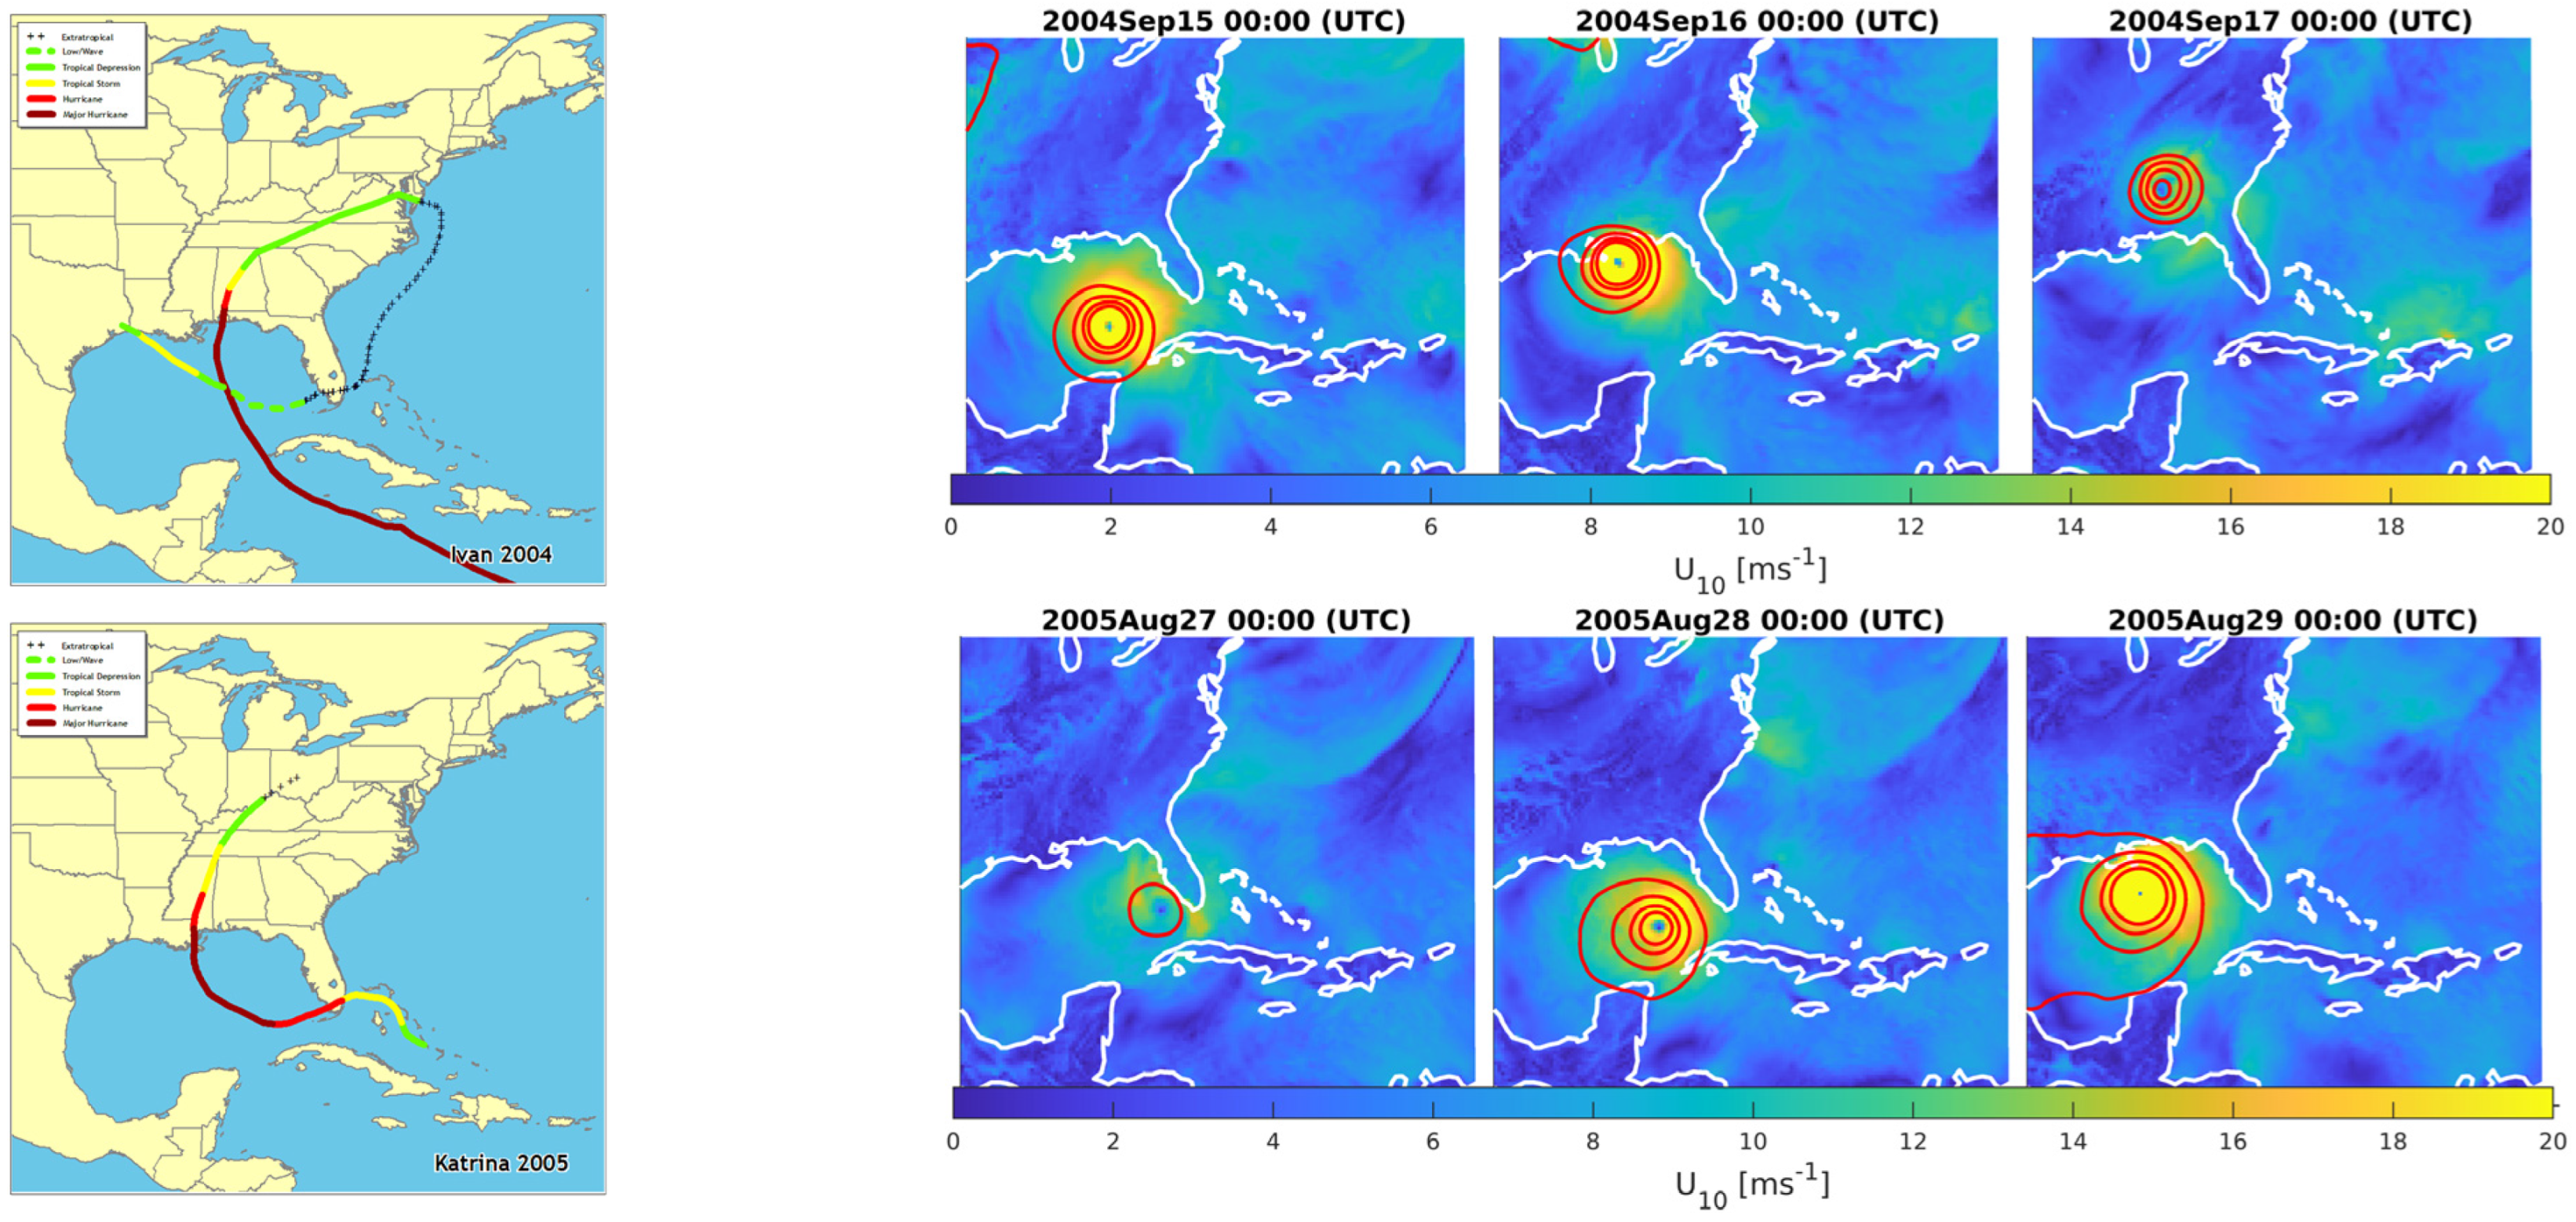
Seven of the eight major hurricanes in the NOAA database are well captured in the WRF-ERAI simulation (Figure 3). The only exception is Hurricane Charley (in 2004), which tracks farther west in the WRF-ERAI simulation, passing farther inland on August 13 than the actual cyclone did, resulting in a premature dissipation. The poor representation of Hurricane Charley in these WRF simulations may be because it was a very compact cyclone [74] and/or that it experienced a major track shift just prior to landfall [75]. The implied veracity of tropical cyclones in the WRF-ERAI simulations is consistent with a past analysis that used a different tracking methodology and wider suite of TC verification metrics [76].
Based on these evaluations, and considering the robust methodology used to identify windstorms that notably corrects for model bias in wind speeds, the NA-CORDEX simulation output is deemed adequate to address the research questions articulated above.

3.2. Windstorm Characteristics in the Historical Period

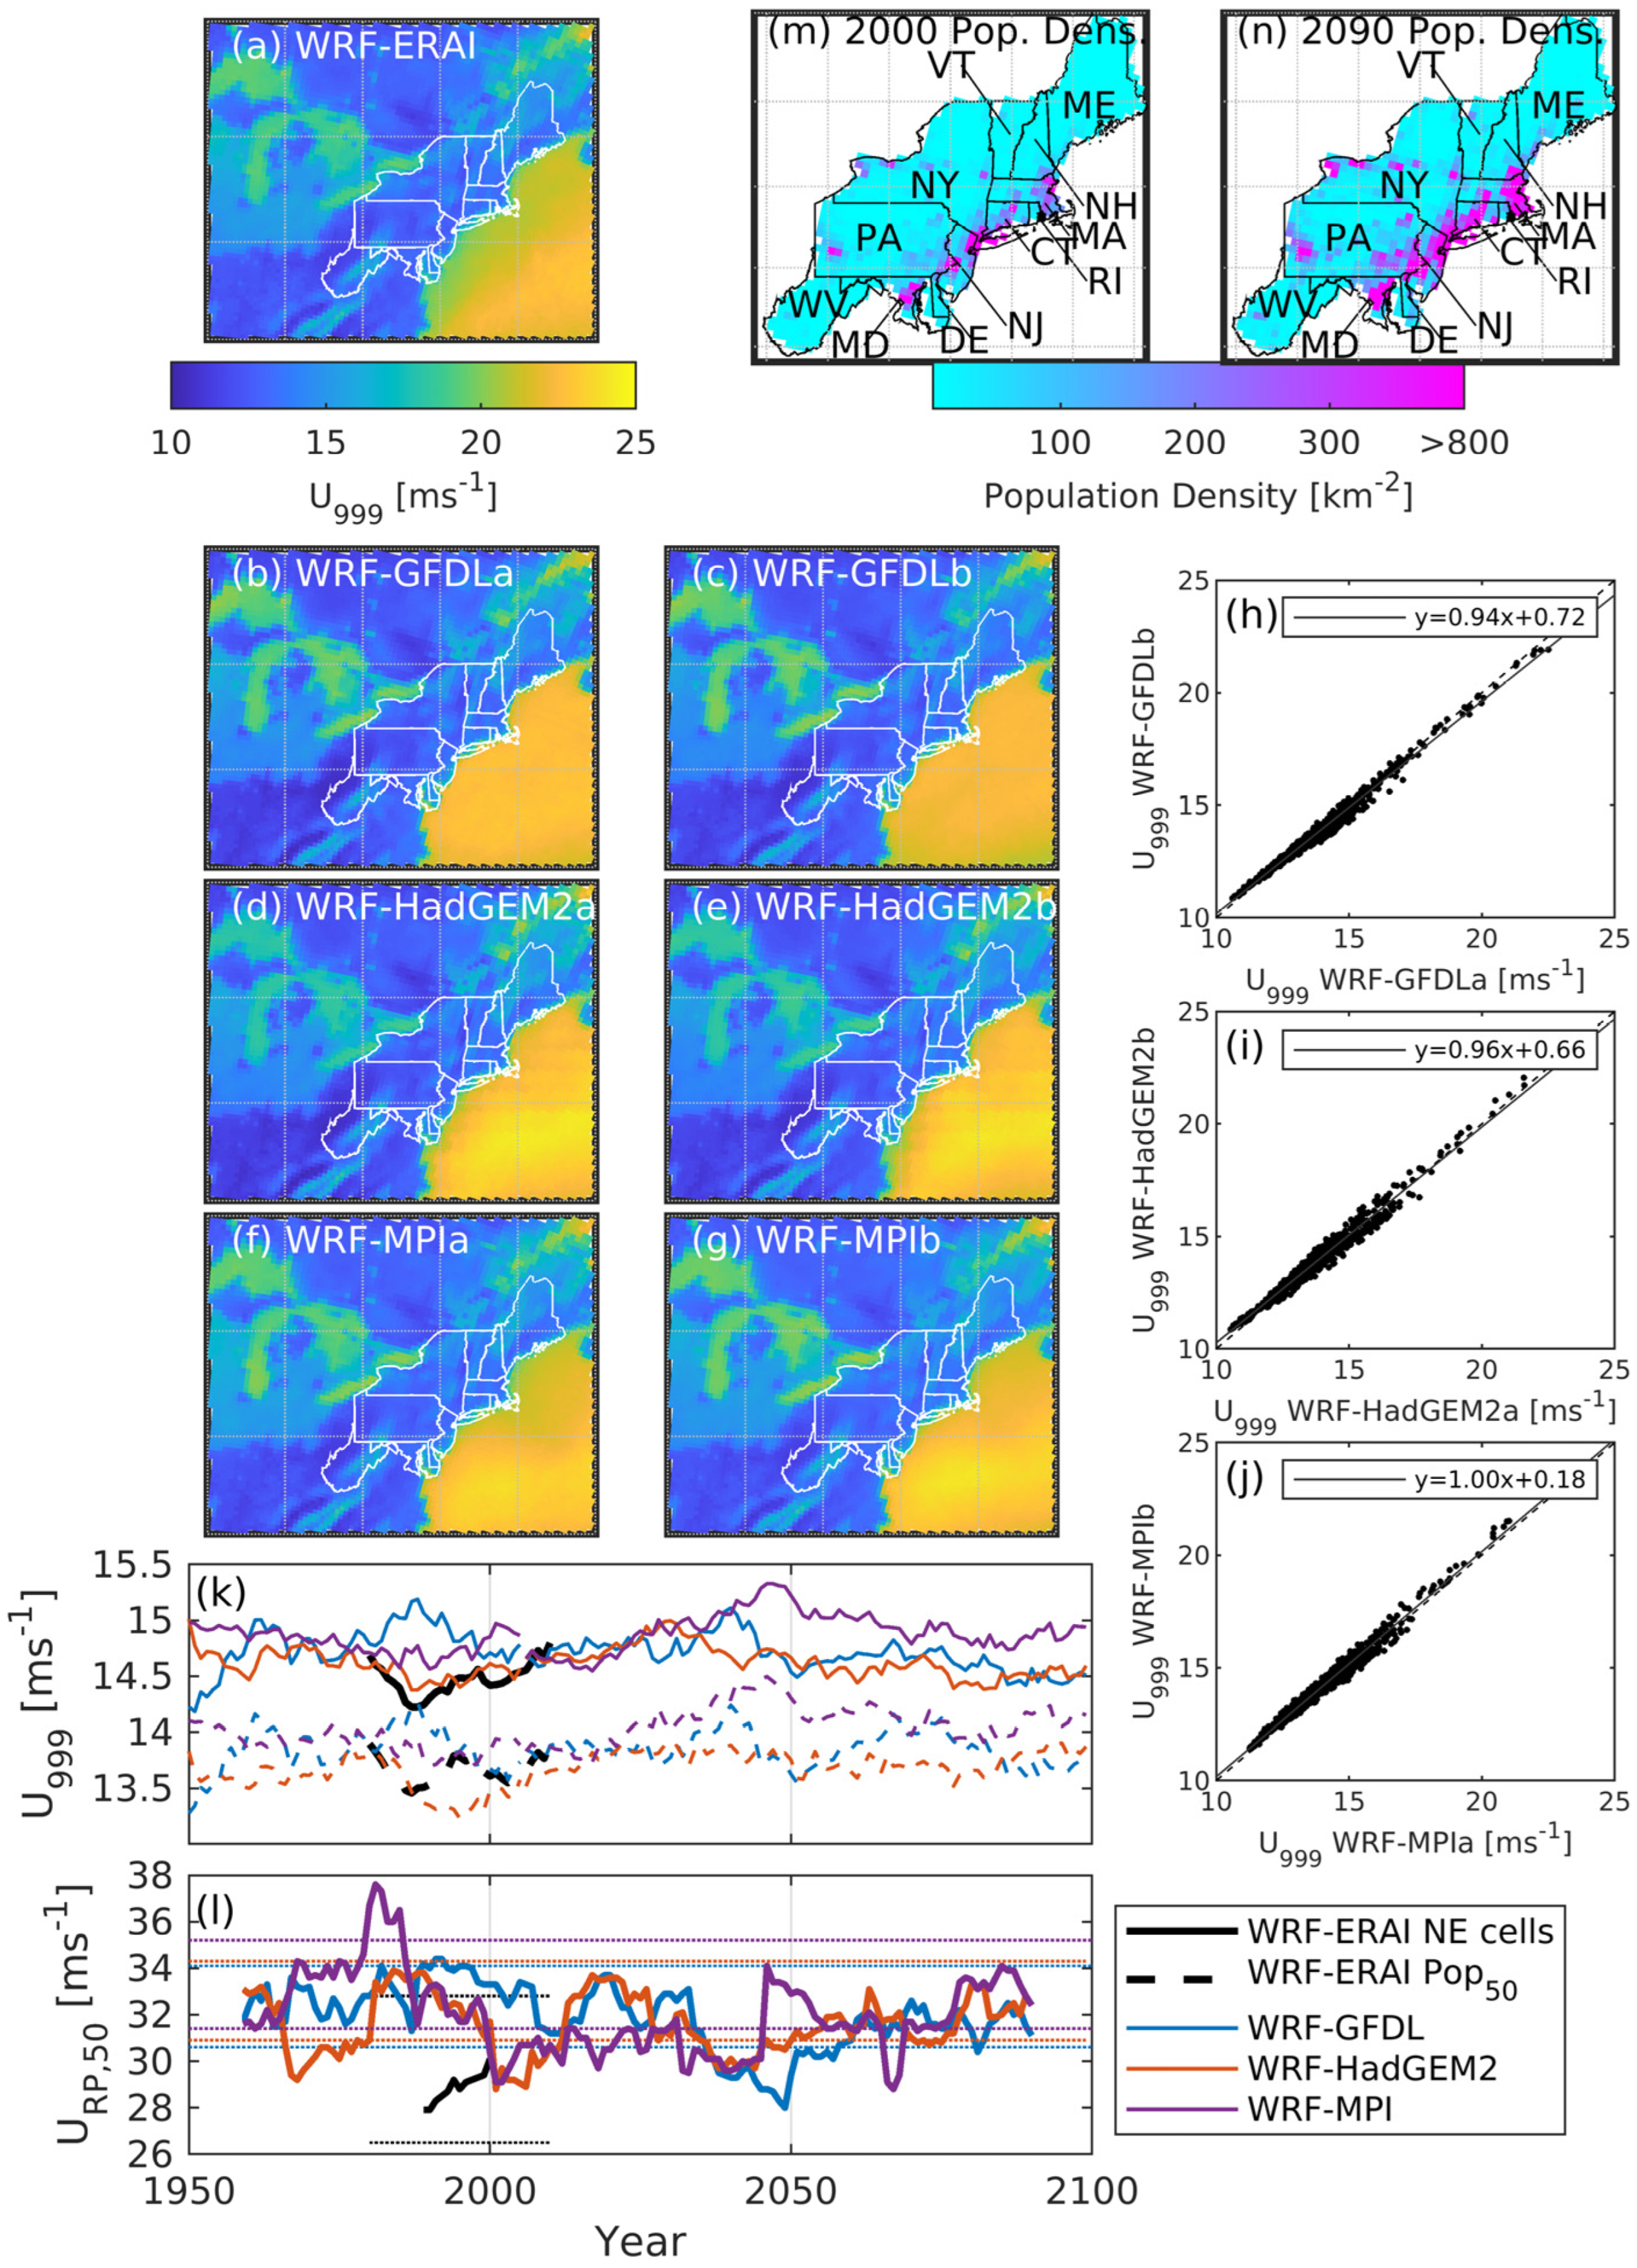
The spatial variability and magnitudes of 99.9th percentile 10 m height wind speeds (U999) over the NEland grid cells from the historical ESM-nested simulations exhibit a high degree of similarity to those from the WRF-ERAI output (Figure 4a–g). U999 from WRF-HadGEM2a and WRF-MPIa are within ±1 ms−1 of WRF-ERAI in 99% of NEland grid cells. A greater number of grid cells exhibit differences in U999 between simulations nested in ERA-Interim and GFDLa (historical). Only 91% of NEland grid cells have U999 values from WRF-GFDLa within ±1 ms−1 of those from WRF-ERAI. Thus, based on similarity with the reference simulation (WRF-ERAI), the intense wind speed fields over the Northeast are more accurately represented in simulations nested within HadGEM2 and MPI for the historical period.
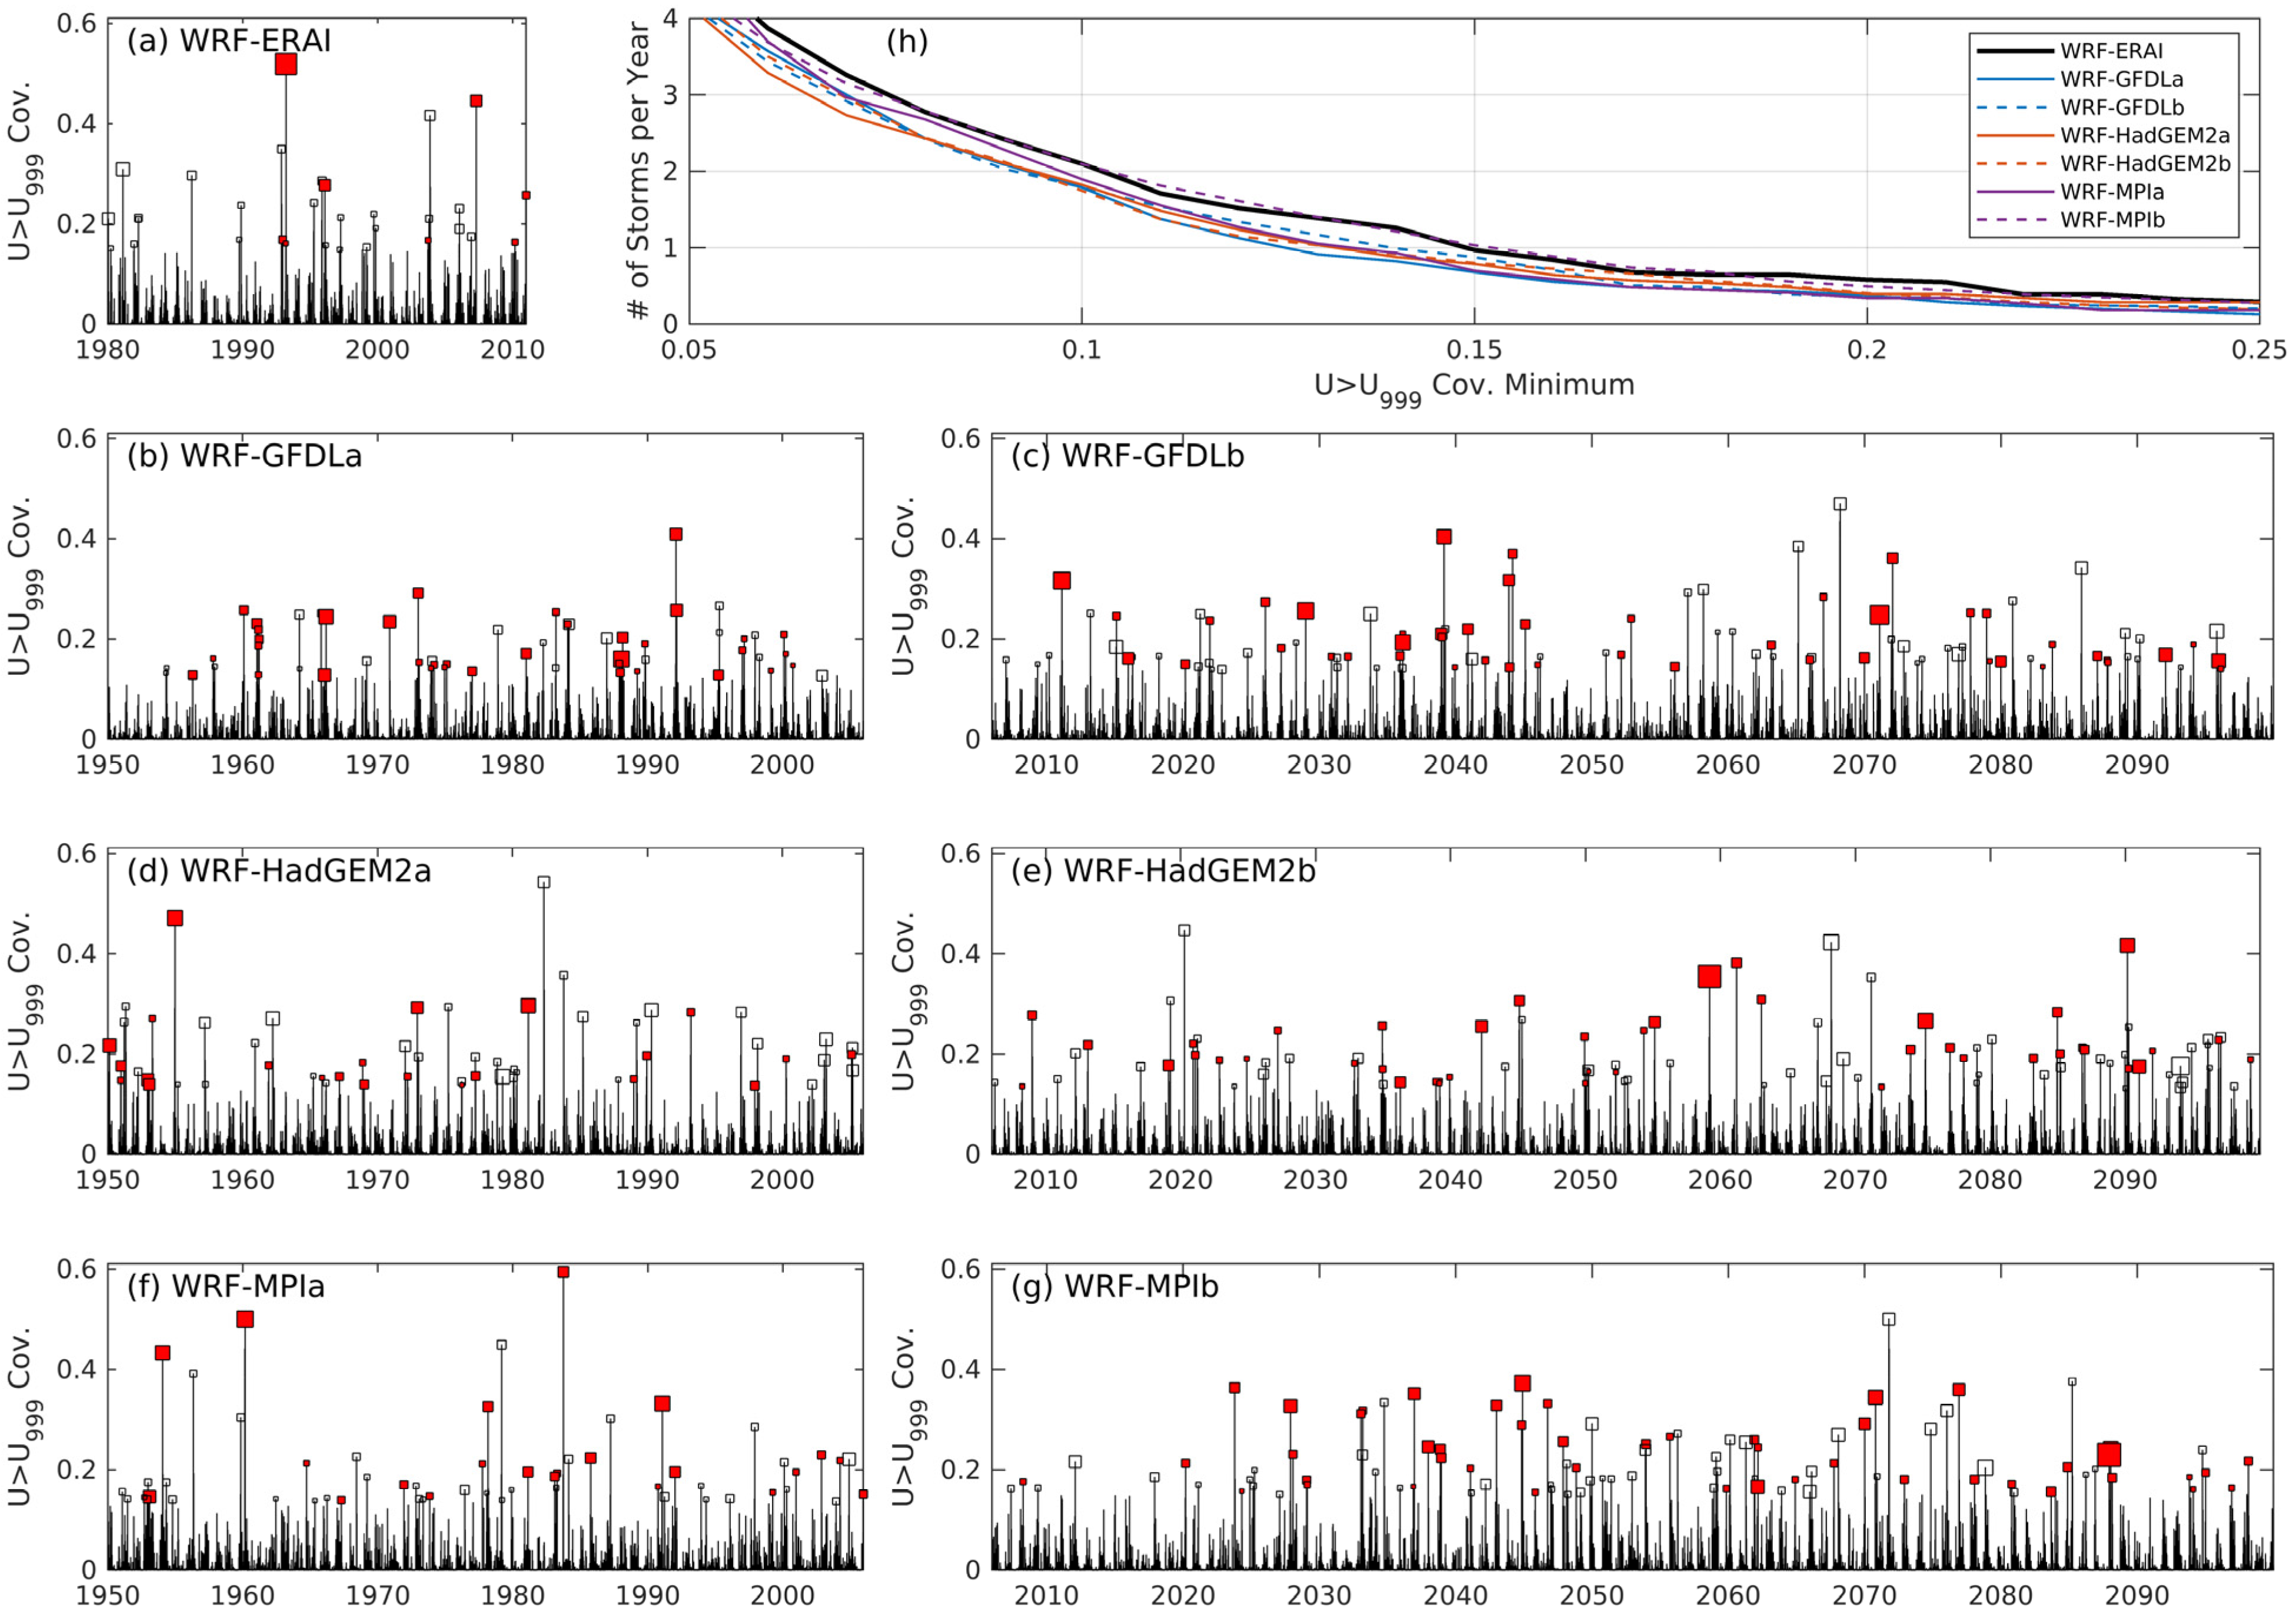
The largest windstorm in the WRF-ERAI simulation (i.e., the largest areal coverage with simultaneous U999 exceedance) covers 52% of NEland grid cells and the minimum coverage is 14% (Figure 5a). The spatial extent of windstorms is smallest in WRF-GFDLa (Figure 5b,h) and the cumulative probability distribution of windstorm spatial extent from WRF-GFDLa is statistically different (at p = 0.02) from WRF-ERAI according to a two-sample Kolmogorov–Smirnov (K-S) test. The sample of windstorm spatial scales from the other two historical simulations (nested in HadGEM and MPI) are not significantly different to those from WRF-ERAI.
Of the 31 windstorms selected from the 31-year WRF-ERAI simulation, eight (~25%) have a maximum wind speed in any NEland grid cell of >22.5 ms−1 (Figure 5a). Equivalent values from WRF-GFDLa, WRF-HadGEMa and WRF-MPIa are 68%, 41% and 41%. Thus, all of the historical ESM-nested WRF simulations exhibit a higher frequency of Umax above the strong gale threshold than is present in the WRF-ERAI reference simulation. Comparison of bootstrapped 90% confidence intervals on the median (Umax) from WRF-ERAI and WRF-ESMa indicates that the median windstorm Umax is significantly higher in all WRF-ESMa simulations. Based on the two-sample K-S test, cumulative probability distributions of Umax also differ at the 99% confidence level (p = 0.01) for WRF-ERAI vs. WRF-GFDLa, and at the 90% confidence level for WRF-ERAI v. WRF-GFDLa. However, the samples of Umax from WRF-ERAI and WRF-MPIa are not significantly different. The biases towards higher wind intensity are thus most pronounced in the WRF-GFDLa simulation. This may be linked to the finding, discussed below, that a larger fraction of NE windstorms derives from transiting tropical cyclones in the WRF-GFDLa simulation.
Based on the similarity with the reference simulation (WRF-ERAI) for both the spatial scale and intensity of wind speeds during windstorms, the historical simulation with lateral boundary conditions from MPI exhibits the highest fidelity.
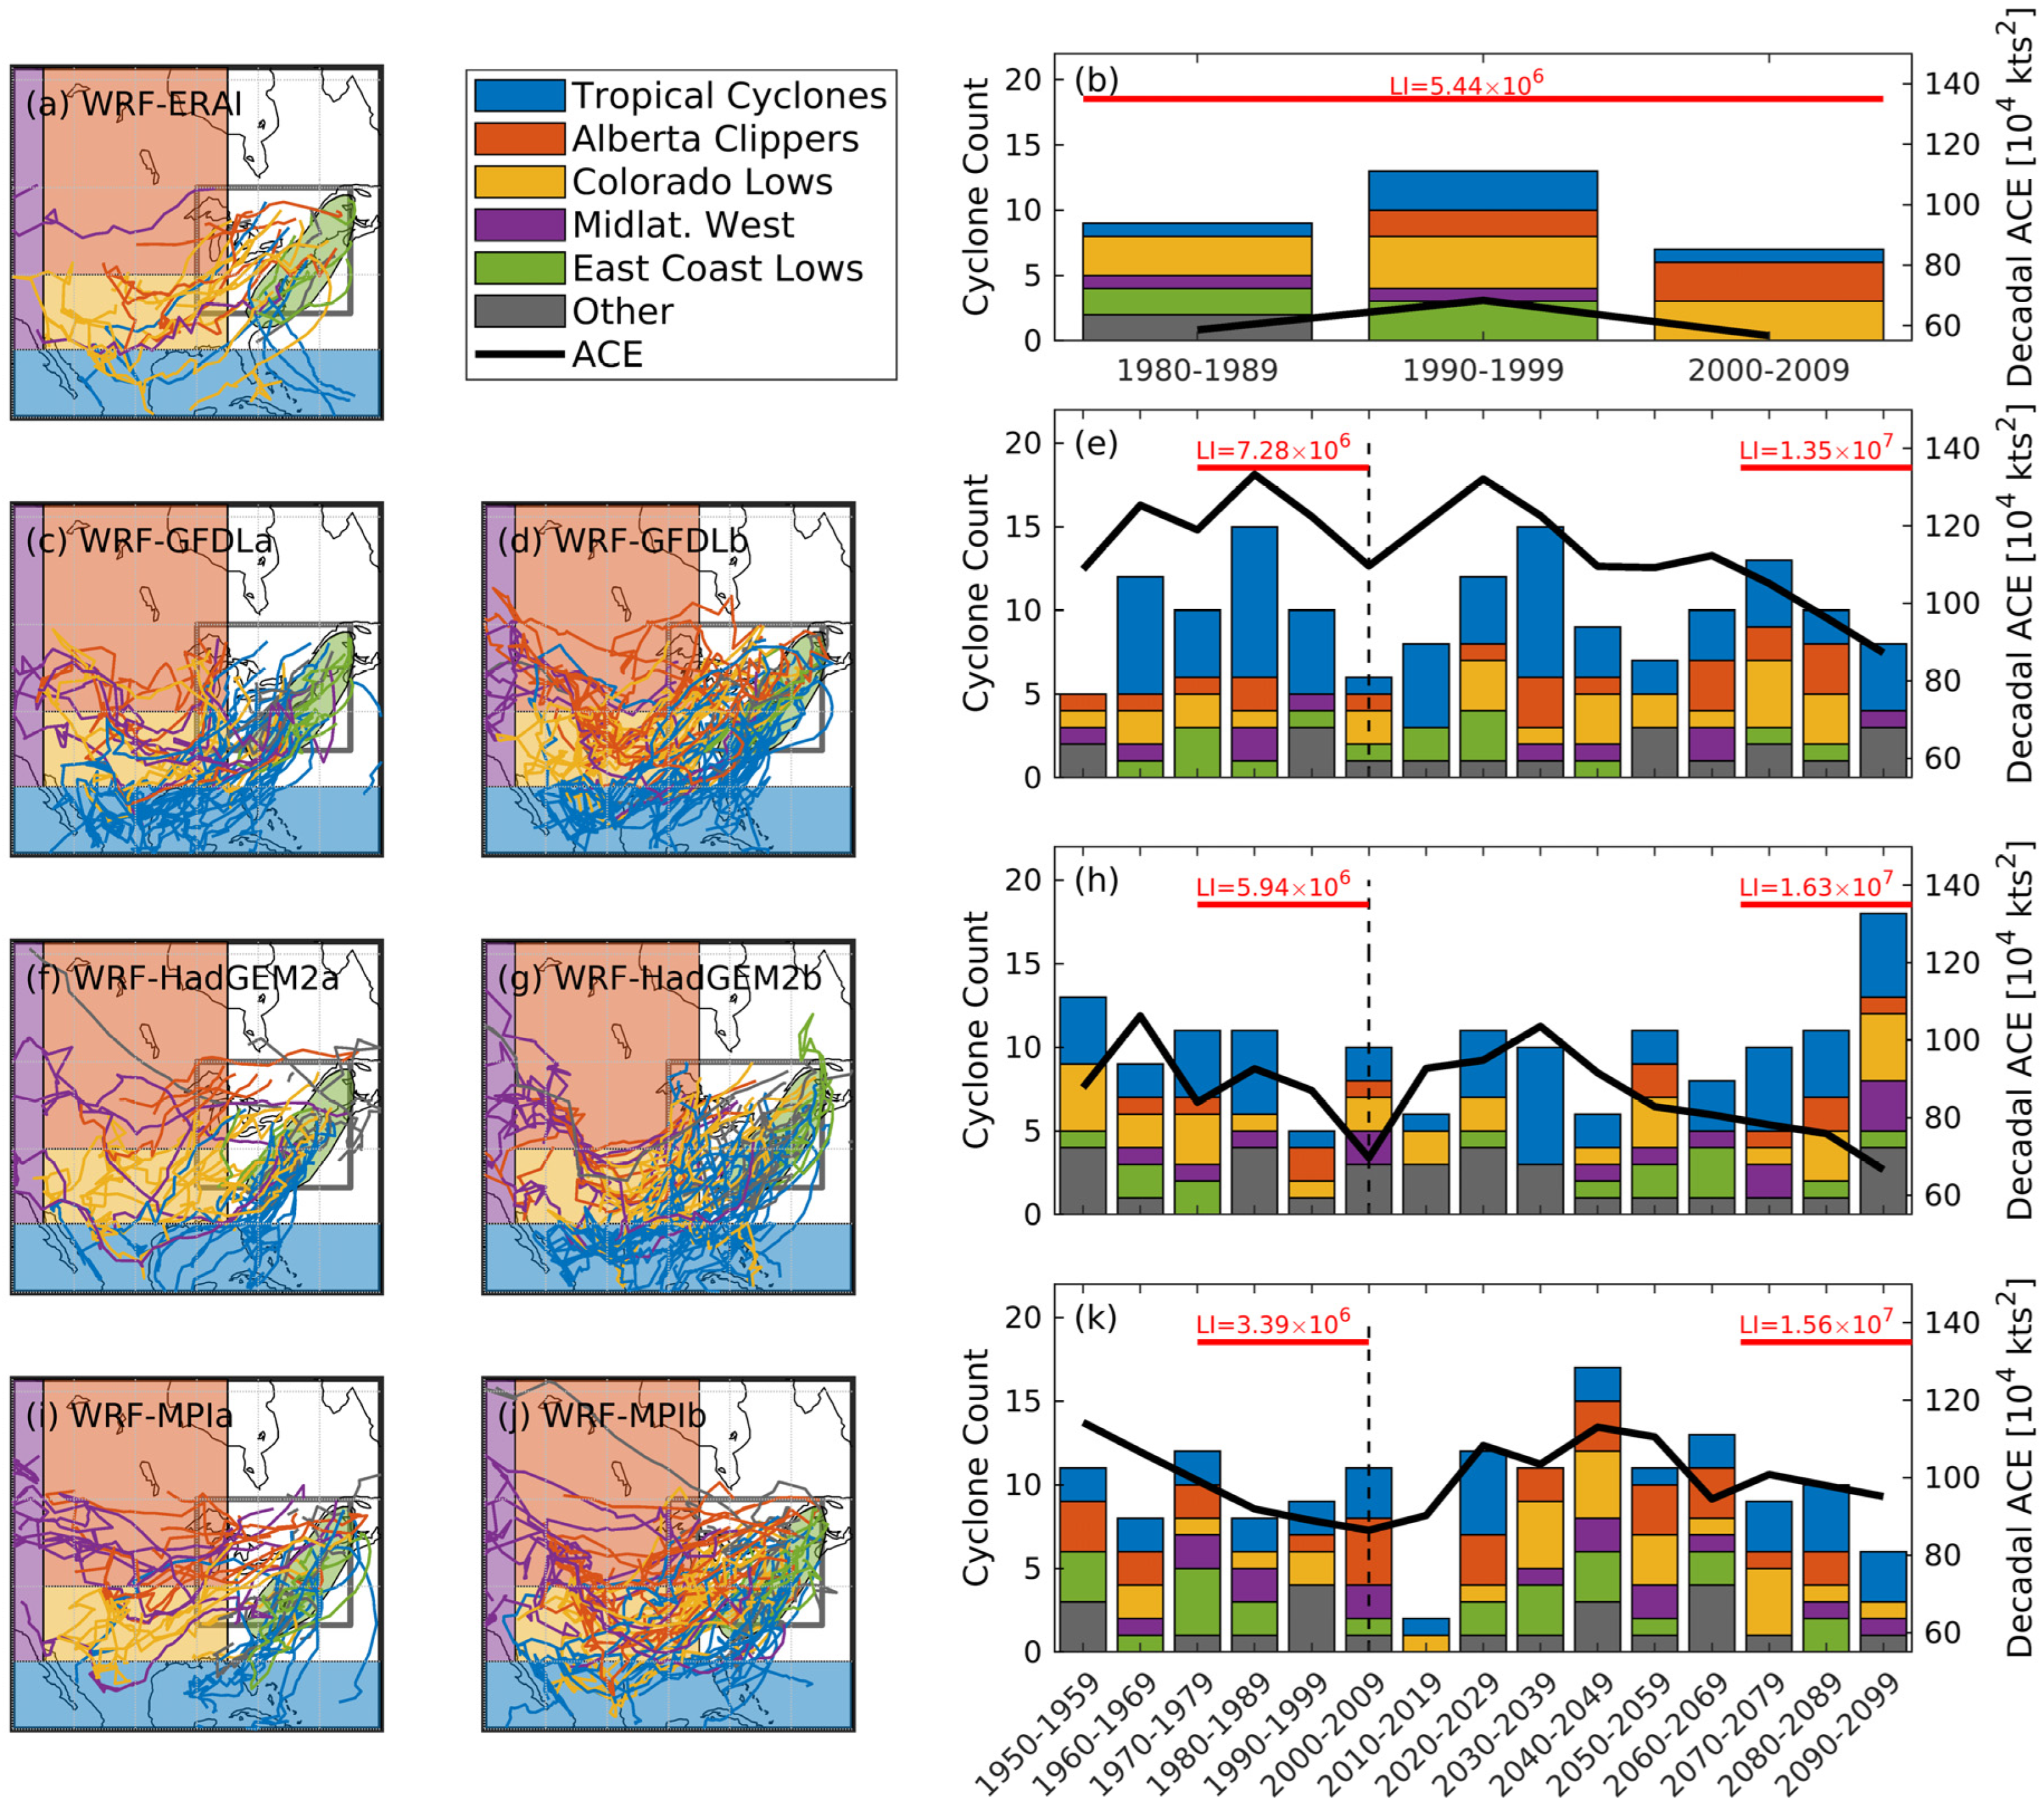
The median loss index from the WRF-ERAI simulation is 5.44 × 10⁶; while consistent with the higher values of Umax from WRF-GFDL, the LI for the last 30 years of the WRF-GFDL is 7.28 × 10⁶. Equivalent values from WRF-HadGEM and WRF-MPI are 5.94 × 10⁶ and 3.39 × 10⁶, respectively.
Annual windstorm frequencies derived using thresholds of X% coverage of U > U999Cov. of NEland also indicate higher windstorm probability from the WRF-ERAI simulation than in the WRF-ESMa simulations (Figure 5h). If 10% and 15% coverage of NEland with U > U999 are used to identify windstorms, WRF-ERAI produces two or one windstorms per year, respectively. Equivalent values for the historical simulations nested within the ESM are all smaller, indicating they generate fewer windstorms of a given spatial extent. The values are 1.8 (U > U999Cov. > 0.1) and 0.68 (U > U999Cov. > 0.15) for WRF-GFDLa, 1.8 and 0.79 for WRF-HadGEMa and 1.9 and 0.70 for WRF-MPIa (Figure 5h). The implication is that for all plausible thresholds of areal extent (U > U999Cov.) used to define ‘significant’ NE windstorms, windstorms are more probable in the WRF-ERAI simulations than in the ESM-nested simulations. This is consistent with findings based on the selection of windstorms of equal number to the simulation duration.
Consistent with past research using ERA5 output [4], all simulations of the historical period indicate only weak serial clustering of NE windstorms. The highest dispersion indices (largest temporal clustering) are found for WRF-ERAI (0.606) and WRF-GFDLa (0.454). Both the WRF-HadGEMa and WRF-MPIa simulations generate dispersion indices that are close to zero. Also consistent with past research [77] and WRF-ERAI, all three ESM simulations of the historical period identified NE windstorms that occur predominantly between September and April. However, one NE windstorm identified in WRF-HadGEMa occurred in May, and WRF-MPIa also included windstorms in May and June.

3.3. Windstorm Projections

Region-wide mean annual U999 from all NEland from the WRF-ESMa,b simulations do not exhibit statistically significant secular trends (Figure 4k). Nevertheless, the NA-CORDEX simulations exhibit some evidence for evolving wind climates over North America. For example, U999 is higher by at least 2.5% in the last 30 years of WRF-GFDLb than WRF-GFDLa over much of Canada (Figure 1b). Projections from all three model chains also indicate some areas over NEland with increased U999 (WRF-ESMa vs. WRF-ESMb, Figure 4h–j). Comparison of WRF-HadGEM2a with WRF-HadGEM2b indicates U999 in the future (2045–2099) is higher by >2.5% than the historical value over 34% of NEland. This is true for 33% of NEland in WRF-MPI and 7% for WRF-GFDL. Conversely, U999 is >2.5% lower in the future for 0.2% (WRF-MPI) to 14% (WRF-GFDL) of NEland. Thus, where present, the differences in U999 over NEland tend to be positive, indicating higher values in the future. However, time series of regional average U999 do not indicate the presence of monotonic trends from any of the simulations, but there is low-frequency variability (Figure 4k,l), consistent with internal climate forcing [78,79]. A 50-year return period of wind speeds for NEland computed using sliding 20-year data periods (URP,50,i) range from 26 to 38 ms−1, with the lowest values from WRF-ERAI, and highest values from WRF-MPI (Figure 4l). The variability of URP,50,i is also highest in the output from WRF-MPIa,b. Further, the highest URP,50,i estimates for the future were derived from WRF-MPIb (Figure 4l), but this metric does not exhibit significant trends in any of the simulations.
According to a K-S test, the maximum wind speed (Umax) during NE windstorms is significantly higher in WRF-MPIb vs. WRF-MPIa (at p = 0.04), indicating higher windstorm intensity in the future. No significant differences were found for the other two model chains. The samples of windstorm spatial scale from the historical and future periods are not different in WRF-GFDLa vs. WRF-GFDLb, or WRF-HadGEMa vs. WRF-HadGEMb. However, the cumulative probability distributions from WRF-MPIa and WRF-MPIb do differ based on a K-S test (p < 0.01). The sample from WRF-MPIb exhibits evidence for larger spatial coverage in the smallest 80% of the spatial extents than WRF-MPIa, but smaller spatial coverage for the largest windstorms.
As described above, for most analyses presented herein, the number of windstorms selected from each simulation is equal to the number of years in that simulation. To examine whether differences in the annual frequency of windstorms from the different simulations are robust to the precise definition of a windstorm, the mean number of windstorms per year from WRF-ESMb is compared with values from WRF-ESMa for U > U999Cov. of 0.05 to 0.25. The results (Figure 6) indicate that for virtually all windstorm spatial extents (i.e., U > U999Cov.) considered, the annual frequency of windstorms is higher from WRF-MPIb than WRF-MPIa. Indeed, only use of a U > U999Cov. threshold of 0.05 yields a lower probability of occurrence in WRF-MPIb. For example, a requirement that more than 10% of NEland grid cells simultaneously exhibit U > U999 produces a mean decadal frequency of occurrence of 18.9 in WRF-MPIa and 20.9 in WRF-MPIb. That is, in an average decade, two additional windstorms are projected in the future period than occurred in the past. Conversely, for different coverage thresholds, differences in the annual frequency of occurrence of windstorms from WRF-GFDLa,b and WRF-HadGEMa,b exhibit both positive and negative signs (Figure 6).
Accumulated Cyclone Energy (ACE) values (Equation (4)) exhibit high inter-annual variability but, like URP,50, at the decadal scale, ACE is lowest in WRF-ERAI (Figure 7). Consistent with information given above regarding the high frequency of Umax > 22.5 ms−1 output from WRF simulations nested within GFDL, WRF-GFDLa,b exhibit the highest ACE over NEland (Figure 7e). Indeed, annual ACE > 1.75 × 10⁵ kts2 is twice as frequent in WRF-GFDLa,b than any other simulation. These findings for WRF-GFDLa,b are consistent with the relatively high proportion of NEland windstorms that derive from transitioning tropical cyclones (see Figure 7 and discussion below) [23]. However, the proportion of future windstorms with Umax > 22.5 ms−1 decreases from 68% in WRF-GFDLa to 50% in WRF-GFDLb. Conversely, both WRF-HadGEMb and WRF-MPIb exhibit a higher frequency of occurrence (47% and 50%) of Umax > 22.5 ms−1 than are present in the paired historical simulations (41%).
Median windstorm loss indices for the last 30 years of the future simulations are approximately double those from the last 30 years of the paired historical simulation (Figure 7) in WRF-GFDLb vs. WRF-GFDLa and WRF-HadGEMb vs. HadGEMa, consistent with the projected doubling of the population (Figure 4m,n). However, the ratio of median LI from a WRF-GFDLb/WRF-GFDLa of 1.85 is lower than would be expected from a doubling of the population, (i.e., a ratio of 2). The implication of the analyses presented above is that the WRF-MPI model chain (WRF-MPI) indicates larger and more powerful windstorms in the future than in the paired historical simulation and, further, that the frequency of windstorms of any coverage thresholds (spatial extent) are higher in the future than the historical simulation (Figure 6). Accordingly, LI from WRF-MPIb are over three-times those from WRF-MPIa (Figure 7k) due to a combination of higher population in NEland and increased windstorm spatial scale and maximum wind speeds, plus a slightly higher prevalence of windstorms over high-population-density parts of the NE.

3.4. Cyclone Types Responsible for Windstorm

The distribution of windstorms by cyclone type from the ESM-nested historical simulations (Table 1) all differ significantly (p = 0.05) from those in WRF-ERAI according to a χ2 test. Although, the χ2 test value is smallest in the comparison of WRF-ERAI and WRF-MPIa indicating the best agreement. While extratropical cyclones are the dominant cause of NE windstorms in WRF-ERAI (Figure 7b) and only 16% of NE windstorms are associated with transitioning tropical cyclones (TCs) in this simulation, nearly half of windstorms from WRF-GFDLa derive from transitioning TCs. Transitioning TCs are the root cause of almost one-third of windstorms in WRF-HadGEMa but represent <20% of NE windstorms in WRF-MPIa. All ESMa-nested simulations exhibit an under-representation of Colorado Lows relative to WRF-ERAI, and WRF-HadGEMa (and b) indicate fewer NE windstorms derive from Alberta Clippers than are manifested in WRF-ERAI.
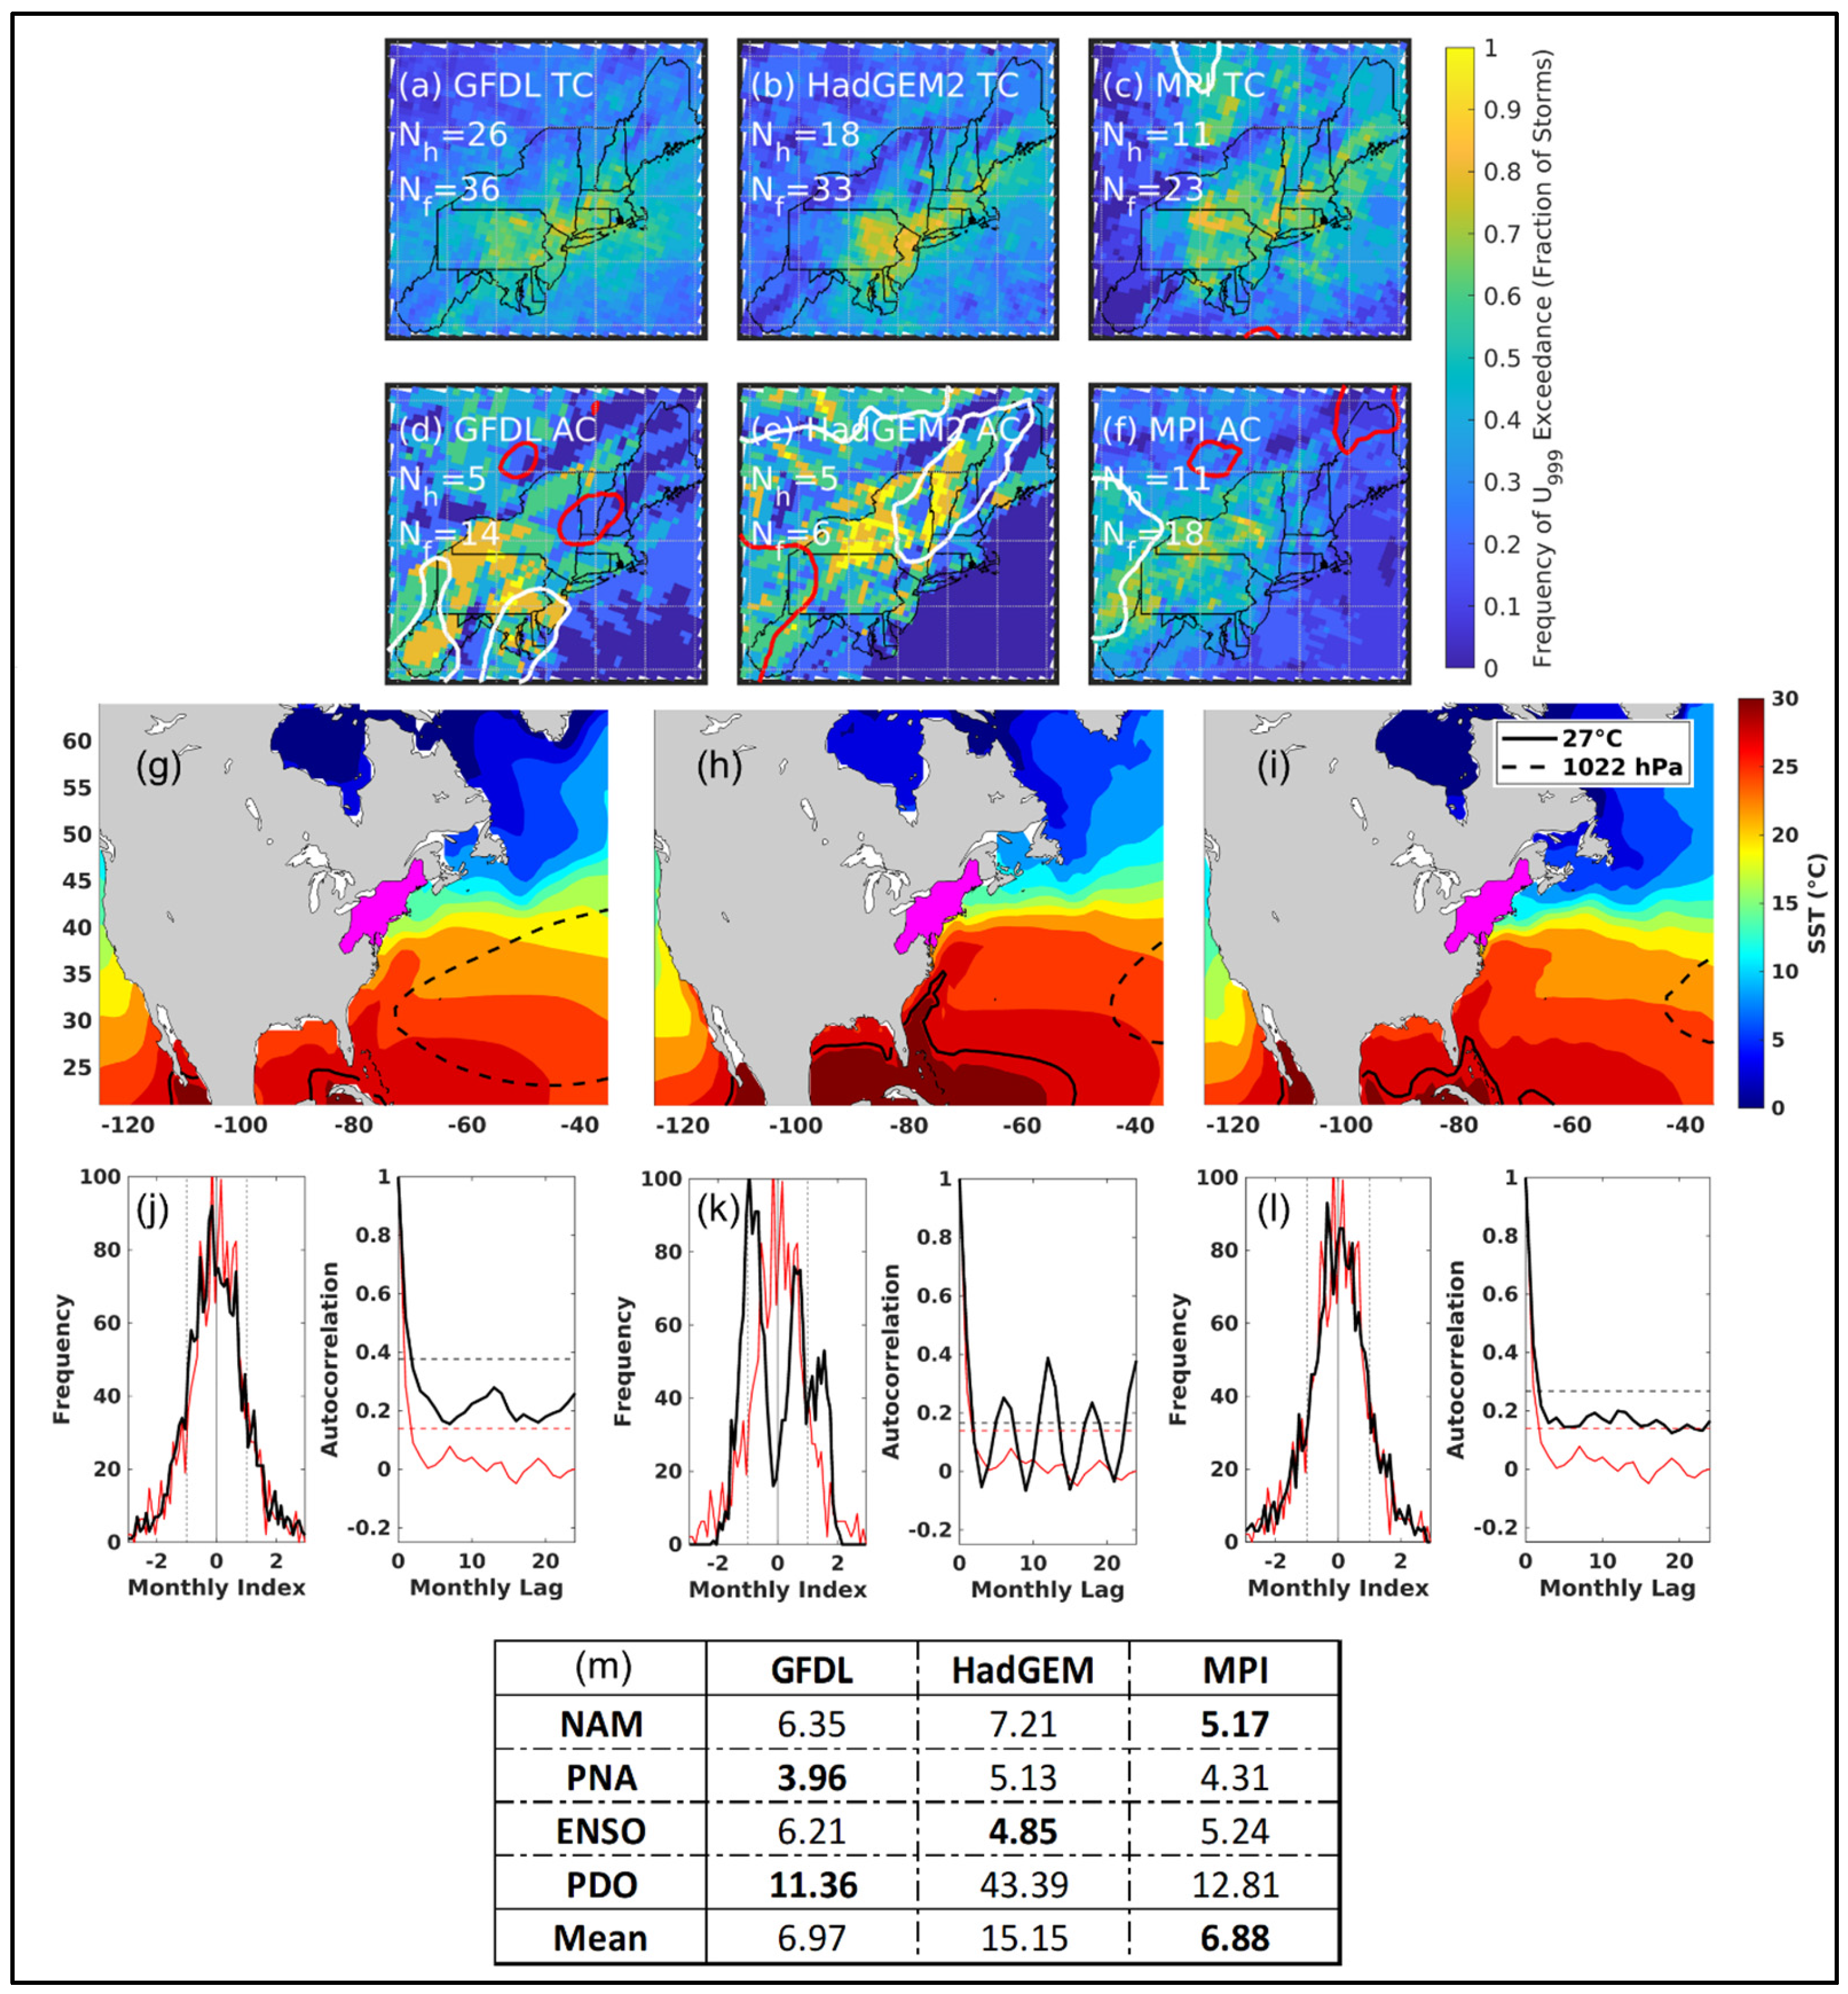
The distribution of cyclone types responsible for windstorms in the WRF-ESMa and WRF-ESMb simulations differ significantly (p = 0.05) only for WRF-MPIa vs. WRF-MPIb, due in large part to the increased role of transitioning TCs and CLs in the future at the expense of ECs and Other (Table 1 and Figure 7). This tendency is important due to the higher intensity of transitioning TCs than ETCs and that their tracks tend to produce high wind speeds over the densely populated coastal NE urban corridor (Figure 4m). However, the cyclone types responsible for NE windstorms exhibit large decade-to-decade variability and the decadal frequencies of different cyclone types do not indicate statistically significant secular trends. Further, no NEland grid cells show a substantially higher/lower probability of U > U999 from transitioning TCs in WRF-ESMb simulations (Figure 8a–c). There is some evidence of a change in the tracks followed by ACs in the WRF-HadGEMb relative to WRF-HadGEMa, resulting in a reduction of up to 25 percentage points in the likelihood of U > U999 over northern parts of the NE (Figure 8e) but the small sample sizes indicate that extreme caution should be used in interpreting this finding.
Changes in the translational speed of cyclones are both a symptom of global climate changes and a potential driver of changed societal impacts from intense cyclones [80]. Although the time-resolution of the NA-CORDEX output precludes firm assertions regarding this matter, the average speed of cyclones responsible for NE windstorms is lower in WRF-GFDLb than WRF-GFDLa but higher in WRF-MPIb than WRF-MPIa possibly due to changes in the parent cyclones described above.

3.5. Diagnosing Causes of the Different Windstorm Projections

Cyclone frequencies and tracking, and by association, the resulting windstorm frequencies and characteristics, are dictated in part by the phase and magnitude of internal climate modes [14]. Thus, three hypotheses are tested to explain differences in cyclones responsible for NE windstorms in the ESM-nested WRF simulations:
Hypothesis 1:
The high proportion of NE windstorms associated with transiting tropical cyclones (TCs) in WRF-GFDLa,b (Table 1 and Figure 7) is due to higher sea surface temperatures (SSTs) and/or steering from the Atlantic basin sub-tropical high (STH) [81] in the parent ESM.
Hypothesis 2:
The relative lack of windstorms from Alberta Clippers (ACs) in WRF-HadGEMa,b (Table 1) is due to differences in the representation of the Northern Annular Mode (NAM) and resulting errors in the upper-level steering flow and under-representation of AC-associated NE windstorms.
Hypothesis 3:
The relatively high skill of WRF-MPIa in reproducing the proportions of windstorms from different cyclone types (Table 1) is due to the high fidelity in reproducing NAM, the Pacific–North American (PNA) pattern, El Niño–Southern Oscillation (ENSO) and the Pacific Decadal Oscillation (PDO). To evaluate this hypothesis, indices of the internal climate modes were calculated following Coburn and Pryor [82].
In contrast to Hypothesis 1, mean SSTs over the Tropical Atlantic (9–30° N, 60–100° W) and Tropical Pacific (9–30° N, 100–126° W) and the positions of the 27 °C SST isotherm from the ESMs are not statistically different from ERA-I according to a Student’s t-test (Figure 8g–i). However, the intensity of the STH as measured by gradients in the mean SLP and the spatial extent of mean SLP above 1022 hPa (Figure 8g–i) is stronger and extends further westward in GFDL than in HadGEM or MPI by ~30° longitude (3000 km). This is consistent with the thesis that displacement of the STH yields large-scale flow patterns that enhance the probability of transitioning TC tracking into the NE.
Consistent with Hypothesis 2, the probability distribution and temporal autocorrelation of monthly indices of the Northern Annular Mode (NAM) from HadGEM exhibit highest mean absolute error (MAE) (lowest skill) and poorest representation of the temporal autocorrelation relative to values from ERA-Interim (Figure 8j–l).
Consistent with Hypothesis 3, MPI exhibits lowest mean absolute error (MAE) relative to ERA-Interim in reproducing the probability distributions of the indices of these four internal climate modes.

4. Discussion and Conclusions

Windstorms are a major hazard in many parts of the world including the Northeastern US (NE). Projected population increases in this densely populated part of the country mean there is an urgent need to quantify possible future risk. However, there are multiple drivers of possible changes in windstorm characteristics, including thermodynamic feedbacks [13], changing land use land cover [14] and changes in large-scale flow patterns due to internal and external forcing. Here, we focus on the last of these drivers. We present analyses of simulations performed with WRF nested in ERA-Interim (WRF-ERAI) and three independent Earth System Models (ESM; GFDL-ESM2M, HadGEM2-ES and MPI-ESM-LR) for a historical period of 1950–2005 (WRF-ESMa) and a future period of 2006–2099 (WRF-ESMb). These analyses are designed to quantify possible future changes in windstorm characteristics, sources and consequences. The results of analyses presented herein suggest:
  • WRF-MPIa shows closest agreement with WRF-ERAI in terms of the representation of cyclone types responsible for windstorms in the NE and some windstorm characteristics. This realization of MPI also shows better agreement with ERA-Interim in terms of the representation of internal climate modes. This suggests that this model chain (WRF-MPI) has equal or better credibility than the other model chains. Conversely, simulations within lateral boundary conditions from GFDL indicate a smaller spatial scale of NE windstorms than those from WRF-ERAI. Analyses of output from WRF-GFDLa further indicate that much higher frequency of NE windstorms are associated with transitioning tropical cyclones leading to much higher values of accumulated kinetic energy within the windstorms and substantially smaller windstorm spatial scale.
  • The spatial scale and frequency of the largest windstorms in each simulation defined using the greatest spatial extent of exceedance of local 99.9th percentile wind speeds (U > U999) plus long-period extreme wind speeds (U50,RP) do not exhibit secular trends. However, comparison of WRF-MPIb (future) simulation output and WRF-MPIa (historical) yields evidence for future increases in both the frequency of U > U999 over a substantial fraction of NEland and maximum wind speeds (Umax) > 22.5 ms−1. The future simulation within MPI also indicates a higher frequency of windstorms of all spatial extents than are present in the historical period. These projected changes in windstorm intensity and spatial scale lead to large magnitude increases in projected median loss indices (LIs) and hence inferred economic damage from future windstorms that are compounded by projected population increase. Statistically significant changes in projected windstorm intensity/scale are not found for WRF simulations within GFDL or HadGEM.
  • Statistically significant monotonic trends are generally not evident in the cyclone types responsible for NE windstorms. However, consistent with previous analyses of independent WRF simulations nested within MPI [13], there is some evidence for an increasing role for transitioning tropical cyclones in the future based on the WRF-MPI simulation.
The divergence in windstorm projections from WRF simulations within independent ESMs strongly argues for further research to quantify different model combinations in terms of their ability to represent windstorms, and to better diagnose causes of divergence in future projections. However, given the good agreement with windstorm and parent cyclone characteristics from WRF-ERAI, the large projected increases in windstorm intensity and property damage (LI) projected in WRF-MPI simulations should be considered credible and if realized suggest substantial enhancement of windstorm-related climate risks over a highly populated region of the USA.
There are several caveats that should be applied to findings presented herein and that will be addressed in future work. Firstly, this research considers only a single realization from each ESM. Expansion of the regional simulation suite to include other members will allow more detailed exploration of the role of internal climate variability [14]. Second, only a single climate forcing scenario is considered. While the expectation is that this higher forcing is generally associated with most profound atmospheric change, consideration of other possible future pathways would be useful in examining scaling of this hazard [14,83]. Third, there is clear evidence that the CMIP6 generation of ESM exhibits superior performance to CMIP5 in terms of the representation of extratropical and tropical cyclones [84,85]. This should confer higher fidelity to regional simulations designed to examine possible changes in windstorms. Fourth, the grid spacing used within the simulations naturally precludes full representation of all windstorm dynamics [86,87] and the addition of further downscaling at smaller dx may yield additional important insights into localized risk [88]. Previous analyses have suggested the LBC are the largest source of wind climate projection spread [89] and WRF is widely used within dynamical downscaling contexts [28,29]. Nevertheless, given documented dependencies of near-surface wind characteristics on model physics options [13], analyses of simulations performed with other regional models and/or other WRF simulations may yield important insights into the range of possible windstorm futures. The conclusions presented here should be re-examined using simulations at higher resolution and with static and evolving LULC over the NA-CORDEX domain that are now becoming available for regional climate models nested within the CMIP6 generation of ESM.

Author Contributions

Conceptualization, S.C.P.; methodology, S.C.P., J.J.C., F.W.L., X.Z., M.S.B. and R.J.B.; software, S.C.P., J.J.C., F.W.L., X.Z., M.S.B. and R.J.B.; validation, S.C.P. and F.W.L.; formal analysis, S.C.P., J.J.C. and F.W.L.; investigation, S.C.P., J.J.C., F.W.L., X.Z., M.S.B. and R.J.B.; resources, S.C.P., R.J.B. and M.S.B.; data curation, M.S.B., J.J.C. and F.W.L.; writing—original draft preparation, S.C.P. and F.W.L.; writing—review and editing, S.C.P., J.J.C., F.W.L., X.Z., M.S.B. and R.J.B.; visualization, S.C.P., F.W.L. and J.J.C.; supervision, S.C.P.; project administration, S.C.P.; funding acquisition, S.C.P., R.J.B. and M.S.B. All authors have read and agreed to the published version of the manuscript.

Funding

This research was funded by the U.S. Department of Energy (DE-SC0016605). Computational resources used in these analyses are provided by the NSF Extreme Science and Engineering Discovery Environment (XSEDE2) (award TG-ATM170024).

Data Availability Statement

The 10 m height a.g.l. anemometer observations from National Weather Service Automated Surface Observation System network (ASOS) are available at https://www.ncei.noaa.gov/products/land-based-station/automated-surface-weather-observing-systems accessed on 11 May 2025. The National Oceanic and Atmospheric Administration (NOAA) database of historically important Atlantic basin hurricanes is available at https://www.nhc.noaa.gov/outreach/history/ accessed on 11 May 2025. The NA-CORDEX WRF simulation outputs are available from Mearns, L.O., et al., 2017 [90]: the NA-CORDEX dataset, version 1.0. NCAR Climate Data Gateway, Boulder CO, https://doi.org/10.5065/D6SJ1JCH. In order to acquire the specific data used in this work, follow the “NA-CORDEX search page” link (to https://www.earthsystemgrid.org/search/cordexsearch.html accessed on 11 May 2025) and check the following boxes, Model: WRF, Frequency: 3 h and Grid: NAM-22, before clicking the “Search” button.

Conflicts of Interest

The authors declare no conflicts of interest.

References

  1. Hirsch, M.E.; DeGaetano, A.T.; Colucci, S.J. An East Coast winter storm climatology. J. Clim. 2001, 14, 882–899. [Google Scholar] [CrossRef]
  2. Changnon, S.A. Temporal and spatial distributions of wind storm damages in the United States. Clim. Chang. 2009, 94, 473–482. [Google Scholar] [CrossRef]
  3. Lukens, K.E.; Berbery, E.H.; Hodges, K.I. The imprint of strong-storm tracks on winter weather in North America. J. Clim. 2018, 31, 2057–2074. [Google Scholar] [CrossRef]
  4. Letson, F.W.; Barthelmie, R.J.; Hodges, K.I.; Pryor, S.C. Intense windstorms in the northeastern United States. Nat. Hazards Earth Syst. Sci. 2021, 21, 2001–2020. [Google Scholar] [CrossRef]
  5. Hadavi, M.; Sun, L.; Romanic, D. Normalized insured losses caused by windstorms in Quebec and Ontario, Canada, in the period 2008–2021. Int. J. Disaster Risk Reduct. 2022, 80, 103222. [Google Scholar] [CrossRef]
  6. Little, A.S.; Priestley, M.D.; Catto, J.L. Future increased risk from extratropical windstorms in northern Europe. Nat. Commun. 2023, 14, 4434. [Google Scholar] [CrossRef] [PubMed]
  7. Laurila, T.K.; Gregow, H.; Cornér, J.; Sinclair, V.A. Characteristics of extratropical cyclones and precursors to windstorms in northern Europe. Weather Clim. Dyn. 2021, 2, 1111–1130. [Google Scholar] [CrossRef]
  8. Nilsson, C.; Goyette, S.; Barring, L. Relating forest damage data to the wind field from high-resolution RCM simulations: Case study of Anatol striking Sweden in December 1999. Glob. Planet. Chang. 2007, 57, 161–176. [Google Scholar] [CrossRef]
  9. Coburn, J.; Arnheim, J.; Pryor, S.C. Short-Term Forecasting of Wind Gusts at Airports Across CONUS Using Machine Learning. Earth Space Sci. 2022, 9, e2022EA002486. [Google Scholar] [CrossRef]
  10. Sparks, P.R. Wind speeds in tropical cyclones and associated insurance losses. J. Wind Eng. Ind. Aerodyn. 2003, 91, 1731–1751. [Google Scholar] [CrossRef]
  11. Chen, X.; Leung, L.R.; Gao, Y.; Liu, Y.; Wigmosta, M. Sharpening of cold-season storms over the western United States. Nat. Clim. Chang. 2023, 13, 167–173. [Google Scholar] [CrossRef]
  12. Seiler, C.; Zwiers, F.W. How will climate change affect explosive cyclones in the extratropics of the Northern Hemisphere? Clim. Dyn. 2016, 46, 3633–3644. [Google Scholar] [CrossRef]
  13. Zhou, X.; Barthelmie, R.J.; Letson, F.; Coburn, J.J.; Pryor, S.C. Extreme windstorms in the Northeastern USA in the contemporary and future climate. Clim. Dyn. 2024, 62, 2107–2128. [Google Scholar] [CrossRef]
  14. Coburn, J.J.; Barthelmie, R.J.; Pryor, S.C. Changing Windstorm Characteristics over the US Northeast in a Single Model Large Ensemble. Environ. Res. Lett. 2024, 19, 114045. [Google Scholar] [CrossRef]
  15. Raible, C.C.; Pinto, J.G.; Ludwig, P.; Messmer, M. A review of past changes in extratropical cyclones in the northern hemisphere and what can be learned for the future. Wiley Interdiscip. Rev. Clim. Chang. 2021, 12, e680. [Google Scholar] [CrossRef]
  16. Studholme, J.; Fedorov, A.V.; Gulev, S.K.; Emanuel, K.; Hodges, K. Poleward expansion of tropical cyclone latitudes in warming climates. Nat. Geosci. 2022, 15, 14–28. [Google Scholar] [CrossRef]
  17. Varino, F.; Arbogast, P.; Joly, B.; Riviere, G.; Fandeur, M.-L.; Bovy, H.; Granier, J.-B. Northern Hemisphere extratropical winter cyclones variability over the 20th century derived from ERA-20C reanalysis. Clim. Dyn. 2019, 52, 1027–1048. [Google Scholar] [CrossRef]
  18. Vose, R.S.; Applequist, S.; Bourassa, M.A.; Pryor, S.C.; Barthelmie, R.J.; Blanton, B.; Bromirski, P.D.; Brooks, H.E.; DeGaetano, A.T.; Dole, R.M. Monitoring and understanding changes in extremes: Extratropical storms, winds, and waves. Bull. Am. Meteorol. Soc. 2014, 95, 377–386. [Google Scholar] [CrossRef]
  19. Colle, B.A.; Booth, J.F.; Chang, E.K. A review of historical and future changes of extratropical cyclones and associated impacts along the US East Coast. Curr. Clim. Chang. Rep. 2015, 1, 125–143. [Google Scholar] [CrossRef]
  20. Chang, E.K.; Guo, Y.; Xia, X. CMIP5 multimodel ensemble projection of storm track change under global warming. J. Geophys. Res. Atmos. 2012, 117, D23118. [Google Scholar] [CrossRef]
  21. Harvey, B.; Shaffrey, L.; Woollings, T. Equator-to-pole temperature differences and the extra-tropical storm track responses of the CMIP5 climate models. Clim. Dyn. 2014, 43, 1171–1182. [Google Scholar] [CrossRef]
  22. Sheffield, J.; Barrett, A.P.; Colle, B.; Nelun Fernando, D.; Fu, R.; Geil, K.L.; Hu, Q.; Kinter, J.; Kumar, S.; Langenbrunner, B. North American climate in CMIP5 experiments. Part I: Evaluation of historical simulations of continental and regional climatology. J. Clim. 2013, 26, 9209–9245. [Google Scholar] [CrossRef]
  23. Sainsbury, E.M.; Schiemann, R.K.; Hodges, K.I.; Shaffrey, L.C.; Baker, A.J.; Bhatia, K.T. How Important are Post-Tropical Cyclones for European Windstorm Risk? Geophys. Res. Lett. 2020, 47, e2020GL089853. [Google Scholar] [CrossRef]
  24. Garner, A.J.; Kopp, R.E.; Horton, B.P. Evolving tropical cyclone tracks in the North Atlantic in a warming climate. Earth’s Future 2021, 9, e2021EF002326. [Google Scholar] [CrossRef]
  25. Colbert, A.J.; Soden, B.J.; Vecchi, G.A.; Kirtman, B.P. The impact of anthropogenic climate change on North Atlantic tropical cyclone tracks. J. Clim. 2013, 26, 4088–4095. [Google Scholar] [CrossRef]
  26. Shu, E.G.; Pope, M.; Wilson, B.; Bauer, M.; Amodeo, M.; Freeman, N.; Porter, J.R. Assessing Property Exposure to Cyclonic Winds under Climate Change. Climate 2023, 11, 217. [Google Scholar] [CrossRef]
  27. Pryor, S.C.; Barthelmie, R.J.; Schoof, J.T. Past and future wind climates over the contiguous USA based on the NARCCAP model suite. J. Geophys. Res. 2012, 117. [Google Scholar] [CrossRef]
  28. Giorgi, F.; Gutowski, W.J., Jr. Regional dynamical downscaling and the CORDEX initiative. Annu. Rev. Environ. Resour. 2015, 40, 467–490. [Google Scholar] [CrossRef]
  29. Gutowski, W.J., Jr.; Giorgi, F.; Timbal, B.; Frigon, A.; Jacob, D.; Kang, H.S.; Raghavan, K.; Lee, B.; Lennard, C.; Nikulin, G.; et al. WCRP COordinated Regional Downscaling EXperiment (CORDEX): A diagnostic MIP for CMIP6. Geosci. Model Dev. 2016, 9, 4087–4095. [Google Scholar] [CrossRef]
  30. Sørland, S.L.; Brogli, R.; Pothapakula, P.K.; Russo, E.; Van de Walle, J.; Ahrens, B.; Anders, I.; Bucchignani, E.; Davin, E.L.; Demory, M.-E. COSMO-CLM regional climate simulations in the Coordinated Regional Climate Downscaling Experiment (CORDEX) framework: A review. Geosci. Model Dev. 2021, 14, 5125–5154. [Google Scholar] [CrossRef]
  31. Prein, A.F.; Bukovsky, M.S.; Mearns, L.O.; Bruyère, C.L.; Done, J.M. Simulating North American weather types with regional climate models. Front. Environ. Sci. 2019, 7, 36. [Google Scholar] [CrossRef]
  32. Diez-Sierra, J.; Iturbide, M.; Gutiérrez, J.M.; Fernández, J.; Milovac, J.; Cofiño, A.S.; Cimadevilla, E.; Nikulin, G.; Levavasseur, G.; Kjellström, E. The worldwide C3S CORDEX grand ensemble: A major contribution to assess regional climate change in the IPCC AR6 Atlas. Bull. Am. Meteorol. Soc. 2022, 103, E2804–E2826. [Google Scholar] [CrossRef]
  33. Reidmiller, D.R. Impacts, Risks, and Adaptation in the United States: Fourth National Climate Assessment; USGCRP: Washington, DC, USA, 2018; Volume II.
  34. Hodges, K.I.; Lee, R.W.; Bengtsson, L. A Comparison of Extratropical Cyclones in Recent Reanalyses ERA-Interim, NASA MERRA, NCEP CFSR, and JRA-25. J. Clim. 2011, 24, 4888–4906. [Google Scholar] [CrossRef]
  35. Pryor, S.C.; Barthelmie, R.J. A global assessment of extreme wind speeds for wind energy applications. Nat. Energy 2021, 6, 268–276. [Google Scholar] [CrossRef]
  36. Simmons, A.; Uppala, S.; Dee, D.; Kobayashi, S. ERA-Interim: New ECMWF reanalysis products from 1989 onwards. ECMWF Newsl. 2007, 110, 25–35. [Google Scholar]
  37. Dunne, J.P.; John, J.G.; Adcroft, A.J.; Griffies, S.M.; Hallberg, R.W.; Shevliakova, E.; Stouffer, R.J.; Cooke, W.; Dunne, K.A.; Harrison, M.J. GFDL’s ESM2 global coupled climate–carbon earth system models. Part I: Physical formulation and baseline simulation characteristics. J. Clim. 2012, 25, 6646–6665. [Google Scholar] [CrossRef]
  38. Jones, C.; Hughes, J.; Bellouin, N.; Hardiman, S.; Jones, G.; Knight, J.; Liddicoat, S.; O’connor, F.; Andres, R.J.; Bell, C. The HadGEM2-ES implementation of CMIP5 centennial simulations. Geosci. Model Dev. 2011, 4, 543–570. [Google Scholar] [CrossRef]
  39. Giorgetta, M.A.; Jungclaus, J.; Reick, C.H.; Legutke, S.; Bader, J.; Böttinger, M.; Brovkin, V.; Crueger, T.; Esch, M.; Fieg, K. Climate and carbon cycle changes from 1850 to 2100 in MPI-ESM simulations for the Coupled Model Intercomparison Project phase 5. J. Adv. Model. Earth Syst. 2013, 5, 572–597. [Google Scholar] [CrossRef]
  40. Flato, G.; Marotzke, J.; Abiodun, B.; Braconnot, P.; Chou, S.C.; Collins, W.; Cox, P.; Driouech, F.; Emori, S.; Eyring, V. Evaluation of climate models. In Climate Change 2013: The Physical Science Basis. Contribution of Working Group I to the Fifth Assessment Report of the Intergovernmental Panel on Climate Change; Cambridge University Press: Cambridge, UK, 2014; pp. 741–866. [Google Scholar]
  41. Brunner, L.; Pendergrass, A.G.; Lehner, F.; Merrifield, A.L.; Lorenz, R.; Knutti, R. Reduced global warming from CMIP6 projections when weighting models by performance and independence. Earth Syst. Dyn. 2020, 11, 995–1012. [Google Scholar] [CrossRef]
  42. Eyring, V.; Cox, P.M.; Flato, G.M.; Gleckler, P.J.; Abramowitz, G.; Caldwell, P.; Collins, W.D.; Gier, B.K.; Hall, A.D.; Hoffman, F.M. Taking climate model evaluation to the next level. Nat. Clim. Chang. 2019, 9, 102–110. [Google Scholar] [CrossRef]
  43. Bukovsky, M.S.; Mearns, L.O. Regional climate change projections from NA-CORDEX and their relation to climate sensitivity. Clim. Change 2020, 162, 645–665. [Google Scholar] [CrossRef]
  44. Dong, Y.; Armour, K.C.; Zelinka, M.D.; Proistosescu, C.; Battisti, D.S.; Zhou, C.; Andrews, T. Intermodel spread in the pattern effect and its contribution to climate sensitivity in CMIP5 and CMIP6 models. J. Clim. 2020, 33, 7755–7775. [Google Scholar] [CrossRef]
  45. Colle, B.A.; Zhang, Z.; Lombardo, K.A.; Chang, E.; Liu, P.; Zhang, M. Historical evaluation and future prediction of eastern North American and western Atlantic extratropical cyclones in the CMIP5 models during the cool season. J. Clim. 2013, 26, 6882–6903. [Google Scholar] [CrossRef]
  46. Collier, C.; Dixon, J.; Harrison, M.; Hunt, J.; Mitchell, J.; Richardson, D. Extreme surface winds in mid-latitude storms: Forecasting and changes in climatology. J. Wind Eng. Ind. Aerodyn. 1994, 52, 1–27. [Google Scholar] [CrossRef]
  47. Smart, D.; Browning, K. Attribution of strong winds to a cold conveyor belt and sting jet. Q. J. R. Meteorol. Soc. 2014, 140, 595–610. [Google Scholar] [CrossRef]
  48. Trzeciak, T.M.; Knippertz, P.; Pirret, J.S.R.; Williams, K.D. Can we trust climate models to realistically represent severe European windstorms? Clim. Dyn. 2016, 46, 3431–3451. [Google Scholar] [CrossRef]
  49. Donat, M.; Leckebusch, G.; Wild, S.; Ulbrich, U. Future changes in European winter storm losses and extreme wind speeds inferred from GCM and RCM multi-model simulations. Nat. Hazards Earth Syst. Sci. 2011, 11, 1351–1370. [Google Scholar] [CrossRef]
  50. Forrester, F.H. How strong is the wind? The origin of the Beaufort Scale. Weatherwise 1986, 39, 147–151. [Google Scholar] [CrossRef]
  51. Klawa, M.; Ulbrich, U. A model for the estimation of storm losses and the identification of severe winter storms in Germany. Nat. Hazards Earth Syst. Sci. 2003, 3, 725–732. [Google Scholar] [CrossRef]
  52. Pinto, J.G.; Karremann, M.K.; Born, K.; Della-Marta, P.M.; Klawa, M. Loss potentials associated with European windstorms under future climate conditions. Clim. Res. 2012, 54, 1–20. [Google Scholar] [CrossRef]
  53. Priestley, M.D.; Dacre, H.F.; Shaffrey, L.C.; Hodges, K.I.; Pinto, J.G. The role of serial European windstorm clustering for extreme seasonal losses as determined from multi-centennial simulations of high-resolution global climate model data. Nat. Hazards Earth Syst. Sci. 2018, 18, 2991–3006. [Google Scholar] [CrossRef]
  54. Moemken, J.; Messori, G.; Pinto, J.G. Windstorm losses in Europe–What to gain from damage datasets. Weather Clim. Extrem. 2024, 44, 100661. [Google Scholar] [CrossRef]
  55. Moemken, J.; Alifdini, I.; Ramos, A.M.; Georgiadis, A.; Brocklehurst, A.; Braun, L.; Pinto, J.G. Insurance loss model vs meteorological loss index–How comparable are their loss estimates for European windstorms? Nat. Hazards Earth Syst. Sci. Discuss. 2024, 2024, 1–19. [Google Scholar] [CrossRef]
  56. Aznar-Siguan, G.; Bresch, D.N. CLIMADA v1: A global weather and climate risk assessment platform. Geosci. Model Dev. 2019, 12, 3085–3097. [Google Scholar] [CrossRef]
  57. Gao, J.; Pesaresi, M. Downscaling SSP-consistent global spatial urban land projections from 1/8-degree to 1-km resolution 2000–2100. Sci. Data 2021, 8, 281. [Google Scholar] [CrossRef]
  58. Wilks, D.S. Statistical Methods in the Atmospheric Sciences, 4th ed.; Elsevier: Amsterdam, The Netherlands, 2020; p. 840. [Google Scholar]
  59. Mailier, P.J.; Stephenson, D.B.; Ferro, C.A.; Hodges, K.I. Serial clustering of extratropical cyclones. Mon. Weather Rev. 2006, 134, 2224–2240. [Google Scholar] [CrossRef]
  60. Vitolo, R.; Stephenson, D.B.; Cook, I.M.; Mitchell-Wallace, K. Serial clustering of intense European storms. Meteorol. Z. 2009, 18, 411–424. [Google Scholar] [CrossRef]
  61. Palutikof, J.P.; Brabson, B.B.; Lister, D.H.; Adcock, S.T. A review of methods to calculate extreme wind speeds. Meteorol. Appl. 1999, 6, 119–132. [Google Scholar] [CrossRef]
  62. Maue, R.N. Recent historically low global tropical cyclone activity. Geophys. Res. Lett. 2011, 38. [Google Scholar] [CrossRef]
  63. Hoskins, B.J.; Hodges, K.I. New perspectives on the Northern Hemisphere winter storm tracks. J. Atmos. Sci. 2002, 59, 1041–1061. [Google Scholar] [CrossRef]
  64. Fritzen, R.; Lang, V.; Gensini, V.A. Trends and variability of North American cool-season extratropical cyclones: 1979–2019. J. Appl. Meteorol. Climatol. 2021, 60, 1319–1331. [Google Scholar] [CrossRef]
  65. Klotzbach, P.J.; Oliver, E.C.; Leeper, R.D.; Schreck, C.J. The relationship between the Madden–Julian oscillation (MJO) and southeastern New England snowfall. Mon. Weather Rev. 2016, 144, 1355–1362. [Google Scholar] [CrossRef]
  66. Cook, N.J. Locating the anemometers of the US ASOS network and classifying their local shelter. Weather 2022, 77, 256–263. [Google Scholar] [CrossRef]
  67. McNitt, J.A.; Facundo, J. An overview of the Federal Government’s Automated Surface Observing System sustainment activity. In Proceedings of the 13th American Meteorological Society Conference on Integrated Observing and Assimilation Systems for Atmosphere, Oceans, and Land Surface, Pheonix, AZ, USA, 10–11 January 2009. [Google Scholar]
  68. Cook, N.J. Curating the TD6405 database of 1-min interval wind observations across the USA for use in Wind Engineering studies. J. Wind Eng. Ind. Aerodyn. 2022, 224, 104961. [Google Scholar] [CrossRef]
  69. Schmitt, I.V.; Chester, V. A quality control algorithm for the ASOS ice free wind sensor. In Proceedings of the 13th American Meteorological Society Conference on Integrated Observing and Assimilation Systems for Atmosphere, Oceans, and Land Surface, Pheonix, AZ, USA, 10–11 January 2009. [Google Scholar]
  70. Landsea, C.W.; Franklin, J.L. Atlantic hurricane database uncertainty and presentation of a new database format. Mon. Weather Rev. 2013, 141, 3576–3592. [Google Scholar] [CrossRef]
  71. Woods, M.J.; Davy, R.J.; Russell, C.J.; Coppin, P.A. Cross-spectrum of wind speed for meso-gamma scales in the upper surface layer over South-Eastern Australia. Bound.-Layer Meteorol. 2011, 141, 93–116. [Google Scholar] [CrossRef]
  72. Herrmann, M.; Somot, S.; Calmanti, S.; Dubois, C.; Sevault, F. Representation of spatial and temporal variability of daily wind speed and of intense wind events over the Mediterranean Sea using dynamical downscaling: Impact of the regional climate model configuration. Nat. Hazards Earth Syst. Sci. 2011, 11, 1983–2001. [Google Scholar] [CrossRef]
  73. Pryor, S.C.; Coburn, J.; Barthelmie, R.; Shepherd, T. Projecting Future Energy Production from Operating Wind Farms in North America: Part 1: Dynamical Downscaling. J. Appl. Meteorol. Climatol. 2022, 62, 1558–8424. [Google Scholar] [CrossRef]
  74. National Oceanic and Atmospheric Administration. Hurricane Charley, August 9–15, 2004; Department of Commerce, National Atmospheric and Oceanic Administration: Silver Spring, MD, USA, 2004; p. 29. Available online: https://www.weather.gov/media/publications/assessments/Charley06.pdf (accessed on 11 May 2025).
  75. Condon, A.J.; Sheng, Y.P.; Paramygin, V.A. Toward high-resolution, rapid, probabilistic forecasting of the inundation threat from landfalling hurricanes. Mon. Weather Rev. 2013, 141, 1304–1323. [Google Scholar] [CrossRef]
  76. Rendfrey, T.S.; Bukovsky, M.S.; McCrary, R.R.; Fuentes-Franco, R. An assessment of tropical cyclones in North American CORDEX WRF simulations. Weather Clim. Extrem. 2021, 34, 100382. [Google Scholar] [CrossRef]
  77. Chen, T.C.; Di Luca, A.; Winger, K.; Laprise, R.; Thériault, J.M. Seasonality of continental extratropical-cyclone wind speeds over northeastern North America. Geophys. Res. Lett. 2022, 49, e2022GL098776. [Google Scholar] [CrossRef]
  78. Pryor, S.C.; Barthelmie, R.J.; Bukovsky, M.S.; Leung, L.R.; Sakaguchi, K. Climate change impacts on wind power generation. Nat. Rev. Earth Environ. 2020, 1, 627–643. [Google Scholar] [CrossRef]
  79. Schoof, J.T.; Pryor, S.C. Assessing the fidelity of AOGCM-simulated relationships between large-scale modes of climate variability and wind speeds. J. Geophys. Res. 2014, 119, 9719–9734. [Google Scholar] [CrossRef]
  80. Sun, Y.; Zhong, Z.; Li, T.; Yi, L.; Shen, Y. The slowdown tends to be greater for stronger tropical cyclones. J. Clim. 2021, 34, 5741–5751. [Google Scholar] [CrossRef]
  81. McCloskey, T.A.; Bianchette, T.A.; Liu, K.-B. Track patterns of landfalling and coastal tropical cyclones in the Atlantic basin, their relationship with the North Atlantic oscillation (NAO), and the potential effect of global warming. Am. J. Clim. Chang. 2013, 2, 11. [Google Scholar] [CrossRef]
  82. Coburn, J.; Pryor, S.C. Evolution of the Internal Climate Modes under Future Warming. J. Clim. 2023, 36, 511–529. [Google Scholar] [CrossRef]
  83. Jeong, D.I.; Sushama, L. Projected changes to mean and extreme surface wind speeds for North America based on regional climate model simulations. Atmosphere 2019, 10, 497. [Google Scholar] [CrossRef]
  84. Roberts, M.J.; Camp, J.; Seddon, J.; Vidale, P.L.; Hodges, K.; Vannière, B.; Mecking, J.; Haarsma, R.; Bellucci, A.; Scoccimarro, E. Projected future changes in tropical cyclones using the CMIP6 HighResMIP multimodel ensemble. Geophys. Res. Lett. 2020, 47, e2020GL088662. [Google Scholar] [CrossRef]
  85. Priestley, M.D.; Ackerley, D.; Catto, J.L.; Hodges, K.I.; McDonald, R.E.; Lee, R.W. An overview of the extratropical storm tracks in CMIP6 historical simulations. J. Clim. 2020, 33, 6315–6343. [Google Scholar] [CrossRef]
  86. Martínez-Alvarado, O.; Gray, S.L.; Hart, N.C.; Clark, P.A.; Hodges, K.; Roberts, M.J. Increased wind risk from sting-jet windstorms with climate change. Environ. Res. Lett. 2018, 13, 044002. [Google Scholar] [CrossRef]
  87. Pryor, S.C.; Nikulin, G.; Jones, C. Influence of spatial resolution on Regional Climate Model derived wind climates. J. Geophys. Res. 2012, 117. [Google Scholar] [CrossRef]
  88. Jung, C.; Schindler, D. Does the winter storm-related wind gust intensity in Germany increase under warming climate?—A high-resolution assessment. Weather Clim. Extrem. 2021, 33, 100360. [Google Scholar] [CrossRef]
  89. Pryor, S.C.; Schoof, J.T. Importance of the SRES in projections of climate change impacts on near-surface wind regimes. Meteorol. Z. 2010, 19, 267–274. [Google Scholar]
  90. Mearns, L.O.; McGinnis, S.; Korytina, D.; Arritt, R.; Biner, S.; Bukovsky, M.; Chang, H.-I.; Christensen, O.; Herzmann, D.; Jiao, Y.; et al. The NA-CORDEX Dataset; Version 1.0; NCAR Climate Data Gateway: Boulder, CO, USA, 2017. [Google Scholar] [CrossRef]
Figure 2. (a) 99.9th percentile wind speeds (U999) from WRF-ERAI (background color) and NWS ASOS stations (points, where the red outline indicates those ASOS stations lie within NE states). (b) Scatterplot of U999 from WRF-ERAI in each ASOS-station-containing grid cell versus U999 from ASOS (black dots). Grid cells with land fraction (LF) < 1 in the WRF model are outlined with magenta squares. Red dots indicate locations within NEland. The dashed line indicates a 1:1 correspondence.
Climate 13 00105 g002
Figure 3. Tracks and intensity of eight notable historical hurricanes during the WRF-ERAI simulation period from the NOAA database (left panels reproduced with permission from https://www.nhc.noaa.gov/outreach/history/ accessed on 11 May 2025). Right panels: Contours of sea level pressure (SLP, at 992, 996, 1000 and 1004 hPa in red) and 10 m height wind speed fields (background color) in the WRF-ERAI output at three times close to observed landfall.
Climate 13 00105 g003aClimate 13 00105 g003b
Figure 4. U999 from (a) WRF-ERAI, (b) WRF-GFDLa (1950–2005), (c) WRF-GFDLb (2006–2099), (d) WRF-HadGEM2a, (e) WRF-HadGEM2b, (f) WRF-MPIa, (g) WRF-MPIb. White outlines denote NE states. (hj) Scatterplots of U999 in NEland grid cells from WRF-ESMa vs. WRF-ESMb. (k) 10-year moving mean annual U999 from all NEland (solid lines) and those with above-median population (dashed lines). (l) 50-year return period wind speeds (URP,50,i) computed using 20-year moving windows. URP,50 95% confidence intervals (dotted lines) from the entire WRF-ESM time series. (m,n) NE population density in 2000 and 2090 in each 25 km grid cell.
Climate 13 00105 g004
Figure 5. (ag) Fraction of NEland with simultaneous U > U999. The marker area (square) represents the windstorm size (i.e., number of grid cells at tp within 1500 km of minimum SLP with U > U999). Windstorms with Umax > 22.5 ms−1 are denoted by the red fill of that square. (h) Number of windstorms per year selected using varying thresholds of spatial coverage of U > U999 (fraction of NEland).
Climate 13 00105 g005
Figure 6. Scatterplots of the annual frequency of windstorms in the three pairs of WRF-ESM simulations for varying values of the spatial coverage of simultaneous U > U999 (U > U999Cov from 0.05 to 0.25). Each point shows the annual mean frequency of windstorms for a given U > U999Cov in WRF-ESMa versus WRF-ESMb. To aid interpretation, the values of annual windstorm frequency in the historical and future periods are encircled by an ellipse for two different coverage thresholds (U > U999Cov): 0.05 and 0.1.
Climate 13 00105 g006
Figure 7. Cyclone tracks associated with the top N windstorms in each simulation, color-coded by cyclone origin (a,c,d,f,g,i,j). Decadal counts of windstorms associated with each cyclone type (bars) and ACE (black lines) for (b) WRF-ERAI, (e) WRF-GFDLa,b, (h) WRF-HadGEMa,b and (k) WRF-MPIa,b. Red text in these frames denote the median windstorm LI in the last 30 years of each simulation, accounting for population increase. Dashed vertical lines indicate the end of WRF-ESMa and the beginning of WRF-ESMb.
Climate 13 00105 g007
Figure 8. (af) Fraction of windstorms with U > U999 in each NEland grid cell at tp ± 6 h for transitioning Tropical Cyclones (TCs) and Alberta Clippers (ACs) from WRF-ESMa (Nh and Nf indicate number of windstorms from that cyclone type in the 55-year historical period and 95-year future simulations. The red (white) contours show an increase (decrease) of >25 percentage points in WRF-ESMb vs. WRF-ESMa. Mean sea surface temperatures (black contour = 27 °C) for the historical period (g) GFDLa, (h) HadGEMa and (i) MPIa. Dashed black contour is 1022 hPa isobar and thus the STH boundary. (jl) Frequency (left) and temporal autocorrelation (right) for NAM indices in (j) GFDL, (k) HadGEM and (l) MPI during 1950–2100 (dashed lines = mean autocorrelation over 2–4 months) (black) and equivalent values from ERA-Interim (in red). (m) Mean absolute error (MAE) (in percentage points) of the probability distributions of NAM, PNA, ENSO and PDO in each ESM compared to ERA-I over 1980–2018, and mean MAE over all modes. Bold values indicate the lowest MAE (i.e., best) for each mode.
Climate 13 00105 g008
Table 1. Fraction (percentage in whole numbers) of NE windstorms that are the results of the cyclone types shown by origin region in Figure 1a (see also Figure 7).
DescriptionAbbreviationWRF-ERAIWRF-GFDLaWRF-GFDLbWRF-HadGEMaWRF-HadGEMbWRF-MPIaWRF-MPIb
Transitioning Tropical CyclonesTC16463832351924
Alberta ClippersAC16814861919
Colorado LowsCL35141821181021
Midlatitude WestMW68588128
East Coast LowsEC16109891913
OtherOther9101319221712
Disclaimer/Publisher’s Note: The statements, opinions and data contained in all publications are solely those of the individual author(s) and contributor(s) and not of MDPI and/or the editor(s). MDPI and/or the editor(s) disclaim responsibility for any injury to people or property resulting from any ideas, methods, instructions or products referred to in the content.