Abstract
The ongoing and projected future climate change impacts the heating, cooling, and air-conditioning sectors both directly and indirectly. The consideration of heating, cooling, and energy degree-days is a consistent, robust, and widely used approach for quantitatively estimating the energy demand of closed environments based on outdoor thermal conditions. Hence, the spatial distribution and the long-term changes in this demand depend on on the quantity of final users for such services; it is essential to consider demographic data in the assessment. The paper presents a comprehensive analysis of the population-weighted degree-days for the near past and the Sixth Assessment Report (AR6) of the Intergovernmental Panel on Climate Change (IPCC) scenario-driven future over Southeast Europe for all four ‘Tier 1’ Shared Socioeconomic Pathways (SSPs) based on the methodology of the United Kingdom Meteorological Office and performed using large NEX-GDDP CMIP6 ensemble of global circulation models (GCMs) and up to date population dynamics data from the NASA’s SEDAC. As an expression of regional warming tendencies, the study reveals an overall reduction in heating and an increase in cooling degree-days, confirming the leading role of the climate. We also provide evidences for the influence of the population factor, which significantly alters the region’s degree-day climatology in both space and time. The resulting overall picture on country-wide and regional level is complex; in some cases, the population dynamics is projected to outbalance the thermal-induced changes.
1. Introduction
Today, there is a strong consensus that climate change poses a serious threat to both the health of the planet and human comfort [1]. According to the Synthesis Report of the IPCC-AR6 [2], there is no denying that human activity, primarily through the release of greenhouse gases (GHG), has contributed to global warming. The global surface temperature increased by 1 °C between 2011 and 2020 compared to 1850–1900. According to almost all scenarios and modeled pathways, the main cause of the predicted short-term global warming (2021–2040) increase will be higher cumulative GHG emissions. With an increase in the frequency and duration of extreme weather events as well as numerous climate-related hazards, the area surrounding the Mediterranean basin, which includes Southeast Europe (SEEu), generally appears to be among the most vulnerable to climate change [2,3,4,5,6].
In addition to several other hazards, climate change directly and indirectly impacts managed sectors like the heating, ventilating, and air-conditioning (HVAC) industry. Worldwide, household energy consumption accounts for about a third of total energy use [7], and a large portion of the energy consumed in buildings goes to HVAC [8]. In addition to other factors, the energy demand for indoor HVAC is directly related to outdoor thermal conditions, and multiple studies have indicated that a warmer climate is predicted to result in a decrease in heating demand and an increase in cooling demand (see [9] and references therein). These changes directly affect the consumption of electricity and fossil fuels. Numerous recent studies ([10,11,12,13,14] and many others) addressed variations in HVAC specifics depending on the geographical region, the climate zones, and the different spatial and temporal scales. Most of them evaluate their long-term evolution, revealing substantial seasonal and geographic heterogeneities. In Europe and the Mediterranean, several papers [1,7,15,16] provide strong evidence that the necessity for heating of closed environments decreases considerably when the outdoor temperature increases, and, vice versa, the demand for cooling and the risk of overheating increases significantly in the recent conditions as well as in all future climate scenarios. More specifically, for SEEu, the various aspects of the energy demand for indoor HVAC and their relationship to ambient temperature are evaluated for Romania [17], more recently for Greece [18,19], Türkiye [20,21] as well as Serbia [22]. These studies use different methods and a variety of input data, and they are carried out at the national level as well as at the local level. However, their common key conclusion is that the ongoing and projected climate changes will directly affect energy production and consumption.
Although to relate the energy consumption of buildings and ambient thermal conditions is challenging, heating and cooling degree-days (HDD and CDD) are two temperature-based indicators that have been widely used for such purposes. These can be added together, creating energy degree-days (EDD), which account for the impact of simultaneous increases and decreases in energy necessity [7,9,14]. The computation of degree-days is not free from uncertainties due to multiple possible calculation methods, thresholds, utilized input datasets, and considerations for the specific energy demand of the closed environments [14,23]. The population-weighted (PW) HDD and CDD (PHDD and PCDD) can be used to estimate the energy needs of a region when HDD and CDD only account for the effects of ambient temperatures [9]. For regions where populations are concentrated in areas that are not representative of the mean degree-days of the considered domain as a whole, population weighting is a very reasonable necessity [24]. Nevertheless, according to [14], the relative share of publications where the population data is included in the analysis is very small.
A multimodel ensemble (MME) approach has been preferred by many researchers, whereby simulations of the past and future climate are generated using multiple models (or model versions) instead of just one [25,26]. There are various approaches to creating MMEs, and it is generally accepted that the MME is better than any one model hence it successfully lowers the random errors that are present in individual members and lessens the impact of internal variability [27,28].
The present study’s main aim is to evaluate the PW degree-days over SEEu and assess their spatio-temporal patterns in the projected future climate toward to the end of the century. As in our previous NEX-GDDP-based studies [29,30], the MME approach is a key point of our evaluation concept. Thus, HDD and CDD are computed individually from downscaled and bias-corrected temperature data from 25 different GCMs. These computations are performed for the whole period of the available data—historical and future, under four SSP scenarios. Furthermore, HDD and CDD are calculated for the historical period with observation-based dataset, and the results are compared with the MME output in order to evaluate the MME capacity to adequately reproduce the climate of the near past degree-days. Next, we incorporate population data to obtain corresponding PHDD and PCDD for the historical and future periods, paying special attention to the estimation of the impact of this factor. Then, we calculate the multiyear means for three 30-year periods 1981–2010 (‘near past’ or reference period), 2021–2050 (‘near future’), and 2071–2100 (‘far future’) intending to assess the long-term changes. The final step consists of a statistical trend analysis of these changes. Most generally, the novelties of this study include (i) using the up-to-date NEX-GDDP CMIP6 dataset to assess projected changes in the degree-days in SEEu, (ii) explicitly considering the MME approach using the large set of GCMs, and (iii) utilizing degree-days computation methodology, whose suitability for regional assessments has already been proved in our previous articles [31,32,33]. Generally, this study is a continuation of our efforts in the degree-day climatology assessment of SEEu for the near past [31] and projected CMIP5 scenario-driven future [32,33].
After this introduction, Section 2 is devoted to the study area and used data; the description of the applied mathematical approach to the computation of PHDD and PCDD is in Section 3; the core of the article is in Section 4 where the results are presented and discussed; and the concluding remarks and the outlook for further investigation are in Section 5.
2. Study Area and Used Data
2.1. Study Area, Meteorological Data and Scenarios
The SEEu study area has latitudinal and longitudinal boundaries of 35° N–50° N and 15° E–35° E, respectively, and is the same as in our previous work [29,30]. In the latter, it is described in detail, and its geographical map is also shown; therefore, for the sake of brevity, we will not describe it again now.
The calculation of degree-days requires daily data for the minimum, mean, and maximum temperature. Applying our previous experience with the CMIP5 version of the US National Aeronautics and Space Administration (NASA) Earth Exchange Global Daily Downscaled Projections (NEX-GDDP) product [29,30], we obtained the necessary temperature data for the calculation of HDD and CDD from its latest version (NEX-GDDP-CMIP6) [34]. The NEX-GDDP CMIP6 (hereby NEX-GDDP) dataset is comprised of statistically downscaled and spatially disaggregated global climate scenarios that are derived from the GCM runs conducted under the Coupled Model Intercomparison Project Phase 6 (CMIP6) [35] and across all four Tier 1 Shared Socioeconomic Pathway (SSP) scenarios (SSP1-2.6, SSP2-4.5, SSP3-7.0, and SSP5-8.5) [28]. The dataset provides essential climate variables, at high spatial (0.25° × 0.25°) and temporal (daily) resolution for 1950–2100, including a historical period (1950–2014) and scenario-driven projections for 2015–2100. The statistical downscaling algorithm used to create the NEX-GDDP datasets is essentially the same as in NEX-GDDP CMIP5 and a daily variant of the monthly method described in [36]. It is specially developed for GCM output post-processing and with proven efficiency. Similarly to its predecessor, NEX-GDDP has been successfully employed in global [37] and in a wide range of regional [38,39,40,41] studies.
To identify the historical degree-day characteristics observed, temperature data with the same horizontal resolution as NEX-GDDP and covering 1950–2023 were retrieved from the latest version (v29.0) of the daily gridded dataset E-OBS [42]. E-OBS is a de facto standard reference for the evaluation of regional climate models participating in EURO-CORDEX [43]; it is also widely used for various other applications, including degree-days and climate extremes assessment [29,32,33].
There are four 21st century scenarios in the Tier 1 SSP scenario group. Three (SSP1-2.6, SSP2-4.5, and SSP5-8.5) aim for a comparable degree of aggregated radiative forcing, thus providing continuity with CMIP5 RCPs [28]. The scenario SSP1-2.6 (also called ‘Sustainability’) with 2.6 W·m−2 by the year 2100 is a modification of the optimistic scenario RCP2.6 and was invented to simulate a development that is compatible with the 2 °C target. In this scenario, climate protection measures are assumed to be implemented. The intermediate scenario SSP2-4.5 (‘Middle of the Road’) could be regarded as an update to RCP4.5, with an additional radiative forcing of 4.5 W·m−2 by the year 2100 and represents the medium pathway of future GHG emissions. This scenario also assumes that climate protection measures are being taken. The scenario SSP3-7.0 (‘Regional Rivalry’) is in the upper-middle range of all the scenarios, with 7 W·m−2 by the year 2100. In order to bridge the gap between RCP6.0 and RCP8.5, it was recently introduced following the RCP scenarios. The upper limit of the range of scenarios is represented by SSP5-8.5 (i.e., extreme forcing, also known as ‘Fossil-fueled Development: Taking the Highway’). It involves no regulations on GHG emissions, which will result in a forcing pathway of 8.5 W·m−2 in 2100 [37].
2.2. Population Data
Similarly to [9,14,24], demographic data were sourced from the NASA’s Social Economic Data and Application Center (SEDAC) dataset. Unlike these studies, however, which use the Gridded Population of the World, Version 4 (GPWv4) [44] for the historical simulations, we rely entirely on the Global 1 km Downscaled Population Base Year and Projection Grids Based on SSPs, v1.01 [45]. In quantitative and qualitative agreement with the SSPs, this product includes global urban and rural population data for the base year 2000 as well as population projections at 10-year intervals for 2010–2100 at a resolution of 1 km (roughly 30 arc-seconds). We use the total population subset for the base year for the historical estimations and these for the scenario-driven future to simulate the projected changes.
3. Computation of the PHDD and PCDD
Various approaches for degree-day calculations have been developed in the past, and it is worth mentioning that different methods may lead to very different outputs [9,15]. As in our previous studies [31,32,33], we use the United Kingdom Meteorological Office (UKMO) method described in detail in [16]. It prescribes that the daily HDD and CDD are determined by comparing the daily minimum, mean, and maximum temperatures (henceforth denoted as, Tmin, Tmean, and Tmax) with the chosen base temperature (Tbase), accounting for variations in the daily air temperature around the base temperature and the asymmetry between the daily mean and extreme temperatures throughout the day as shown on Table 1.

Table 1.
UKMO methodology for computing daily HDD and CDD.
Although it is possible to justify a specific base temperature selection by pointing out that it is not a fixed parameter [24], we have chosen, as in the original proposal, 15.5 °C for HDD and 22 °C for CDD as constant thresholds for the whole domain. As these thresholds are well justified in [16] and have been applied successfully in a European context, their applicability to the present case is beyond doubt. They are identical to our previous studies, ensuring a correct comparison of results. It is worth emphasizing also that in the present study, Tmean is an independent input parameter rather than the arithmetic average between Tmin and Tmax as in [15,16]. Similarly to [9,24], the PW degree-days are produced by multiplying the HDD, CDD, and EDD values in a given grid cell with the population in the same cell. The PW degree-days are calculated day by day, and to obtain the annual values, we summed the daily values. The measurement units of the HDD and CDD are degree-days, noted further °D.
Some recent NEX-GDDP CMIP6-based studies also consider the MME approach [9,37,38,39]. In [39], the dataset is used as drought capture utility over China, evidencing that the 16-member MME performs better than the best single model. Although the NEX-GDDP has downscaled projections from 35 GCMs [37], we limited them to 25 (see Table A1 in Appendix A for explanatory list) based on the data availability for Tmin, Tmean, and Tmax with our research periods and considered scenarios. According to the model count, our MME is significantly larger than this in [9], where only five NEX-GDDP members are considered. The degree-days are computed from all these 25 GCMs one-by-one. Next, the MMEs median (X50), 25th and 75th percentile (lower and upper quartile, noted further X25 and X75) are calculated as in [29,30]. Both quartiles and the difference X75–X25 are the most commonly used MME parameters in climatological analysis [25,26,37].
To compute PW degree-days, we first select the population data for 2000 for the historical period. For future time frames, however, we have interpolated the population data in time (on an annual basis) and space (in the NEX-GDDP grid) to conform to the meteorological input. Then, we multiplied the population count by the annual degree-days for each year. Finally, applying simple time averaging, the multiyear mean values are determined for the 30-year time frames 1981–2010, 2021–2050, and 2071–2100. The authors use the robust tool Climate Data Operator in specially designed Linux bash shell scripts to process netCDF files [46].
4. Results and Discussion
4.1. Near Past Climate Evaluation
The ability of the NEX-GDDP ensemble to reproduce the spatial and temporal variability of the degree-days for the near past climate has been evaluated at annual and multiyear time scales. The evaluation is performed by comparison of the MME output (noted further as ‘model’) with the degree-days computed with E-OBS data (noted further as ‘reference’) in two aspects: (i) examination of the MME X50 skill to simulate the long-term evolution of the field mean values of the annual sums of the degree-days and (ii) comparison of the spatial distribution of the multiyear mean values of the MME X25, X50, and X75 with the reference.
The representation of the performance of the MME utilizing several statistical scores is the most traditional verification method and is widely used in many studies [27,29,30,32,43]. Different such scores can be used, and for the evaluation in the first aspect, we have applied the well-known correlation coefficient (corr) and the normalized root mean square error (NRMSE), both computed on an annual basis in the grid space. The NRMSE is defined as follows:
where M and R denote the modeled and reference field mean values of the considered indicators ith time-step indexed by i, N is the time series length. Figure 1 shows the time series of the NRMSE and corr.
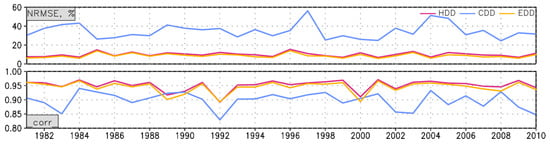
Figure 1.
NRMSE and correlation coefficient of the MME X50.
The overall first impression from Figure 1 is that the NRMSE of CDD is higher than the NRMSE of HDDs and EDD. Conversely, the correlation coefficient of the CDD is lower than the correlation coefficient of the HDD and the EDD. Both statistical scores are practically identical for HDD and EDD. Generally, the NRMSE and corr indicate a high degree of agreement between the MME MX50 and the reference—the NRMSE of the CDD is predominantly below 40%, and the correlation of this indicator is over 0.85 for the whole year past period except 1992. The NRMSE of the HDD and EDD is significantly below 20% for all years 1981–2010, and the corr is above 0.9 for all years except 1992 and 2000. Our preliminary investigation shows that the absolute biases of the HDD and CDD are commensurable. The reference values (the denominator in Equation (1)) of the HDD are typically up to an order bigger than those of the CDD, leading to the detected differences in the NRMSE of these indicators. Generally, the EDD is quantitatively dominated by the HDD, which explains the similar behavior of both parameters regarding the statistical scores.
The comparison of the spatial distribution of the multiyear mean values of the MME X25, X50, and X75 with the reference is quantified by the frequently used relative bias (RB). As in the former case, normalization regarding the reference is essential; hence, the CDD on the one hand and HDD and EDD on the other have magnitude differences typically up to an order. Figure 2 shows the spatial distribution of the reference and the MME X25–X75 and their RBs with respect to the reference.
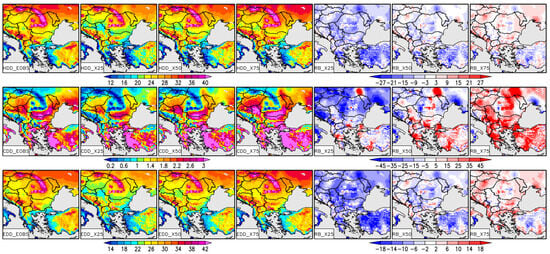
Figure 2.
Spatial distribution of the reference and the MME X25–X75 (unit: °D) as well as their RBs (in %).
Most generally, and as already evidenced in our previous studies [31,32,33], the spatial patterns of the HDD, CDD, and EDD follow the distributions of the underlying Tmin, Tmean, and Tmax in the region. The horizontal gradients and the vertical effects over the mountains, most notably along the main Carpathian ridge, are well expressed. The RBs of all degree-days of the lower quartile (MX25) are predominantly negative, and vice versa; the RBs of the upper quartile (MX75) are positive. This fact indicates that the reference is, as a whole, in the MME interquartile interval, closest to the median. The RBs of the medians (MX50s) are, compared with those for the X25 and X75, with the generally smallest value. For the HDD, they are between −5% and 5% over the more significant part of the domain, and for the CDD and EDD—typically in the intervals −10–10% and −5–5% correspondingly. The distributions of the RB of all indicators do not demonstrate any systematic spatial patterns except in some isolated hot spots, for example, over North Moldova and South Ukraine. All these results are evidence of the ability of the MM ensemble to reproduce realistically the near past degree-days climate.
4.2. Future Projections
The projected future state and long-term changes in the population weighted degree-days for the near and far future are presented in Figure 3 and Figure 4, respectively, through a comparison between the multiyear mean values for 2021–2050 and 2071–2100 of the MME X50 for all ‘Tier 1’ SSPs with their counterparts for 1981–2010.
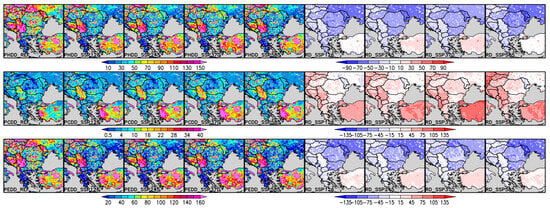
Figure 3.
Multiyear means (unit: 103°D) of the MME X50 of the PW degree-days for the reference period (‘REF’), near future according all four SSPs, and the relative difference (‘RD’, in %) of the multiyear means of the near future in respect to their counterparts for the reference period.
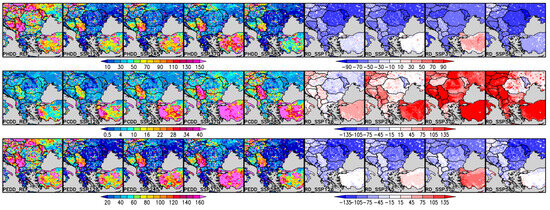
Figure 4.
Same as Figure 3 but for the far future.
A common conclusion from the cited in Section 1 articles concerning the projected future changes in the considered indicators, is the steady decrease in the heating- and increase in the cooling degree-days toward the end of the 21st century. This outcome is, incontrovertibly, a reflection of the general warming tendency and continuation of already detected course in the historical records. For the region of SEEu, in particular, the revealed patterns of climate-induced HDD and CDD changes intensify with the increasing radiative forcing in the considered RCP scenarios which is expressed in relatively smooth spatial patterns across the domain (see [31,32,33] again). Figure 3 and Figure 4 reveal, however, a much more complex picture. As expected, the overall changes are significantly higher in the far, rather than in the near future, due to the longer cumulative impact of the radiative forcing. Although the rising Tmin, Tmean and Tmax appears as the primary driver for the long-term PW degree-days changes over significant parts of the region, most striking is the substantial spatial heterogeneity in the maps of the reference period and the projected scenario-driven changes. At the local, country-wide level, the heterogeneity is expressed in sharp grid cell-to-grid cell transitions of the values of the PW degree-days, resulting in a mosaic-type spatial distribution. The reason for this is the highly uneven distribution of the population. At the chosen spatial resolution, some settlements and even towns fall into a single grid cell, where the population is an order of magnitude higher than the rural surroundings. Substantial differences are observed also at the regional level, manifested in apparent dissimilarities between the countries. Since the transition between the typical field mean country values occurs along the national borders, the reason is again the distribution of the population. According the absolute value of the magnitude of the long-term changes and especially their sign, the countries in the region can be divided in two main groups. The first group includes countries where the change in the PW degree-days is consistent with the long-term rise of the temperatures. A general trend of decreased PHDD and increased PCDD is observed here, although there were significant differences between single countries and scenario-by-scenario. The decrease in PHDD outweighs the increase in PCDD, which results in an overall reduction in the PEDD. It is worth mentioning, that for some countries like Serbia, this reduction is very small. This group includes all countries except Turkey. However, in this group, Moldova exhibits a decrease in the PCDD even in the hotter climate according to SSP1-2.6, SSP2-4.5, and SSP5-8.5. Bulgaria, Romania, and the territories in the NE part of the domain, belonging to Ukraine and Russia, also exhibit a decrease in the PCDD, although minimal and solely for SSP1-2.6. The second group includes Türkiye only but due to its relatively big territory it should be regarded as group rather than exception. Türkiye’s projected growth in cooling demand is so rapid that it practically outweighs the decrease in heating demand. This country is also the only one showing an apparent future increase in PHDD, although only for SSP3.7-0. As a result, the absolute value of the change in PEDD is insignificant for SSP1.2-6, SSP2.4-5, and SSP5.8-5 and definitely positive for SSP3.7-0. Since the primary reason for the complexity of the described above picture is the long-term population dynamics, the next subsection is dedicated to an estimation of this factor.
4.3. Estimation of the Impact of the Population Factor
The HDD and CDD, on the one hand, and their PW modifications, the PHDD and PCDD, on the other, are, strictly speaking, physically different variables, and thus, they can not be compared directly. However, their dimensionless relative changes with respect to the reference can be compared, allowing in such a manner an indirect estimation of the impact of the population factor. To illustrate this, we have calculated the field mean values of the HDD, CDD, PHDD, and PCDD as well as the population count of two relatively big rectangular sub-domains over Romania and Türkiye. According to the analysis outlined in Section 4.2, both exhibit substantially different long-term degree-day evolution. The dynamics of the considered parameters are shown in Figure 5 and Figure 6.
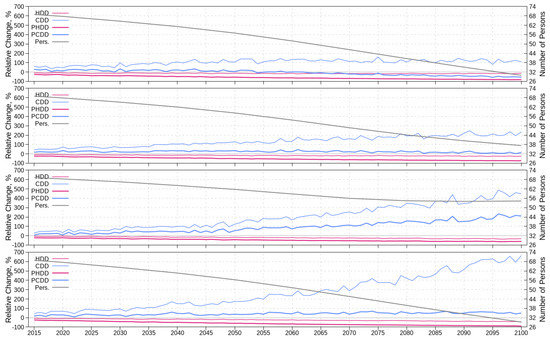
Figure 5.
Time series of mean the relative change in the HDD, CDD, PHDD, and PCDD (left Y-axes) as well as the mean number of persons per grid cell (right Y-axes) for the sub-domain Romania for SSP1.2-6, SSP2.4-5, SSP3.7-0, and SSP5.8-5 from the upper to lower subplot correspondingly.
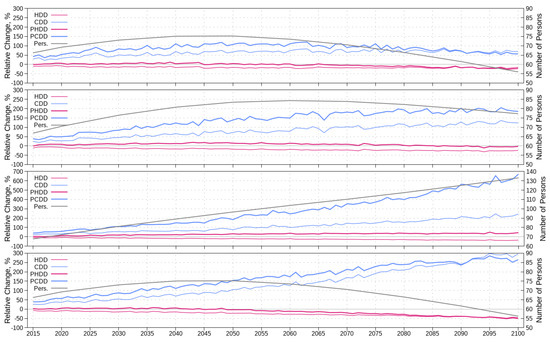
Figure 6.
Same as Figure 5 but for Türkiye. Note, that the scale of the left Y-axis for SSP3.7-0 is different.
The sub-domain Romania demonstrates a steady, almost linear, decrease in the population for SSP1.2-6, SSP2.4-5, and SSP5.8-5, resulting in a reduction from about 70 persons/grid cell in 2015 to lower than 40 persons/grid cell toward the end of the century. The population also decreases according to the SSP3.7-0 scenario but with an insufficient lapse rate after 2080. Thus, it remains at the end of the period of about 55 persons/grid cell. In [14] is emphasized that Central Europe is a region where all SSPs, excluding SSP5, project population decreases. Apparently, the general reduction tendency is valid for Romania even for SSP5.8-5. Following the regional climate warming tendencies, the HDD decreases, and CDD increases for all scenarios, although very modestly for SSP1.2-6. The consideration of the population modifies this long-term course significantly. When the changes in degree-days vs. population count are unidirectional, as in the case of HDD, population reduction leads to a more significant decrease in PHDD than in HDD. The effect is, however, more striking in the opposite case for CDD, especially in the SSP5.8-5 projection, shown in the lowest subplot in Figure 5, when the magnitude of the absolute value of the changes is most considerable. The drastic reduction in population leads to a more than sixfold decrease in the growth lapse rate, resulting in the relative increase in PCDD towards the end of the century being less than 100% compared to that of CDD, which is over 800%.
According to the population dynamics, Figure 6 reveals a substantially different situation for the sub-domain Türkiye. Notably, only for SSP3.7-0, there is a steady increase from about 70 persons/grid cell to approximately 130–135 persons/grid cell. In contrast, the projected long-term changes for the other scenarios are not monotonic. We observe a general initial increase in the first decades of the period, followed by a slight decrease in the second half of the century, resulting in a broad maximum in 2040–2060. The projected rapid population growth under SSP3.7-0 leads to a considerable rise in the cooling demand—the relative change in the PCDD is 600–700% in contrast to 100–200% for CDD. However, most remarkable for this sub-domain and scenario is the course of the heating demand; hence, the population dynamics reverse even the sign of the tendency—the relative change in the HDD at 2100 is about -40% and of the PHDD 40%. As a result, as emphasized in Section 4.2, Türkiye is the single country in the region for which we observe a non-negligible increase in the heating demand, although for SSP3.7-0 only, in the generally hotter future climate. For the scenarios, SSP1.2-6 and SSP5.8-5, the decline of the population in the second half of the century led to convergence between the tendency lines of the degree-days on the one hand and their PW modifications on the other, which leads to practically equal relative change rates on the last two decades of the period. The slower decrease in the population for SSP2.4-5 concerning SSP1.2-6 and SSP5.8-5 leads to an almost synchronous relative change rate between the degree-days and their PW modifications, with a nearly constant difference of about 50% for PHDD vs. HDD and about 20% for PCDD vs. CDD in the second half of the century.
4.4. Trend Estimation
In this study, we apply two frequently used in environmental sciences non-parametric methods for linear trend analysis: the Mann–Kendall (MK) test [47,48] for assessment of the degree of statistical significance and the Theil–Sen Estimator (TSE) [49,50] for computation of the trend magnitude, i.e., the slope of the trend line. As in [30,31,32,33], the level of the statistical significance is fixed at 5%, and the analysis is performed grid cell-by-grid cell for the whole future period 2015–2100; the results are presented in Figure 7.
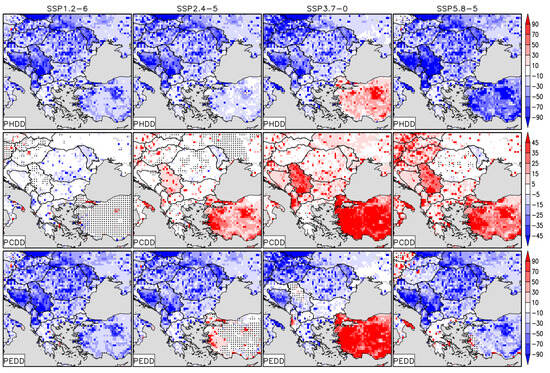
Figure 7.
Trend magnitude (unit: 10°D/year) of the MME X50 of the PW degree-days for each of the considered scenarios according to the column titles. Stippling indicates grid cells with changes that are not significant at the 5% significance level.
Figure 7 reveals an overall picture with considerable variations between countries and scenarios. Probably most apparent as a whole is the mosaic-type pattern of the spatial distribution of the trend magnitude similar to the pattern of the long-term changes shown in Figure 3 and Figure 4. The trend of the PHDD is prevailing negative, with values between −500 and −300°D/year over the more significant part of the domain and without general differences between SSP1.2-6, SSP2.4-5, and SSP3.7-0. The notable exception is for Türkiye, for SSP3.7-0 only, where the trend is positive, in frames 100–500°D/year. As expected, the absolute value of trend magnitude for SSP5.8-5 is more considerable, reaching 500–900°D/year. Regardless of their sign, the changes for all scenarios are statistically significant practically everywhere for PHDD. According to PCDD, it is worth mentioning that the positive trend is notable from the point of view of its magnitude for SSP3.7-0 and SSP5.8-5 only primarily due to countries like Türkiye and Serbia. In contrast, the trend magnitude for the scenario with the weakest forcing, SSP1.2-6, is between −50 and 50°D/year except for some isolated grid cells, revealing the absence of general tendency. This conclusion is strengthened by the fact that for this combination type of PW degree-day/scenario, the relative share of the territory where the trend is not significant is the biggest. Generally, the field of the trend magnitude and significance of the PEDD is similar to that of the PHDD. The dominating across the territory and scenarios trend, which is also statistically significant, is negative. The negative trend magnitude is between −500 and −300°D/year without clear scenario dependency as general. The remarkable exception from the overall decreasing trend is Türkiye, for SSP3.7-0, where the magnitude is predominately more than 500°D/year and also statistically significant.
Concluding this section, we can state that the overall picture of the trend magnitude and significance of the PW degree-days is consistent with their long-term projections analyzed in Section 4.2.
5. Conclusions and Outlook
The paper presents a comprehensive study of the population-weighted degree-days for the near past, and the AR6 scenario-driven future over Southeast Europe for all four ‘Tier 1’ SSPs based on elaborated methodology and performed using large NEX-GDDP CMIP6 GCM ensemble and up to date population dynamics data. Concerning the selected approach, meteorological and demographic input data, and the considered domain, the study is novel, according to our knowledge.
Most generally, we reveal a steady growth of heating and, vice versa, a reduction in cooling demand, resulting in an expressed decrease in HDD that is larger than the increase in CDD. This result is a direct consequence of the rising tendencies of the minimum, mean, and maximum temperatures in the progressively warming regional climate and is consistent with the documented general tendency in temperate climates [14]. Most relevantly, the study provides strong evidence for the crucial importance of considering the population dynamics in the degree-days assessment methodology. Demographic data’s inclusion modifies the overall degree-day climatology of Southeast Europe according to its spatial distribution, both on a regional and country-wide scale, as well as its long-term temporal change, making the overall picture very complex. As a whole, we identify two main groups regarding the projected evolution of the PEDD. The first group includes all countries except Türkiye with an increase in the PHDD and a decrease in the PCDD where the leading role of the climate is amplified by the general population reduction tendency in the case of PHDD and, contrary, diminished in case of PCDD. As a result, we reveal an overall reduction in the PEDD toward the end of the 21st century irrespective of the SSP. One of the key messages of [14] is that Central Europe is one of the few regions in the world that show a decreasing PEDD tendency for all SSPs. The present results concerning the northwestern part of our domain confirm this conclusion. The second group includes Türkiye only, but its share in the whole area of the domain is significant. The decrease in the PHDD for this country is significantly weakened by the population change, even reversed for SSP3.7-0, and, in contrast, the PCDD growth is strongly intensified. The resulting PEDD-change is almost negligible for SSP1.2-6 and SSP5.8-5 and positive for SSP2.4-5, especially for SSP3.7-0. In [14] is pointed out that the combined growth in both CDD and population outbalances the HDD resulting in increased energy demand for heating and cooling for any SSP. The prevailing positive trend of the PEDD for Türkiye revealed here confirms this conclusion.
The present assessment shares common limitations with other studies, based on similar methodology and data sources like [9,14,24]. First, an important factor from the point of view of human thermal comfort, like the humidity, is not included in the assessment. Estimating the uncertainty of the analysis, which stems from meteorological and demographic data, is also not performed. Considering these aspects would introduce more complexity than the scope of this paper allows, but their explicit addressing could form the basis of future research. Among others, such work could be focused on finer, municipality-level issues of the degree-day climatology of the region, although the spatial resolution of the NEX-GDDP dataset appears too coarse for such tasks. Thus, another direction of our future research could be to explore alternative sources of climate data with finer spatial resolution.
Most generally and importantly, the present study confirms unambiguously the relevance of the expected long-term changes in the projected scenario-driven future toward the end of the 21st century. Their direct consequence is a substantial shift in the heating, cooling, and ventilating demands and, subsequently, in the capacity and seasonality of energy production and transportation. Encountering the limitations discussed in this section, the present results could be used by stakeholders and policymakers as a scientific basis for implementing optimization and mitigation strategies.
Author Contributions
Conceptualization, H.C. and K.S.; methodology, H.C.; software, H.C. and K.S.; validation, H.C. and K.S.; formal analysis, K.S.; investigation, H.C.; resources, K.S.; data curation, K.S.; writing—original draft preparation, H.C.; writing—review and editing, H.C.; visualization, H.C. All authors have read and agreed to the published version of the manuscript.
Funding
This research received no external funding.
Institutional Review Board Statement
Not applicable.
Data Availability Statement
The original NEX-GDDP-CMIP6 data are downloaded from the NCCS THREDDS portal: https://www.nccs.nasa.gov/services/data-collections/land-based-products/nex-gddp-cmip6 (accessed on 20 September 2024). The datasets, containing PHDD, PCDD, PEDD as well as the results of the MK trend test are available from the corresponding author upon request.
Acknowledgments
We acknowledge the contribution of Climate Analytics Group and NASA Ames Research Center using the NASA Earth Exchange, and the NASA Center for Climate Simulation (NCCS) for the NEX-GDDP-CMIP6 dataset and also the E-OBS dataset from the Copernicus Climate Change Service (C3S, https://surfobs.climate.copernicus.eu) (accessed on 25 September 2024) and the data providers in the ECA&D project (https://www.ecad.eu) (accessed on 25 September 2024). Not at least we thank to the anonymous reviewers for their comments and suggestions which led to an overall improvement of the original manuscript.
Conflicts of Interest
The authors declare no conflicts of interest.
Abbreviations
The following abbreviations are used in this manuscript:
| IPCC | Intergovernmental Panel on Climate Change |
| AR6 | Sixth Assessment Report (of the IPCC) |
| SEEu | Southeast Europe |
| HVAC | Heating, Ventilating, and Air-conditioning |
| HDD, CDD, and EDD | Heating, Cooling, and Energy degree-days |
| PW | Population-weighted |
| GCM | Global Circulation Model |
| MME | Multimodel ensemble |
| CMIP6 | Coupled Model Intercomparison Project Phase 6 |
| NEX-GDDP | NASA Earth Exchange Global Daily Downscaled Projections |
| SSP | Shared Socioeconomic Pathway |
Appendix A
Table A1.
Descriptive list of the used 25 NEX-GDDP CMIP6 GCMs.
Table A1.
Descriptive list of the used 25 NEX-GDDP CMIP6 GCMs.
| No. | CMIP6 Model Name | Institution/Country | Grid, Hor. Res. (Lon. × Lat.) |
|---|---|---|---|
| 1 | ACCESS-CM2 | CSIRO-ARCCSS/Australia | 144 × 192, 1.875° × 1.25° |
| 2 | ACCESS-ESM1-5 | CSIRO/Australia | 192 × 145, 1.875° × 1.25° |
| 3 | BCC-CSM2-MR | BCC/China | 160 × 320, 1.125° × 1.125° |
| 4 | CanESM5 | CCCma/Canada | 64 × 128, 2.812° × 2.77° |
| 5 | CMCC-ESM2 | CMCC/Italy | 288 × 192, 1.25° × 0.94° |
| 6 | EC-Earth3 | EC-Earth-Consortium/EC-Earth consortium | 512 × 256, 0.703° × 0.703° |
| 7 | EC-Earth3-Veg-LR | EC-Earth-Consortium/EC-Earth consortium | 512 × 256, 0.703° × 0.703° |
| 8 | FGOALS-g3 | CAS/China | 180 × 80, 2° × 2.025° |
| 9 | GFDL-ESM4 | NOAA-GFDL/USA | 288 × 180, 1.25° × 1° |
| 10 | INM-CM4-8 | INM/Russia | 180 × 120, 2° × 1.5° |
| 11 | INM-CM5-0 | INM/Russia | 180 × 120, 2° × 1.5° |
| 12 | IPSL-CM6A-LR | IPSL/France | 144 × 143, 2.5° × 1.259° |
| 13 | KACE-1-0-G | NIMS-KMA/Republic of Korea | 199 × 144 1.875° × 1.25° |
| 14 | MIROC6 | MIROC/Japan | 256 × 128, 1.403° × 1.403° |
| 15 | MPI-ESM1-2-HR | MPI-M, DWD, DKRZ/Germany | 384 × 192, 0.939° × 0.939° |
| 16 | MPI-ESM1-2-LR | MPI-M, AWI, DKRZ, DWD/Germany | 192 × 96, 1.9° × 1.9° |
| 17 | MRI-ESM2-0 | MRI/Japan | 320 × 160, 1.125° × 1.125° |
| 18 | NorESM2-LM | NCC/Norway | 144 × 96, 2.5° × 1.89° |
| 19 | NorESM2-MM | NCC/Norway | 288 × 192, 1.25° × 0.94° |
| 20 | TaiESM1 | AS-RCEC/Taiwan | 288 × 192, 1.25° × 0.94° |
| 21 | CNRM-CM6-1 | CNRM-CERFACS/France | 128 × 64, 2.813° × 2.813° |
| 22 | CNRM-ESM2-1 | CNRM-CERFACS/France | 256 × 128, 1.406° × 1.406° |
| 23 | GISS-E2-1-G | NASA-GISS/USA | 144 × 90, 2.5° × 2° |
| 24 | MIROC-ES2L | MIROC/Japan | 256 × 128, 1.406° × 1.406° |
| 25 | UKESM1-0-LL | MOHC/UK | 192 × 144, 1.875° × 1.25° |
References
- Pérez-Andreu, V.; Aparicio-Fernández, C.; Martínez-Ibernón, A.; Vivancos, J.-L. Impact of Climate Change on Heating and Cooling Energy Demand in a Residential Building in a Mediterranean Climate. Energy 2018, 165, 63–74. [Google Scholar] [CrossRef]
- IPCC, 2023: Summary for Policymakers. In Climate Change 2023: Synthesis Report. Contribution of Working Groups I, II and III to the Sixth Assessment Report of the Intergovernmental Panel on Climate Change; Core Writing Team, Lee, H., Romero, J., Eds.; IPCC: Geneva, Switzerland, 2023; pp. 1–34. [Google Scholar] [CrossRef]
- Xoplaki, E.; Trigo, R.M.; García-Herrera, R.; Barriopedro, D.; D’Andrea, F.; Fischer, E.M.; Gimeno, L.; Gouveia, C.; Hernández, E.; Kuglitsch, F.G.; et al. Large-Scale Atmospheric Circulation Driving Extreme Climate Events in the Mediterranean and Its Related Impacts. In The Climate of the Mediterranean Region; Elsevier: Amsterdam, The Netherlands, 2012; pp. 347–417. [Google Scholar] [CrossRef]
- Lionello, P.; Abrantes, F.; Congedi, L.; Dulac, F.; Gacic, M.; Gomis, D.; Goodess, C.; Hoff, H.; Kutiel, H.; Luterbacher, J.; et al. Introduction: Mediterranean Climate–Background Information. In The Climate of the Mediterranean Region; Elsevier: Amsterdam, The Netherlands, 2012; pp. xxxv–xc. [Google Scholar] [CrossRef]
- Morabito, M.; Crisci, A.; Messeri, A.; Messeri, G.; Betti, G.; Orlandini, S.; Raschi, A.; Maracchi, G. Increasing Heatwave Hazards in the Southeastern European Union Capitals. Atmosphere 2017, 8, 115. [Google Scholar] [CrossRef]
- Planton, S.; Driouech, F.; Rhaz, K.E.; Lionello, P. Sub-Chapter 1.2.2. The Climate of the Mediterranean Regions in the Future Climate Projections. In The Mediterranean Region Under Climate Change; IRD: Marseille, France, 2016; pp. 83–91. [Google Scholar] [CrossRef]
- Pangsy-Kania, S.; Biegańska, J.; Flouros, F.; Sokół, A. Heating and Cooling Degree-Days vs Climate Change in Years 1979–2021. Evidence from the European Union and Norway. Econ. Environ. 2024, 88, 619. [Google Scholar] [CrossRef]
- Mehregan, M.; Naminezhad, A.; Vakili, S.; Delpisheh, M. Building Energy Model Validation and Estimation Using Heating and Cooling Degree Days (HDD–CDD) Based on Accurate Base Temperature. Energy Sci. Eng. 2022, 10, 3638–3649. [Google Scholar] [CrossRef]
- Gesangyangji, G.; Holloway, T.; Vimont, D.J.; Acker, S.J. Future Changes in State-Level Population-Weighted Degree Days in the U.S. Environ. Res. Lett. 2024, 19, 034029. [Google Scholar] [CrossRef]
- Petri, Y.; Caldeira, K. Impacts of Global Warming on Residential Heating and Cooling Degree-Days in the United States. Sci. Rep. 2015, 5, 2427. [Google Scholar] [CrossRef]
- Buonocore, J.J.; Salimifard, P.; Magavi, Z.; Allen, J.G. Inefficient Building Electrification Will Require Massive Buildout of Renewable Energy and Seasonal Energy Storage. Sci. Rep. 2022, 12, 11931. [Google Scholar] [CrossRef]
- Lyu, J.; Ono, T.; Sato, A.; Hagishima, A.; Tanimoto, J. Seasonal Variation of Residential Cooling Use Behaviour Derived from Energy Demand Data and Stochastic Building Energy Simulation. J. Build. Eng. 2022, 49, 104067. [Google Scholar] [CrossRef]
- Mastrucci, A.; van Ruijven, B.; Byers, E.; Poblete-Cazenave, M.; Pachauri, S. Global Scenarios of Residential Heating and Cooling Energy Demand and CO2 Emissions. Clim. Change 2021, 168, 14. [Google Scholar] [CrossRef]
- Spinoni, J.; Barbosa, P.; Füssel, H.; McCormick, N.; Vogt, J.V.; Dosio, A. Global Population-weighted Degree-day Projections for a Combination of Climate and Socio-economic Scenarios. Int. J. Climatol. 2021, 41, 5447–5464. [Google Scholar] [CrossRef]
- Spinoni, J.; Vogt, J.; Barbosa, P. European Degree-day Climatologies and Trends for the Period 1951–2011. Int. J. Climatol. 2014, 35, 25–36. [Google Scholar] [CrossRef]
- Spinoni, J.; Vogt, J.V.; Barbosa, P.; Dosio, A.; McCormick, N.; Bigano, A.; Füssel, H. Changes of Heating and Cooling Degree-days in Europe from 1981 to 2100. Int. J. Climatol. 2017, 38, e191–e208. [Google Scholar] [CrossRef]
- Badescu, V.; Zamfir, E. Degree-Days, Degree-Hours and Ambient Temperature Bin Data from Monthly-Average Temperatures (Romania). Energy Convers. Manag. 1999, 40, 885–900. [Google Scholar] [CrossRef]
- Cartalis, C.; Synodinou, A.; Proedrou, M.; Tsangrassoulis, A.; Santamouris, M. Modifications in Energy Demand in Urban Areas as a Result of Climate Changes: An Assessment for the Southeast Mediterranean Region. Energy Convers. Manag. 2001, 42, 1647–1656. [Google Scholar] [CrossRef]
- Matzarakis, A.; Balafoutis, C. Heating Degree-days over Greece as an Index of Energy Consumption. Int. J. Climatol. 2004, 24, 1817–1828. [Google Scholar] [CrossRef]
- Büyükalaca, O.; Bulut, H.; Yılmaz, T. Analysis of Variable-Base Heating and Cooling Degree-Days for Turkey. Appl. Energy 2001, 69, 269–283. [Google Scholar] [CrossRef]
- Yildiz, I.; Sosaoglu, B. Spatial Distributions of Heating, Cooling, and Industrial Degree-Days in Turkey. Theor. Appl. Climatol. 2007, 90, 249–261. [Google Scholar] [CrossRef]
- Janković, A.; Podraščanin, Z.; Djurdjevic, V. Future Climate Change Impacts on Residential Heating and Cooling Degree Days in Serbia. Időjárás 2019, 123, 351–370. [Google Scholar] [CrossRef]
- Ürge-Vorsatz, D.; Khosla, R.; Bernhardt, R.; Chan, Y.C.; Vérez, D.; Hu, S.; Cabeza, L.F. Advances Toward a Net-Zero Global Building Sector. Annu. Rev. Environ. Resour. 2020, 45, 227–269. [Google Scholar] [CrossRef]
- Kennard, H.; Oreszczyn, T.; Mistry, M.; Hamilton, I. Population-Weighted Degree-Days: The Global Shift between Heating and Cooling. Energy Build. 2022, 271, 112315. [Google Scholar] [CrossRef]
- Sillmann, J.; Kharin, V.V.; Zwiers, F.W.; Zhang, X.; Bronaugh, D. Climate Extremes Indices in the CMIP5 Multimodel Ensemble: Part 2. Future Climate Projections. J. Geoph. Res. Atmos. 2013, 118, 2473–2493. [Google Scholar] [CrossRef]
- Merrifield, A.L.; Brunner, L.; Lorenz, R.; Medhaug, I.; Knutti, R. An Investigation of Weighting Schemes Suitable for Incorporating Large Ensembles into Multi-Model Ensembles. Earth Syst. Dyn. 2020, 11, 807–834. [Google Scholar] [CrossRef]
- Herger, N.; Abramowitz, G.; Knutti, R.; Angélil, O.; Lehmann, K.; Sanderson, B.M. Selecting a Climate Model Subset to Optimise Key Ensemble Properties. Earth Syst. Dyn. 2018, 9, 135–151. [Google Scholar] [CrossRef]
- Tebaldi, C.; Debeire, K.; Eyring, V.; Fischer, E.; Fyfe, J.; Friedlingstein, P.; Knutti, R.; Lowe, J.; O’Neill, B.; Sanderson, B.; et al. Climate Model Projections from the Scenario Model Intercomparison Project (ScenarioMIP) of CMIP6. Earth Syst. Dyn. 2021, 12, 253–293. [Google Scholar] [CrossRef]
- Chervenkov, H.; Slavov, K. NEX-GDDP Multimodel Ensemble vs. E-OBS—Evaluation of the Extreme Temperatures and Precipitation over Southeast Europe: Historical Comparison. Atmosphere 2022, 13, 581. [Google Scholar] [CrossRef]
- Chervenkov, H.; Malcheva, K. Extreme Heat Events over Southeast Europe Based on NEX-GDDP Ensemble: Present Climate Evaluation and Future Projections. Atmosphere 2023, 14, 1000. [Google Scholar] [CrossRef]
- Chervenkov, H.; Ivanov, V.; Gadzhev, G.; Ganev, K.; Melas, D. Degree-Day Climatology over Central and Southeast Europe for the Period 1961–2018—Evaluation in High Resolution. Cybern. Inf. Technol. 2020, 20, 166–174. [Google Scholar] [CrossRef]
- Ivanov, V.; Chervenkov, H.; Gadzhev, G.; Ganev, K. Degree-days and agro-meteorological Indices in the Projected Future Climate over Southeast Europe. In Proceedings of the SGEM International Multidisciplinary Scientific GeoConference EXPO Proceedings, Online, 1–5 December 2020. [Google Scholar] [CrossRef]
- Chervenkov, H.; Gadzhev, G.; Ivanov, V.; Ganev, K. Degree-Days and Agro-Meteorological Indices in CMIP5 RCP8.5 Future Climate—Results for Central and Southeast Europe. In Environmental Protection and Disaster Risks; Springer: Cham, Switzerland, 2021; pp. 19–30. [Google Scholar] [CrossRef]
- Thrasher, B.; Wang, W.; Michaelis, A.; Melton, F.; Lee, T.; Nemani, R. NASA Global Daily Downscaled Projections, CMIP6. Sci. Data 2022, 9, 262. [Google Scholar] [CrossRef]
- Eyring, V.; Bony, S.; Meehl, G.A.; Senior, C.A.; Stevens, B.; Stouffer, R.J.; Taylor, K.E. Overview of the Coupled Model Intercomparison Project Phase 6 (CMIP6) Experimental Design and Organization. Geosci. Model Dev. 2016, 9, 1937–1958. [Google Scholar] [CrossRef]
- Wood, A.W.; Leung, L.R.; Sridhar, V.; Lettenmaier, D.P.; Zhu, J.; Mearns, L.O.; Snyder, M.A.; Czajkowski, K.P.; Feng, J.; Harrison, P. Hydrologic Implications of Dynamical and Statistical Approaches to Downscaling Climate Model Outputs. Clim. Change 2004, 62, 189–216. [Google Scholar] [CrossRef]
- Park, T.; Hashimoto, H.; Wang, W.; Thrasher, B.; Michaelis, A.R.; Lee, T.; Brosnan, I.G.; Nemani, R.R. What Does Global Land Climate Look Like at 2 °C Warming? Earth’s Futur. 2023, 11, e2022EF003330. [Google Scholar] [CrossRef]
- Rao, K.K.; Al Mandous, A.; Al Ebri, M.; Al Hameli, N.; Rakib, M.; Al Kaabi, S. Future Changes in the Precipitation Regime over the Arabian Peninsula with Special Emphasis on UAE: Insights from NEX-GDDP CMIP6 Model Simulations. Sci. Rep. 2024, 14, 151. [Google Scholar] [CrossRef] [PubMed]
- Wu, F.; Jiao, D.; Yang, X.; Cui, Z.; Zhang, H.; Wang, Y. Evaluation of NEX-GDDP-CMIP6 in Simulation Performance and Drought Capture Utility over China–Based on DISO. Hydro. Res. 2023, 54, 703–721. [Google Scholar] [CrossRef]
- Jiang, F.; Wen, S.; Gao, M.; Zhu, A. Assessment of NEX-GDDP-CMIP6 Downscale Data in Simulating Extreme Precipitation over the Huai River Basin. Atmosphere 2023, 14, 1497. [Google Scholar] [CrossRef]
- Airiken, M.; Li, S.; Abulaiti, A.; Wang, Y.; Zhang, L. Prediction of Extreme Climate on the Tibetan Plateau Based on NEX-GDDP-CMIP6. Hum. Ecol. Risk Assess. 2023, 29, 1261–1275. [Google Scholar] [CrossRef]
- Cornes, R.C.; van der Schrier, G.; van den Besselaar, E.J.M.; Jones, P.D. An Ensemble Version of the E-OBS Temperature and Precipitation Data Sets. J. Geophys. Res. 2018, 123, 9391–9409. [Google Scholar] [CrossRef]
- Kotlarski, S.; Keuler, K.; Christensen, O.B.; Colette, A.; Déqué, M.; Gobiet, A.; Goergen, K.; Jacob, D.; Lüthi, D.; van Meijgaard, E.; et al. Regional Climate Modeling on European Scales: A Joint Standard Evaluation of the EURO-CORDEX RCM Ensemble. Geosci. Model Dev. 2014, 7, 1297–1333. [Google Scholar] [CrossRef]
- Center For International Earth Science Information Network-CIESIN-Columbia University. Gridded Population of the World, Version 4 (GPWv4): Population Count, Revision 11. 2018. Available online: https://cmr.earthdata.nasa.gov/search/concepts/C1597158029-SEDAC.html (accessed on 1 November 2024). [CrossRef]
- Gao, J. Global 1-Km Downscaled Population Grids, SSP-Consistent Projections and Base Year, v1.01 (2000–2100). 2020. Available online: https://dataverse.harvard.edu/dataset.xhtml?persistentId=doi:10.7910/DVN/TLJ99B (accessed on 5 November 2024). [CrossRef]
- Schulzweida, U. CDO User Guide. 2020. Available online: https://zenodo.org/records/5614769 (accessed on 1 March 2024).
- Mann, H.B. Nonparametric tests against trend. Econometrica 1945, 13, 245–259. [Google Scholar] [CrossRef]
- Kendall, M.G. A new measure of rank correlation. Biometrika 1938, 30, 81–93. [Google Scholar] [CrossRef]
- Sen, P.K. Estimates of the regression coefficient based on Kendall’s tau. J. Am. Stat. Ass. 1968, 63, 1379–1389. [Google Scholar] [CrossRef]
- Theil, H. A rank-invariant method of linear and polynomial regression analysis. I, II, III. Nederl. Akad. Wetensch. Proc. 1950, 53, 173. [Google Scholar]
Disclaimer/Publisher’s Note: The statements, opinions and data contained in all publications are solely those of the individual author(s) and contributor(s) and not of MDPI and/or the editor(s). MDPI and/or the editor(s) disclaim responsibility for any injury to people or property resulting from any ideas, methods, instructions or products referred to in the content. |
© 2025 by the authors. Licensee MDPI, Basel, Switzerland. This article is an open access article distributed under the terms and conditions of the Creative Commons Attribution (CC BY) license (https://creativecommons.org/licenses/by/4.0/).