Article

Analysis of the Relationship Between Microclimate and Building Energy Loads Based on Apartment Complex Layout Types

by
Sumin Lee
1,
Sukjin Jung
1 and
Seonghwan Yoon
2,*
1
Department of Architecture, Pusan National University, Geumjeong-gu, Busan 46241, Republic of Korea
2
Institute for Future Earth, Department of Architecture, Pusan National University, Geumjeong-gu, Busan 46241, Republic of Korea
*
Author to whom correspondence should be addressed.
Climate 2025, 13(3), 53; https://doi.org/10.3390/cli13030053
Submission received: 26 January 2025 / Revised: 20 February 2025 / Accepted: 27 February 2025 / Published: 3 March 2025

Abstract

:
This study provides fundamental data for optimal planning by analyzing key factors influencing microclimate and building energy loads. * to provide fundamental data for optimal planning. A total of 11 apartment layout types, including tower-type, flat-type, and mixed-type configurations, were analyzed using ENVI-met simulations. The results indicate that layout types significantly influence microclimate and energy consumption. Tower-type layouts enhanced wind flow, reducing surface temperatures and cooling loads. In contrast, dense flat-type layouts restricted airflow, leading to heat accumulation and increased cooling energy demand. Mixed layouts exhibited varied effects depending on the proportion of open spaces and high-density clusters. Additionally, south-facing layouts optimized solar radiation, reducing heating loads, whereas east–west-facing layouts experienced imbalanced solar exposure, increasing cooling demand by 15–20% in the summer. Horizontal parallel and staggered layouts improved ventilation efficiency and mitigated heat accumulation, making them effective strategies for enhancing microclimate and reducing energy consumption. This study confirms that apartment layout planning plays a crucial role in microclimate regulation and energy efficiency. The findings can guide architectural strategies to improve thermal comfort and reduce building energy consumption.

1. Introduction

Research Background

Fifty-five percent of the world’s population lives in urban areas (2018), and this proportion is expected to reach 68% by 2050 [1]. In urban areas, heat absorbed from the sun cannot be released due to artificial covering and increased greenhouse gases, and heat released by urban activities of overcrowded populations is causing various microclimate problems. In addition, as wind paths are blocked by overcrowded and high-rise buildings, heating and cooling usage increases, affecting the urban environment [2]. In Korea, the supply of apartment complexes continues to increase due to population growth. In 2022, more than 63.3% of apartment complexes were built as apartment-type apartment complexes [3], and a large supply is being made as the absolute majority of housing types in urban areas. Due to the increase in the supply of apartment complexes, more than 36% of energy consumption by industry in Korea is consumed [4]. As the demand for housing continues to grow, urban development strategies have increasingly focused on high-rise and high-density apartment complexes to maximize land-use efficiency. Recently, apartment complexes have been planned to be high-rise and dense, which is worsening the microclimate and increasing building energy consumption.
The effects on microclimate and building energy consumption were investigated using various strategies. Apartment complex layout plans affect not only building energy consumption but also external microclimate. In this study, since apartment complexes have a higher thermal density than other residential buildings due to their characteristics and consume a lot of energy in Korea, it is necessary to examine the microclimate and energy consumption load according to the layout type of the complex at the same time.

2. Literature Review

2.1. Apartment Layout Planning

Apartment layout types significantly influence wind path formation and ventilation performance. A CFD-based analysis revealed that tower-type layouts facilitate airflow and enhance ventilation efficiency, whereas plate-type layouts restrict wind circulation, potentially exacerbating heat accumulation. These findings highlight the importance of considering microclimate and energy efficiency in apartment complex designs [5]. A study analyzing the impact of apartment complex layout types on thermal environments and energy consumption examined representative apartment complexes in South Korea. The research focused on three major layout types: longitudinal (Longitudinal Layout), lateral (Lateral Layout), and dense (Dense Layout) configurations, evaluating their thermal performance and energy consumption patterns. Previous studies have utilized DesignBuilder V3.0, to assess key environmental parameters, including solar radiation exposure, ventilation efficiency, surface temperature variations, and heating and cooling loads. Seasonal simulations for summer and winter were conducted to quantify temperature fluctuations and energy demand differences across various layout types. Findings revealed that longitudinal layouts facilitated wind circulation, improving ventilation performance and reducing cooling loads. Conversely, dense layouts restricted airflow, leading to heat accumulation and an increase in both indoor and outdoor temperatures during the summer. Additionally, south-facing layouts optimized solar radiation utilization, effectively reducing heating demand in winter, whereas east–west-facing layouts exhibited imbalanced solar exposure, increasing cooling loads by 15–20% during summer. Based on these results, the study emphasized that to minimize the thermal and energy impacts of apartment layouts, it is essential to integrate open layout designs to facilitate ventilation pathways and optimize window placement to regulate solar radiation exposure effectively [6]. A study on apartment complex layout planning demonstrated that applying a genetic algorithm for optimization significantly enhanced daylight accessibility. The results showed a 15–30% increase in average daylight availability compared to conventional layouts, emphasizing the importance of proper building spacing and orientation for maximizing solar exposure [7]. This study examines how floor plan representations influence individuals’ preferences for apartments. The research investigates whether visual representations (floor plans) or textual descriptions have a greater impact on apartment evaluations and decision-making [8]. This study proposes a physics-inspired generative design framework for automated architectural space layout planning. The research introduces a novel approach that optimizes spatial arrangements in the early stages of architectural design using physics-based modeling and evolutionary optimization algorithms [9].

2.2. Urban Microclimate and Energy Consumption

A study analyzing 340 apartment complexes in Seoul using Landsat 8 satellite imagery found that areas with higher building density exhibited increased surface temperatures, whereas those with sufficient green space demonstrated significant cooling effects. Additionally, while mid- and high-rise apartment complexes tend to retain heat, beyond a certain height, improved wind circulation can mitigate temperature rise [10]. A CFD-based study on heat wave conditions analyzed the cooling effects of green spaces and piloti structures. The results indicated that increased green space coverage effectively reduces surface temperatures, while open piloti structures enhance air circulation, mitigating heat accumulation [11]. A study analyzing apartment complexes planned between 2005 and 2010 proposed design guidelines for mitigating urban heat island effects. The findings revealed that higher green space ratios effectively reduced surface temperatures, while open-layout arrangements improved airflow and enhanced cooling effects. Additionally, the use of high-albedo materials and permeable pavement significantly decreased heat accumulation [12]. A study analyzing the Sinchun area of Daegu examined the impact of apartment complex layout types on wind environment and ventilation performance. CFD simulations revealed that open layouts facilitate airflow, reducing air stagnation and enhancing ventilation efficiency. Conversely, dense layouts obstruct wind paths, leading to increased air stagnation and potential particulate matter accumulation. Notably, longitudinal layouts were found to be more effective in forming major ventilation paths compared to lateral layouts [13]. A study analyzing the impact of building layout types on thermal environments found that longitudinal layouts facilitate wind flow and improve ventilation efficiency, whereas dense layouts obstruct airflow, leading to heat accumulation and increased indoor and outdoor temperatures. Additionally, south-facing layouts optimized solar radiation for heating efficiency, while east–west-facing layouts exhibited a tendency for higher cooling loads in summer due to uneven solar exposure [14]. A study analyzing the impact of apartment complex layout types on wind flow and ventilation performance found that open layouts facilitate airflow and improve ventilation efficiency, contributing to better indoor and outdoor thermal conditions. In contrast, dense layouts obstruct wind flow, leading to air stagnation and increased heat accumulation in certain areas. Notably, longitudinal layouts were found to be more effective in forming primary ventilation paths and enhancing urban microclimate conditions [15]. A study conducted in severe cold regions of China analyzed the impact of building layout types on pedestrian-level wind conditions and perceived temperatures. CFD simulations indicated that high-density high-rise areas exhibit air stagnation and lower perceived temperatures due to wind-blocking effects, while open layouts facilitate airflow, potentially causing strong winds at the pedestrian level. The findings highlight the necessity of wind buffering and dispersion strategies to improve pedestrian comfort in cold urban environments [16]. A study assessing heating and cooling energy consumption in passive technology-applied apartments found that using high-performance insulation and triple glazing can reduce energy consumption by 20–30%. Additionally, effective natural ventilation strategies help lower cooling loads in the summer, and optimizing window orientation plays a crucial role in energy savings [17]. A study comparing heating and cooling energy demand in passive house apartments found that top-floor and corner units exhibited the highest energy consumption due to greater exposure to external conditions, whereas central units benefitted from insulation effects and had the lowest energy demand. Despite the application of passive house design, energy differences between units remained, highlighting the need for enhanced insulation and optimized window placement in top-floor and corner units [18]. A study analyzing the impact of apartment building types on heating and cooling energy consumption and outdoor cooling effects found that tower-type buildings facilitate wind circulation, reducing cooling loads, whereas plate-type buildings, due to their high density, restrict airflow and increase outdoor temperatures. Additionally, open-layout arrangements were shown to positively contribute to urban heat island mitigation [19]. A study analyzing the impact of apartment house types on cooling and heating loads found that plate-type apartments exhibited increased cooling loads due to greater heat loss, whereas tower-type apartments benefitted from improved air circulation, leading to reduced cooling demand. Additionally, south-facing layouts optimized solar radiation for heating efficiency, while east–west-facing layouts showed a tendency for increased cooling loads in summer [20].

3. Materials and Methods

3.1. Research Purpose and Method

This study examined common apartment complex layouts in Korea and investigated the correlation between microclimate composition and building energy load to establish a foundation for optimal planning from both viewpoints. Based on previous research (Lee et al., 2010), apartment complex layout types constructed between 1966 and 2009 were selected, utilizing 11 layout types, including tower-type, plate-type, and mixed-type arrangements [6]. The microclimate simulation tool ENVI-met (ENVI-met GmbH, Essen, Germany) was employed for the chosen situations.
To investigate the microclimate composition and building energy load according to the layout type of apartment houses, this study drew results by planning and simulating the layout type and building shape based on existing literature. In this study, we analyzed 11 cases and derived key microclimate indicators, including air temperature (Ta), mean radiant temperature (TMRT), wind speed (WS), and physiological equivalent temperature (PET). These indicators are widely recognized as essential for evaluating biological climate conditions in urban environments. Ta represents the ambient air temperature, TMRT accounts for the combined effects of solar and infrared radiation, WS influences convective heat exchange, and PET quantifies human thermal perception by integrating multiple microclimatic factors. Additionally, the unit energy consumption data from Lee et al. (2010) were utilized for the energy consumption analysis [6]. The previous study estimated and evaluated energy consumption variations based on layout configurations, and these findings were further extended by analyzing the relationship between layout types and microclimate conditions. To achieve this, ENVI-met simulations were conducted to quantitatively assess the impact of microclimate factors on energy consumption.
Figure 1 shows an overview of the study.

3.2. Study Area

This study focuses on Seoul, South Korea, and analyzes 11 representative apartment complexes constructed between 1966 and 2009. As the capital and largest city of South Korea, Seoul has a high population density and rapid urbanization, resulting in diverse apartment layout types. The selected apartment complexes are distributed across major administrative districts, allowing for an analysis of variations in urban environments and residential patterns.
Apartments in Seoul have evolved into a dominant residential form in high-density urban environments. With urban development centered around the Han River, tower-type apartments have become the predominant housing type. While some areas still maintain traditional slab-type layouts, high-rise mixed-use apartments have become increasingly common in new town developments and redevelopment projects.
To provide a clearer spatial understanding of the study area, Figure 2 illustrates the distribution of the 11 selected apartment complex types across Seoul. Additionally, images representing the layout of each case study are presented.
Seoul has a temperate monsoon climate, characterized by hot and humid summers, which significantly contribute to the urban heat island (UHI) effect. This study aims to analyze the impact of apartment layouts on urban microclimate and energy consumption in Seoul. The findings of this research can serve as a valuable reference for future residential planning and apartment layout optimization, ultimately contributing to the improvement of Seoul’s urban living environment.

3.3. Case Selection

The building types are flat type and tower type; flat type is set as four-unit combination and tower type is set as four-unit combination with double wing type. The exclusive area per household is 85 m2. The floor area ratio is set to be approximately 200% of the standard of the second general residential area. The spacing between buildings is 1H, 1/2H for the north direction, and 1/2H from the center line of the road for the main building facing the road. It is set to be separated by 10 m or more from the property boundary line [6]. The key features of the 11 apartment layout types are presented in Table 1. These complexes exhibit distinct characteristics in building height, floor area ratio, wall area, and height-to-building area ratio, which were analyzed to compare the impact of apartment layout types on microclimate and energy consumption. The 11 selected apartment complexes exhibit differences in building height, and their impact on microclimate and energy consumption was analyzed accordingly. To minimize the influence of building height differences on the study results, all cases were maintained with the same floor area ratio (FAR), and energy consumption was compared based on unit energy consumption per area.
Figure 3 shows 11 case modeling images. CASE 1 is a south-facing, flat-shaped parallel layout, CASE 2 is a south-facing layout with a tower-type outer mixed layout, CASE 3 is a south-facing, flat-shaped staggered layout, CASE 4 is a south-facing, flat-shaped outer mixed layout, CASE 5 is a flat-shaped clustered layout, CASE 6 is a mixed clustered layout, CASE 7 is an east-facing, flat-shaped parallel layout, CASE 8 is a tower-type main building staggered layout, CASE 9 is a flat-shaped main building staggered layout, CASE 10 is a mixed main building staggered layout, and CASE 11 is a flat-shaped horizontal diagonal/clustered layout.

3.4. 3D Microclimate Model

ENVI-met is a three-dimensional computational fluid dynamics non-static model. It can simulate all elements of the urban environment, including surfaces, atmosphere, and vegetation, and predict and simulate the outdoor thermal comfort index. ENVI-met calculates the dispersion of air pollutants by using the Eulerian approach and the Reynolds-averaged Navier–Stokes (RANS) standard k-ε model [21]. It focuses on urban microclimate simulations, evaluating strategies to mitigate the urban heat island effect, such as green spaces and high-reflectivity materials, and simulating air temperature, radiant temperature, and plant cooling effects, making it suitable for urban thermal environment design and management [22].
Table 2 shows the simulation model and boundary conditions. The hottest period was selected (13 August 2024), and the weather data were utilized from the Automated Synoptic Observing System (ASOS) [23], provided by the Korea Meteorological Administration (KMA) National Climate Data Center. ASOS data were selected for this study due to its reliability, real-time updates, and comprehensive meteorological parameters, including temperature, humidity, wind speed, and solar radiation. To ensure accuracy, data from the nearest ASOS station to the study site were used, minimizing discrepancies between observed and actual conditions. ASOS data are widely utilized in microclimate and urban heat island research, making it a suitable source for this simulation. However, as ASOS data represent regional-scale conditions rather than site-specific microclimates, the ASOS meteorological data were used as input variables for the ENVI-met simulation, and microclimate analysis was conducted considering air temperature, wind speed, wind direction, relative humidity, and indoor building temperature. Temperature, wind speed, wind direction, relative humidity, and building indoor temperature information were entered. The total simulation time was set to 24 h. The modeling analysis location was selected as Seoul, South Korea, which has a high population density and concentrated artificial cover and artificial heat (Latitude 37.57°, Longitude 126.98°). The land area commonly applied to each case is 293.5 × 333.9 m. In the modeling, the building was planned with concrete and land with asphalt. The albedo and heat capacity of walkways and road pavement were adjusted, and open boundary conditions were applied in the boundary condition settings.

Validation of ENVI-Met Simulation

To evaluate the accuracy of the ENVI-met microclimate simulation, we conducted a comparative analysis using meteorological data from the Korean Meteorological Administration (KMA). The observed and simulated temperature values were compared at four different time points (06:00, 12:00, 15:00, and 20:00) on 13 August 2024.
The statistical validation results are as follows: Mean Absolute Error (MAE): 1.30 °C, Root Mean-Squared Error (RMSE): 1.60 °C, and Coefficient of Determination (R2): 0.718.
These values indicate that the ENVI-met model provides a reasonable estimation of urban temperature variations. The model captures general temperature trends well, but minor discrepancies were observed, particularly in the midday period, where the simulated temperature was slightly overestimated. This can be attributed to differences in surface material thermal properties and model assumptions regarding solar radiation absorption.
Overall, the validation results demonstrate that ENVI-met is a reliable simulation tool for urban climate analysis, making it suitable for further assessment of pedestrian comfort and building energy consumption.

3.5. Building Energy Simulation
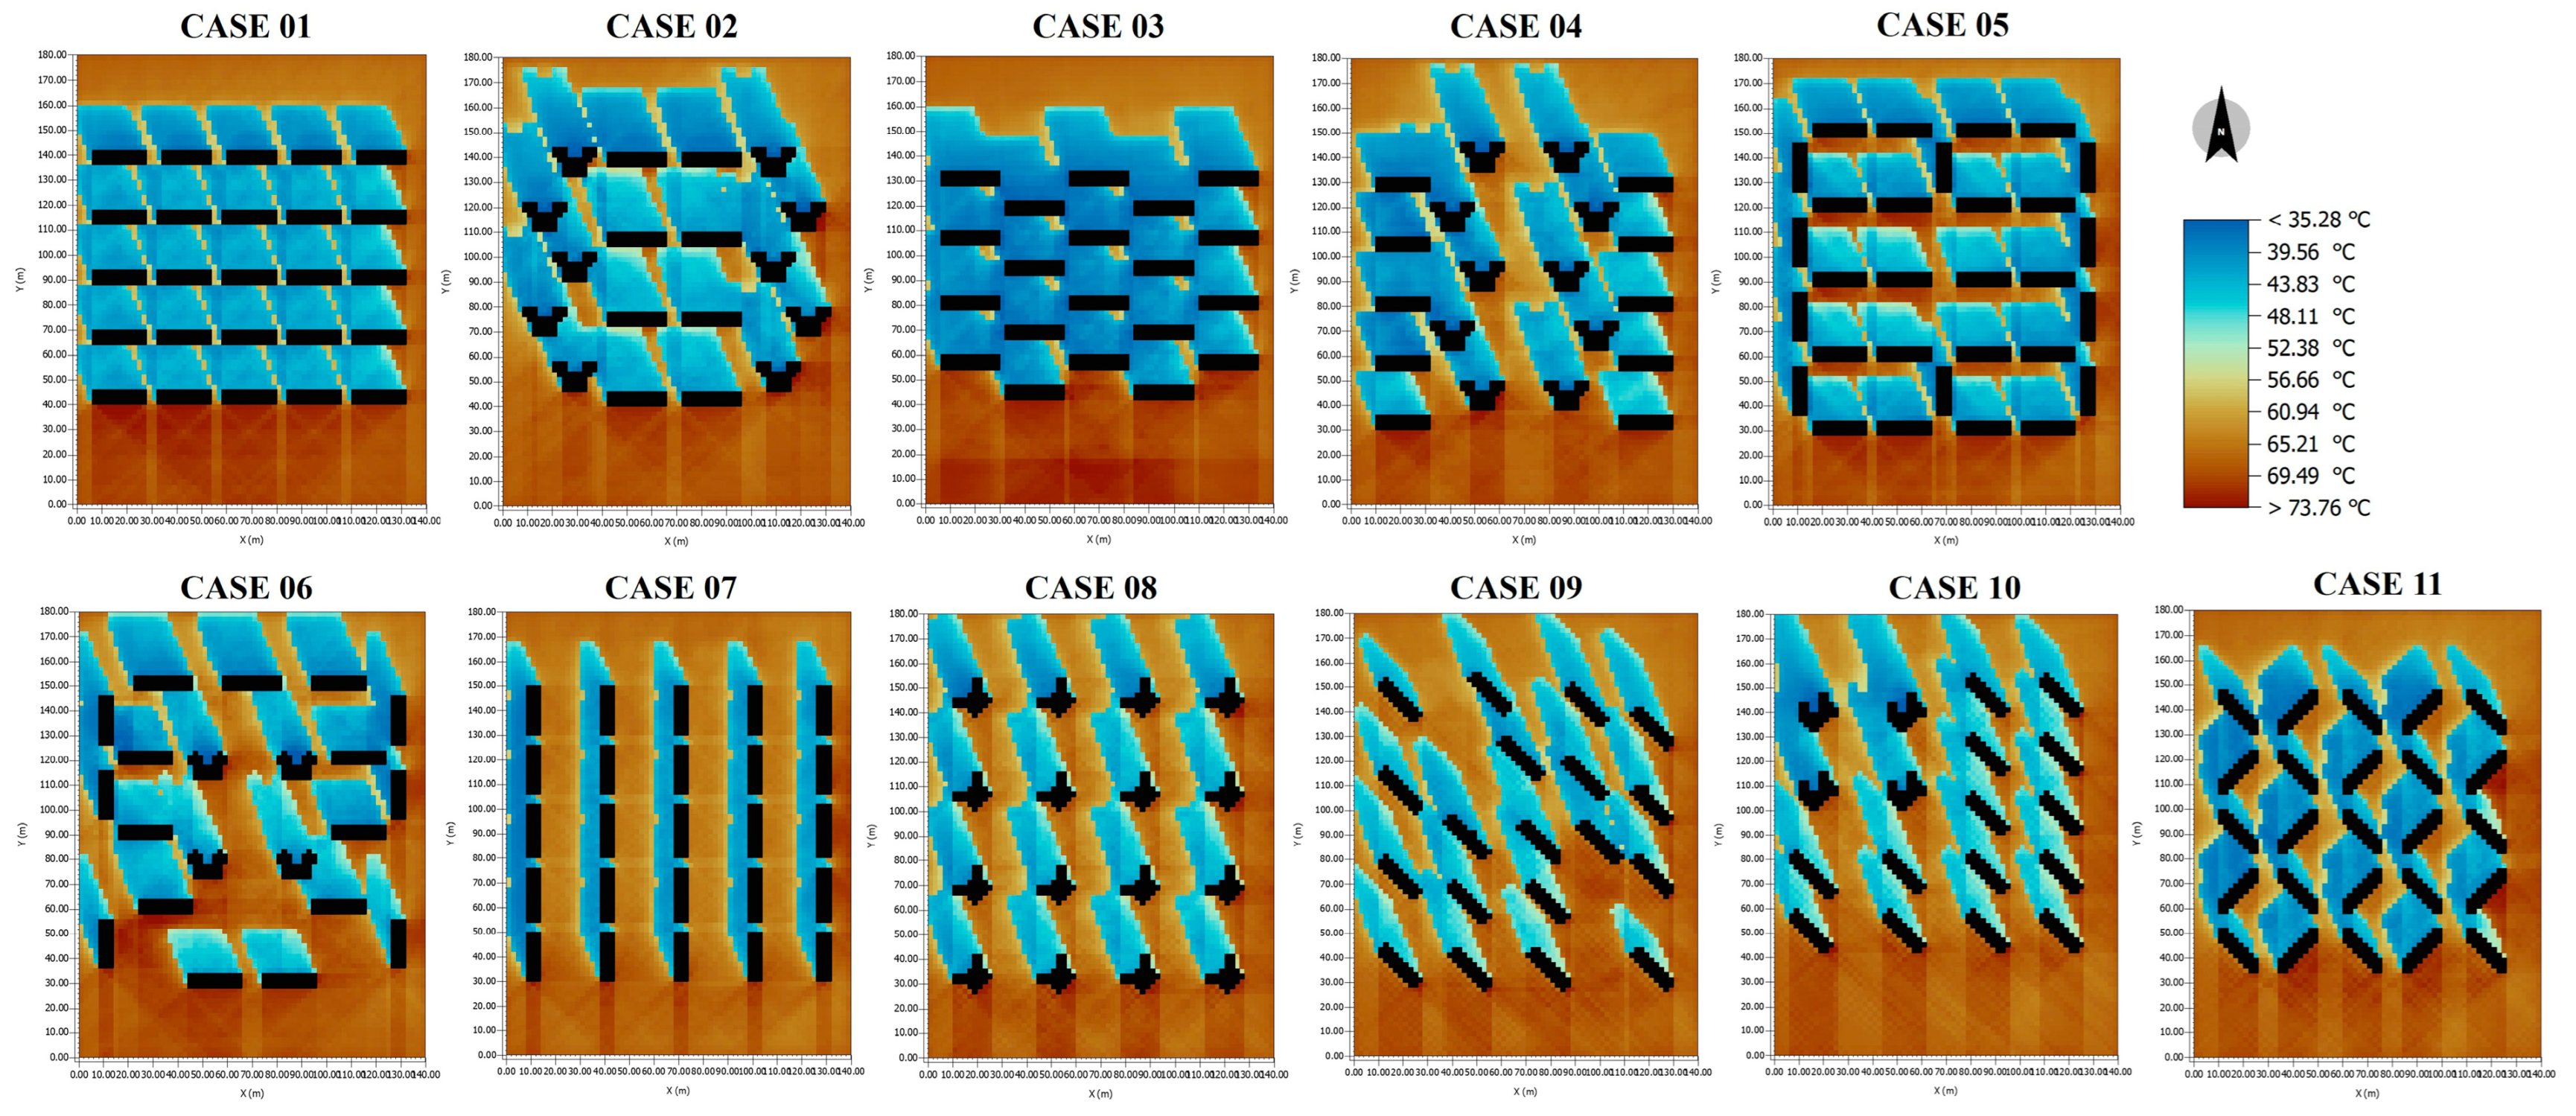
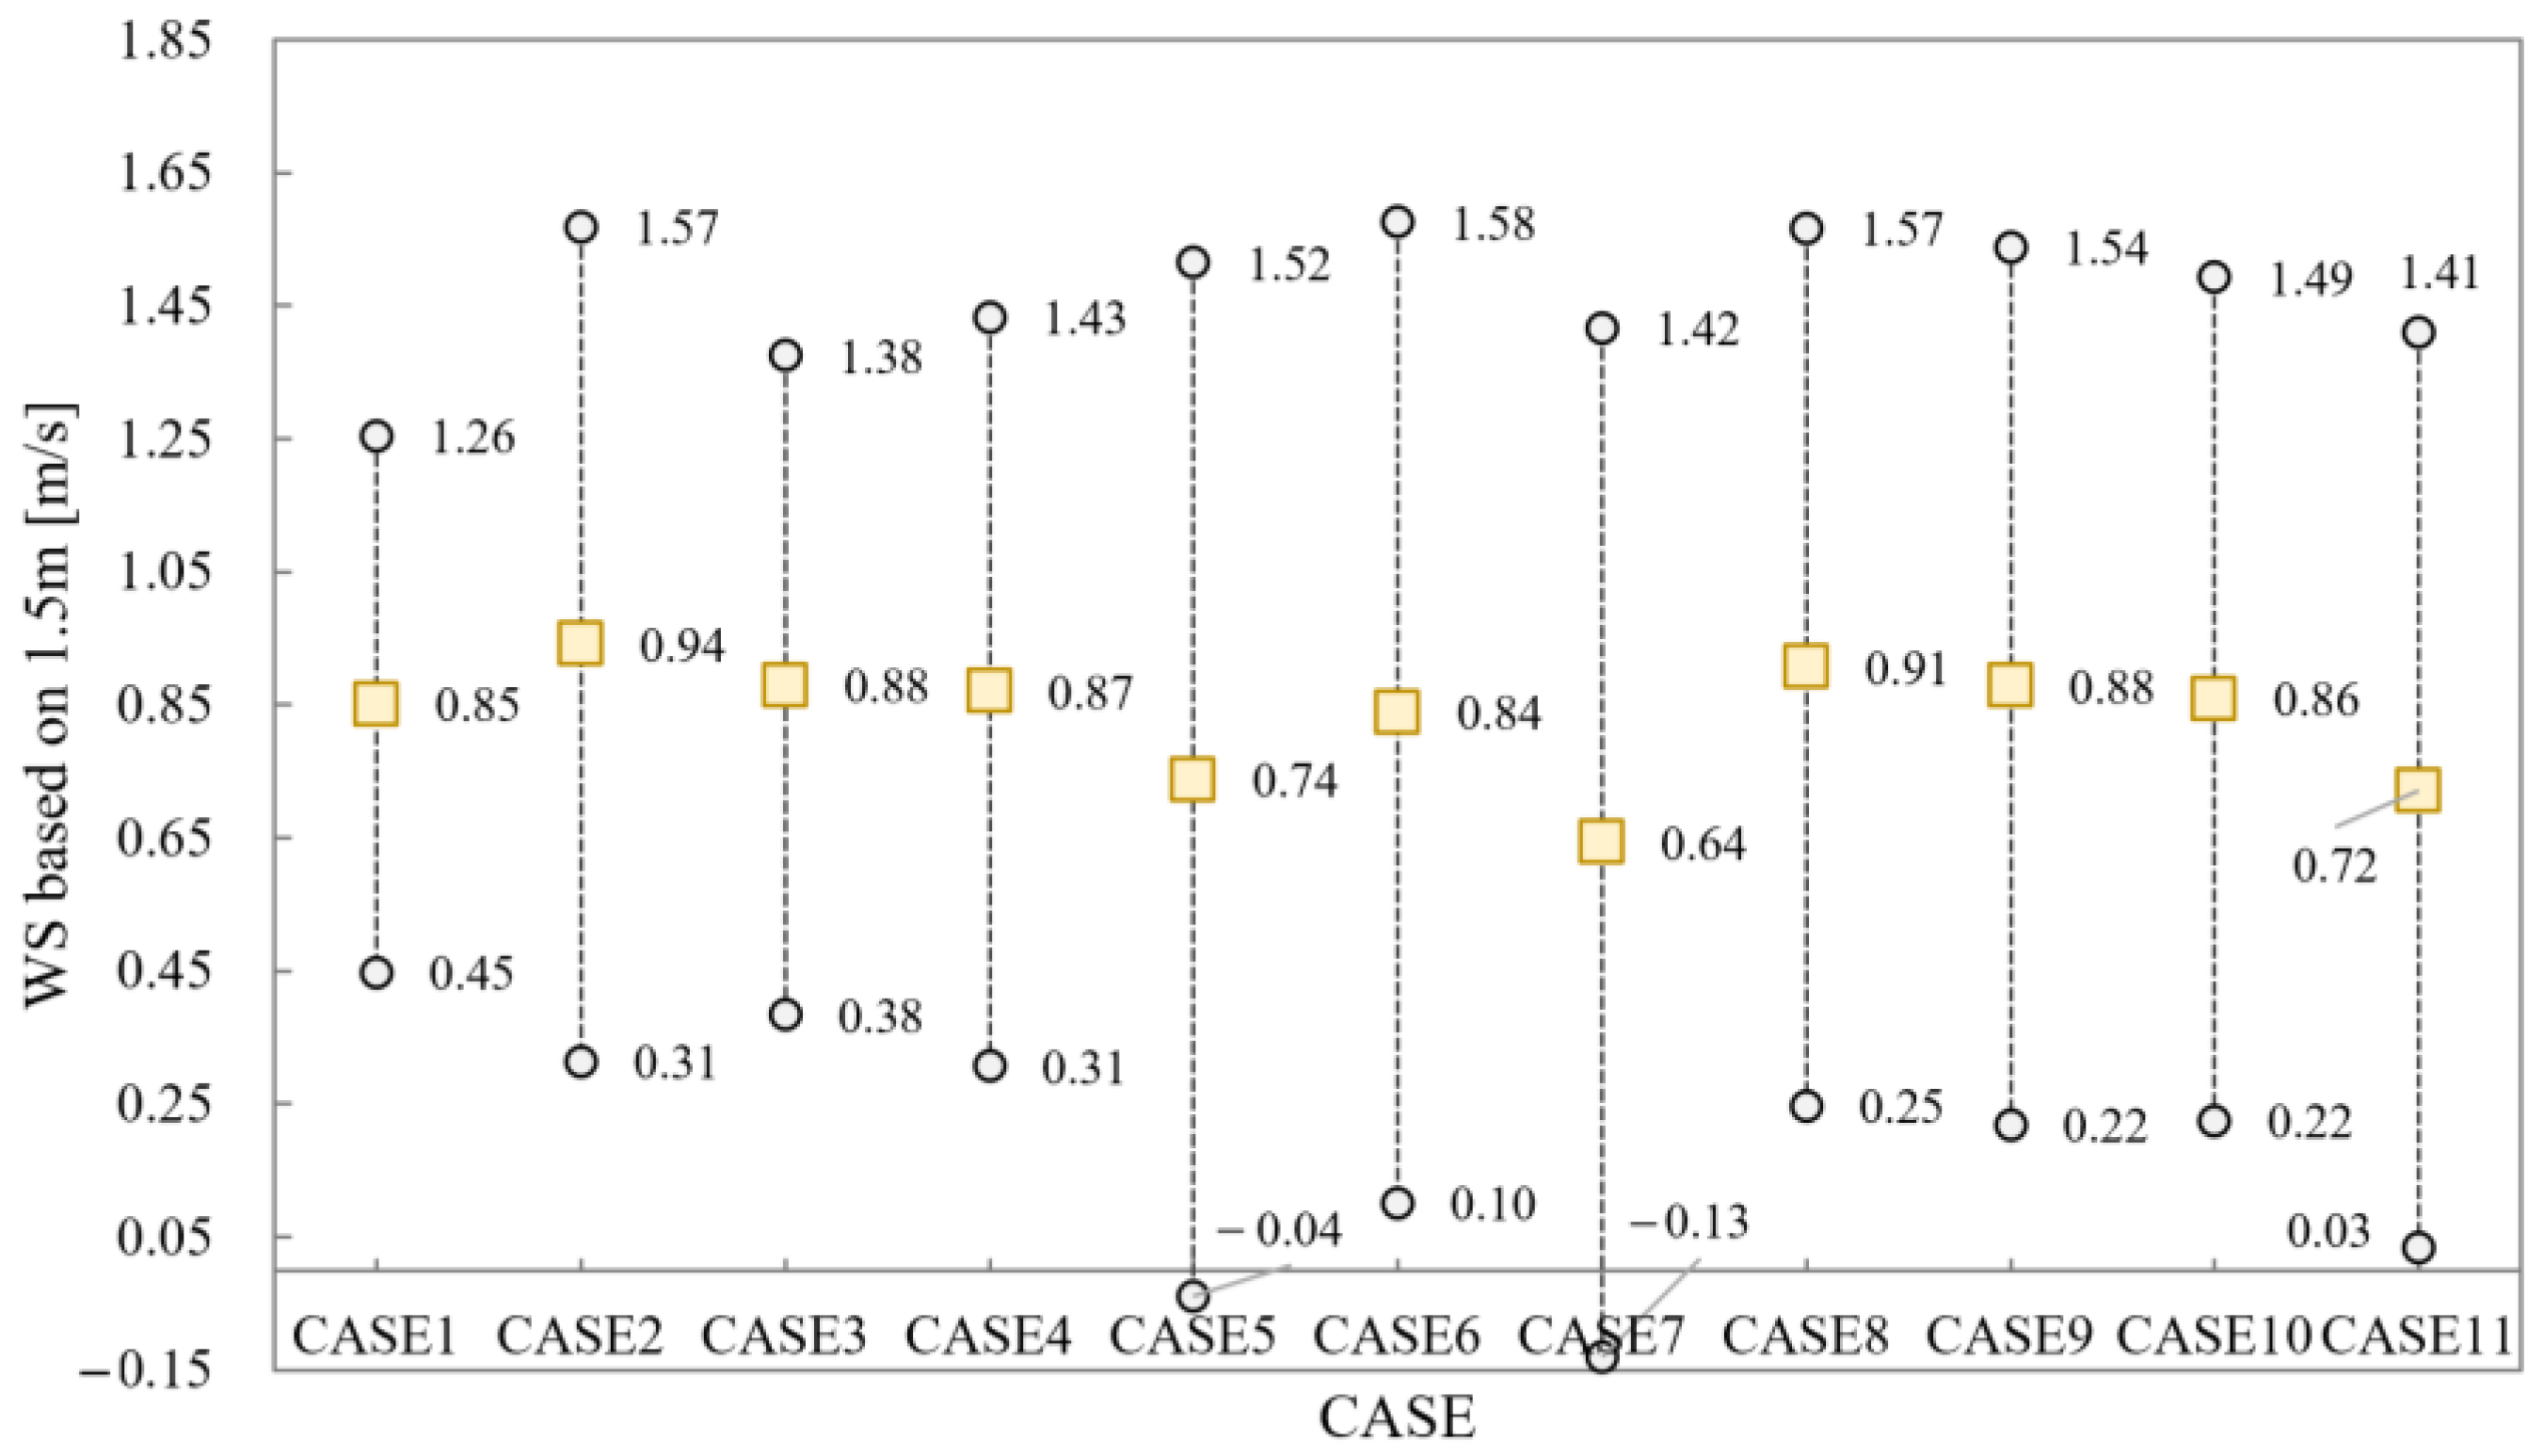
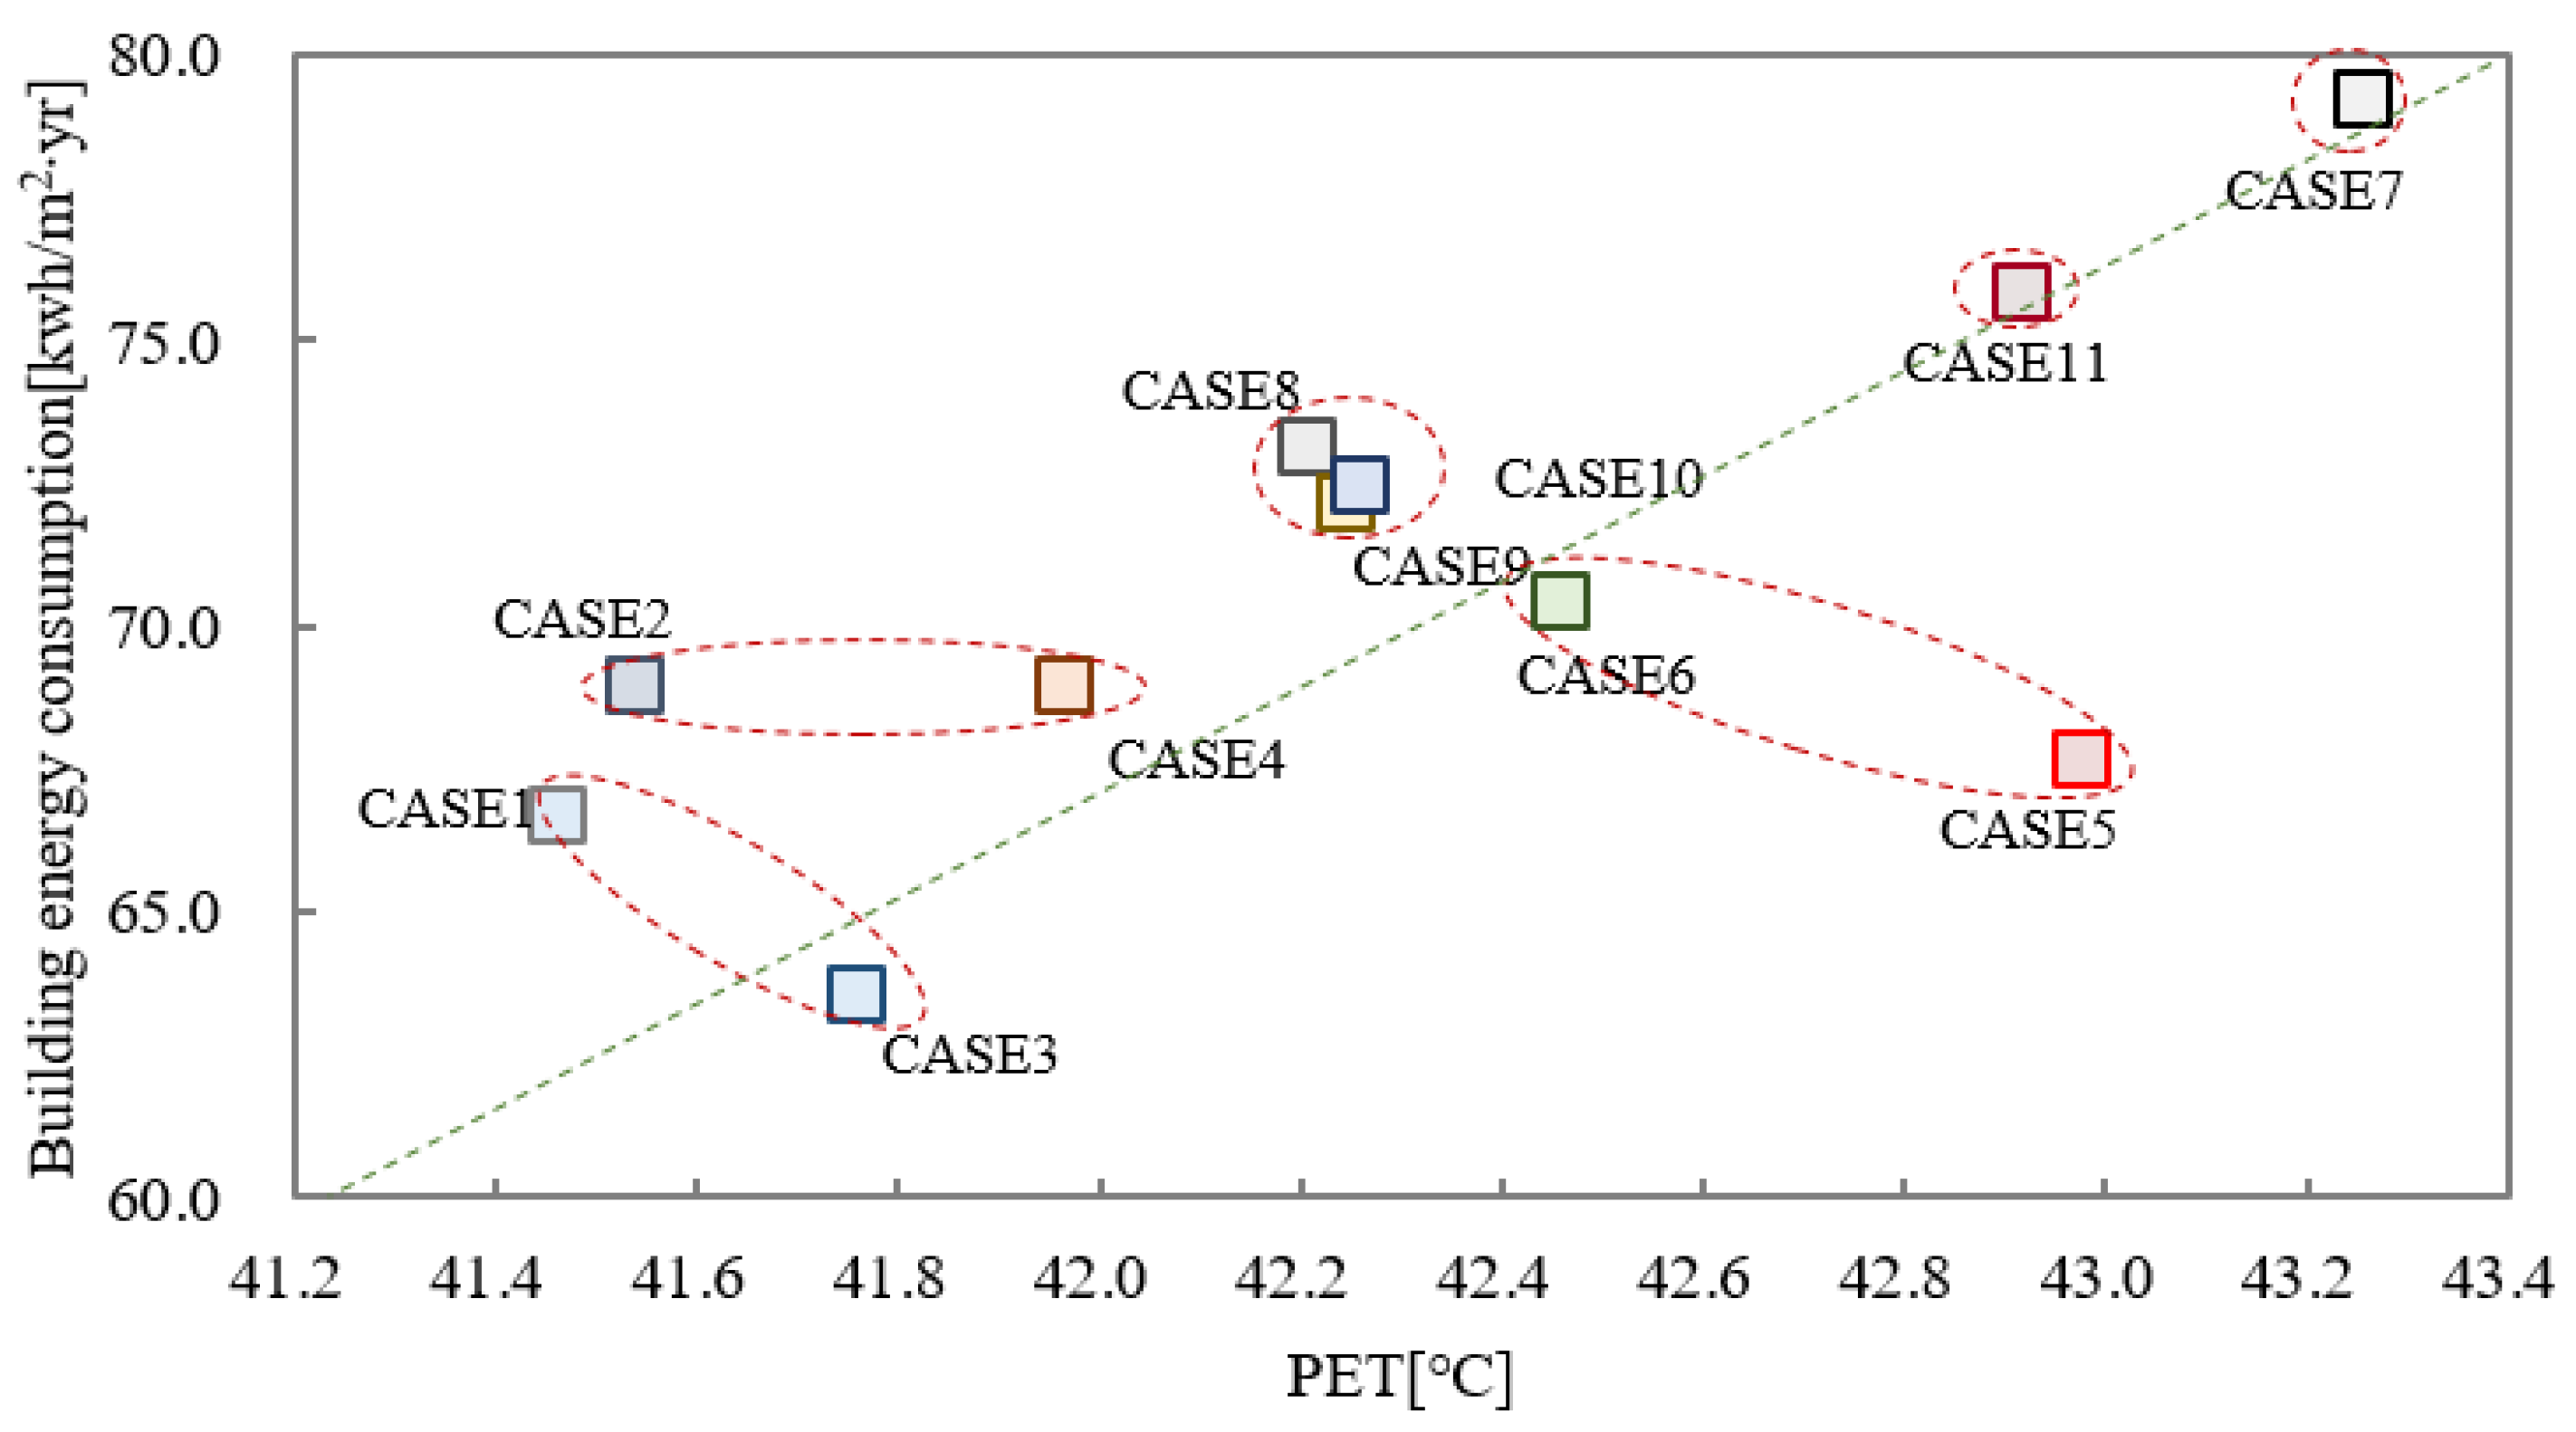
DesignBuilder uses the dynamic building energy simulation engine, EnergyPlus, to model energy flows such as heating and cooling [24]. This program incorporates data from LEED and ASHRAE 90.1 and provides researchers with a Python V2.7 scripting API to define custom parameters. It also allows users to visualize buildings in 3D for program development. DesignBuilder has been validated according to the EN ISO 13790 standard [25], ASHRAE, and EnergyPlus energy calculation standards [26].
The modeling height was 2.9 m, and the walls and windows were planned to exceed the central region energy conservation design standards, and the heat transmittance value was determined [6]. Table 3 shows the thickness and thermal transmittance information for each part of the modeling exterior.

4. Results

This is the result of seeking a microclimate and building energy reduction plan according to the layout type of apartment complex. The analysis time zone was selected as 06:00 (before sunrise), 12:00 (highest solar radiation), 15:00 (highest temperature), and 20:00 (after sunset). Using simulation, Ta and TMRT, WS, and PET based on 1.5 m were derived as microclimate-related results for 11 cases. The building energy load was utilized using existing literature results [6].
Figure 4 shows the Ta results for the analysis time zones (06:00, 12:00, 15:00, and 20:00) in a stock chart. The Ta results are the average of the results corresponding to the analysis time zone. The case with the highest average is 11, which is a flat-shaped horizontal diagonal/clustered arrangement (average 33.70 °C). On the other hand, the case with the lowest average is 1, which is a flat-shaped parallel arrangement facing south (average 33.51 °C). There is a difference of approximately 0.19 °C. The case with a wide temperature distribution range is 1, which shows a range of 1.56 °C. The case with a narrow temperature distribution range is 7, which shows a range of 0.93 °C. The flat-shaped type has a high building frontal area index, which means that if it is arranged in a closed type, it can have a negative effect on reducing the external temperature [10]. As a result of comparing the averages of CASE 1 and 8, CASE 8 is 0.06 °C higher than 1. It is judged that the flat type shows a low-temperature distribution because many areas of sunlight are formed on the ground surface. Since the residential building shape of the tower type has an uneven shape, the area receiving sunlight is not greatly reduced, so it seems that the concrete surface with high heat storage performance maintains a high temperature and affects the temperature. Figure 5 shows the Ta results for each case at 12:00.
Figure 6 shows the average results for TMRT at a height of 1.5 m for the analysis time zones (06:00, 12:00, 15:00, and 20:00) as a stock chart. The case with the highest average is 6, which shows a difference of 0.93 °C from the lowest case, 5 (the average of CASE 6 is 42.89 °C). It is judged that the tower-type arrangement type reduces outdoor thermal comfort because the area receiving the same time zone’s insolation is larger than the flat-type arrangement type. CASE 5 is a flat-type cluster-type arrangement type, and the flat-type with a large building shade area is arranged in a cluster type, showing high outdoor thermal comfort due to building shading. It can be seen that this is effective in alleviating the heat island phenomenon [12]. In addition, the case with a wide TMRT distribution range is CASE 3, which shows a temperature distribution range of 11.55 °C. In addition, the case with a narrow TMRT distribution range is CASE 7, which shows a gap of 8.34 °C. In terms of building types, a tower type with a lower building frontal area index than a flat type contributes to reducing the ground temperature by facilitating the flow of wind and air. In the case of arranging a flat type, it is judged that an open type rather than a closed type should be arranged considering the wind path to be effective in reducing the temperature. Figure 7 shows the TMRT images for each case corresponding to 12:00.
Figure 8 shows the wind speed change based on the height of 1.5 m at 10:00, which is close to the average wind speed of the simulation analysis date, as a stock chart. The highest average value is CASE 2, which shows 0.94 m/s. It was observed that the Venturi effect occurred between the flat-type and the tower-type, which increased the flow speed [5]. Next, it can be seen that the type composed of only the tower type has a higher flow speed than the flat-type arrangement type [13]. CASES 5 and 11, which are cluster arrangements, are arranged vertically and horizontally, showing a phenomenon in which the wind flow stagnates compared to the surrounding area. CASE 5 is an arrangement type that is disadvantageous in terms of ventilation planning because it has a high active blocking ratio according to the four sides. CASE 7 shows the lowest average wind speed in the north–south wind direction. It can be seen that the wind does not flow into the interior of the complex. CASE 8 consists of clusters, which are open-space units inside and outside the complex and have better ventilation conditions than other arrangement types. Figure 9 shows the WS images for each case corresponding to 12:00.
Figure 10 shows the relationship between building energy consumption and PET according to the layout type of the apartment complex. The PET results for the analysis time zones (06:00, 12:00, 15:00, and 20:00) were averaged, and the building energy consumption is the annual energy consumption per unit area [6]. It means that cases closer to the Y-axis range, based on the dashed line, have a greater impact on building energy consumption, while cases closer to the X-axis range have a greater impact on PET.
The cases above the diagonal line show higher building energy consumption compared to PET, whereas the cases below the diagonal line show higher PET compared to building energy consumption. For instance, CASE 5 features a closed cluster layout with vertical and horizontal configurations and a high building frontal area index characteristic of a flat-shaped residential building shape. This results in wind stagnation compared to surrounding areas. Consequently, the reduced ground surface cooling effect leads to higher PET relative to building energy consumption. On the other hand, CASES 1 and 2 show higher building energy consumption compared to PET. This is observed to be due to the parallel layout type with consistent spacing between buildings, which affects wind flow speed. However, the area exposed to solar radiation does not decrease due to the spacing between buildings, suggesting that building thermal storage impacts energy consumption. Examining the various cases highlights the importance of wind corridor planning based on building form and layout.
CASES 1 and 3 show lower building energy consumption and PET results compared to other cases. The main building form and layout type are flat type, parallel layout, and staggered layout. Next are mixed (flat-type, tower-type) parallel layout and staggered layout types (CASES 2 and 4); flat-type, tower-type clustered main building layouts (CASES 5 and 6); main building staggered layout (CASES 8, 9, and 10); and flat-type horizontal diagonal/clustered layout (CASE 11). CASE 7 shows the highest building energy consumption and PET results, and it is composed of a flat-type parallel layout oriented toward the east. It can be confirmed that there are differences in building energy usage and PET depending on the residential building type, orientation, and layout. In addition to the solar gain, it was confirmed that the combined orientation and residential building type have a complex effect. The layout types that can improve the microclimate and reduce the building energy consumption are considered to be the horizontal parallel and staggered layout types. Figure 11 shows the PET images for each case corresponding to 12:00.

5. Summary of Findings

In this study, the impact of microclimate and building energy loads was analyzed for 11 apartment complexes in Seoul.
The key findings of the study can be summarized as follows.
  • Impact of Apartment Layout Types on Microclimate:
    • Tower-type Layout: Facilitates airflow, contributing to lower surface temperatures. The relatively open structure enhances wind circulation.
    • Dense Flat-type Layout: The narrow spacing between buildings obstructs wind flow, leading to increased heat accumulation in outdoor spaces.
    • Mixed Layout: A combination of tower-type and flat-type layouts; while certain areas exhibit smooth airflow, high-density regions tend to experience heat accumulation.
  • Building Orientation and Energy Load:
    • Energy consumption and PET were found to vary depending on building orientation and layout.
    • South-facing layouts effectively utilize solar radiation, whereas east–west-facing layouts experience uneven solar exposure, which can lead to an increase in energy load.
  • The Role of Open Spaces:
    • Larger open spaces facilitate smooth wind circulation, reducing heat accumulation.
  • Relationship Between Building Density and Wind Flow:
    • High-density building layouts tend to obstruct wind flow, increasing the likelihood of air stagnation.
    • Tower-type layouts, with relatively wider building spacing, help enhance airflow.
  • Practical Applications:
    • Apartment layout types and orientation should be carefully considered in urban planning and architectural design to simultaneously enhance energy efficiency and microclimate conditions.
    • Securing open spaces can help mitigate the urban heat island effect and improve the residential environment within apartment complexes.

6. Discussion

This study confirms the impact of apartment complex layout types on urban microclimate and building energy loads.
First, tower-type layouts facilitate airflow, contributing to lower surface temperatures.
In contrast, dense flat-type layouts obstruct wind flow, leading to increased heat accumulation in outdoor spaces. These findings align with previous studies on urban heat island effects and passive cooling strategies, confirming that open layout strategies help mitigate heat accumulation, while dense layouts exacerbate thermal stress [11,12,13,26]. Additionally, our results contribute to ongoing discussions on urban planning and building energy efficiency by providing a quantitative analysis of apartment layout impacts on microclimate and energy consumption.
Second, the results highlight that building orientation and open spaces play a crucial role in microclimate regulation. South-facing layouts effectively utilize solar radiation, while east–west-facing layouts experience uneven solar exposure, which can result in increased energy loads.
Third, a limitation of this study is its reliance on simulation results rather than measured data.
Future research should incorporate actual measurements to validate and refine simulation outcomes, as well as assess applicability under various climatic conditions.
Additionally, incorporating green spaces and detailed material properties into the model can enhance the accuracy of results. This study provides a quantitative analysis of the effects of apartment complex layouts on urban microclimate and building energy consumption.
The findings can serve as a valuable reference for urban residential planning and architectural design, contributing to the development of more sustainable and energy-efficient housing strategies.

7. Conclusions

This study selected the layout type of apartment complexes and conducted simulations on 11 selected cases. By analyzing the relationship between microclimate and building energy load, it aims to provide basic data for complex layout planning.
As a result of Ta by layout type, the case with the lowest horizontal temperature at a height of 1.5 m is the flat-type parallel layout (CASE 1), and the case with the highest temperature is the flat-type horizontal diagonal/cluster layout (CASE 11). CASE 1 is approximately 0.19 °C lower. CASE 1 has a wide temperature distribution range, showing an interval of 1.56 °C. It was found that the flat type shows a low-temperature distribution due to the formation of many indirect areas on the ground, and that if it is arranged in a closed manner, it can have a negative effect on reducing the external temperature. It was found that the residential buildings of the tower type maintain a high temperature due to their uneven shape.
As a result of TMRT by layout type, the case with a low average radiant temperature based on a height of 1.5 m was the flat-type cluster layout type (CASE 5), and it was found that outdoor thermal comfort was improved by arranging the flat type with a wide building shaded area in a cluster type. The case with a high TMRT was the mixed cluster layout (CASE 6), and it was judged that the tower-type layout type was insufficient in improving outdoor thermal comfort because the area receiving simultaneous solar radiation was larger than that of the flat type. The case with a wide TMRT distribution range was CASE 3, showing a temperature distribution range of 11.55 °C, and the case with a narrow TMRT distribution range was CASE 7, showing an interval of 8.34 °C.
As a result of WS by layout type, the case with the highest average wind speed was the outer mixed layout type (CASE 2) with a south-facing layout, showing 0.94 m/s. It is judged that the flow speed increases due to the Venturi effect between the flat type and tower type. CASES 5 and 11, which are cluster layouts, are arranged vertically and horizontally, showing a phenomenon in which the wind flow stagnates compared to the periphery. CASE 7 shows the lowest average wind speed in the north–south wind direction. It can be seen that the wind is not flowing into the interior of the complex. CASE 8 is a layout consisting of a tower type, and it can be seen that the flow speed is higher than that of the flat-type layout.
In terms of the relationship between PET and building energy load by layout type, CASES 1 and 3 show lower building energy consumption and PET results than other cases. The main building shapes and layout types are flat-shaped, parallel layout, and staggered layout. The case with higher building energy consumption and PET results is a flat-shaped horizontal diagonal/clustered layout (CASE 11). It can be confirmed that there are differences in building energy usage and PET depending on the residential building shape, orientation, and layout. In addition to solar gain, it was confirmed that the combined orientation and residential building shape have a complex effect. It is determined that the layout types that can improve microclimate and reduce building energy consumption are horizontal parallel and staggered layout types.
The layout of apartment complexes significantly influences the microclimate and building energy loads. Depending on the layout, the effects of blocking heat inflow and changes in wind speed vary. Observations from multiple cases suggest that to design a layout that improves the microclimate and reduces building energy loads, it is essential to prioritize the consideration of wind corridors. An open layout, rather than a closed one, is deemed more effective in achieving these goals.
It can be useful for basic data when deciding on the form and layout of the main building of the apartment complex in the planning stage. Nevertheless, this study has limitations in that it failed to secure various results due to the limited approach using existing literature results data, and it failed to review and present more alternatives. It is thought that it needs to be addressed in future studies.

Author Contributions

Conceptualization, S.Y. and S.L.; methodology, S.Y., S.L. and S.J.; software, S.L. and S.J.; validation, S.Y., S.L. and S.J.; formal analysis, S.Y., S.L. and S.J.; investigation, S.Y., S.L. and S.J.; resources, S.Y., S.L. and S.J.; data curation, S.Y., S.L. and S.J.; writing—original draft preparation, S.Y., S.L. and S.J.; writing—review and editing, S.Y., S.L. and S.J.; visualization, S.Y., S.L. and S.J.; supervision, S.Y.; project administration, S.Y.; funding acquisition, S.Y. All authors have read and agreed to the published version of the manuscript.

Funding

National Research Foundation of Korea (NRF) grant funded by the Korean government (MSIT) (No. RS-2023-00218875). Korea Ministry of Environment (MOE) as Graduate School specializing in climate change. National Research Foundation (NRF), Korea, under project BK21 FOUR. Learning & Academic Research Institution for Master’s PhD students, and Postdocs (LAMP) Program of the National Research Foundation of Korea (NRF) grant funded by the Ministry of Education (No. RS-2023-00301938).

Data Availability Statement

All data incurred in this study are included in this manuscript.

Conflicts of Interest

The authors declare no conflicts of interest.

References

  1. Fahed, J.; Kinab, E.; Ginestet, S.; Adolphe, L. Impact of urban heat island mitigation measures on microclimate and pedestrian comfort in a dense urban district of Lebanon. Sustain. Cities Soc. 2020, 61, 102375. [Google Scholar] [CrossRef]
  2. Nam, M.B. Development of Rooftop Plants and Tree Species on Buildings. Forest 7 Issue; GreenTech Publishing: Seoul, Republic of Korea, 2003. [Google Scholar]
  3. KOSIS (Korean Statistical Information Service), (General household) Housing Type Search Results by Administrative District. Available online: https://kosis.kr/statHtml/statHtml.do?orgId=116&tblId=DT_MLTM_5403&vw_cd=MT_ZTITLE&list_id=I1_8&seqNo=&lang_mode=ko&language=kor&obj_var_id=&itm_id=&conn_path=MT_ZTITLE (accessed on 3 January 2024).
  4. KOSIS (Korean Statistical Information Service), 2023 Search Results for the Number of Companies by Region and Purpose. Available online: https://kosis.kr/statHtml/statHtml.do?orgId=115&tblId=DT_11507N_095&vw_cd=MT_ZTITLE&list_id=115_11507_K1&seqNo=&lang_mode=ko&language=kor&obj_var_id=&itm_id=&conn_path=MT_ZTITLE (accessed on 11 October 2024).
  5. Kim, J.I.; Lee, G.W. Analysis of wind path effectiveness for tower-shaped, plate-shaped, and mixed-type apartment complexes according to layout types: Based on CFD simulations. J. Korea Acad.-Ind. Coop. Soc. 2023, 24, 462–470. [Google Scholar]
  6. Lee, B.H.; Lee, G.W.; Yeo, Y.H. Comparative study of environmental sustainability in basic community planning for multiple stock housing based on Lay-out types. J. Archit. Inst. Korea 2010, 26, 271–282. [Google Scholar]
  7. Lee, S.W.; Lee, K.S. Optimization of Apartment-Complex Layout Planning for Daylight Accessibility Using a Genetic Algorithm. Energies 2020, 13, 4172. [Google Scholar] [CrossRef]
  8. Baker, J.; Oppewal, H. The Effects of Floor Plan Representations on Preferences for Apartments. J. Hous. Built Environ. 2023, 38, 727–752. [Google Scholar] [CrossRef] [PubMed]
  9. Li, Z.; Li, S.; Hinchchliffe, G.; Maitless, N.; Birbilis, N. Automated Architectural Space Layout Planning Using a Physics-Inspired Generative Design Framework. Artif. Intell. 2024. [Google Scholar] [CrossRef]
  10. Moon, H.B.; Lee, S.G. Analysis of compositional factors and three dimensional physical environments affecting surface temperature in apartment complex-Focused on 340 apartment complexes in Seoul, Korea. J. Urban Des. Inst. Korea 2018, 19, 35–52. [Google Scholar] [CrossRef]
  11. Bae, W.K.; Yoon, K.H. A design guideline of the apartment house complex for mitigation of heat island effect—For the planning agenda constructed and elected in 2005–2010. J. Urban Des. Inst. Korea 2012, 13, 47–60. [Google Scholar]
  12. Son, K.S.; Jung, E.H. A study on the layout type of an apartment complex considering wind environment—Focused on the Sinchun area of Daegu Metropolitan City. J. Korean Hous. Assoc. 2009, 20, 85–95. [Google Scholar]
  13. Jang, Y.N.; Lee, G.W. Analysis of the impacts of building layouts of housing on the thermal environment of buildings. J. Korea Acad.-Ind. Coop. Soc. 2021, 22, 185–194. [Google Scholar] [CrossRef]
  14. Cho, C.H.; Lee, T.K. The effect layout type of the housing on wind flow planning in apartment housing. J. Korea Plan. Assoc. 2004, 39, 115–129. [Google Scholar]
  15. Shui, T.; Liu, J.; Yuan, Q.; Qu, Y.; Jin, H.; Cao, J.; Liu, L.; Chen, X. Assessment of pedestrian level wind conditions in severe cold regions of China. Build. Environ. 2018, 135, 53–67. [Google Scholar] [CrossRef]
  16. Cha, H.U.; Kim, Y.M.; Kim, Y.S. Heating and Cooling Energy Assessment of Passive Technology Applied Energy Saving Apartment—Heating and Cooling Energy Consumption Estimation through the Energy Analysis Software. Proc. Korea Soc. Facil. Eng. Summer Conf. 2010, 10, 351–357. [Google Scholar]
  17. Lee, M.G.; Lim, I.H. Comparison of the heating/cooling energy demand and cost according to the unit position in a passive house apartment. J. Archit. Inst. Korea 2015, 31, 187–197. [Google Scholar] [CrossRef]
  18. No, J.U. An analysis of heating and cooling energy and effect on outdoor air cooling according to building type of apartment complex. Korean Sol. Energy Soc. 2014, 34, 31–38. [Google Scholar]
  19. Yoon, S.M.; Lee, K.H.; Ahn, Y.C.; Kim, Y.T. Cooling and heating load analysis according type of apartment house. J. Korean Soc. Power Syst. Eng. 2014, 18, 45–50. [Google Scholar] [CrossRef]
  20. Chen, Y.; Deng, S.; Hou, Y.; Yan, Q. Impact of environmental elements in classical Chinese gardens on microclimate and their optimization using ENVI-MET simulations. Energy Build. 2025, 329, 115238. [Google Scholar] [CrossRef]
  21. Amani, N. Energy efficiency of residential buildings using thermal insulation of external walls and roof based on simulation analysis. Energy Build. 2025, 329, 115238. [Google Scholar] [CrossRef]
  22. Korea Meteorological Administration (KMA) National Climate Data Center. Available online: https://data.kma.go.kr/data/grnd/selectAsosRltmList.do?pgmNo=36 (accessed on 11 October 2024).
  23. Kim, S.H.; Kwak, Y.H.; Kim, C.S. The analysis on energy performance of collective housing using ECO2 and Design Builder Softwares. KIEAE J. 2018, 18, 47–54. [Google Scholar] [CrossRef]
  24. Jung, S.Y.; Yoon, S.H. Predictive Evaluation of Outdoor Thermal Environment in Summer of Apartment Housing According to Building Types and Site Planning Types. J. Archit. Inst. Korea 2009, 25, 321–328. [Google Scholar]
  25. International Organization for Standardization (ISO). ISO 13790:2008—Energy Performance of Buildings—Calculation of Energy Use for Space Heating and Cooling; ISO: Geneva, Switzerland, 2008. [Google Scholar]
  26. Bae, W.K.; Kang, J.H. Analysis of CFD simulation of green areas and pilotis in apartment complexes during heat wave. J. Archit. Inst. Korea 2022, 38, 153–163. [Google Scholar]
Figure 1. Research overview.
Climate 13 00053 g001
Figure 2. Geographic locations of the 11 selected apartment complexes in Seoul, South Korea.
Climate 13 00053 g002
Figure 3. Modelling images for CASE 11 (2D, 3D).
Climate 13 00053 g003
Figure 4. Ta at 1.5 m height per case.
Climate 13 00053 g004
Figure 5. Case-by-case Ta result image corresponding to 12:00.
Climate 13 00053 g005
Figure 6. TMRT at 1.5 m height per case.
Climate 13 00053 g006
Figure 7. Case-by-case TMRT result image corresponding to 12:00.
Climate 13 00053 g007
Figure 8. WS at 1.5 m height per case.
Climate 13 00053 g008
Figure 9. Case-by-case WS result image corresponding to 12:00.
Climate 13 00053 g009
Figure 10. Case-by-case building energy consumption and PET relationship.
Climate 13 00053 g010
Figure 11. Case-by-case PET result image corresponding to 12:00.
Climate 13 00053 g011
Table 1. Key features of the 11 apartment layout types analyzed in the study.
CaseBuilding Height
(m)
Floor Area Ratio
(%)
Wall Area
(%)
Height-to-Building Area Ratio
CASE 152.2 (F)14.5066.72198.06
CASE 258 (F), 87 (T)10.2065.19195.03
CASE 366.7 (F)11.6066.69195.53
CASE 446.4 (F), 87 (T)11.4065.20197.52
CASE 543.5 (F)17.4066.74204.29
CASE 652.2 (F), 60.9 (F), 87 (T)12.1066.10199.43
CASE 752.2 (F)14.5066.72198.06
CASE 887 (T)8.9064.41195.04
CASE 952.2 (F), 66.7 (F), 72.5 (F)11.0066.68191.69
CASE 1060.9 (F), 72.5 (F), 101.5 (T)10.4065.96188.85
CASE 1152.2 (F)14.5066.72198.06
F: Flat-type, T: Tower-type
Table 2. Simulation model and boundary conditions.
Timing of AnalysisHeat Wave
Variable
Start simulation at day (DD.MM.YYYY)13.08.2024
Start simulation at time (HH:MM:SS)00:00:00
Total simulation time (h)24
Wind speed (m·s−1)1.65
Wind direction (deg)
(0 = from North 180 = from South)
176.25
Relative humidity (%)70.2
Roughness length at measurement site0.01
Size of grid cell in meterdx = 2.0, dy = 2.0, dz = 3.0
Building indoor temperature (°C)28
Table 3. Thickness and thermal transmittance of each part of the outer skin.
PartThickness [mm]Thermal Transmittance
[W/m2∙K]
GypsumInsulationWall Thickness
Outer wall10653000.342
Side wall10653000.342
Floor10902000.258
Roof101102000.215
WindowsBalcony interior side2.0
Balcony outside/Unheated Spaces3.3
Disclaimer/Publisher’s Note: The statements, opinions and data contained in all publications are solely those of the individual author(s) and contributor(s) and not of MDPI and/or the editor(s). MDPI and/or the editor(s) disclaim responsibility for any injury to people or property resulting from any ideas, methods, instructions or products referred to in the content.

