Article

From Optimism to Risk: The Impact of Climate Change on Temperature Sums in Central Europe

by
Martin Minárik
1,
Vladimír Kišš
2,*,
Agnieszka Ziernicka-Wojtaszek
3,
Martin Prčík
2,
Ján Čimo
1 and
Katarína Mikulová
4
1
Institute of Landscape Engineering, Faculty of Horticulture and Landscape Engineering, Slovak University of Agriculture in Nitra, Tr. A. Hlinku 2, 949 01 Nitra, Slovakia
2
Institute of Sustainable Regional and Local Development, Faculty of European Studies and Regional Development, Slovak University of Agriculture in Nitra, Tr. A. Hlinku 2, 949 01 Nitra, Slovakia
3
Department of Ecology, Climatology and Air Protection, Faculty of Environmental Engineering and Land Surveying, Al. Mickiewicza 24/28, 30-059 Kraków, Poland
4
Slovak Hydrometeorological Institute, Jeséniova 17, 833 15 Bratislava, Slovakia
*
Author to whom correspondence should be addressed.
Climate 2025, 13(3), 49; https://doi.org/10.3390/cli13030049
Submission received: 14 January 2025 / Revised: 25 February 2025 / Accepted: 26 February 2025 / Published: 28 February 2025
(This article belongs to the Section Climate Dynamics and Modelling)

Abstract

:
This study examines the impact of climate change on agricultural productivity in Slovakia, the Czech Republic, and Poland, focusing on temperature sums influencing the growing season. Using meteorological data from 2001 to 2020, the research analyses the onset and termination of temperatures ≥5 °C (growing season). Temperature sums for two periods (2001–2010, 2011–2020) were calculated and future temperature projections under three scenarios (+1.5 °C, +2.6 °C, +3.6 °C) were developed. Results indicate regional variation in temperature sums, with 69% of the area falling in the 2900–3100 °C range, and Poland showing the highest percentage (81%). In the second decade of the 21st century, temperature sums shifted to the 3100–3300 °C range, affecting 63% of the region. The projections indicate a substantial increase in temperature sums, with the most optimistic scenario (+1.5 °C) leading to the dominance of the 3700–3900 °C range. The warmest areas (West Pannonian Basin), show a temperature sum of 4900–5100 °C. The comparison of predicted and observed temperature sums for 2011–2020 shows a minimal error (±3% in Slovakia and ±4% in Poland and the Czech Republic), confirming the projections. These findings highlight the importance of adaptive strategies in agriculture, particularly fruit farming, to mitigate the climate change effects.

1. Introduction

Human-induced climate change is no longer a future concern; it is a present reality. Ecosystems and human populations globally are already experiencing the impacts of this ongoing phenomenon [1]. Recent data from the Copernicus Climate Change Service (C3S) indicate that 22 July 2024 marked the warmest day ever recorded, with the daily global average temperature reaching a new high of 17.16 °C, according to the ERA5 dataset [2]. The World Meteorological Organization (WMO) has forecasted that 2024 will be the warmest year on record, following an extended period of exceptionally high global mean temperatures. Additionally, the years 2015–2024 will rank as the warmest decade ever documented, with the global mean surface air temperature from January to September 2024 averaging 1.54 °C (±0.13 °C) above pre-industrial levels, partly driven by a strong El Niño event [3]. Projections suggest that global temperatures between 2024 and 2028 will exceed 1.1 °C to 1.9 °C above the baseline of 1850–1900 [4]. The likelihood of exceeding the 1.5 °C threshold in at least one of the next five years has increased significantly, from a 20% chance between 2017 and 2021, to 66% between 2023 and 2027 [4,5].
The effects of climate change are already evident across Europe, where regional impacts include biodiversity loss, forest fires, reduced agricultural yields, and elevated temperatures. Human health is also at risk, particularly during extreme heat events, which can result in fatalities [6]. Over the past three decades, Europe has experienced a temperature increase more than twice that of the global average, making it the most affected continent [7]. The period from 2013 to 2023 saw the global mean temperature rise by 1.19 °C to 1.22 °C above pre-industrial levels, marking it as the warmest decade on record. In Europe, land temperatures have risen at an even faster rate, increasing by 2.12 °C to 2.19 °C over the same period, depending on the dataset used [8].
Agriculture and forestry are particularly vulnerable to the adverse impacts of climate change. Variations in seasonality disrupt agricultural cycles, while shifts in rainfall patterns and extreme weather events (such as heatwaves, droughts, storms, and floods) pose significant challenges [9]. Climate change has profound effects on crop yields, with elevated temperatures exacerbating evapotranspiration rates and resulting in soil dryness and water scarcity, further hindering crop production [10]. These changes also influence the timing of plant life events, including the onset of phenophases and the duration of growing seasons, impacting both the physiology and productivity of crops [11]. The effects on temperate fruit and nut tree species are particularly pronounced, as they affect processes such as bud dormancy, vernalisation, pollination, fruit set, growth, and overall fruit quality. Additionally, the interplay between climate change and the proliferation of pests, diseases, and weeds presents significant challenges to tree physiology, threatening food security and human welfare [12]. According to the European Environment Agency (EEA), many of these risks have already reached critical levels and may lead to catastrophic consequences without immediate and decisive intervention [13].
The aim of this article is to analyse the onset of the growing season based on the occurrence of a temperature of 5 °C, calculate the sum of temperatures during this period for the years 2001–2010 and 2011–2020 and predict how the sums of temperatures will develop if the average annual temperature increases by 1.5 °C, 2.6 °C and 3.6 °C in specific locations in Slovakia, the Czech Republic and Poland.
This study is crucial for understanding how temperature changes impact the growing season, which directly affects agricultural productivity and food security. By focusing on specific regions in Slovakia, the Czech Republic, and Poland, it offers valuable insights for adapting farming practices to future climate scenarios. While many studies have explored the general effects of climate change on agriculture, this research highlights the importance of temperature sums, which are critical in determining the length and intensity of the growing season. By predicting temperature sums under various global warming scenarios, this study provides a localized, detailed approach to understanding how shifts in temperature could affect crop yields—an area that may not have been widely explored before.

2. Materials and Methods
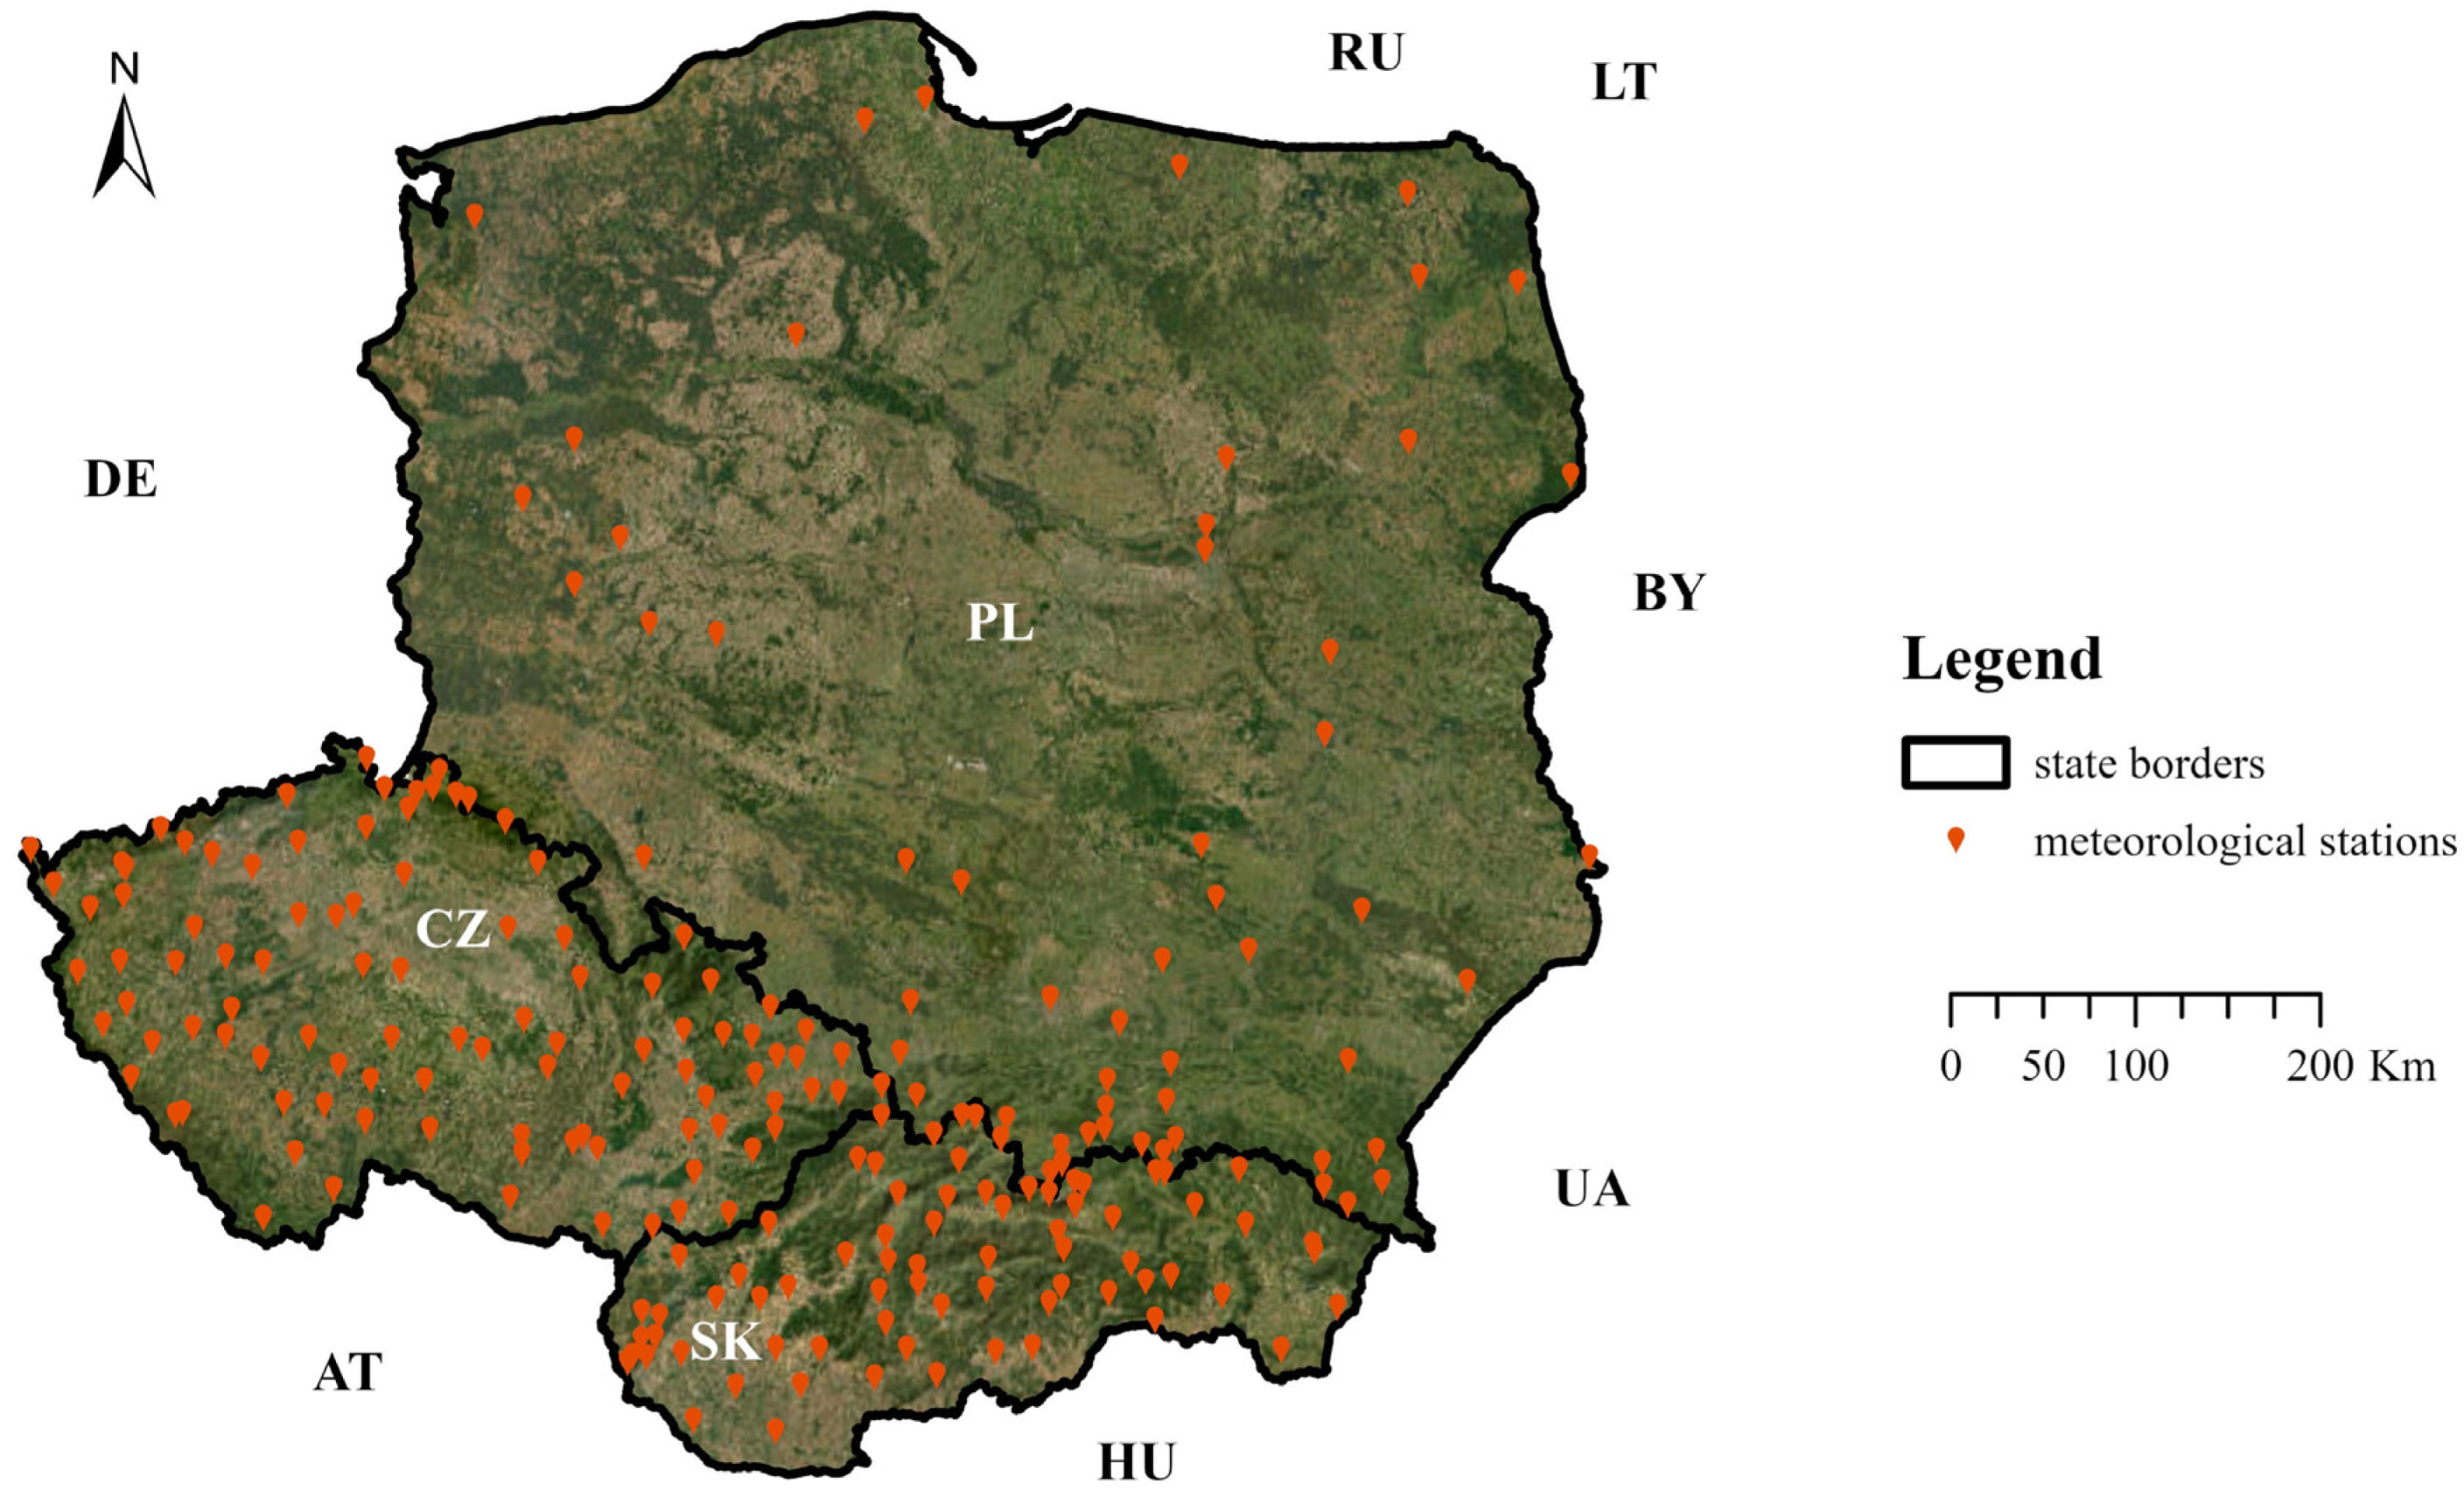
2.1. Study Area

This study focuses on the countries of Central Europe—Slovakia (48°40′25.51″ N and 19°41′45.81″ E), the Czech Republic (49°48′13.55″ N and 15°28′29.69″ E) and Poland (51°55′8.06″ N and 19°08′3.76″ E).
Slovakia covers an area of 49,035 km2, with its landscape featuring a wide range of geographical types. In the southern part of the country, the terrain consists of lowlands, gradually transitioning through hills and highlands to the mountainous regions in the north. The Carpathian Mountains dominate roughly two-thirds of the country’s territory, while one-third lies within the Pannonian Basin. The Pannonian Basin includes three main lowlands in Slovakia: the Záhorská Lowland in the west, the Danube Lowland in the southwest, and the Východoslovenská Lowland in the southeast. The altitude of Slovakia ranges from around 94 metres a. s. l. at the lowest point to 2655 metres a. s. l. at the highest point in the High Tatras. Slovakia’s climate is primarily classified as Cfb (oceanic climate) under the Köppen system, characterised by mild winters and warm, humid summers in most regions. The higher elevations, particularly in the mountainous areas like the High Tatras, experience a Dfb (humid continental climate) with colder winters and warmer summers. The highest peaks may have a Dfc (subarctic climate), marked by long, cold winters and short, cool summers. These variations are due to Slovakia’s diverse topography. Due to its varied altitude, diverse terrain, and different natural conditions, the country has multiple climate zones, influenced by regional differences in air circulation and other environmental factors [14,15,16].
The Czech Republic spans an area of 78,866 km2 and features a diverse range of topographical variations within its relatively compact land area. The country’s elevation ranges from 115 metres to 1603 metres a. s. l., with the highest mountain ridges located along its borders. Its landscape is quite varied, consisting of either low-lying flatlands or steep highlands. The country’s climate is shaped by a complex interaction of atmospheric and geographical factors, including latitude, inland location, topography, proximity to bodies of water, and altitude. The Czech Republic primarily experiences a Cfb (oceanic climate), with mild winters and warm, humid summers. In the higher elevations, especially in the east and south, a Dfb (humid continental climate) is found, characterised by colder winters and warmer, wetter summers. The highest mountain areas, such as the Krkonoše and Jeseníky ranges, have a Dfc (subarctic climate) with long, cold winters and short, cool summers. However, local climate variations can occur across the country due to its varied topography [17,18].
Poland covers an area of 312,696 km2. Its altitude ranges from 1.8 metres below sea level (Vistula River Delta) in the north to the highest point in the High Tatras mountains, at 2499 metres a. s. l. Poland has diverse geographical and climatic conditions. The country features flat lowlands in the north and central regions, mountains in the south (Carpathians and Sudetes), and a Baltic Sea coastline to the north. Most of Poland experiences a Cfb temperate oceanic climate, with mild summers and cold winters, while the southern and eastern regions have a more Dfb humid continental climate, with colder winters and warmer summers. The northern coastal areas are influenced by maritime conditions, resulting in milder temperatures. Precipitation varies across the country, with wetter conditions in the west and north, and drier weather in the east [19,20].

2.2. Data Analysis

The most common way of expressing the basic characteristics of climatic conditions and their mutual comparison across different places is the use of climatic averages. For this analysis, average daily temperatures from three countries—Slovakia (81 meteorological stations), the Czech Republic (99 meteorological stations), and Poland (50 meteorological stations)—in the period 2001–2020 were processed (Figure 1). Data were provided in the year 2024 by the Slovak Hydrometeorological Institute (SHMÚ), the Czech Hydrometeorological Institute (ČHMÚ) and the Institute of Meteorology and Water Management—National Research Institute (IMGW-PIB). Monthly and annual temperature averages for each station were subsequently calculated from the daily averages. Meteorological stations were selected based on data availability. If a station had long-term measurement outages, it was not included in the research. In the analysis, more meteorological stations were used in Slovakia and the Czech Republic, because they have rugged terrain and mountain ranges affect climatic conditions. In Poland, fewer stations were used, as 75% of the territory is flat (Figure 2), and this did not affect the analysis in ArcGIS, as comparable results of temperature change analyses due to climate change in Poland can be seen in [21], where the landscape is evaluated using various climatic parameters.
The life cycle of cultural crops is possible only within a certain range of temperatures. Specific temperature conditions must be met to activate physiological processes that affect the individual developmental phases of plants [22]. In our conditions, the onset and termination dates of average daily temperatures ≥0 °C, ≥5 °C, ≥10 °C and ≥15 °C are most often set. These temperatures are closely related to life in nature.
In this research, we focused on the onset and termination of temperatures T ≥ 5 °C. The onset and termination of a temperature ≥5 °C determines a great vegetation period, because this temperature activates physiological processes in plants (growth and development of vegetation begins in spring and ends in autumn) [14,22,23].
The onset and termination of temperatures T ≥ 5 °C can be determined by calculation. The ascending and descending parts of the curve of the annual temperature course, which most closely approximates the course of a straight line, are used to interpolate the onset and termination dates of certain average daily temperatures. Through interpolation, it is possible to determine the average date of onset and termination of specific temperatures.
The vegetation periods were calculated for each meteorological station according to formulas [23,24]:
  • onset of temperatures:
r v = R T n T 2 T 1 T 2   ( days )
  • termination of temperatures:
r p = R T 1 T u T 1 T 2     ( days )
where:
Tn—onset temperature [°C],
Tu—termination temperature [°C],
T1—the nearest average monthly temperature above the onset/termination of temperature [°C],
T2— the nearest average monthly temperature below the onset/termination of temperature [°C],
R—the difference in days between the middle of the months with the average temperature T2 and the average temperature T1, can be expressed as an average number R = 30,
rv—difference in days between the middle of the month with temperature T2 and the date of onset of temperature Tn,
rp—difference in days between the middle of the month with temperature T2 and the date of termination of temperature Tu.
This method was primarily used in the Czech Republic and Slovakia. There is a similar calculation in Poland according to two methods: Gumiński [25], and Huculak and Makowiec [26]. The first one is based on average monthly air temperature values, where in spring and autumn the exceedance of the threshold value of 5 °C is determined by the calculation method. It is assumed that the temperature value equal to the monthly average occurs on the middle day of the month and the temperature varies linearly between the following middle days of the month. In the case of the Huculak and Makowiec method, daily air temperature values are used to calculate the onset and termination dates of the vegetation period [27,28]. Since these methodologies are comparable to the Slovak methodology, for this reason we applied the method according to Nosek [23] for all three countries.
For each meteorological station, after calculating the onset and termination date of temperatures T ≥ 5 °C, the average sums of temperatures for the periods of 2001–2010 and 2011–2020 were calculated. Sums of temperatures are a common characteristic especially for agricultural purposes. Temperature sums were calculated by adding average daily temperatures [23].
The World Climate Research Programme (WCRP) first developed modern climate models in 1990. The Coupled Model Intercomparison Project (CMIP) establishes standards and experimental protocols for these models. CMIP’s scenarios provide consistent information for all modelling groups to use in their climate projections. In CMIP6, these scenarios are known as shared socioeconomic pathways (SSPs). SSPs are closely related to the representative concentration pathways (RCPs) from CMIP5, which focused solely on atmospheric greenhouse gas concentrations [29].
The Intergovernmental Panel on Climate Change (IPCC) Sixth Assessment Report was used for prediction scenarios. This report presents five potential future scenarios for the physical science of climate change—the Most Optimistic Scenario (1.5 °C by 2050), the Next Best Scenario (1.8 °C by 2100), the Middle of the Road Scenario (2.6 °C by 2100), the Dangerous Scenario (3.6 °C by 2100) and the Avoid at All Costs Scenario (4.4 °C by 2100) [30].
In our paper, we focused on the increase in global temperature according to available, generally known models and applied this increase in temperature to average annual temperatures to find out, based on the prediction, how the sum of temperatures in the growing season would change according to three scenarios—the Most Optimistic Scenario—RCP 2.6 (+1.5 °C), the Next Best Scenario—RCP 4.5 (+2.6 °C) and the Dangerous Scenario—RCP 8.5 (+3.6 °C) at individual meteorological stations. Subsequently, the sum of temperatures for these three scenarios was calculated according to direct variation.
Direct variation is a type of proportionality wherein one quantity directly varies with respect to a change in another quantity. This implies that if one quantity increases, the other quantity will experience a proportionate increase. Similarly, if one quantity decreases then the other quantity also decreases [31]:
y = k x
where:
k—constant of proportionality
y, x—quantities
After calculating the sums of temperatures for individual scenarios, a test of the calculation’s accuracy was performed. For the period 2011–2020, the sum of temperatures was calculated using direct variation and compared with the actual measured sums of temperatures. Subsequently, the deviation of the calculated data from the observed data was calculated.
Percentage error is a measure of the discrepancy between an observed and a true value. While measuring data, the result often deviates from the true value. Regardless, in such cases, it becomes important to calculate the percentage error. The computation of percentage error involves absolute error, which is simply the difference between the observed and the true value. The absolute error is then divided by the true value, resulting in the relative error multiplied by 100 to obtain the percentage error [32]:
P e r c e n t a g e   e r r o r = ( A c t u a l   V a l u e E s t i m a t e d   V a l u e ) A c t u a l   V a l u e 100       [ % ]

2.3. Map Processing

The map outputs of meteorological data were generated using ESRI’s ArcGIS Pro software. For the two periods under study and the three selected situations based on the IPCC projections, it was necessary to create complete layers covering the whole selected area (Slovakia, the Czech Republic, and Poland) from the available data. For this step the Ordinary Kriging interpolation method was used. The semi-variogram model chosen was Spherical. The resolution was set to 1000 m. The interpolated layers were subsequently reclassified into the required classes after 200 °C. After reclassification, the raster layers were converted to vector format using the Raster to Polygon function. In these layers, the areal representation of each class in km2 was calculated. Expressing the areas in each category provided help to describe the changes that may occur under different climate scenarios. Finally, a map output was produced showing the two base periods (2001–2010 and 2011–2020) and the three scenarios resulting from the IPCC projections (the most optimistic scenario, the next best scenario and the dangerous scenario).

3. Results

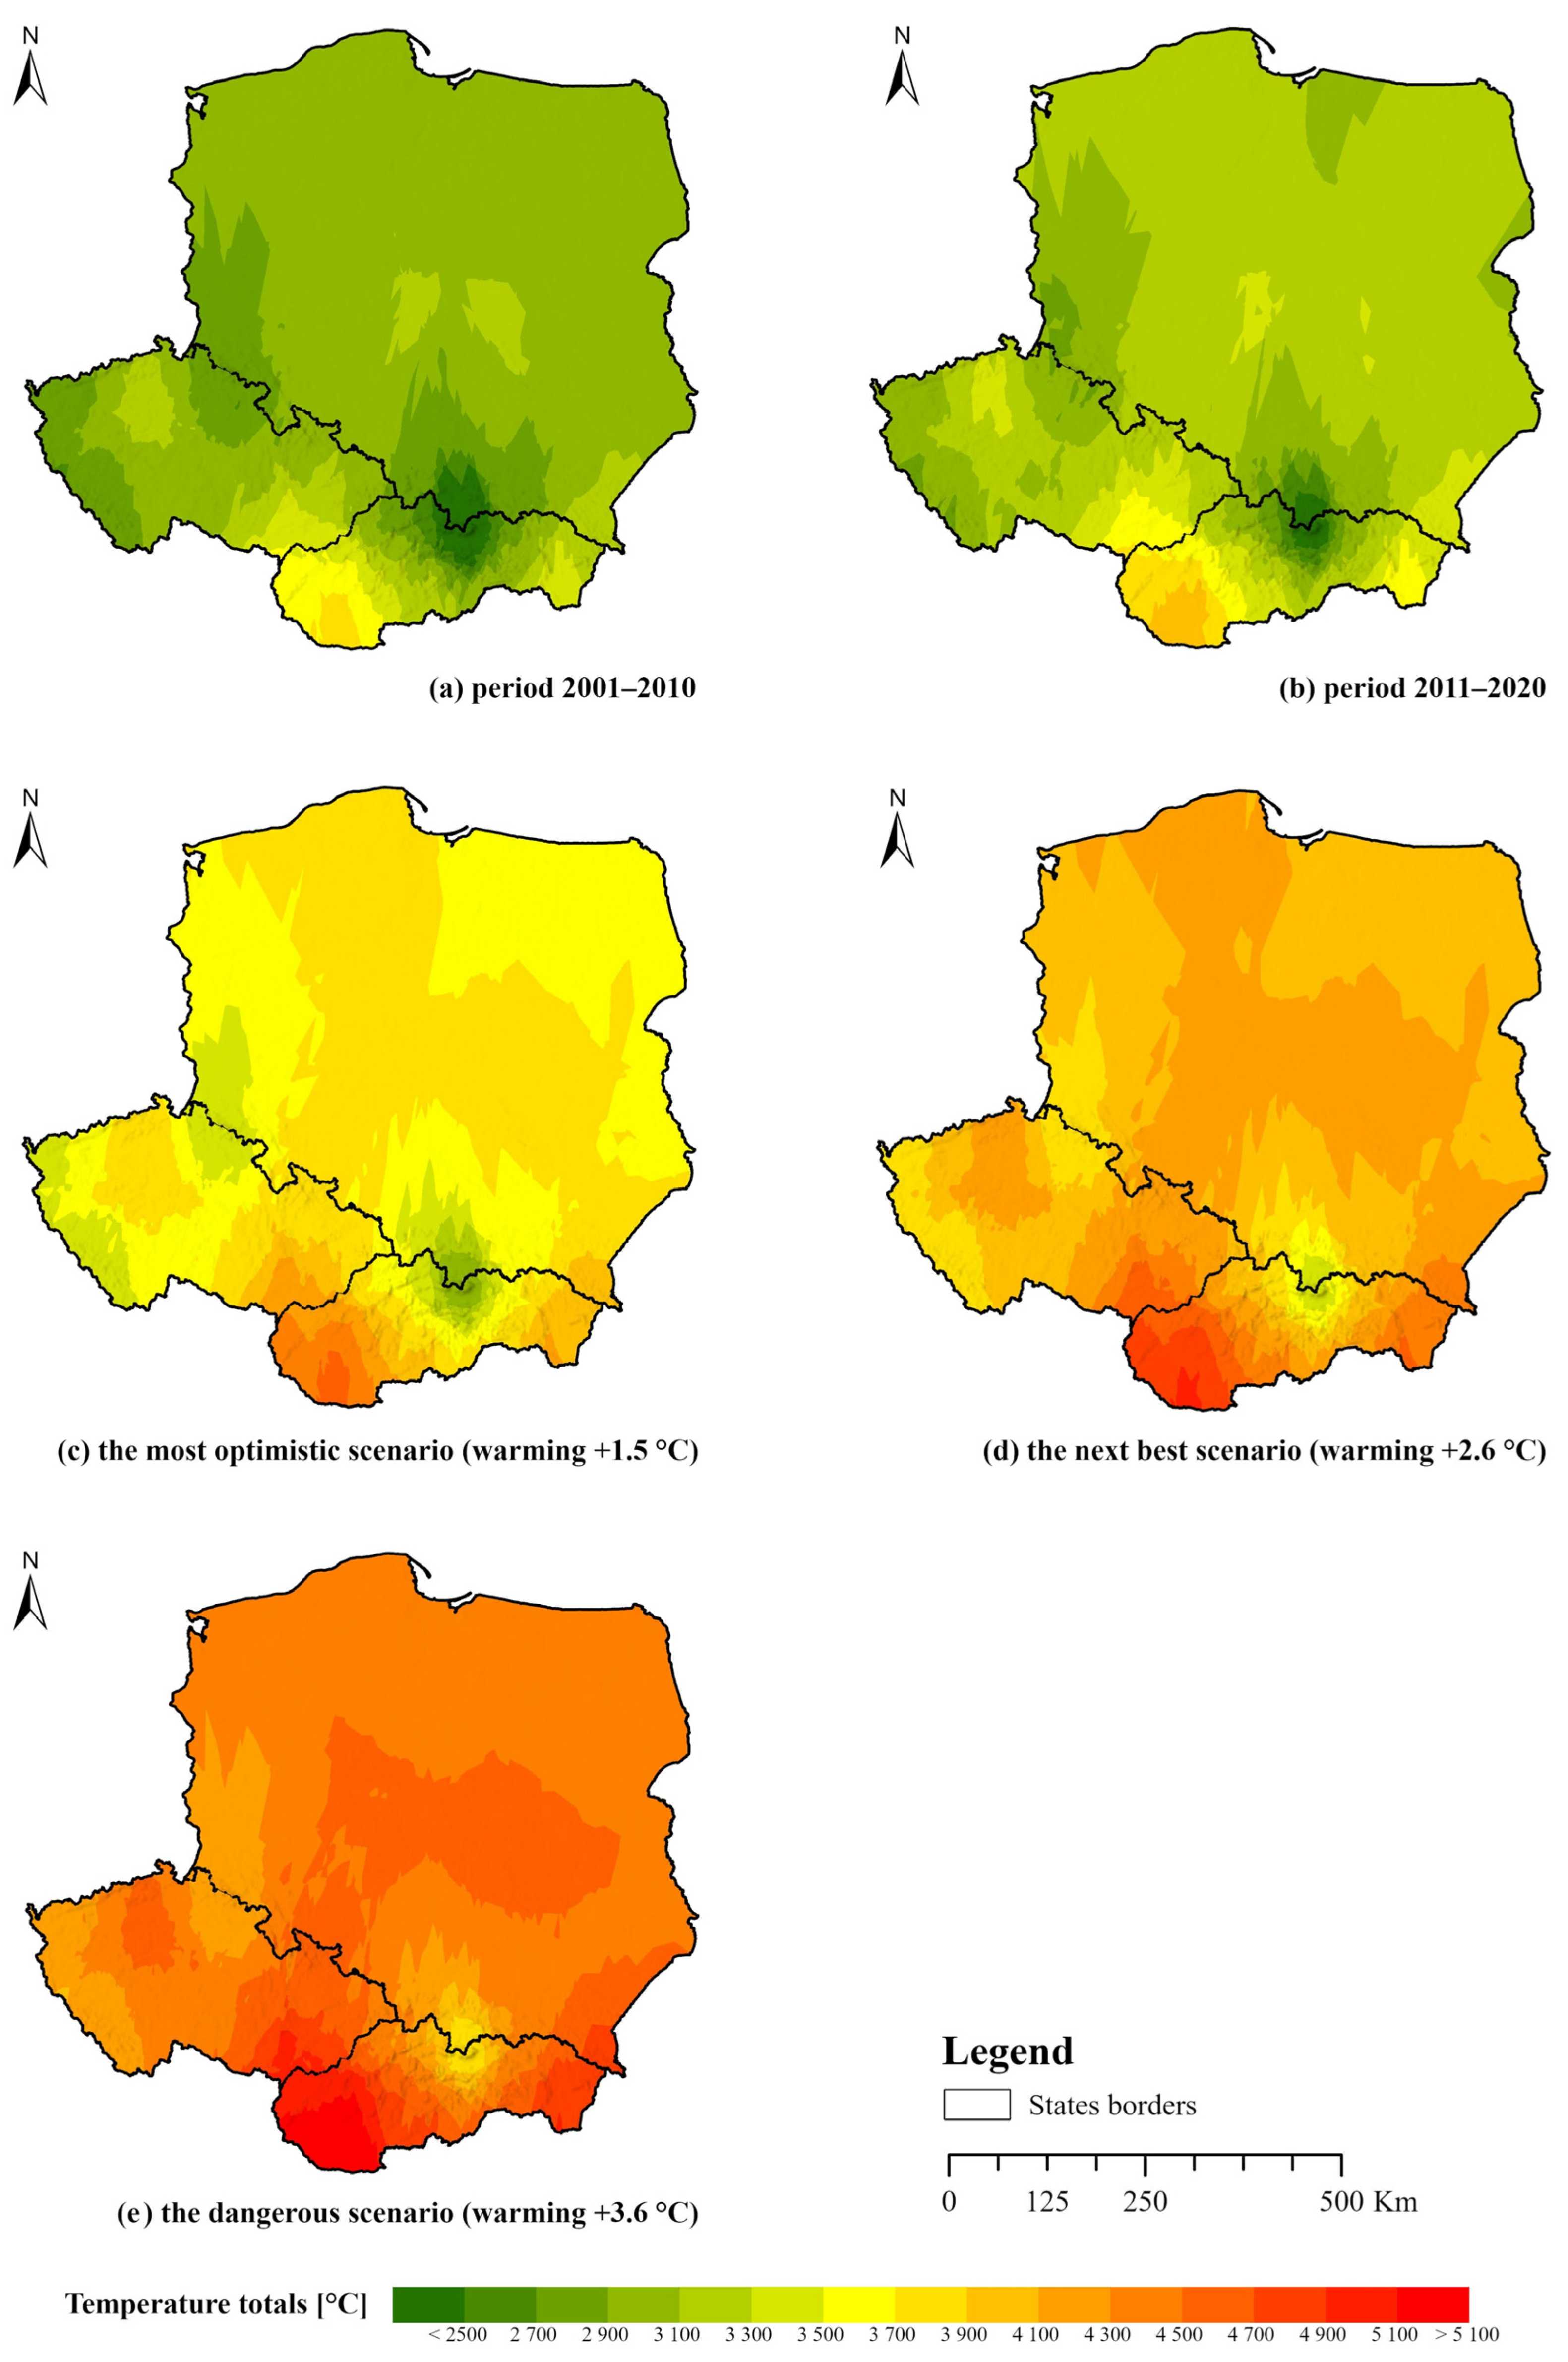
3.1. Temperature Sums

3.1.1. The First Decade of the 21st Century 2001–2010

The clear dominance of temperature sums of 2900–3100 °C in the study area of the three countries of Slovakia, Poland, and the Czech Republic with a value of 69% as a predominance, with Poland exhibiting a higher proportion of 81%, is evident (Figure 3a). Lower values in the range of 2700–2900 °C are found on the far edges of the Western Carpathians located on the Polish–Slovak border, in the west of the study area in the Šumava region, and in the west in the area of the Bohemian Plateau, the Sudetes on the border of the Saxon–Lusatian Plain and the western part of the Central Polish Lowland near the Polish–German border. These lower temperature sums occupy 15% of the entire study area. Even lower values in the range 2300–2700 °C occupying a total of only 3% are concentrated around the highest elevations of the Western Carpathians. The warmest areas, with temperature sums in the 3700–3900 °C range, occur in a very small area of less than 1% of the total area of the northern part of the West Pannonian Basin (Danubian Lowland). Around this area, increasingly warmer regions with temperature sums of 3500–3700 °C, 3300–3500 °C, and 3100–3300 °C are arranged concentrically (12% of the total with 3100–3300 °C predominating). The latter class is still found in the easternmost patch of the inner Western Carpathians in Slovakia and in the eastern part of the Northern Subcarpathians in Poland, in addition to the central part of the Ore Mountains (Krušné hory) and the eastern part of the Berounka Upland, as well as in two enclaves of central Poland.

3.1.2. The Second Decade of the 21st Century 2011–2020

The second decade of the 21st century can be considered the closest to current meteorological conditions (Figure 3b). In the study area, a class of temperature sums in the range of 3100–3300 °C dominates in all countries, accounting for 63% of the total area. In the previous 10-year period, the class was in the 2900–3100 °C range. The largest absolute and relative areas are more than 233,000 km2 and almost 75%, respectively. The second largest area is the area in the temperature sum range 2900–3100 °C occupying 21% of the entire study area, in Poland 19%, in the Czech Republic 33%, and in Slovakia 11%. These are the areas in Poland of the western part of the South Baltic Lake District (Pojezierze Pomorskie) and the Central Polish Lowland except for the Sudetes, the eastern edge of the South Baltic Lake District and the South Baltic Coastline, the Silesian–Cracow Małopolska Upland, and Lesser Poland. In the Czech Republic, these are the areas of the Bohemian Plateau and the Šumava region, except for its southwestern slice and slightly lower temperature sums. In Slovakia, these are the areas of the Central and Inner Western Carpathians. The Polish–Slovak border region is marked by the coldest area, located in the centre of the Western Carpathians and its periphery, with the lowest temperature sum in the range of 2700–2900 °C.
The warmest areas with temperature sums of 3900–4100 °C are found in Slovakia in the northern part of the West Pannonian Basin (Danubian Lowland), around which areas with lower values of temperature sums—3700–3900 °C and 3500–3700 °C and 3300–3500 °C—extend concentrically.

3.1.3. The Most Optimistic Scenario (Warming + 1.5 °C)

The dominant temperature sums with this scenario are in the 3700–3900 °C range occupying an area of 192,000 km2 of the total study area, or 44%, and the slightly smaller range in the 3500–3700 °C range occupying 38% of the total area of the three countries (Figure 3c). The relatively largest area with a range of temperature sums of 3500–3900 °C is in Poland. Cooler areas with temperature sums in the range of 3300–3500 °C are located in the Šumava region in the Czech Republic, the Polish–Czech border region in the Sudetes, and in the area of Poland in the western slice of the Central Polish Lowland, the Silesian–Małopolska Upland, and the Małopolska Highland. The coolest areas with a total temperature of 2900–3300 °C are located on the Polish–Slovak border in the Western Carpathians and on their fringes in the Outer and Inner Western Carpathians. The warmest areas with temperature sums of 4300–4500 °C and higher are in Slovakia around the West Pannonian Basin (Danubian Lowland).

3.1.4. The Next Best Scenario (Warming + 2.6 °C)

Areas with temperature sums in the 3900–4100 °C range, accounting for 42% of the total area of the three countries, and in the 4100–4300 °C range, accounting for 40%, predominate (Figure 3d). Cooler areas with temperature sums of 3700–3900 °C are only found in the area of western Poland, a patch of the Central Polish Lowland and in the Polish–Slovak border region, the area of the Western Carpathians and adjacent parts of the Outer and Inner Western Carpathians, the Šumava region in the Czech Republic, and in the Polish–Czech border region of the Sudetes. In the Western Carpathians, expect temperature sums in the range of 3300–3500 °C. The warmest areas with temperature sums above 4300 °C appear in the southeast of the study area in the Polish Bieszczady Mountains and the eastern edge of the Inner Western Carpathians in Slovakia. The warmest area with temperature sums of 4900–5100 °C and 4700–4900 °C is in the Slovak northern part of the West Pannonian Basin (Danubian Lowland). On the outskirts of this area are areas with temperature sum values of 4500–4700 °C and 4300–4500 °C.

3.1.5. The Dangerous Scenario (Warming + 3.6 °C)

This shows a definite predominance because 56% of the entire study area is occupied by the area of temperature sums in the value range of 4300–4500 °C (Figure 3e). In the area of Poland, it is even more at 67%, in the Czech Republic only 37%, and in Slovakia where warmer areas prevail only 16%. A slightly warmer area with a temperature sum of 4500–4700 °C is located in central Poland and includes the southwestern part of the Central Polish Lowland, but without its western part, and the Lesser Poland Highland, Western Subcarpathians, passing to the Slovak side, includes the eastern part of the Czech–Moravian Highlands on the western side in the Czech Republic and the lower parts of the western part of the Inner Western Carpathians in Slovakia. The coldest area under this scenario with a temperature sum of 3700–3900 °C is in the Western Carpathians on the Polish–Slovak border. The warmest area with a temperature sum of 5100–5300 °C as usual is in the northern part of the West Pannonian Basin (Danubian Lowland) in southern Slovakia.

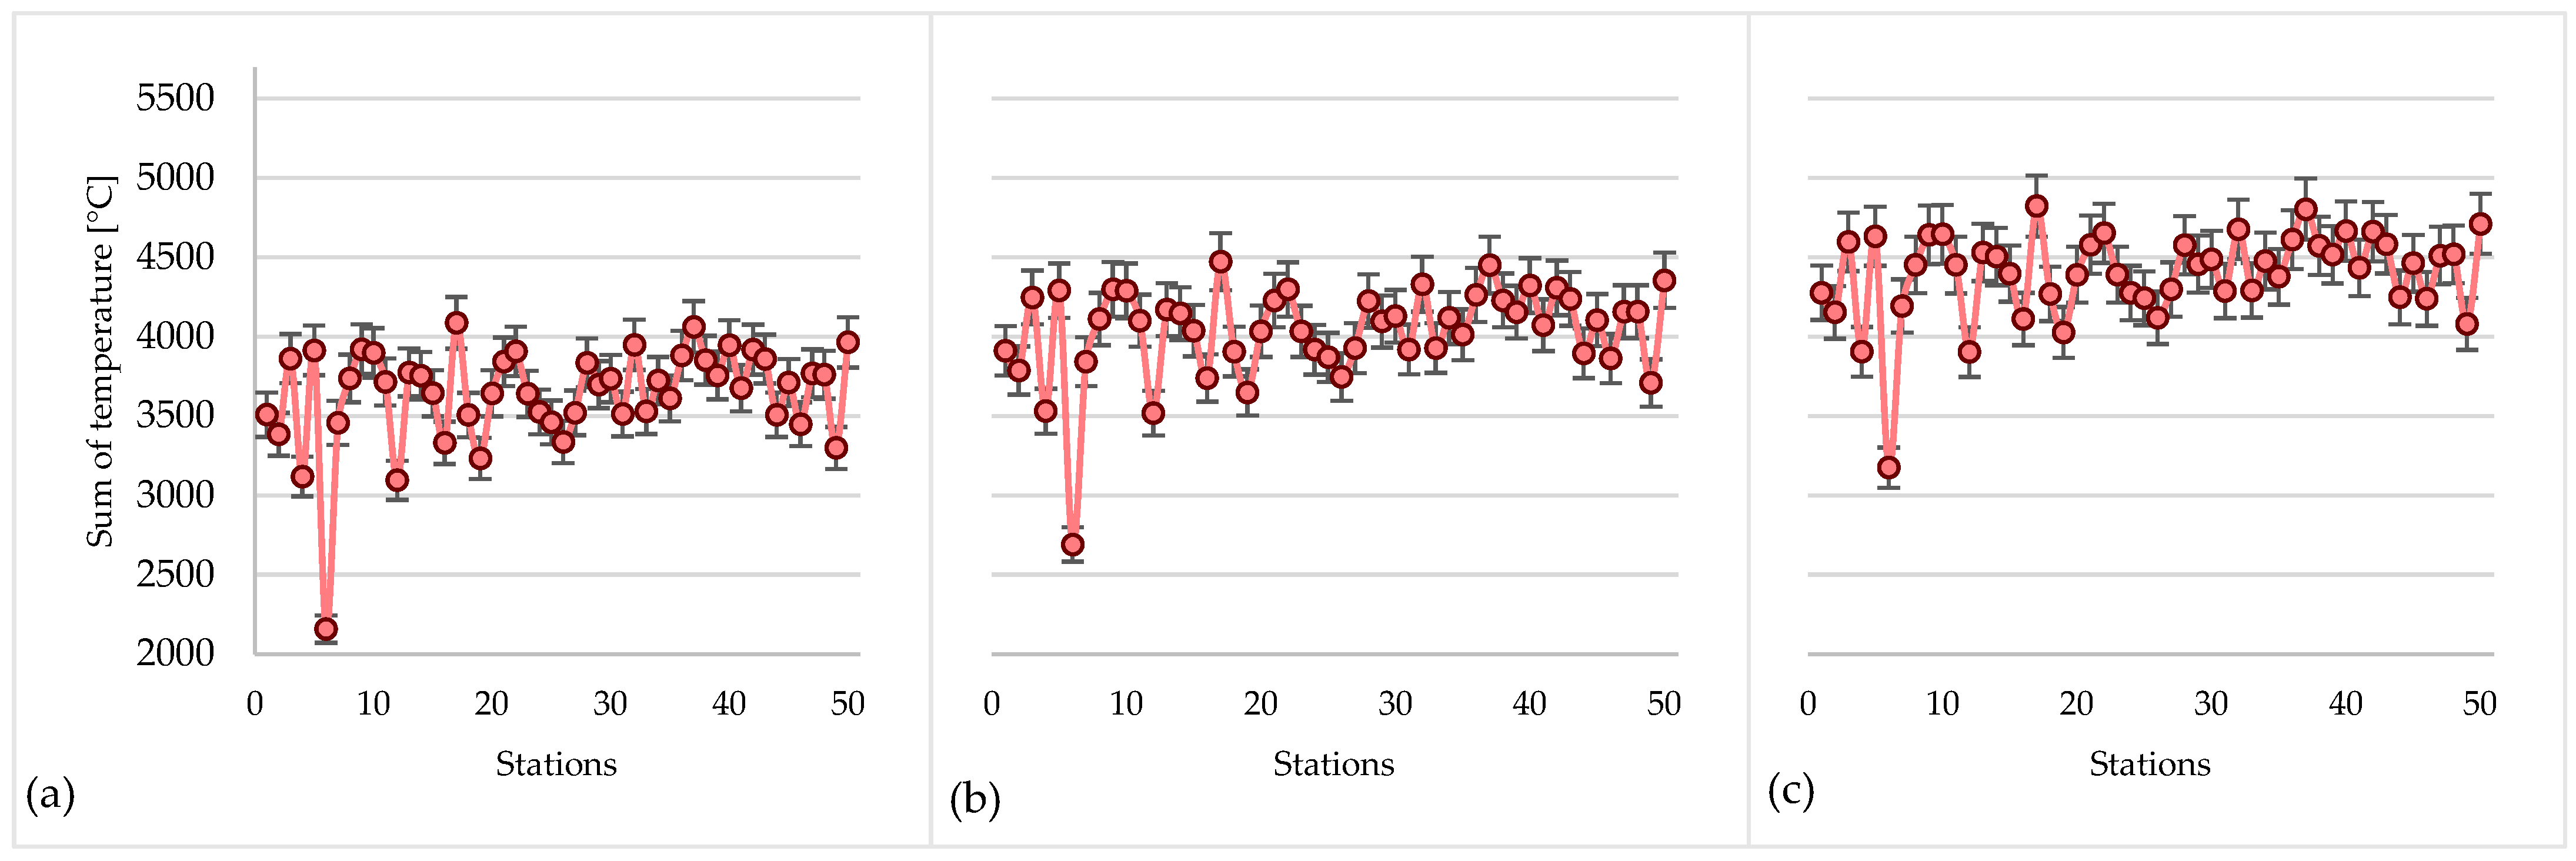
3.2. Percentage Error

By comparing the measured temperature sums for the period 2011–2020 and the theoretical calculations of the temperature sums for the same period, a percentage error was created for each station in Slovakia (Figure 4), in the Czech Republic (Figure 5), and in Poland (Figure 6). We applied the percentage error for each of the three countries for the most optimistic scenario (a), the next best scenario (b), and the dangerous scenario (c). In Slovakia, this percentage error was on average ±3%, while in the Czech Republic and Poland it was on average ±4%. This shows the potential development of temperature sums in the growing season at individual meteorological stations.

4. Discussion

In our work, we look at changes in annual temperature sums due to climate change under three selected IPCC scenarios. The assessment is carried out on the territory of Slovakia, Czech Republic and Poland. During the research work, it was not found that scientists from the selected areas have conducted similar research.
The increase in active temperature sums is also reflected in an increase in average air temperatures and in the lengthening of the growing season. Ceglar et al. [33] found that the growing season of grape vines will lengthen by an average of 10 to 40 days towards the end of the century due to climate change. They expect the biggest changes in Spain and Turkey, but similar changes are also expected in Hungary, Germany, Romania, and Serbia. Chervenkov and Slavov [34] state that agriculture and forestry are the most vulnerable sectors of the economy to climate change. Expected climate change is of major importance for both areas. The study used information based on CMIP5 global change simulations. Under the highest impact scenario (RCP8.5), the average onset of the growing season over central Europe in the period 2070–2099 is reduced by up to 20 days and the ending is extended by 20 days. These facts lead to an extension of the growing season by more than one month in total. Based on FORESEE files, it is possible to confirm the changing climate. Considering the observed changes between 1991 and 2020 compared to the period 1971–2000, the study sites show an average increase in mean temperature of 0.79-1.06 °C and a change in precipitation of −1.3 to +76.9 mm. The average temperature and precipitation in the territory of Hungary increased by 0.91 °C and 21.6 mm, respectively. For the years 2071–2100 compared to the base period 1991–2020, there is an indication of substantial differences between the RCP4.5 and RCP8.5 scenarios for temperature, but less so for precipitation. For temperature, a significant altitudinal gradient is expected with the highest projected increases in the Alps, Carpathians, and Balkan Mountains. Spatial differences are even more pronounced for projected seasonal changes [35]. Each agricultural crop has basic temperature requirements to complete a particular phenophase, but also the entire life cycle. Further, extremely low or high temperatures have a negative impact on crop development, growth and yield, especially during critical phenophases. Temperature increases during spring and summer are expected. This could be beneficial for crop production in northern locations where the length of the growing season is currently a limiting factor [36]. Based on forecast models, the average temperature is expected to increase by 2.0–4.0 °C by the end of the 21st century in Slovakia and the Czech Republic. Average annual precipitation will remain unchanged, but its distribution within the year will change. Further increases in extreme weather events are expected. The number of tropical days will increase, as will the number of extreme rainfall episodes. Evaporative intensity will increase with increasing temperature and lower precipitation. This in turn leads to less runoff and ultimately more drought problems [37]. Weather extremes will intensify. With a 1.5 °C warming, the likelihood of extreme heat events increases fourfold compared to the last decade. If it warms at 2.0 °C, these heat events are up to six times more likely to occur. A 4.0 °C warming is up to nine times more likely. The likelihood of extreme rainfall events and droughts will also increase [38]. Projections of climate change in the territory of Poland show clear differences between seasons and emission scenarios. The periods of the near and far future have been defined for comparison. The near future represents the period 2041–2060. In contrast, the far future represents the period 2081–2100. For the RCP4.5 scenario, a gradual increase is observed in the summer period, with temperatures increasing by 0.8 °C from the baseline scenario in the near future and up to 1.3 °C in the far future. Conversely, a more pronounced warming effect is observed in the winter period. The temperature difference here is 1.0 °C in the near future and up to 1.8 °C in the far future. If we compare this with the RCP8.5 scenario, the warming effect is even more pronounced. The greatest warming is expected in this scenario in the summer period, where an increase of 1.2 °C in the near future and 3.2 °C in the distant future is projected. For the winter period under this scenario, an increase of 1.6 °C is expected in the near future and up to 3.8 °C in the far future. All the above increases in average temperature in the periods in question tend to increase the temperature sums on which agricultural crops depend [39].

5. Conclusions

Rising temperatures in Slovakia, the Czech Republic, and Poland present both challenges and opportunities for agriculture, especially fruit farming. Temperature sums in these countries have consistently increased over the past few decades, with projections suggesting further warming, potentially extending the growing season. However, this comes with risks, including more frequent droughts and extreme weather, which could negatively impact crop yields. Warmer temperatures may also alter fruit blooming and ripening and increase the spread of pests and diseases. To address these challenges, farmers and policymakers must adopt strategies like drought-resistant varieties, improved irrigation, and sustainable practices, with regional cooperation and research being key to resilience.

Author Contributions

Conceptualization, V.K. and M.M.; methodology, V.K.; software, M.M.; validation, M.P., A.Z.-W. and J.Č.; formal analysis, V.K.; investigation, J.Č.; resources, K.M.; data curation, V.K.; writing—original draft preparation, M.M., V.K. and A.Z.-W.; writing—review and editing, M.P.; visualization, M.M.; supervision, M.M.; project administration, V.K.; funding acquisition, V.K. All authors have read and agreed to the published version of the manuscript.

Funding

This publication was funded by the Grant Agency of the Slovak University of Agriculture (GA SPU), project No. 10-GA-SPU-2024 and by the Slovakia’s recovery and resilience plan, project No. 09I03-03-V05-00018—Early Stage Grants at SUA in Nitra.

Data Availability Statement

The datasets generated and analysed during the current study are available from the authors upon reasonable request. Data from ČHMÚ are available online: https://www.chmi.cz/historicka-data/pocasi/denni-data/Denni-data-dle-z.-123-1998-Sb, accessed on 6 August 2024 and data from IMGW-PIB are available online: https://danepubliczne.imgw.pl/, accessed on 29 September 2024.

Acknowledgments

Data for this publication were provided from the following project: “Scientific support of climate change adaptation in agriculture and mitigation of soil degradation” (ITMS2014 + 313011W580) supported by the Integrated Infrastructure Operational Programme funded by the ERDF.

Conflicts of Interest

The authors declare no conflicts of interest.

References

  1. NOAA. Climate Change Impacts. Available online: https://www.noaa.gov/education/resource-collections/climate/climate-change-impacts (accessed on 4 November 2024).
  2. Copernicus. New Record Daily Global Average Temperature Reached in July 2024. Available online: https://climate.copernicus.eu/new-record-daily-global-average-temperature-reached-july-2024 (accessed on 4 November 2024).
  3. WMO. 2024 is on Track to Be Hottest Year on Record as Warming Temporarily Hits 1.5 °C. Available online: https://public.wmo.int/news/media-centre/2024-track-be-hottest-year-record-warming-temporarily-hits-15degc (accessed on 4 November 2024).
  4. WMO. Global Temperature Is Likely to Exceed 1.5 °C Above Pre-Industrial Level Temporarily in Next 5 Years. Available online: https://public.wmo.int/news/media-centre/global-temperature-likely-exceed-15degc-above-pre-industrial-level-temporarily-next-5-years (accessed on 4 November 2024).
  5. Labudová, L. Najnovšia Správa WMO [The Latest WMO Report]. 2024. (In Slovak). Available online: https://www.shmu.sk/sk/?page=2049&id=1486 (accessed on 4 November 2024).
  6. European Parliament. Climate Change in Europe: Facts and Figures. Available online: https://www.europarl.europa.eu/topics/en/article/20180703STO07123/climate-change-in-europe-facts-and-figures (accessed on 6 November 2024).
  7. Markovič, L.; Pecho, J. Teplota Vzduchu Rastie v Európe viac ako Dvojnásobným Tempom v Porovnaní s Globálnym Priemerom [Air Temperatures in Europe Are Rising at More Than Twice the Global Average]. Available online: https://www.shmu.sk/sk/?page=2049&id=1278 (accessed on 4 November 2024). (In Slovak).
  8. EEA. Global and European Temperatures. Available online: https://www.eea.europa.eu/en/analysis/indicators/global-and-european-temperatures (accessed on 4 November 2024).
  9. European Commission. Tackling Climate Change. Available online: https://agriculture.ec.europa.eu/sustainability/environmental-sustainability/climate-change_en (accessed on 6 November 2024).
  10. Yuan, X.; Li, S.; Chen, J.; Yu, H.; Yang, T.; Wang, C.; Huang, S.; Chen, H.; Ao, X. Impacts of Global Climate Change on Agricultural Production: A Comprehensive Review. Agronomy 2024, 14, 1360. [Google Scholar] [CrossRef]
  11. Sobocká, J.; Šurina, B.; Torma, S.; Dodok, R. Klimatická Zmena a Jej Možné Dopady na Pôdny Fond Slovenska [Climate Change and Its Possible Impacts on Slovakia’s Land Fund], 1st ed.; VÚPOP: Bratislava, Slovakia, 2005; 48p, ISBN 80-89128-15-7. [Google Scholar]
  12. Roussos, P.A. Climate Change Challenges in Temperate and Sub-Tropical Fruit Tree Cultivation. Encyclopedia 2024, 4, 558–582. [Google Scholar] [CrossRef]
  13. EEA. Europe Is Not Prepared for Rapidly Growing Climate Risks. Available online: https://www.eea.europa.eu/en/newsroom/news/europe-is-not-prepared-for (accessed on 6 November 2024).
  14. Kišš, V.; Pagáč, J.; Tárník, A.; Čimo, J. Changes in Vegetation Period Length in Slovakia under the Conditions of Climate Change for 1931–2110. Sustainability 2022, 14, 12220. [Google Scholar] [CrossRef]
  15. Melo, M.; Lapin, M.; Pecho, J. Climate in the Past and Present in the Slovak Landscapes—The Central European Context. In Landscapes and Landforms of Slovakia; Lehotský, M., Boltižiar, M., Eds.; World Geomorphological Landscapes; Springer: Cham, Switzerland, 2022. [Google Scholar]
  16. Pecho, J. Klíma na Kontinentoch 21. Storočia—Výrazne Teplejšia a Suchšia [Climate on Continents in the 21st Century—Significantly Warmer and Drier]. Available online: https://www.shmu.sk/sk/?page=2049&id=1041 (accessed on 9 November 2024). (In Slovak).
  17. Mozny, M.; Hajkova, L.; Vlach, V.; Ouskova, V.; Musilova, A. Changing Climatic Conditions in Czechia Require Adaptation Measures in Agriculture. Climate 2023, 11, 210. [Google Scholar] [CrossRef]
  18. Tolasz, R.; Kveton, V. Climate Atlas of Czechia; Czech Hydrometeorological Institute: Prague, Czech Republic, 2007; 256p. [Google Scholar]
  19. Kundzewicz, Z.W.; Matczak, P. Climate change regional review: Poland. Wiley Interdiscip. Rev. Clim. Change 2012, 3, 297–311. [Google Scholar] [CrossRef]
  20. Król-Badziak, A.; Kozyra, J.; Rozakis, S. Evaluation of Climate Suitability for Maize Production in Poland under Climate Change. Sustainability 2024, 16, 6896. [Google Scholar] [CrossRef]
  21. Falarz, M. (Ed.) Climate Change in Poland Past, Present, Future, 1st ed.; Springer: Cham, Switzerland, 2021; p. 584. [Google Scholar] [CrossRef]
  22. Kurpelová, M.; Coufal, L.; Čulík, J. Agroklimatické Podmienky ČSSR [Agroclimatic Conditions of the Czechoslovak Socialist Republic]; Príroda: Bratislava, Slovakia, 1975; p. 270. (In Slovak) [Google Scholar]
  23. Nosek, M. Metody v Klimatologii [Methods in Climatology]; Academia: Praha, Czech Republic, 1972; p. 434. (In Czech) [Google Scholar]
  24. Takáč, J.; Bezák, P.; Ilavská, B. Evaluation of changes the climate indicators in period 1961–1990 and 1991–2016 for the need for the update of agro-climatic regions. In Proceedings of the Soil Science and Conservation Research Institute, 1st ed.; Sobocká, J., Ed.; Národné Poľnohospodárske a Potravinárske Centrum—Výskumný Ústav Pôdoznalectva a Ochrany Pôdy: Bratislava, Slovakia, 2017; Volume 39, pp. 104–125. [Google Scholar]
  25. Gumiński, R. Próba wydzielenia dzielnic rolniczo-klimatycznych w Polsce [An attempt to separate agricultural-climatic districts in Poland]. Prz. Met. Hydr. 1948, 1, 7–20. (In Polish) [Google Scholar]
  26. Huculak, W.; Makowiec, M. Wyznaczanie meteorologicznego okresu wegetacyjnego na podstawie jednorocznych materiałów obserwacyjnych [Determination of the meteorological vegetation period based on one-year observational materials]. Zesz. Nauk. SGGW 1977, 25, 65–72. [Google Scholar]
  27. Bartoszek, K.; Węgrzyn, A. Porównanie wybranych metod wyznaczania dat początku i końca okresu wegetacyjnego na przykładzie Lubelszczyzny [Comparison of selected methods for determining the beginning and end dates of the vegetation period on the example of the Lublin region]. Przegląd Geofiz. 2012, 1, 123–134. (In Polish) [Google Scholar]
  28. Koźmiński, C.; Mąkosza, A.; Nidzgorska-Lencewicz, J.; Michalska, B. Air Frosts in Poland in the Thermal Growing Season (AT > 5 °C). Agriculture 2023, 13, 1228. [Google Scholar] [CrossRef]
  29. USDA. What Are Climate Model Phases and Scenarios? Available online: https://www.climatehubs.usda.gov/hubs/northwest/topic/what-are-climate-model-phases-and-scenarios (accessed on 17 February 2025).
  30. Anthesis. Five Future Scenarios AR6 IPCC. Available online: https://www.anthesisgroup.com/insights/five-future-scenarios-ar6-ipcc/ (accessed on 16 November 2024).
  31. Cuemath. Direct Variation. Available online: https://www.cuemath.com/commercial-math/direct-variation/ (accessed on 16 November 2024).
  32. Cuemath. Percent Error. Available online: https://www.cuemath.com/commercial-math/percent-error/ (accessed on 16 November 2024).
  33. Ceglar, A.; Yang, C.; Toreti, A.; Santos, J.A.; Pasqui, M.; Ponti, L.; Dell’Aquila, A.; Graça, A. Co-designed agro-climate indicators identify different future climate effects for grape and olive across Europe. Clim. Serv. 2024, 34, 100454. [Google Scholar] [CrossRef]
  34. Chervenkov, H.; Slavov, K. Assessment of the future thermal conditions over Europe based on CMIP5 ensemble of agro-meteorological indices. Bulg. J. Agric. Sci. 2022, 28, 972–984. [Google Scholar]
  35. Kern, A.; Dobor, L.; Hollós, R.; Marjanović, H.; Torma, C.Z.; Kis, A.; Fodor, N.; Barcza, Z. Seamlessly combined historical and projected daily meteorological datasets for impact studies in Central Europe: The FORESEE v4.0 and the FORESEE-HUN v1.0. Clim. Serv. 2024, 33, 100443. [Google Scholar] [CrossRef]
  36. Skendžić, S.; Zovko, M.; Živković, I.P.; Lešić, V.; Lemić, D. The Impact of Climate Change on Agricultural Insect Pests. Insects 2021, 12, 440. [Google Scholar] [CrossRef] [PubMed]
  37. Marek, M. Klimatická Změna, Příčiny, Dopady a Adaptace [Climate Change, Causes, Impacts and Adaptation], 1st ed.; Academia: Praha, Czech Republic, 2022; p. 350. ISBN 978-80-200-3362-8. [Google Scholar]
  38. Thunberg, G. Kniha o Klimatu [The Climate Book], 1st ed.; Euromedia Group: Praha, Czech Republic, 2022; p. 446. ISBN 978-802428226-8. [Google Scholar]
  39. Marcinkowski, P. Projections of Climate Change Impact on Stream Temperature: A National-Scale Assessment for Poland. Appl. Sci. 2024, 14, 10900. [Google Scholar] [CrossRef]
Figure 1. Meteorological stations in Slovakia, the Czech Republic and Poland.
Climate 13 00049 g001
Figure 2. Geomorphological units in Slovakia, the Czech Republic and Poland.
Climate 13 00049 g002
Figure 3. Temperature sums in growing season for period (a) 2001–2010, (b) 2011–2020 and prediction if temperature increase (c) the most optimistic scenario +1.5 °C, (d) the next best scenario +2.6 °C and (e) the dangerous scenario +3.6 °C.
Climate 13 00049 g003
Figure 4. Percentage error of temperature sums for (a) the most optimistic scenario (+1.5 °C), (b) the next best scenario (+2.6 °C) and (c) the dangerous scenario (+3.6 °C) for selected meteorological stations in Slovakia.
Climate 13 00049 g004
Figure 5. Percentage error of temperature sums for (a) the most optimistic scenario (+1.5 °C), (b) the next best scenario (+2.6 °C) and (c) the dangerous scenario (+3.6 °C) for selected meteorological stations in the Czech Republic.
Climate 13 00049 g005
Figure 6. Percentage error of temperature sums for (a) the most optimistic scenario (+1.5 °C), (b) the next best scenario (+2.6 °C) and (c) the dangerous scenario (+3.6 °C) for selected meteorological stations in Poland.
Climate 13 00049 g006
Disclaimer/Publisher’s Note: The statements, opinions and data contained in all publications are solely those of the individual author(s) and contributor(s) and not of MDPI and/or the editor(s). MDPI and/or the editor(s) disclaim responsibility for any injury to people or property resulting from any ideas, methods, instructions or products referred to in the content.

