Article

Temperature and Pressure Observations by Tommaso Temanza from 1751 to 1769 in Venice, Italy

by
Dario Camuffo
1,*,
Antonio della Valle
1 and
Francesca Becherini
2
1
National Research Council-Institute of Atmospheric Sciences and Climate, Corso Stati Uniti 4, 35127 Padua, Italy
2
National Research Council-Institute of Polar Sciences, Via Torino 155, 30172 Venice, Italy
*
Author to whom correspondence should be addressed.
Climate 2025, 13(10), 217; https://doi.org/10.3390/cli13100217
Submission received: 19 August 2025 / Revised: 6 October 2025 / Accepted: 16 October 2025 / Published: 18 October 2025

Abstract

The study aims to recover, interpret, and analyze the daily meteorological observations made in Venice by Tommaso Temanza from 1751 to 1769. These records are relevant because they provide direct information about the climate of the Little Ice Age. Temanza used a barometer, an air thermometer of Amontons’ type, and an additional mercury thermometer, i.e., Réaumur’s thermometer. These early instruments are presented and discussed in this study. The barometer readings needed standard corrections, which were unknown at that time. The scale of the air thermometer was arbitrary, and temperatures were measured in inches of mercury. For the Amontons thermometer, Temanza missed the calibration points and used a particular scale with the zero-point in the middle of the range. He gave two contradictory explanations for this choice, both of which are discussed in this paper. In the 18th century, the use of a singular value to represent the average temperature, called “Temperate”, was promoted by Michieli du Crest in Geneva and Toaldo in Padua. This work reconstructs the unknown scale, using contemporary observations by Giovanni Poleni and Giuseppe Toaldo in Padua (30 km west of Venice) and snowfall reported in the weather notes to determine the temperature point at 0 °C. A discussion is made about the calibration, validation, and conversion of readings from the original to modern units of pressure and temperature, i.e., hPa and °C, respectively. The recovered record of Venice is presented in comparison with Padua, Bologna, and Milan. The paper provides and analyzes the new dataset, and improves knowledge about the climate, history of science, instruments, and observations made in the mid-18th century.

1. Introduction

In the 18th century, scientists were experimenting with different methods to measure air temperature. The definition of temperature was vague, and scholars preferred to speak in terms of degrees of heat and cold, associated with hot or cold sensations, respectively, to deviate from an intermediate value taken as a basis. In 1741, Jacques Barthélémi Michieli du Crest [1] invented a universal thermometer, taking the temperature of deep caves as reference [2]. Thermometers with several parallel scales were also used, and tables comparing the various scales were diffused [3,4,5]. Each observer used one or more thermometers, with different scales, so comparison was not easy, and sometimes not even possible. In 18th-century Italy, there were a variety of thermometers, i.e., some Florentine spirit thermometers, Amontons and Stancari air thermometers, and spirit or mercury Réaumur thermometers. In the first half of the 18th century, the Amontons thermometer was used by Giovanni Poleni in Padua from 1725 to 1761 [6] and in Venice by Bernardino Zendrini from 1738 to 1743 [7]. In the second half of the century, scientists stopped using air thermometers, with the exception of Temanza, who used them from 1751 to 1759 in Venice.
Tommaso Temanza measured air pressure, air temperature (with an Amontons air thermometer, and then a Réaumur thermometer), precipitation, and sea ebb and flow [8,9,10]. It may be useful to specify that Temanza was not interested in meteorology, but to inform Venetian citizens about temperature. In the 18th century, people were not familiar with thermometers and the variety of different scales that were in use. It seemed logical to use an intuitive scale indicating whether it was warm or cold. Qualitatively speaking, the temperatures of heat were positive, and the temperatures of cold were negative. From a quantitative perspective, the larger the value of the reading, the larger the departure from the standard temperature.
The scale of the air thermometer was based on the difference between the observed mercury level and a fixed reference marked X on the scale (i.e., the “normal” situation), calculated as an intermediate value between two reference points. This concept was developed by Giuseppe Toaldo [8], who named it “Temperate”, and defined it as the average of all data from a certain site, e.g., the “Temperate” of Padua was 12 °R = 15 °C, which was the average of all the Poleni readings from 1725 to 1761 [8]. However, the “Temperate” used by Temanza was unclear because he omitted to report the instrument calibration and the definition of the intermediate reference point X. In his personal notes, we found two different definitions of X, which we will discuss in Section 3.2.3.
The use of arbitrary units, the lack of calibration and other useful metadata discouraged scholars from analyzing Temanza’s readings. Two centuries ago, the Danish climatologist Schouw concluded bitterly, “I do not believe that conclusions can be drawn from these data” [11]. In fact, all the meteorological observations made in Venice during the 18th century can be criticized. Referring to the Venice observers (including Zendrini and Temanza), Schouw was strongly skeptical and categorical: “all these data cannot be trusted” [11]. This severe judgment was justified from the point of view of those who looked back and noted various flaws in the technical–scientific rigor. However, even if the data provided by the early pioneers were taken in a non-standard way, they constitute the only information available for Venice, obtained during the coldest period of the Little Ice Age. They cover a period in which instrumentally acquired meteorological observations were very rare; thus, the data deserves the utmost attention to ensure as much information is extracted as possible.
This article aims to study and retrieve the pressure and temperature observations made by Temanza, using the following framework: copy, interpret, correct, convert original measurements to modern units and analyze them, and provide answers or the most plausible hypothesis to all the issues listed above. An interpretation of the arbitrary temperature scale is proposed, with reference to °C. The X-reference point (i.e., the “Temperate”) has been identified, as well as the instrument’s location (inside or outside). Finally, the daily temperature and pressure readings have been corrected and transformed into modern units, making the dataset available to the scientific community.

2. Observers, Instruments, Data, and Metadata

2.1. The Observers

To understand the observational methods and the instruments used by Temanza, the investigation should start years earlier in Padua, a town 30 km away from Venice.
Marquis Giovanni Poleni (born in 1683; died in 1761) (Figure 1a), a professor at the University of Padua, as well as a mathematician, physicist, engineer and architect, initiated the series of meteorological observations made in Padua in 1725 [6,12,13]. Giovan Battista Morgagni (Figure 1b), a great friend and fellow of Poleni, despite being a medical doctor, helped Poleni build an air thermometer in 1709 [14,15]; in 1740, he started a second parallel series of observations, which he discussed daily with Poleni [6].
The first meteorological observations in Venice were made by Bernardino Zendrini, a colleague and friend of Poleni, who published a summary of readings from 1738 to 1743 [16,17,18,19,20]. Unfortunately, he did not provide information on how to interpret the thermometer scale or the calibration points, so his measurements were considered useless [8,11]. Nevertheless, it has recently become possible to rescue and interpret them [7].
Some years after Zendrini’s death in 1747, Tommaso Temanza (born in 1705; died in 1789), a friend and former disciple of both Poleni and Zendrini (Figure 1), decided to continue with the measurements in Venice (Figure 1d). Temanza was a famous writer, architect, historian, and hydraulic engineer, and in 1742 he became chief architect of the Magistrate of the Waterways of the Most Serene Republic of Venice. In 1751, Temanza began a series of daily regular meteorological observations that included atmospheric pressure, air temperature, precipitation, and comments about the weather. He also reported the ebb and flow of the sea, and this information was retrieved and analyzed by Raicich [21]. Temanza was highly regarded by his contemporaries, and in 1762, Pope Clement XIII Rezzonico appointed him to manage the rivers of the Papal States in Emilia and Romagna. He stopped his local business and decided to leave Venice with his wife for a long cultural trip through Italy that included stops in Florence, Rome, Naples, Ercolano, and Bologna [22,23]. This explains why, at the end of July 1763, Temanza interrupted his series of meteorological observations published in the Giornale di Medicina (i.e., Journal of Medicine), and why the editor Orteschi replaced such a famous scientist with Niccolò Pollaroli, a physician of ordinary competence.

2.2. The Instruments

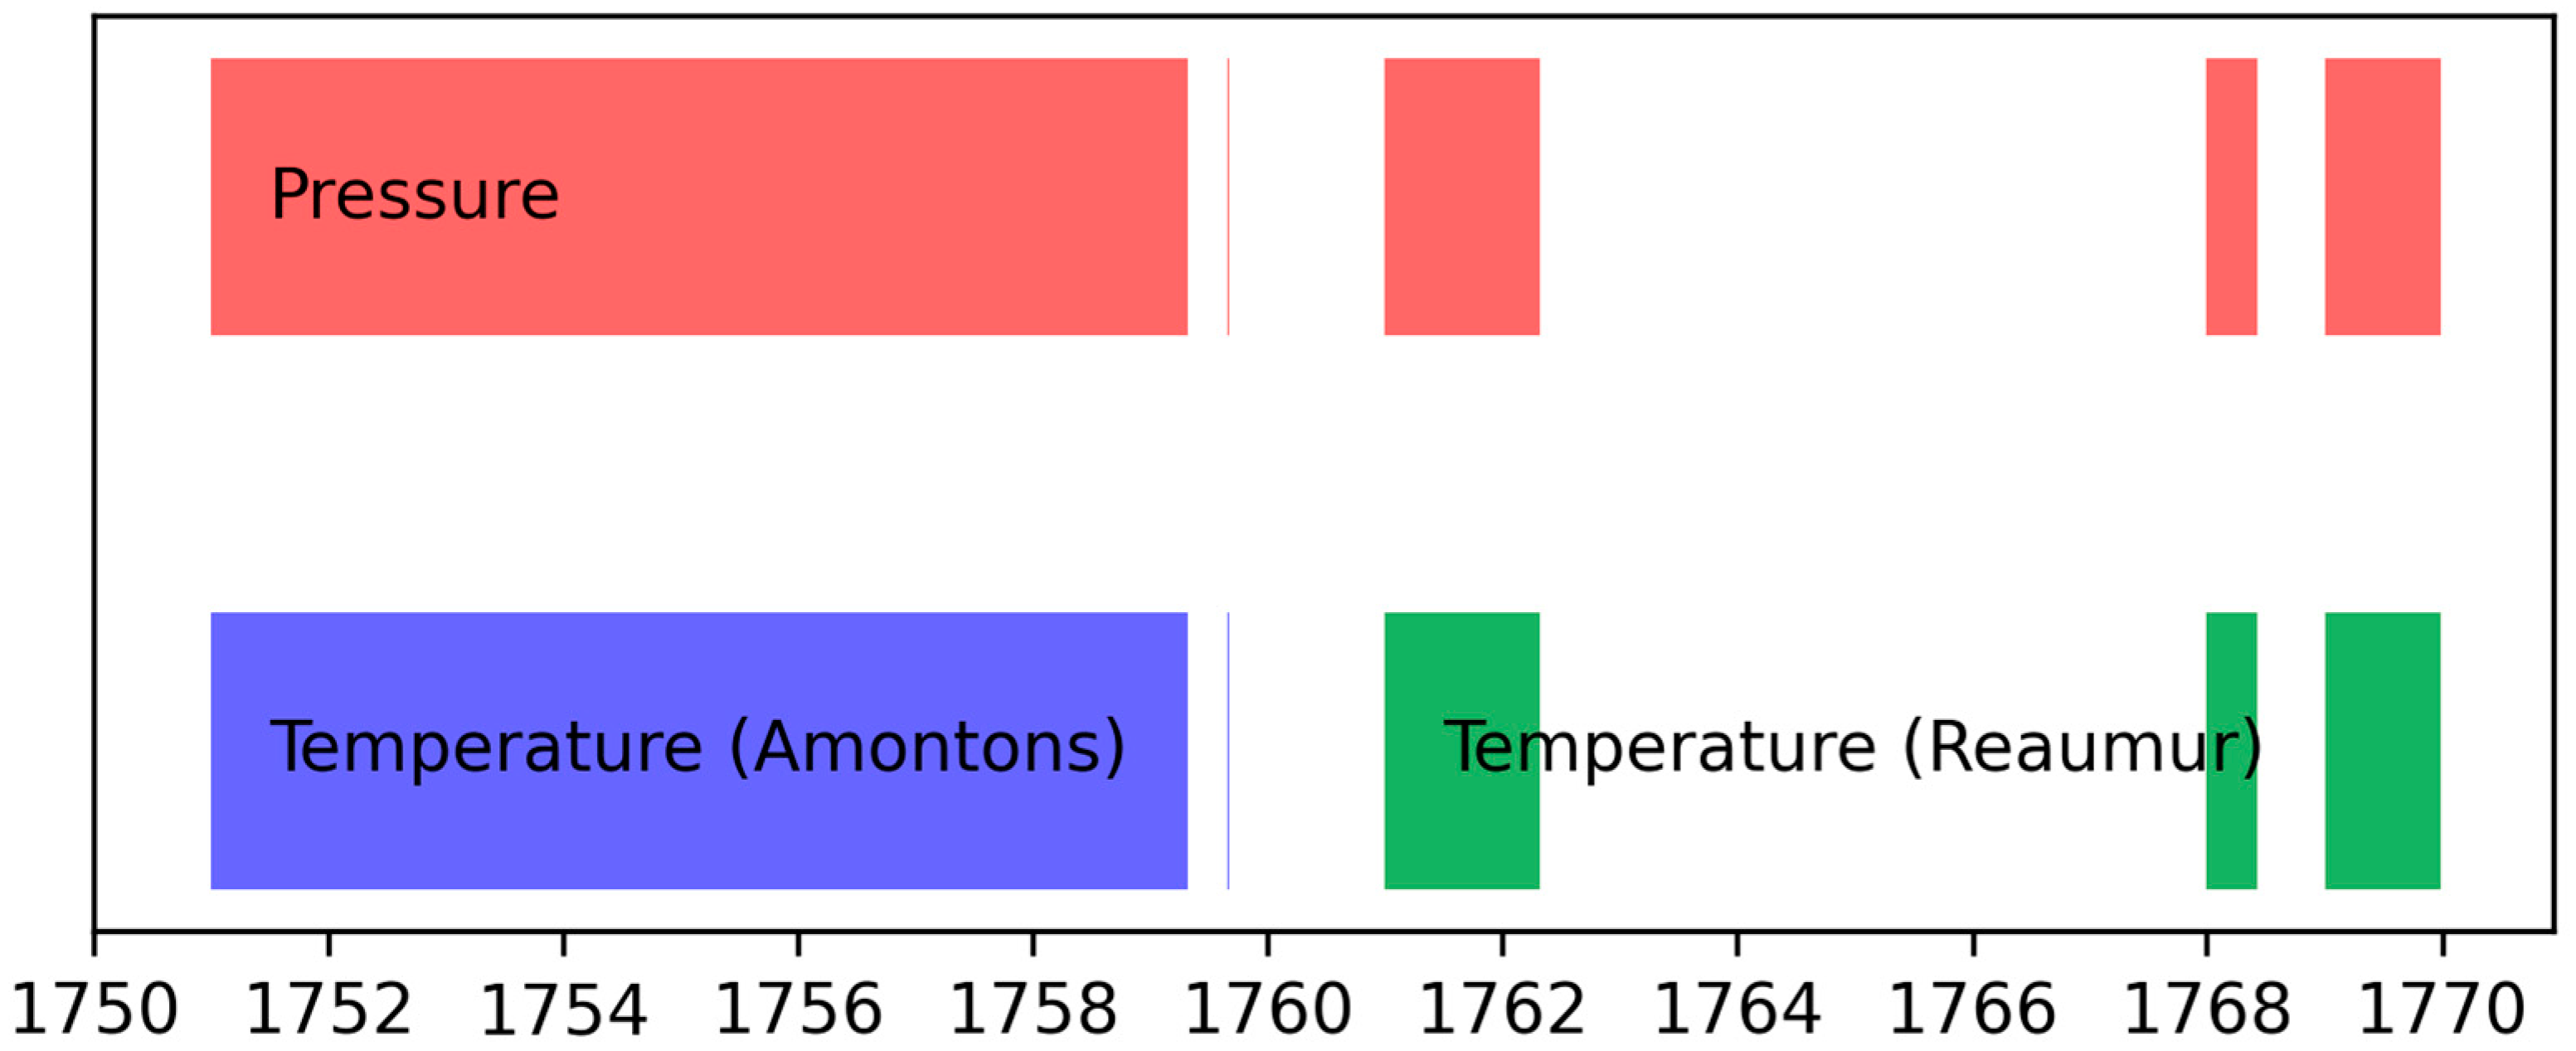
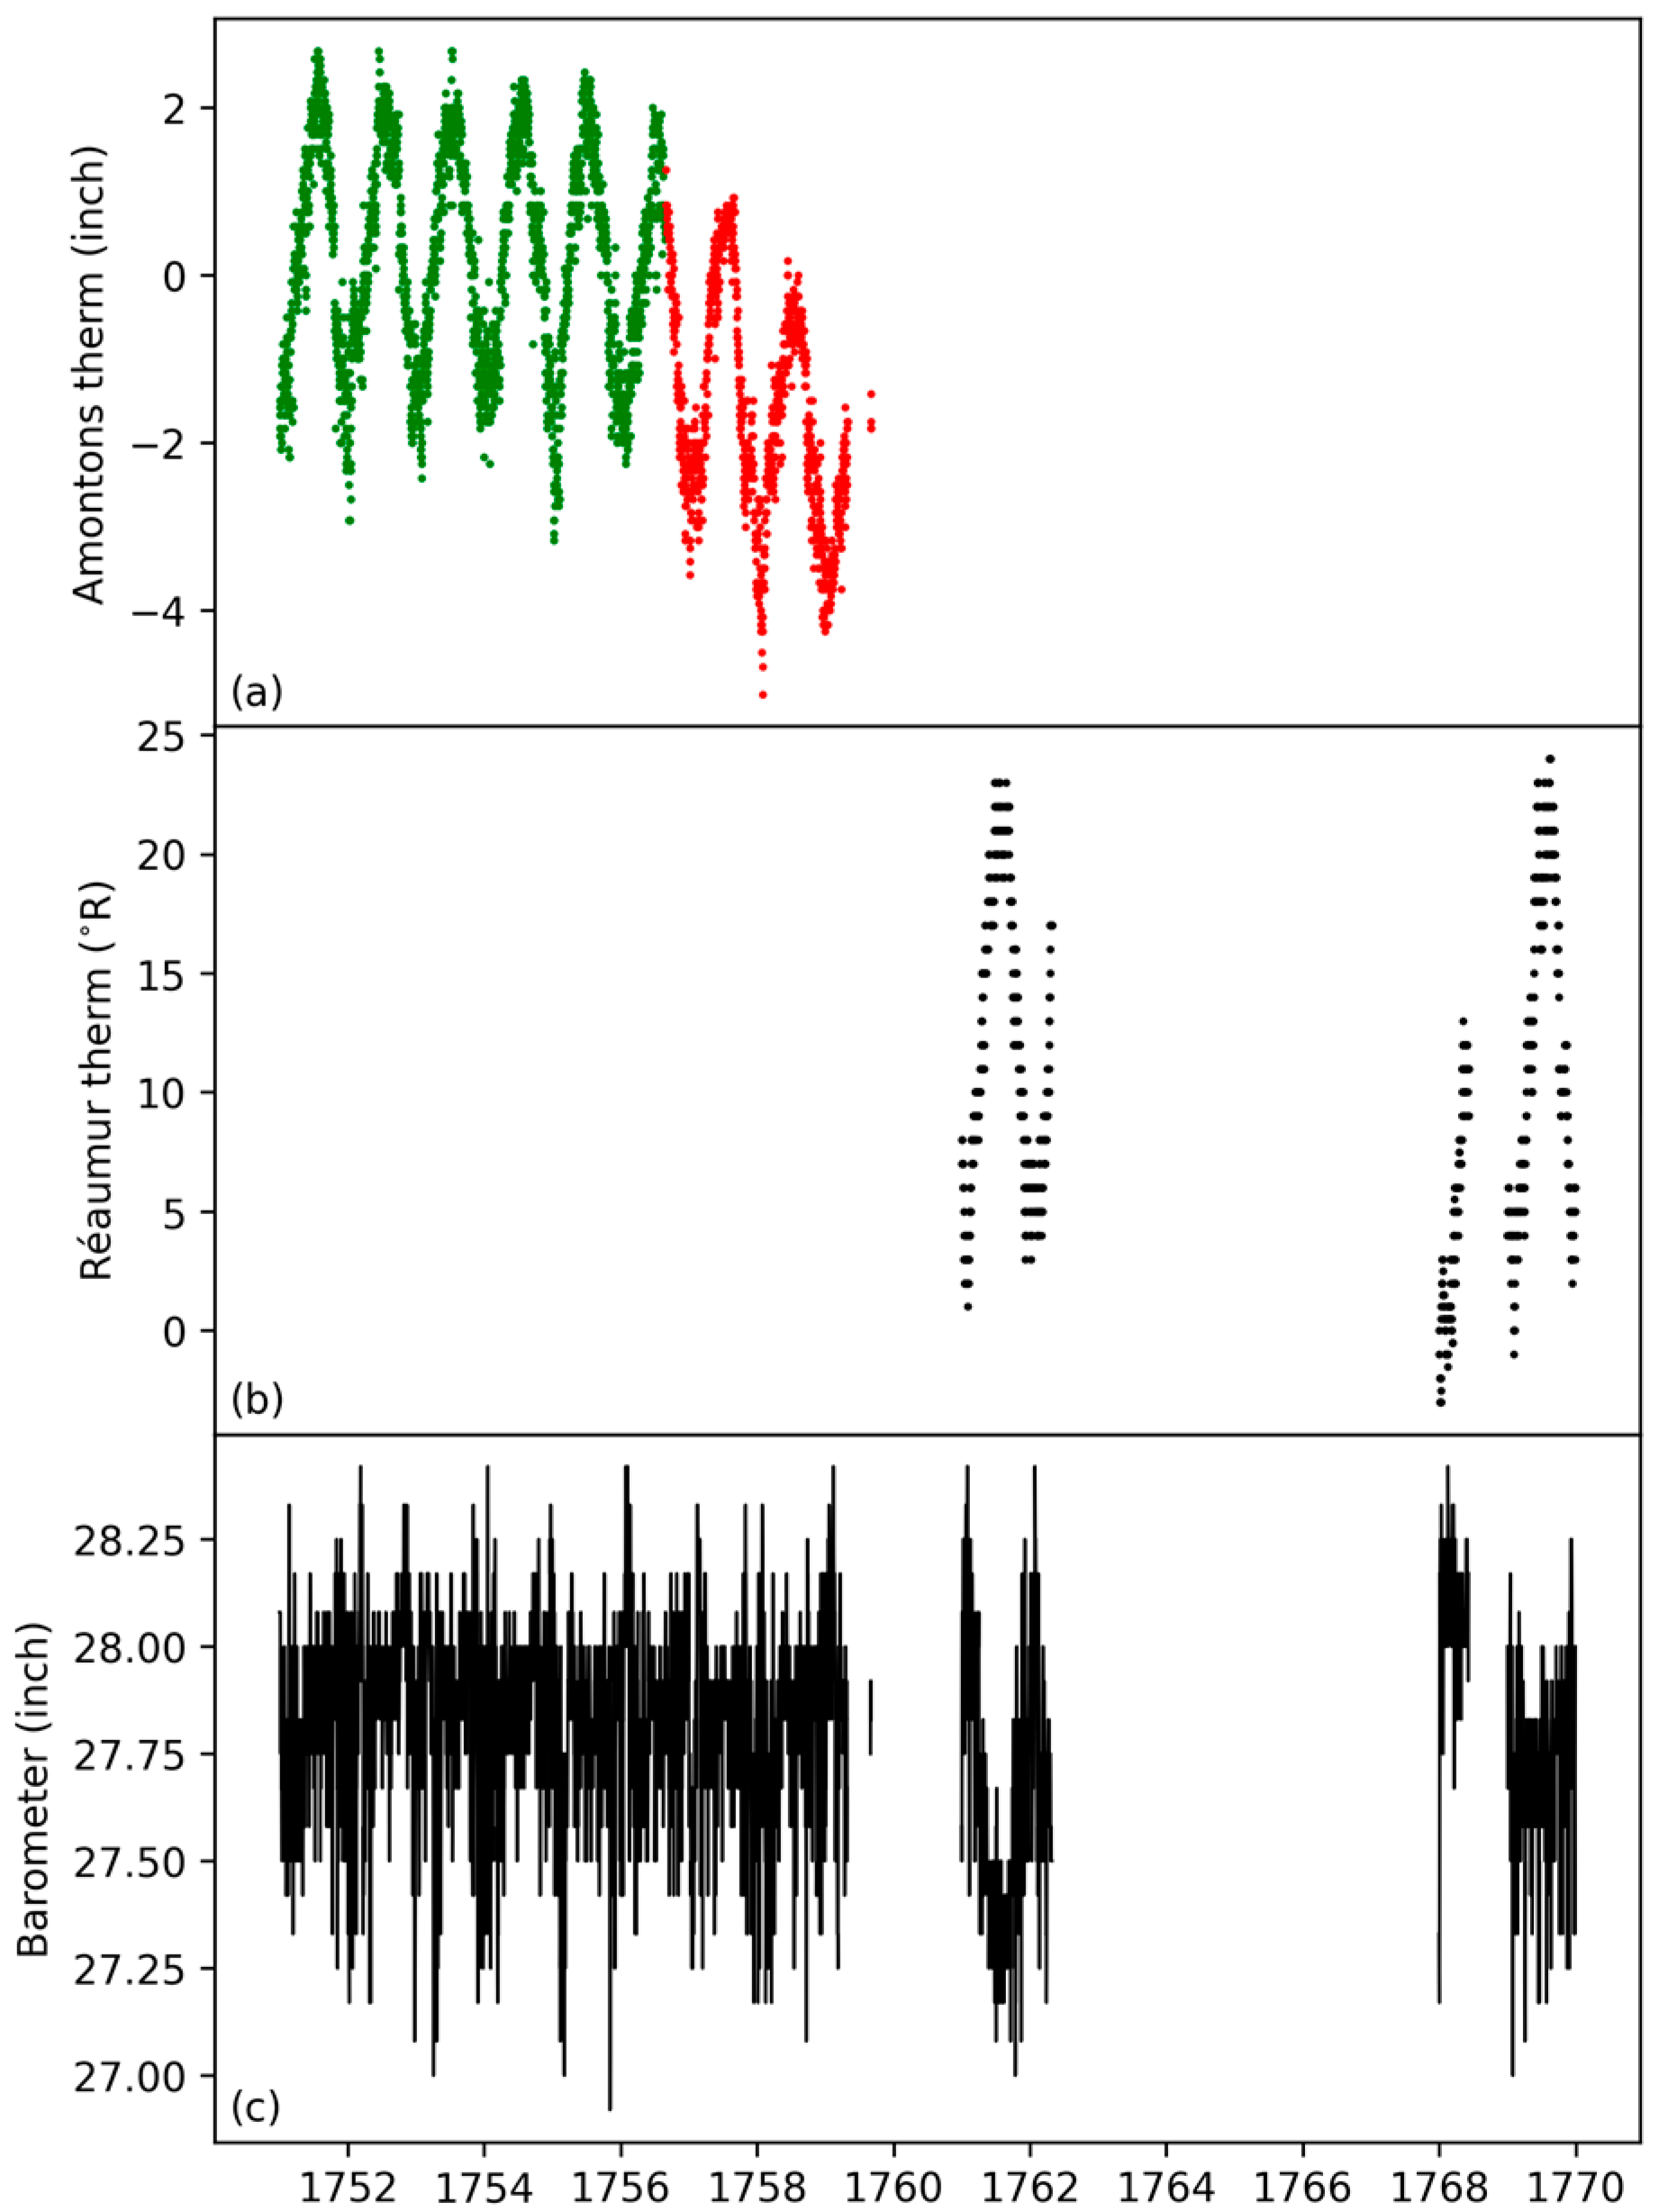
The timeline of the observations made by Temanza is reported in Figure 2. From 1751 to 1759, the activity was regular, but then they are no longer. Temanza used a barometer, an Amontons thermometer (from 1751 to 1759), and a Réaumur thermometer (from 1761 to 1769) [6,11,24]. These instruments are shortly presented in this section and extensively discussed in Section 3.

2.2.1. The Barometer

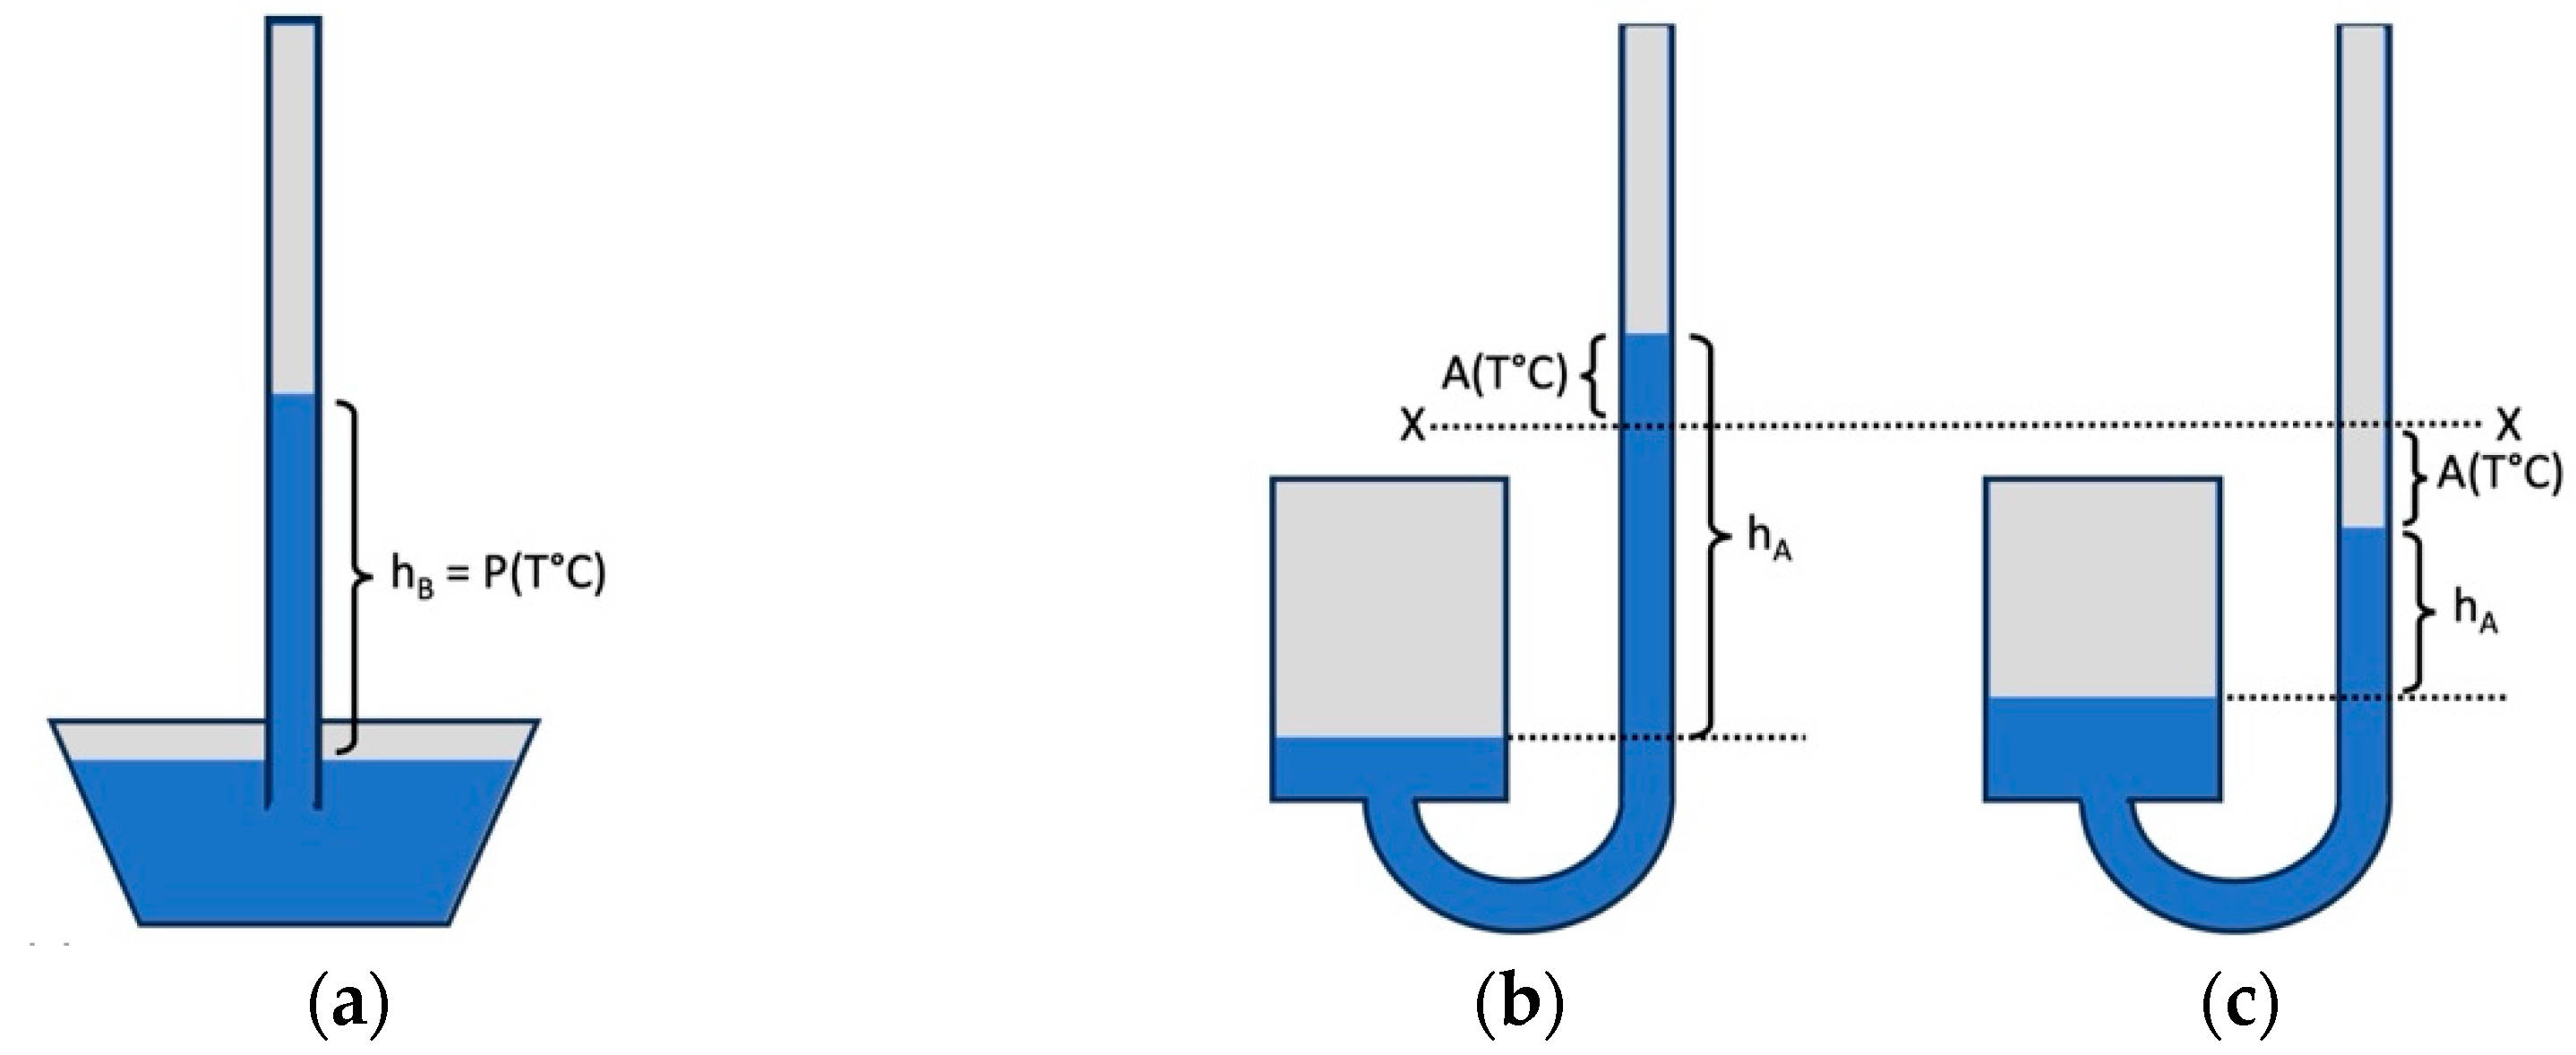
Temanza did not write anything about the barometer, so it can reasonably be assumed that it was the normal type of cistern barometer, as invented by Torricelli, and used also by Poleni in Padua (Figure 3a). Capillarity and other instrumental errors are discussed in Section 3.4. Regarding the standard corrections for barometric readings [25,26], some are necessary while others are not.
The error for the different density of mercury due to thermal expansion has been corrected to a standard temperature of 0 °C.
The correction for latitude was not necessary because the latitude of Venice is 45°26′ N, close to the standard latitude for calibration 45°32′40″.
The correction for elevation cannot be made because the Temanza’s home and the floor where he lived are unknown, but the bias is certainly small. In Venice, the pavement is close to sea level. With reference to 2020, the city starts to flood when the sea level exceeds the zero reference in 1876 (called ZMPS) by 90 cm, and 50% of the streets are flooded when the level reaches 135 cm ZMPS [27]. If one considers the eustatic sea level rise and the land subsidence that has occurred since 1876, today the average height of the paving is about 1 m above the mean sea level. When Temanza took his measurements, the sea level was 60 cm lower [28,29]. As the residential buildings could reach four floors, assuming a middle position, the pressure correction due to the elevation is less than 1 hPa. This correction can be neglected to avoid over-corrections, especially when they are uncertain and less than 1 hPa.
A random error may be due to wind. In the 18th century, barometers were in rooms with unsealed windows; during incidences of strong wind, the air pressure in the room could increase (windows facing wind direction) or decrease (windows in the opposite direction). The prevailing wind in Venice is from the northeast (Bora) and may have altered the actual atmospheric pressure during windy days, which are fortunately infrequent in Venice. Following information from WMO [30], in strong wind conditions, the error may reach or exceed 1 hPa.

2.2.2. The Amontons Thermometer

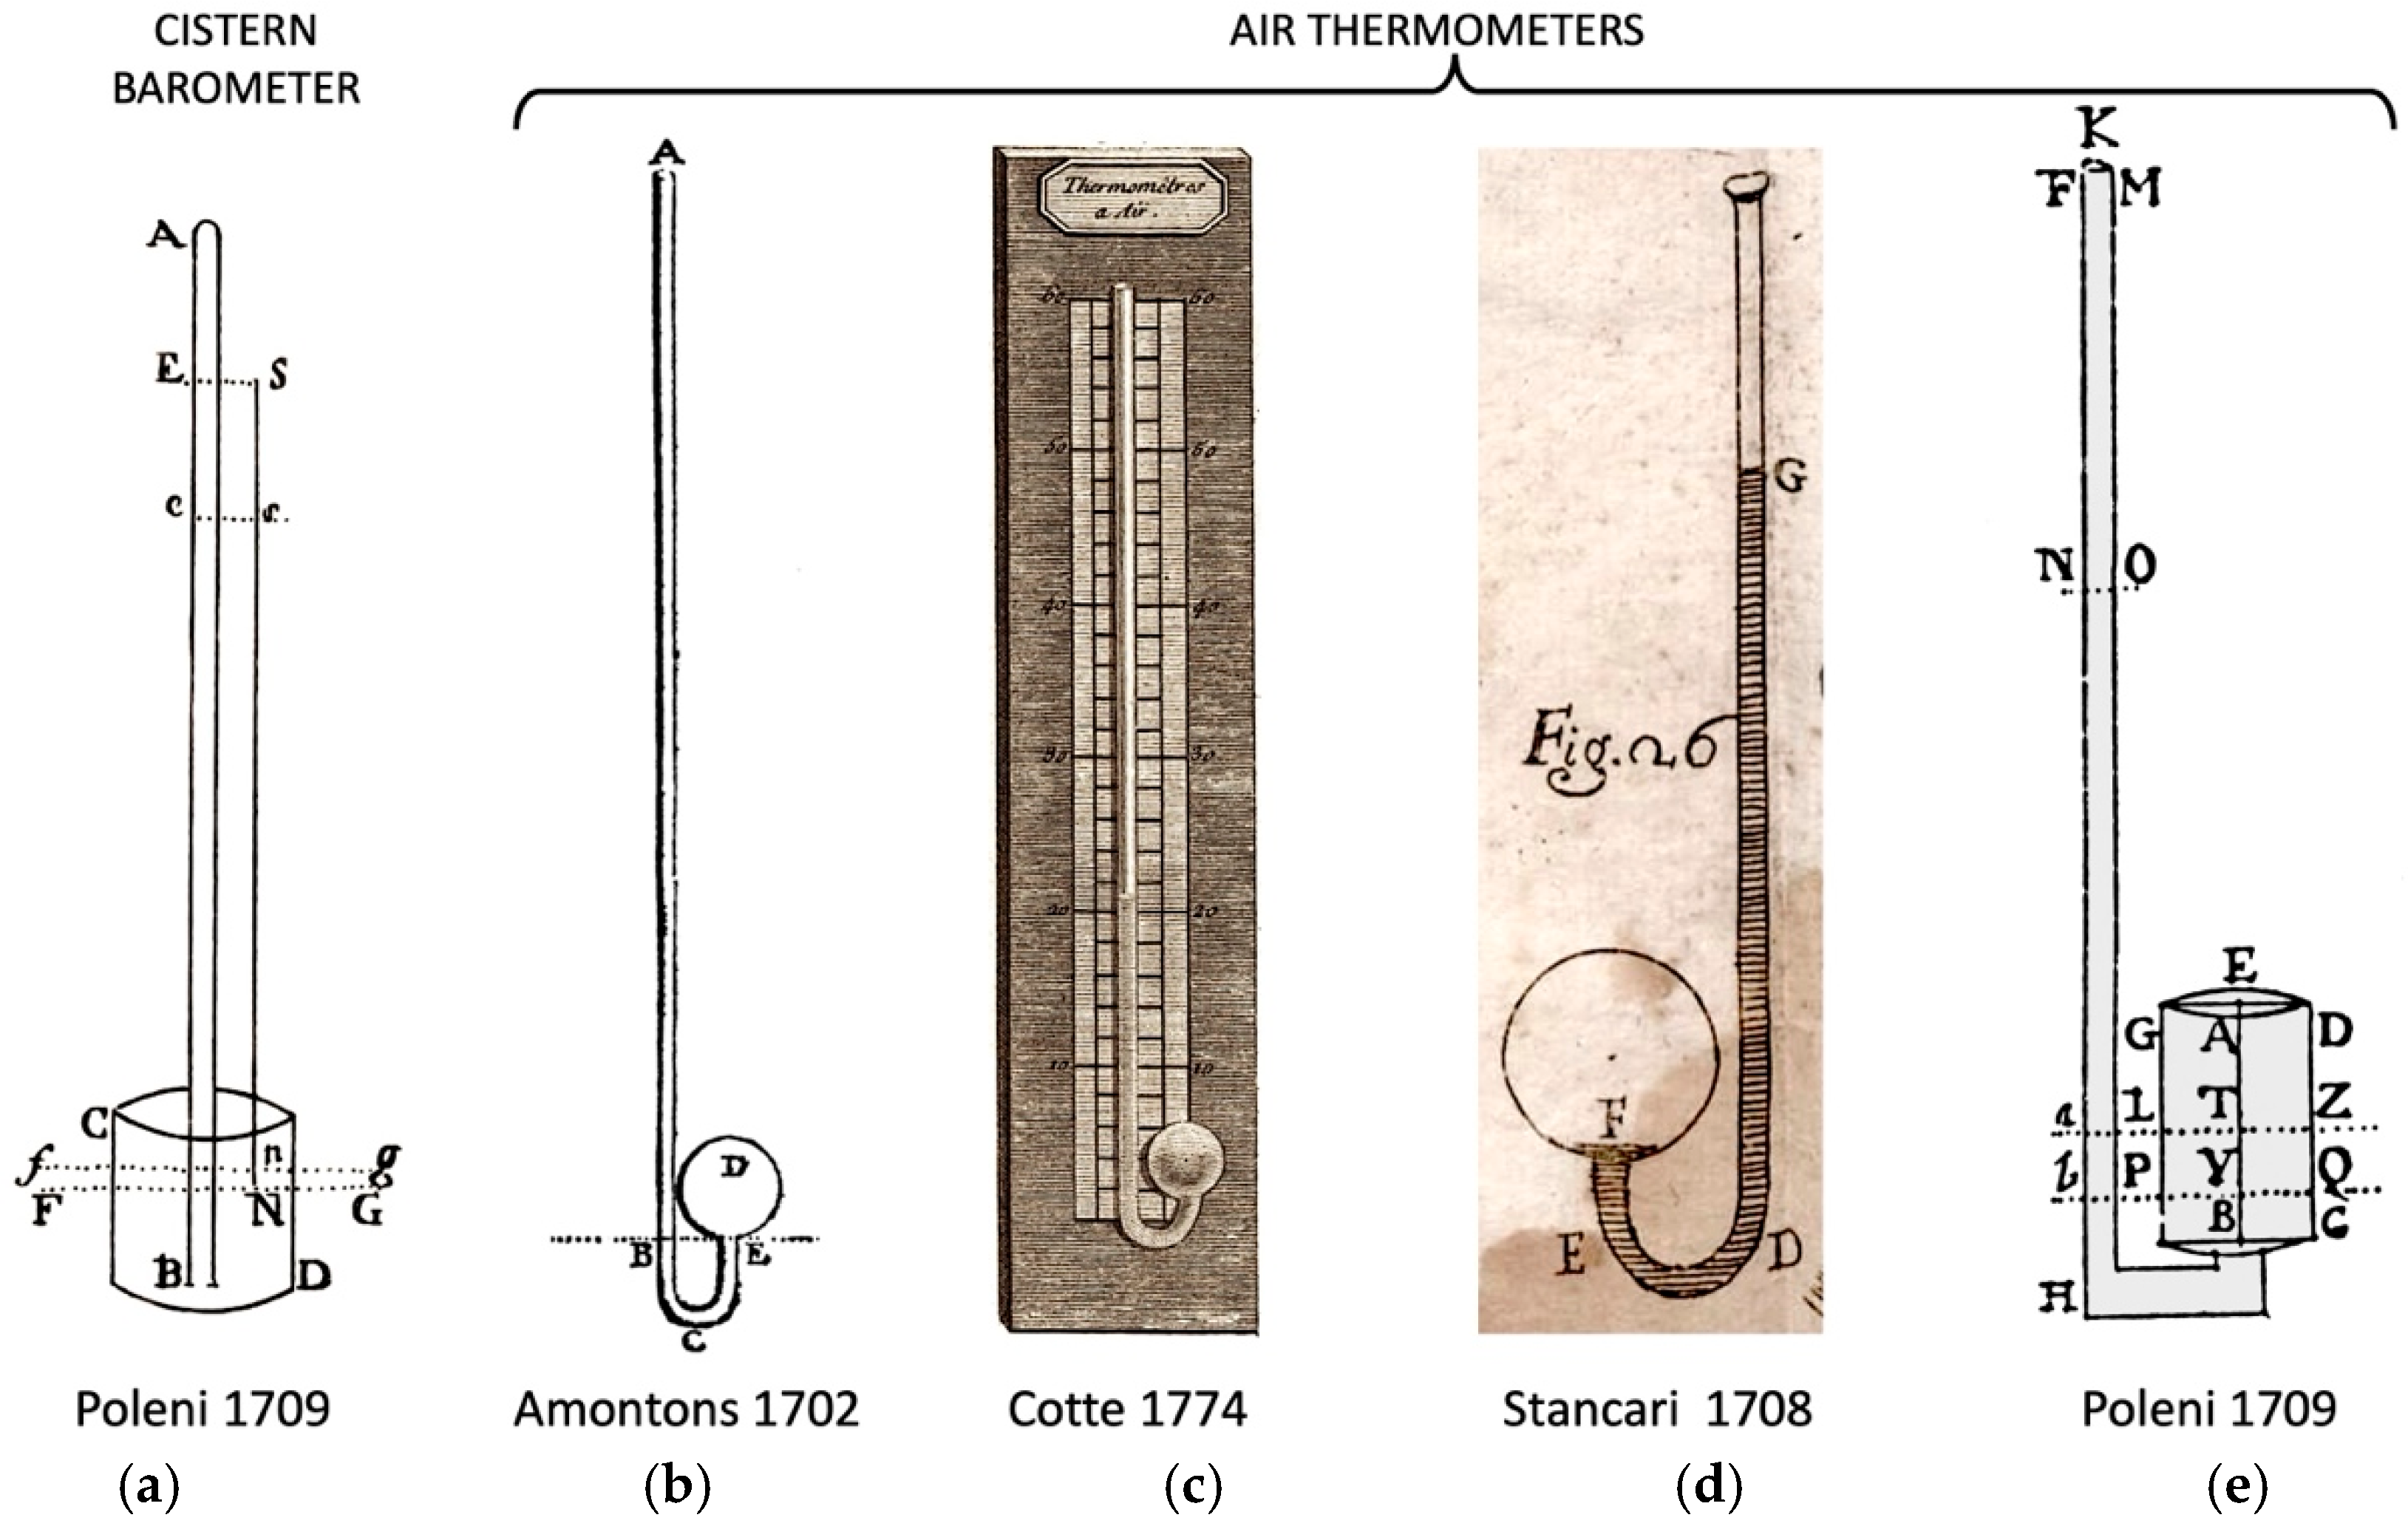
A commonality between Poleni, Morgagni, Zendrini, and Temanza, in addition to their friendship and interest in meteorology, was the use of the Amontons air thermometer (Figure 3b,c). In 1709, Poleni and Morgagni built an Amontons thermometer together [14], and Poleni used it throughout his life. Zendrini used an Amontons and a Delisle thermometer in Venice [7,17].
Temanza began his measurements in 1751, four years after Zendrini’s death. In 1750, he was working in Padua at the facade of S. Margherita’s church, and on this occasion, he reestablished contact with Poleni and Morgagni and was inspired by their interest in meteorology. It is possible that Temanza received the Amontons thermometer from his friend Zendrini before he died in 1747, or from his heirs. This thermometer was not very popular in Italy because of its complexity and the fact that it was fragile and vulnerable even to minor movements [31], due to the free oscillations of the mercury that behaved as a water hammer inside it.
Based on current knowledge, only Poleni, Zendrini, and Temanza used Amontons thermometers in Italy. When Belli [32] made a list of the different thermometers used in the first half of the 19th century, he wrote the following about this air thermometer: “the Amontons air thermometer perfected by Stancari” [32], i.e., it had a sealed tube and was therefore immune to external pressure (Figure 3d). In practice, he did not even consider that the “true” Amontons thermometer could be listed among the thermometers. This makes the study of this instrument even more intriguing.
Figure 3. (a) Cistern barometer built by Poleni. AB is the tube, SN is the scale, and CD is the cistern (after Poleni, 1709 [14]). (b) Drawing representing the Amontons air thermometer with spherical flask D and open top A of the tube (after Amontons 1702 [33]). (c) The “true” Amontons thermometer with spherical flask, fixed to a wooden tablet, from Temanza’s time (after Cotte 1774 [3]). (d) Drawing representing the Stancari air thermometer with spherical flask F and sealed top of the tube (after Stancari 1713, posthumous [34]). (e) The Amontons thermometer improved by Poleni with its cylindrical bulb and open top K of the tube (after Poleni 1709 [14]).
Climate 13 00217 g003
In 1702, Amontons considered that the thermoscope invented by Galileo was sensitive to two atmospheric variables: air pressure and temperature. Therefore, he had the idea to measure the air temperature using both a barometer (Figure 3a) and a thermoscope (Figure 3b) [33]. The thermoscope (which was improperly called “thermometer”) had the upper top of the tube left open, so that the pressure in the flask was the sum of the pressures exerted by the air pocket and the atmosphere. In conclusion, the “true” Amontons thermometer was a thermoscope according to the Galilean tradition, i.e., a kind of U siphon manometer to measure—using the height of the column of mercury—the pressure that was exerted inside the flask containing air (which functioned as the bulb). It was coupled with a barometer to compensate for the air pressure. This instrument became popular in France (Figure 3c) as confirmed by Cotte [3], but not in Italy. In Bologna, in 1708, Vittorio Francesco Stancari tried to make it independent from atmospheric pressure by sealing the top of the thermometer tube [35] (Figure 3d). Jacopo Bartolomeo Beccari and Gusmano Galeazzi used this improved instrument from 1715 to 1737 but then abandoned it [36].
The bulb of the original Amontons thermometer was a spherical flask (Figure 3b,c). Stancari [35] also adopted the same spherical shape for his thermometer (Figure 3d). On the other hand, Poleni had deliberately chosen a cylindrical flask (Figure 3e) [14] to keep the dimension of the free surface of mercury unchanged, thus avoiding the non-linearity generated by the spherical flasks [6,14]. Therefore, the instruments used by Poleni, Zendrini, and Temanza, were not “true” Amontons thermometers, but improved Amontons thermometers, with the addition of the cylindrical bulb devised by Poleni.
Temanza was a student of Poleni, and Poleni held his lessons and kept his meteorological instruments at home in “Contrada San Giacomo” (now Beato Pellegrino street) [37,38,39,40]. Therefore, it is certain that Temanza noted the cylindrical bulb on Poleni’s modified Amontons thermometer, as well as the explanation that cylindrical bulbs have a linear response, while spherical bulbs do not [14]. It is also possible that Temanza used the same instrument as Zendrini.
The Amontons thermometer used by Temanza had four problems:
  • Unknown scale.
  • Missing the fixed calibration points (i.e., melting ice and boiling water).
  • Undefined reference value X (the “Temperate”).
  • Moisture entrapped in the air pocket.

2.2.3. The Réaumur Thermometer

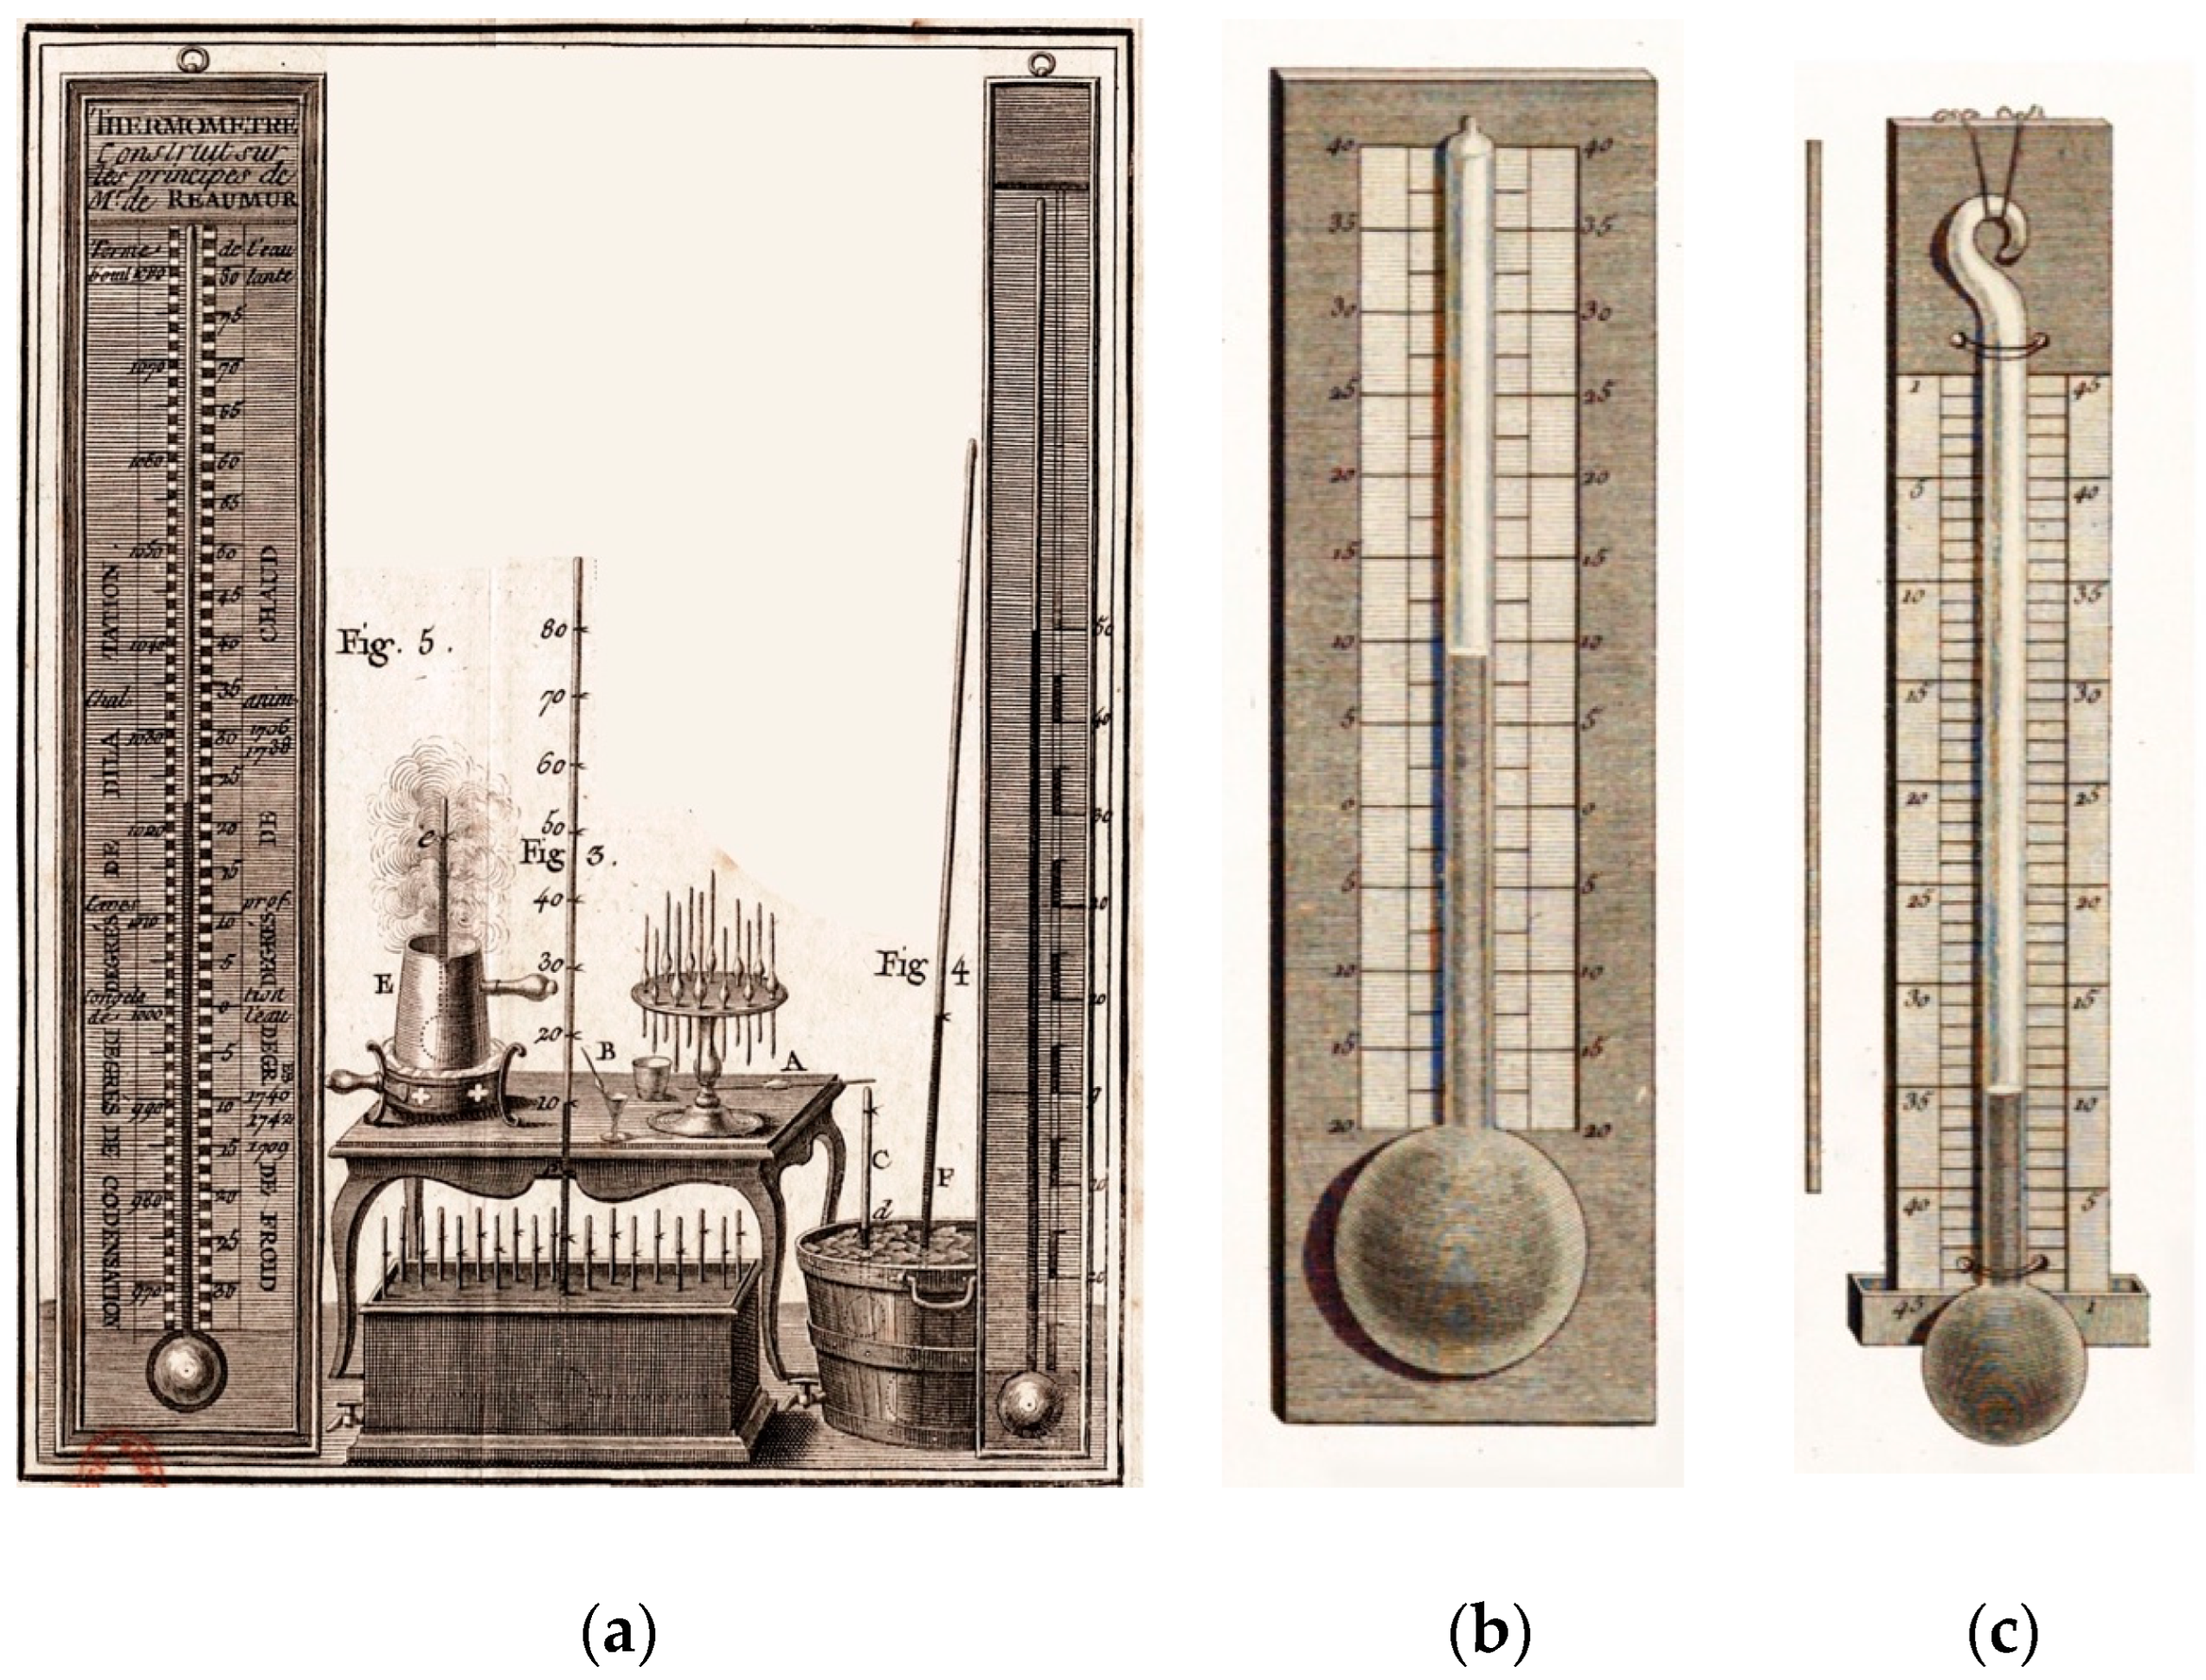
In the 30s of the 18th century, Réaumur [41,42] proposed a new type of calibration method using only one point: the freezing temperature of the water. He obtained the graduated scale by pouring known volumes of thermometric liquid into flasks to simulate thermal expansion (Figure 4a). This volumetric scale, which De Luc [43] called “the true Réaumur scale” (historically indicated as °Re), led to poor results, and around 1740 Réaumur was forced to abandon it and return to using a thermal scale based on two calibration points: the melting point of the ice (0 °Re) and the boiling point of spirit (80 °Re) [44]. The Réaumur thermometers that arrived in Italy were of the second type with the “false scale” (historically indicated as °R, with ice melting at 0 °R and water boiling at 80 °R), which was, according to the definition of De Luc [43], universally known as the Réaumur scale [45,46,47,48]. The glassware, composed of a bulb and a capillary tube, was fixed to a wooden tablet with an iron wire (Figure 4b,c). As the wooden board shrunk or swelled due to changes in humidity, the wire could break the glassware. Therefore, this thermometer could not be used outdoors. Morgagni in Padua was among the first to use this thermometer, starting from 1740. Temanza started to use it in 1761.

2.3. Handwritten Register and Metadata

Temanza’s manuscripts consisted of loose sheets with observations and notes. They are kept in the Historical Archive of the Istituto Nazionale di Astrofisica (i.e., National Institute of Astrophysics) (INAF HA) in Padua. These manuscripts contain monthly tables, sorted with the reprocessed daily data, since the temperature column is referred to a determined median value X after one year of measurements. The original readings of the mercury heights of the Amontons thermometer are unknown. Unfortunately, this absence prevents us from making the reverse route to identify the arbitrary reference X assumed as the zero-point. Tables with data from 1761 and 1762 were published in the Medicine Journal by Orteschi, but with this obscure scale, no one could understand them [10]. The data taken in the various periods from 1751 to 1769 are reported in Table 1.

2.4. Thermometer Exposure

The thermometer exposure constitutes a further unknown. Neither Zendrini nor Temanza specified whether their thermometers were kept indoors or outdoors. Given the technology of the 18th century, air thermometers had the scale marked in ink on paper and glued to a wooden tablet. In addition, as shown in Figure 4b,c, the wooden tablets could not be exposed directly to rain or sunshine, so they could not be placed outside [48]. On the other hand, the network of the Royal Society, London, recommended keeping the thermometer inside a room, possibly exposed to the north, where the fireplace was never lit [50]. Only towards the end of the century did thermometers become suitable for the outdoors, and they were used with the network of the Palatine Meteorological Society [51].
Poleni followed, as much as possible, the directives of the Royal Society, London, given by the secretary Jurin [50] (except with regard to the orientation of the room). Before each reading, he made sure the room was well ventilated, so as to bring the thermometer in equilibrium with the external air [6]. Of course, Poleni was correct in ventilating the room, but he did not imagine that this would not completely solve the thermal contribution of radiant balance with the room walls.
Jurin [50] also suggested measuring temperature indoors, in a north-facing room where the fireplace was never or hardly ever, lit, following the usage introduced in 1660 by John Locke in London.
We can imagine two practical explanations for the choice of indoor exposure. (i) In the first half of the 18th century, thermometers were not resistant to outdoor weather exposure. (ii) The Royal Society, London, was focused on medicine, and was interested in relating weather to morbidity, and in particular, the indoor climate where people lived.
Toaldo affirmed that Temanza diligently followed Poleni. The translation of the original text in Latin is as follows: “I think the thermometers were kept indoors. Certainly Mr. Temanza, whose studies deserve credit, followed Poleni’s teaching and observed at home […]: its average value is worth a little bit more, 12.41 °R [15.5 °C])” [52]. This passage was taken up by Schouw who wrote: “Toaldo (1788) gives as mean of ten-year observations of Temanza 12.41 °R [15.51 °C] but adds that Temanza observed at home” [11].
Indoor exposure complicates things because the internal temperature does not coincide with the external temperature, making it difficult to recognize calibration points, either directly or by comparison with the contemporary values. Both Temanza in Venice and Poleni in Padua measured temperature indoors; their readings are homogeneous and comparable.
Commenting on Poleni’s measurements, Toaldo [8] wrote: “If the Thermometer had been exposed to the open air, higher values would have been recorded, both for heat and cold, without affecting the average”. The same can be said for Temanza.

2.5. Reading Time

During the first recording period (1751–1755), Temanza did not include the hour of his observations. Instead, in his tables of meteorological observations published in Orteschi’s Journal of Meteorology in 1762–1763 [10], a subtitle specified that measurements were: “made at noon according to the Italian time». He likely always made his observations at noon because that was Poleni’s practice, and Poleni was considered a luminary on this subject.
For Italian time, the day started at sunset, so the time at noon and sunrise changed every day, following the seasons. However, noon was a solid reference, being the instant of the culmination of the sun, i.e., the highest altitude reached at the passage across the local southern meridian. Clocks were reset daily at noon. Upon the culmination of the sun, a cannon shot was fired, a flag lowered, and all the bells rang [53]. Astronomers had special devices—some had clocks—and the common people used sundials.
However, whatever the true reason for performing the readings at noon, Toaldo confirmed that several times. Toaldo wrote that “Temanza followed the example of his master Poleni and measured in the meridian hour (the hour when the Sun crosses the local meridian)” [52] and he later stated that “We have the old observations made with great diligence in Venice by Tommaso Temanza, Public Architect and engineer of Waters. However, he observed at noon, and we have no information for the other hours” [54]. Schouw [11] relied on Toaldo and assumed that Temanza always observed temperatures at noon.
Temanza kept his thermometer indoors. Measurements were affected by the thermal inertia of the envelope and poor ventilation exchanges. The building acted as a filter that smoothed the daily cycle with small departures from the average [48,55,56].
His choice to take readings at noon has no theoretical explanation. This practice was established in 1723 by the network of the Royal Society, London: “Further to improve this part of natural history; therefore, Jurin recommends the curious to mark in their diary, once a day at least, the height of the barometer and thermometer, the course and strength of the wind, the face of the heavens, the rain and snow…” [50].
We should consider that the scientists who joined the Royal Network were socially high-ranking people with their own jobs, and could afford to devote just a few minutes a day to recording their observations. It was realistic to ask them to keep the instruments at home, and read them at noon, when they returned home for lunch.
A single measurement per day is poorly representative of the overall day. However, if the instrument was inside a building, the thermal capacity of the masonry could act as a low-pass filter and provide an average value of the external variability. Jurin could be inspired by the fact that cellars and basements tend to maintain the same temperature. Based on this principle, he may have sensed that the building could give a naturally averaged temperature value, representative of 24 h or even more. However, these are theoretical considerations that we can make today, but that Jurin never wrote.

2.6. The Series of Padua Used as a Reference

In this work, the series of Padua has been used as a reference for two reasons: (i) its short distance from Venice, while also being in the same climatic area and (ii) the quality of the series. Padua has the longest unbroken and best documented series of temperature, pressure, and precipitation in Italy, and among the longest in the world. For this reason it has been recovered, accurately controlled, homogenized, and validated in two European funded projects, i.e., IMPROVE (ENV4-CT97-0511, 1998–2000) and MILLENNIUM (STRIP-017008-2, 2006–2009), to be used as a useful reference for other series.
The recovery of the Padua series required the study of the history of science, the contemporary literature, the observers and the sites of the selected series; the consideration of connections with the contemporary observations in other cities; the recovery of all data and metadata (taking photographic images of documents and digitizing written sources); the reading of manuscripts, the interpretation of paleography and ancient local languages including Italian and Latin; the virtual reconstruction of instruments and their physical and technical interpretation; the devising of equations related to instruments and measurements, the departures from linearity, and calibration biases; the interpretation of ancient local units and their conversion, and the operational procedure of the observer, the location of instruments and exposure, and the deduction of room ventilation from statistical tests. Astronomical simulations of solar motions were made to calculate the solar radiation fallen on the building (when it was known); the so-called Italian Time in use till 1797—with the day and hours starting from sunset—calculated and converted into the modern UTC + 1 clock time; the local sundial time used by astronomers was calculated from the culmination of sun when it passed through the local meridian and was converted into the modern UTC + 1 clock time. Further considerations concerned the number and time of daily observations, the estimate of errors for limited or irregular sampling, statistical tests, homogenization, correction and validation of data. The recovery and revision of the Padua series has been explained in 12 papers, all listed in Table 2.
Therefore, the Padua series is not only long and unbroken, but also among the most accurately studied, checked and controlled series.

3. Data Recovery and Analysis: Methods and Discussions

3.1. Overview

Temanza measured pressure and temperature once a day. When he was working in Venice, he observed without gaps. He used the Amontons thermometer from 1 January 1751 to 30 April 1759, and from 1 to 4 September 1759 (Figure 5a). The original scale, as explained above, refers to an unknown reference X. In 1756, something happened to that instrument, since from that year onward, the data drifted (red dots in Figure 5a). Air thermometers were very fragile, and a microcrack on the glasswork or the sealing affected the pressurized air pocket and the instrument response. A similar problem was observed in 1719, i.e., 37 years before, with a Stancari air thermometer, in Bologna [36]. Probably at the end of 1759, Temanza recognized the problem, abandoned this instrument, and used another thermometer.
Temanza made the next temperature measurements (from 1 January 1761 to 29 April 1762; from 1 January to 7 June 1768; and for the whole of 1769) with a low-resolution Réaumur thermometer (Figure 4b,c).
In addition to climate information, the Réaumur readings are useful for correcting pressure readings for the thermal expansion of the mercury.

3.2. Temperature from the Amontons Thermometer

3.2.1. Reading the Scale of the Amontons Thermometer

The scale of Amontons thermometer refers to the mobile level of the free surface of the mercury in the bulb, and the temperature can be derived by the height hA of the mercury column in the Amontons tube (Figure 6b). Since air pressure also influences mercury height in the Amontons tube, the height hB of the mercury column of the barometer tube (Figure 6a) must be added.
The temperature, in Amontons degrees, is
T (°A) = hB (inch) + hA (inch).
The level reached by the mercury column, as well as the shift of the zero in the column hA, depends on the ratio between the cross-sections of the capillary tube and the cylindrical bulb [48,57]. The effect is very sensitive because the cross-sections depend on the square of the related diameters. The smaller this ratio is, the smaller the shift of the zero. Unfortunately, these characteristics of Temanza’s thermometer are unknown and it is not known if he considered this problem; additionally, a tube that was too thin would have caused capillarity problems. In addition, Temanza did not measure the height of the column hA but did measure the positive (or negative) distance of the meniscus in the capillary with respect to a fixed level X, arbitrarily chosen by Temanza himself (i.e., the “Temperate”).

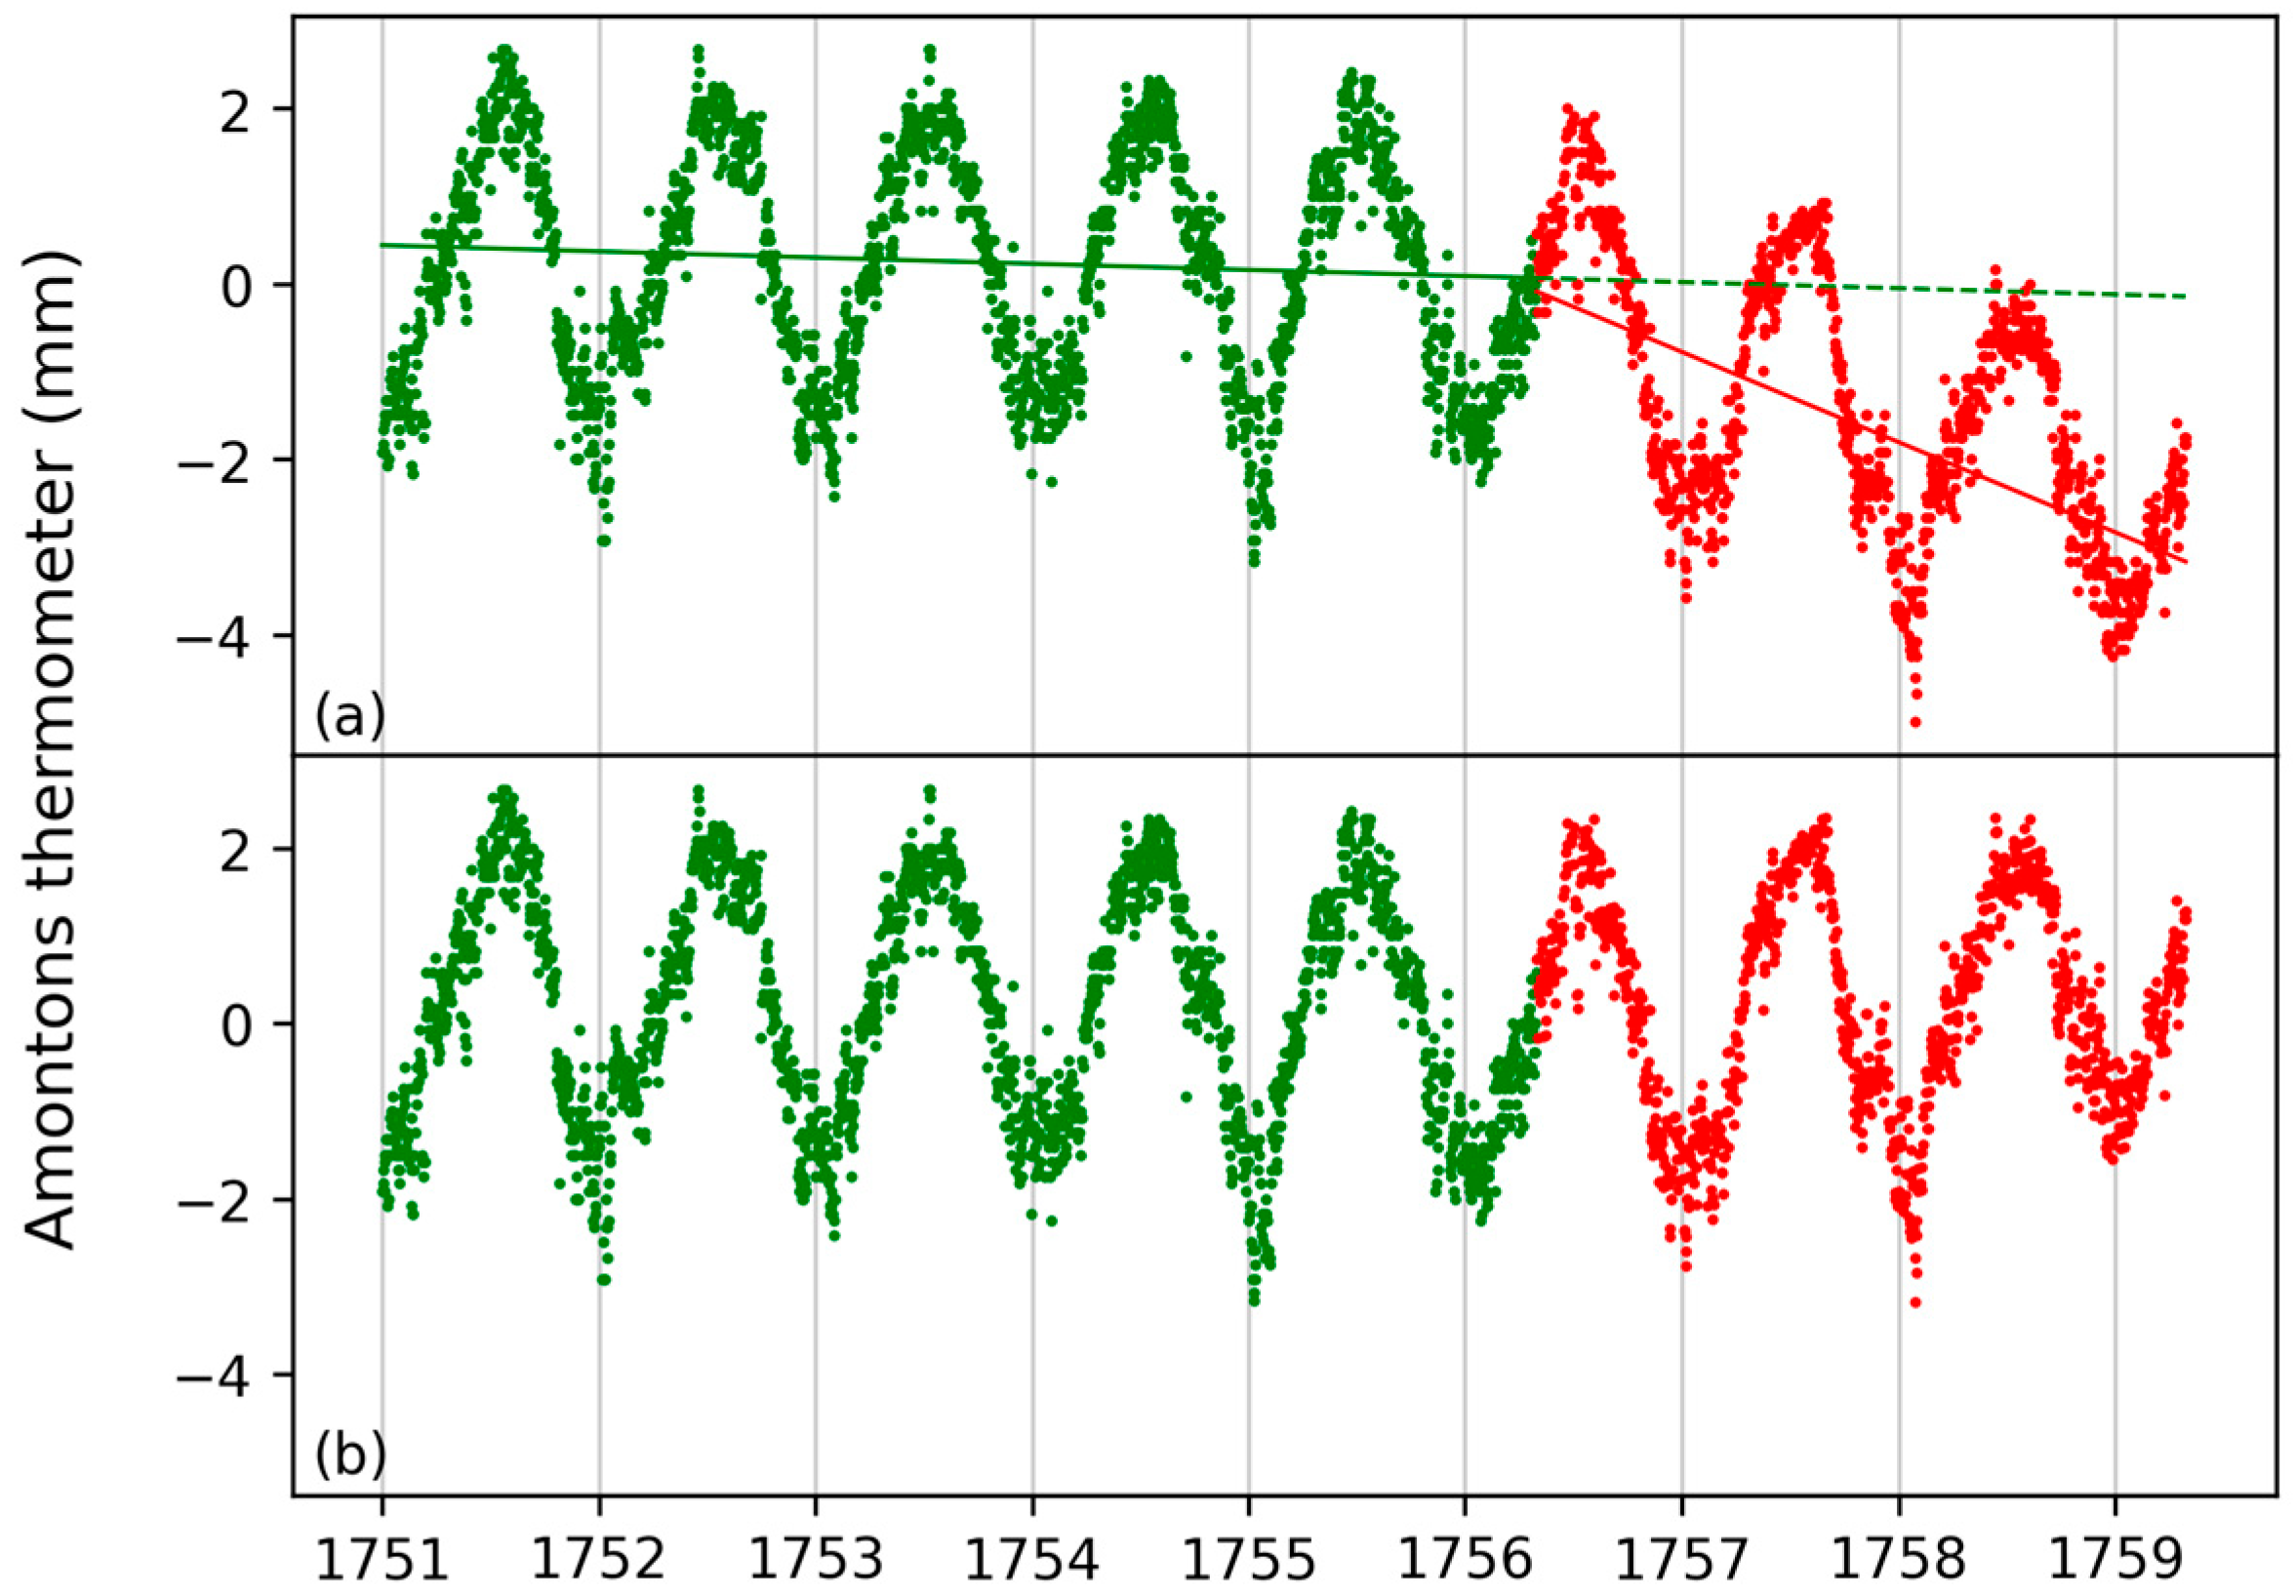
3.2.2. Correcting the Drift from 1756

Before interpreting and converting the readings of the Amontons thermometer to Celsius, it is necessary to correct the drift. The correction has been performed by comparing the linear trend of the two periods before and after the turning point (TP). Three homogeneity tests have been used to detect the TP: the Standard Normal Homogeneity (SNH) test [66], the Buishand U (BU) test [67], and the Pettitt test [68]. The BU and Pettitt tests usually perform better when a TP lies in the middle of the series, and the SNH test performs better when it lies in proximity of the extremes. For this reason, these tests are often used simultaneously. The mathematical formulation of the SNH, BU, and Pettitt tests can be found in the original works [66,67,68] and in Appendix A of Wijngaard et al. [69]. When these tests are used simultaneously, the TP is considered identified when at least two of the three tests provide the same indication [69].
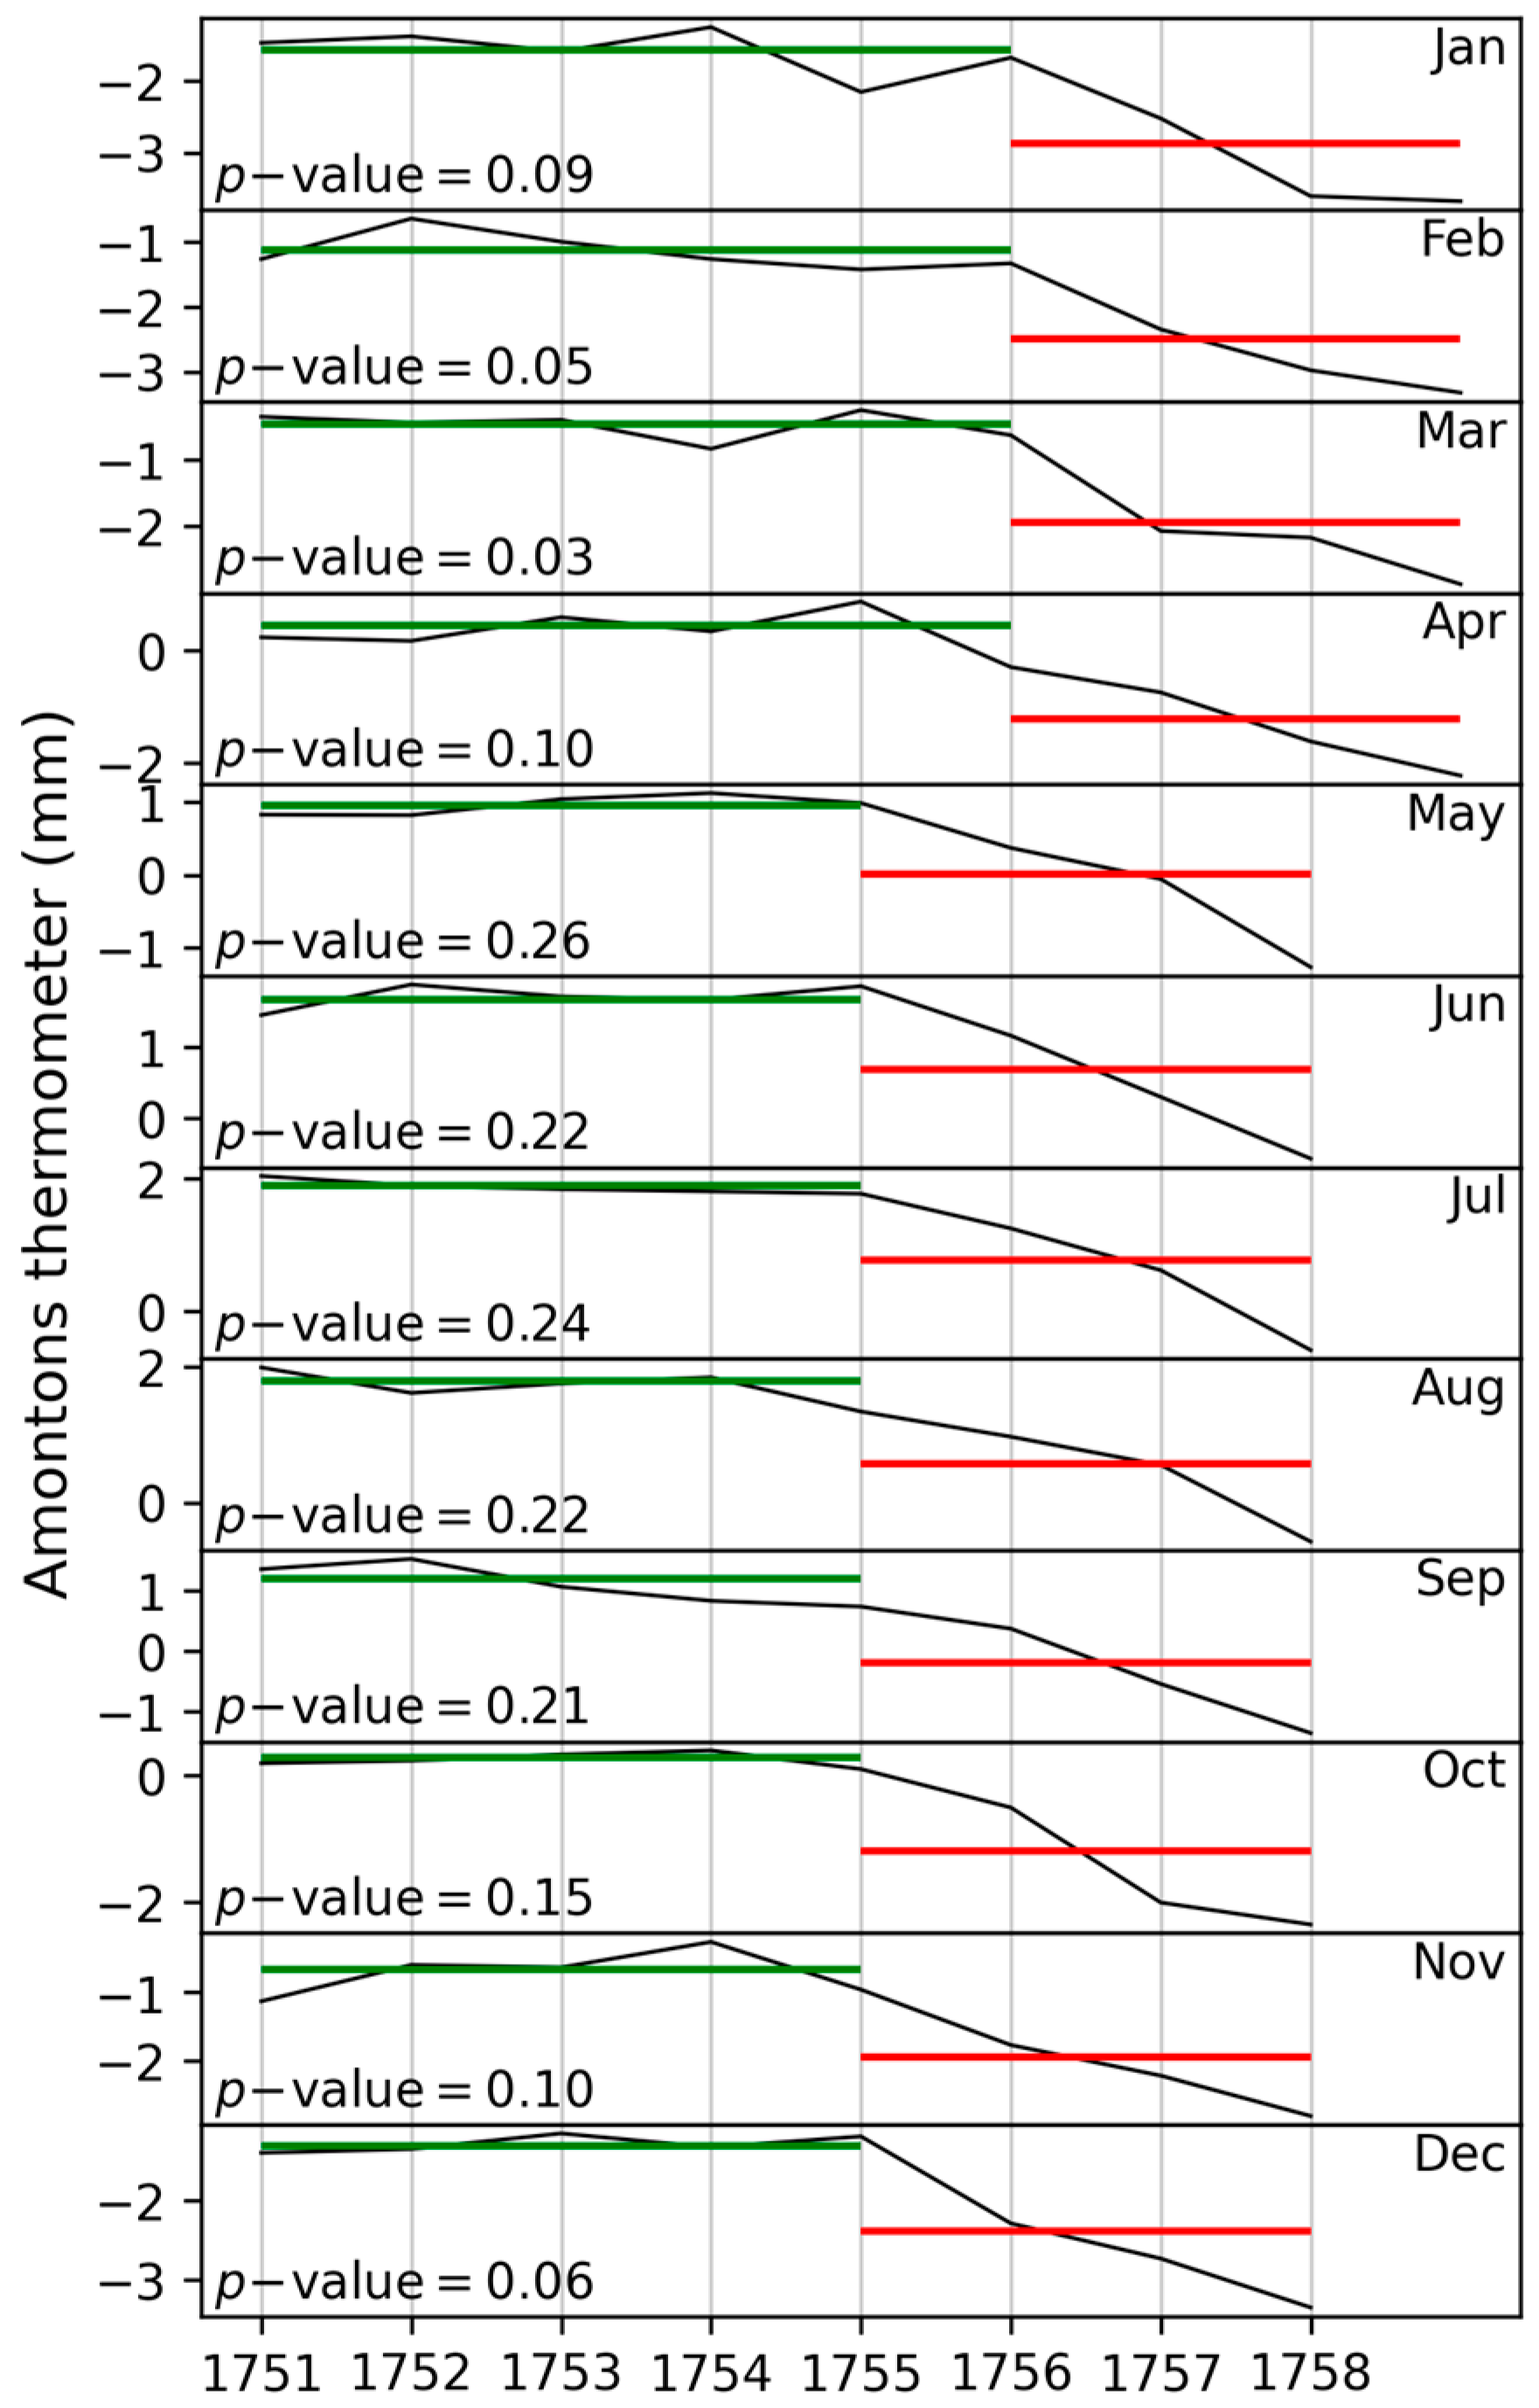
Since these tests perform better with averaged data, i.e., monthly, seasonally, or yearly [69], they have been applied to the monthly means, i.e., the dataset of the Amontons readings was transformed into 12 parallel subseries, with one subseries per month, considered separately. The TP was found in May 1756. Appendix A shows the 12 graphs with the highlighted discontinuities.
The slope of the trend lines has been determined with the non-parametric Mann–Kendall (MK) test [70,71], using the Python (version 3.13) statistical package pyMannKendall, version 1.4.3 [72]. The null hypothesis of this test is that there is no trend. The test is statistically significant when the p-value is less than 0.05.
The data from 1 January 1751 to 1 May 1756 show a slight downward trend of m u = 1.9 × 10 4 with a p-value of 3 × 10 4 (green line in Figure 7a). The drifted data show a trend m d = 2.8 × 10 3 with a p-value of 0 (red line in Figure 7a). After the drift was corrected, the Amontons readings appear as in Figure 7b.
After the correction, the variance of the data was calculated to check whether the instrument failure could have attenuated or accentuated the natural variability. Before the TP, the variance of the temperature was σ u = 1.3 °C; after, σ d = 1.2 °C, which is nearly the same value.

3.2.3. The Unknown Reference Named “Temperate”

Temanza expressed the temperature of his Amontons readings T (°A) in arbitrary degrees (°A, in inches) as a difference between two unknown values, hA and X, i.e.,
T (°A) = hAX
In addition, both hA and X depend on pressure. Furthermore, Temanza’s definition has a formal defect, because X is an intermediate point between two unknown extremes. In his manuscript, Temanza referred to the “Temperate” but was unclear about the selected extremes: he gave two contradictory definitions, which does not help in establishing a precise value.
In the records for 1751 (folii 5 and 6 of 42), Temanza wrote (in Italian): “The most extreme cold was on 24 December having the mercury in the thermometer of Mr. Amontons descended by 2 inches and 4 lines below the mark that indicates the average state between the freezing and the heat of the boiling water; […]. The most extreme heat was on the days 20 and 28 July, when the mercury column rose above the above reference by 2 inches and 8 lines”. If this text is literally interpreted, it seems that X is the “average state” located at the midpoint between the freezing and boiling temperatures of water, i.e., X = 50 °C. In effect, Poleni calibrated his thermometer with these two fixed points [57] and Temanza probably intended to do the same. However, if X were 50 °C, all readings are below this mark and should therefore be negative. Since this is not true, this definition must be excluded.
In the next page of that manuscript (folio 7 of 42), Temanza gave a second, different definition of X. The text is in Latin, probably because Temanza intended to publish it, and Latin was the international academic language. The translation is as follows: “The most extreme height reached by the mercury column was 2 inches and 8 lines above the reference mark indicating the medium state of the air. This occurred twice this year, i.e., on 21 and 27 of the same July. The most extreme drop was 2 inches and 4 lines below, on 24 December”.
The second definition seems realistic, at least in terms of Temanza’s true intentions: X is the midpoint between the most extreme heat and the most extreme cold recorded in 1751. The rationale for the “Temperate” lies in the fact that in the 18th century, the everyman was unable to interpret the thermometric scales and meteorological readings. However, if the reference was made with respect to an average value, anyone would have understood that if reading is positive, and increases, this means that weather is moving away from the average towards warmth, and vice versa for negative values. It was a method based on intuition to compensate for the lack of knowledge.
Toaldo [73] commented on the pros and cons of a scale based on the “Temperate”. He wrote that it was a relative scale, very useful for locals because it allowed them to immediately understand whether the temperature was higher or lower than the usual value, and by how much. This was perfectly in line with the warm and cold sensation, and warmer or colder than usual. The disadvantages were that the readings were incomprehensible to foreigners, and that it was impossible to compare the climate of Venice with other climates.
Unfortunately, the two extreme values mentioned by Temanza do not correspond to real extreme temperatures, because the temperature depends on the sum of the two columns, i.e., the Amontons thermometer and the barometer (Equation (1)), while Temanza failed to mention the barometric value, and the related change of level of the mercury column in the Amontons thermometer. This situation results in great uncertainty (in the order of 0.5 inch) regarding the definition of the extreme points. In fact, X was not exactly in the center position, because the upper and lower extremes were at unpaired distances, i.e., 2 inches and 8 lines, and 2 inches and 4 lines, while both were expected to be at the same distance of 2 inches and 6 lines. The removal of 2 lines might be explained if Temanza made the correction for pressure to fit his temperature readings but marked on the Amontons scale the actual level hA of the mercury while disregarding the pressure correction. Anyhow, he was not precise, and the quantitative definition of X remains uncertain.

3.2.4. Amontons Scale Recognition and Readings Conversion

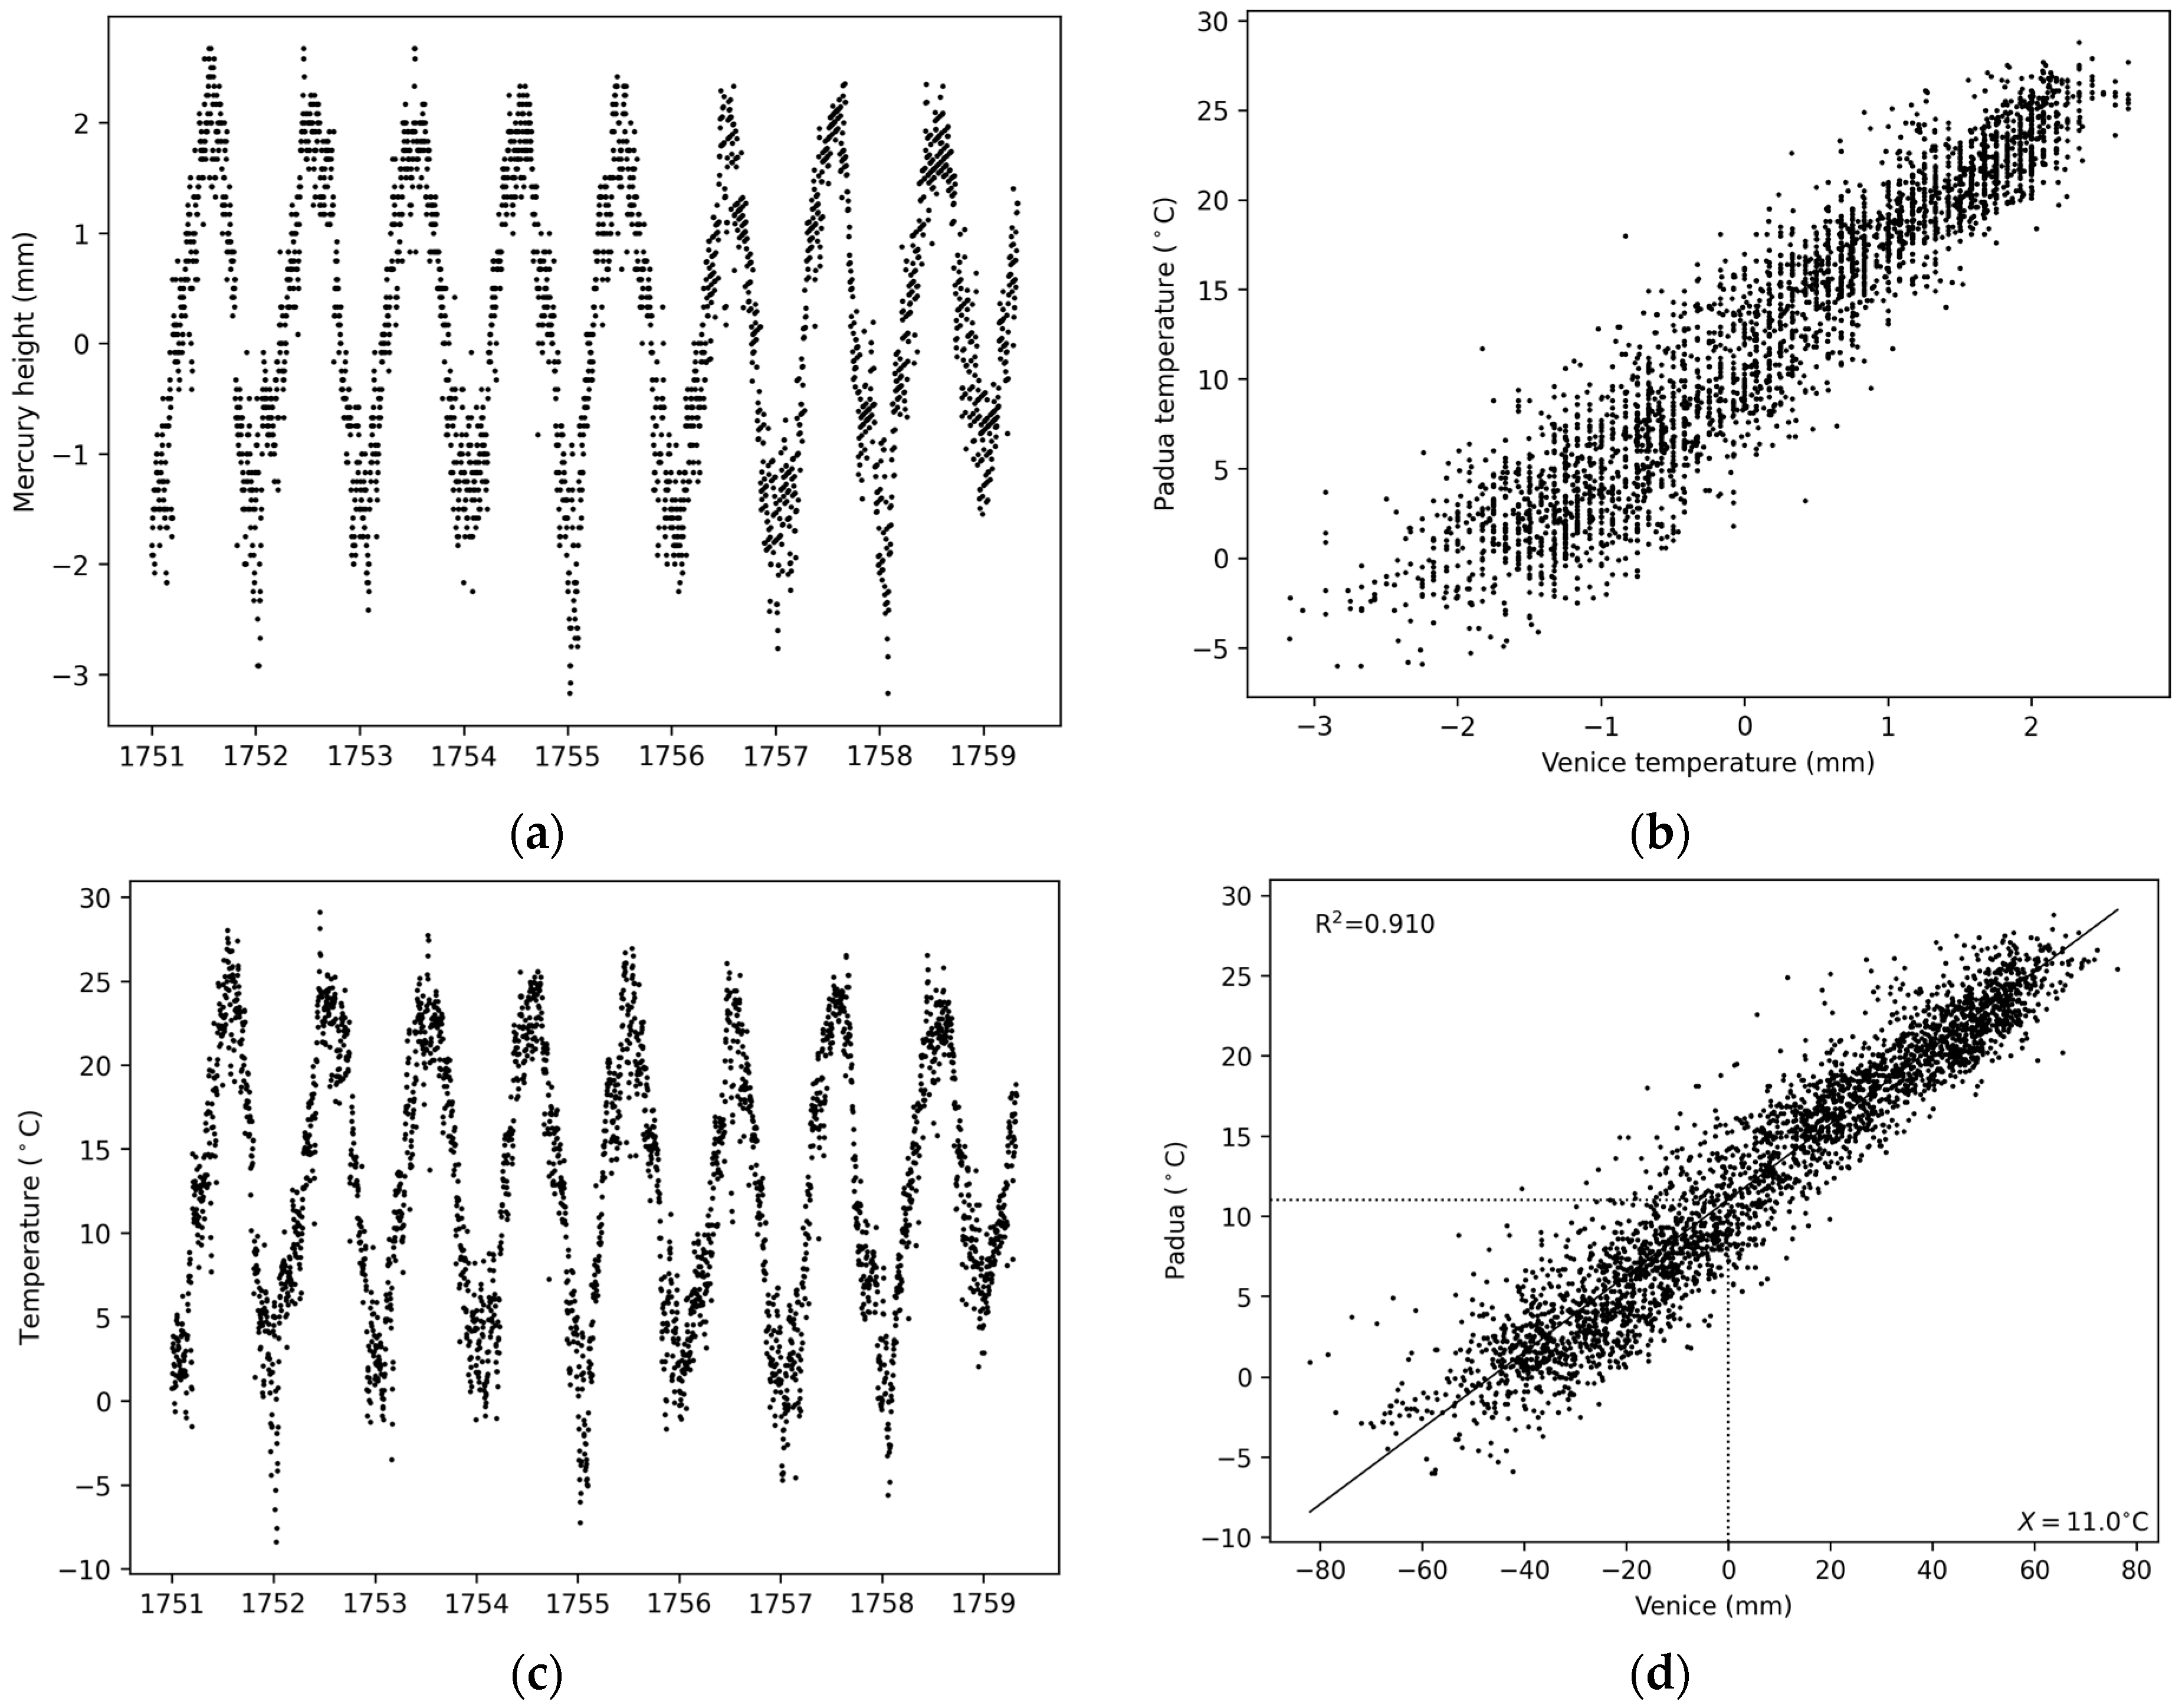
Equations (1) and (2) cannot be directly used to convert the Temanza readings because they include two unknown variables: temperature and pressure. The problem has been solved with the help of contemporary data provided by Poleni in Padua. The methodology simulates a new calibration for comparison with Padua under ideal conditions and then extends it to the general case. This can be logically explained in two steps: (i) Suppose we consider the readings on days when the pressure is close to the standard value at mean sea level (i.e., 1013.25 ± 1 hPa). This subset of data is homogeneous and depends only on temperature. These data can be compared with the corresponding data in Padua, at the same pressure. The best fit interpolation line gives the key to relate the unknown Amontons scale—referred to X—to a known scale in °C. (ii) Once the Amontons scale has been recognized for the standard pressure, it is easy to move to the general case and correct for different pressures by considering that both the barometric and thermometric columns consist of mercury, and that the pressure has the same impact on both. When the pressure departs by 1 mm Hg in the barometric column, the level of the thermometric column symmetrically changes by 1 mm. This method helps to decipher the unknown scale in this case and can later be applied to the general case. The same method was successfully used for the Zendrini measurements [7].
These two logical steps have been practically realized with five operative steps:
  • Convert the temperature readings (TRs) from non-decimal inches to mm.
  • Convert the contemporary atmospheric pressure measured by Poleni in Padua from hPa to Torr (i.e., mm Hg), multiplying it by 760/1013.25 mm Hg/hPa (Figure 8a,b). Note that for this purpose it is preferable to use Torr rather than hPa because the unit of pressure (mm Hg) coincides with the unit of length (mm) of the mercury columns (either in the thermometer or barometer), making calculations easier.
  • Calculate the disturbing effect of pressure ∆P (mm Hg) = P (mm Hg) − 760 (mm Hg) that causes the shift ∆hA of the column of the Amontons thermometer.
  • Correct the temperature reading TR (mm) for the effect of ∆P with the formula h A = T R +   Δ P .
  • Compare h A with the temperature of Padua measured by Poleni to find the transfer function that allows the conversion of the Amontons readings from inches to degrees Celsius (Figure 8c,d).
It must be said that Poleni measured indoors, but in the same period Morgagni took simultaneous readings indoors and outdoors, and Beccari did the same in Bologna. This allowed the determination of an indoor–outdoor transfer function that is valid for buildings of the 18th century, and allows for the conversion of indoor data as if they had been obtained outside [59]. The calculated outdoor dataset has been used in this study.
Unfortunately, the metadata and other contemporary sources lack any information about instruments and the buildings where the instruments were located. Therefore, it is impossible to know details like building orientation, ventilation, and so on.
The transfer function is empirical: it just considers how the unknown Temanza readings are related to the temperature in Padua, knowing that Padua and Venice are a short distance away from each other and are in the same climatic region, with temperatures that are quite similar. This is a basic assumption to face empirically for a system with too many unknowns. The goodness of this assumption is given by testing how the unknown data, when converted to °C, responds to the benchmark of snowy days, when the temperature is around 0 °C.
This empirical methodology has been applied because the basic information was not sufficient: no calibration reference points; presence of an unknown scale, and all data referring to an undefined X–reference. Therefore, it is impossible to solve a problem when the number of unknowns exceeds the number of equations.
The scatter plots combining the temperatures of Venice and Padua (Figure 8b,d) show a linear distribution and its best fit, made with the orthogonal distance regression method [74]. This linearity confirms that the bulb of the Amontons thermometer used by Temanza constituted a cylindrical flask, like the one used by Poleni. The interpolation allows us to give an estimation of the “Temperate” X, i.e., the zero of the Amontons thermometer. This value is given by the intercept of the interpolating equation in Figure 8d, i.e., X = 11.0 °C. Since the equation was for the Amontons readings in mm, the 0 °C mark is located 11.0 mm below X. Therefore, the Amontons scale corresponded to 1 °C at every 1 mm mark.
The only viable methodology was to start with a comparison with known data, and then recognize the scale, the X–reference and finally verify it using the snow benchmark (discussed in Section 3.2.5) to see if the result was acceptable or unacceptable. The confidence interval for the estimated value of X has been derived from the control and validation test given by the benchmark of snow days.
From Temanza’s observations (Figure 8c), the most extreme cold spells (below −5 °C) occurred in 1752, 1755, and 1758. In 1752, the cold was very intense, but only for a short period, and the lagoon did not have the time to cool and freeze. In 1755 and 1758, the cold was intense and persistent; the lagoon completely froze over, and the ice thickness was able to support the load of people walking on it, which we know from contemporary eyewitnesses [75]. Unfortunately, the indoor exposure smoothed the intensity of the most extreme peaks.

3.2.5. The Snowflake Test

Another useful reference has been drawn from Temanza’s weather notes. In Venice, when it is snowing (or raining and snowing), the temperature is around 0 °C or below. From January 1751 to April 1759, Temanza noted 40 cases in which it snowed. The temperature distribution of these occurrences is reported in Figure 9. The distribution is Gaussian and centered around the value of 0 °C. Snowflakes at temperatures higher than 0 °C are possible in dry air, when the loss of heat for sublimation of the ice needles is compensated for by the slightly higher temperature. For instance, when the relative humidity is RH = 70%, dry snowflakes may fall at +2 °C, while at +3 °C, snowflakes fall and are mixed with rain [48,56,76]. The histogram in Figure 9 confirms that, after having converted the Amontons readings from the unknown scale in inches to Celsius degrees, the estimated 0 °C corresponds to the broad peak of snowfall.
It may be useful to comment that the usual determination of cumulative error starts from the individual errors and follows the theory of their propagation. In this case, however, for the complete lack of metadata, the basic information about instruments, calibration, scale units, operative methodology and exposure is missing.
This situation requires us to apply the inverse path: make basic assumptions, try an empirical key to interpret unknown and undefined data, and finally verify if the key has been successful. The basic assumption is that the Venice data can be compared to the accurate series of Padua. From this cross–comparison it has been possible to recognize the unknown X-reference and reconstruct the unknown temperature scale. The goodness of this empirical approach can be objectively recognized by checking it with an independent, objective test, i.e., the temperature when it is snowing. If this empirical methodology is correct, snowfall occurs at temperatures around 0–2 °C [56,60,76,77,78,79,80], and the reconstructed values should be around this interval. If snowfall occurs at a reconstructed temperature significantly different from it, this means that the approach was not correct, and the departure from 0 °C represents the bulk error. The histogram of the temperature distribution of snowy days (Figure 9) shows that the methodology is correct and the bulk error is less than 1 °C. This means that the system is composed of various items with unknown individual uncertainties, but when combined they give a bulk uncertainty of 1 °C.
The conclusion is that this empirical method has been tested and validated with an objective reference, i.e., snow, that was not used for calibration, to be used later for control and validation.

3.2.6. The Moist Air Bias in the Amontons Thermometer

The last problem was that the readings of the air thermometers were affected by bias due to moist air in the bulb. The ideal air thermometer is made up of a perfect gas, and only one calibration point is sufficient [7,48,57]. Dry air can be a good approximation, but moist air is not. Especially if the thermometer is built in summer, the amount of moisture in the air (the mixing ratio) is much higher than in winter and could reach values in the order of 30 g/kg. Stancari discovered that the moisture present in the air might undergo a phase change, hazing the glass of the bulb and lowering the values of readings [34,81]. Condensation tends to reduce the response in winter compared to summer, and the response loses linearity.
This error cannot be corrected because the metadata does not specify if or when this occurred. As the leading scholars of Padova and Venice had good relationships with their colleagues in Bologna, it can be reasonably assumed that the builders of these air thermometers knew of this problem, and that the air pocket was included in winter, to minimize this bias.

3.3. Temperature from the Réaumur Thermometer

In September 1759, Temanza stopped his meteorological observations. When he restarted in January 1761, he used a Réaumur thermometer with a “false scale”, following the definition given by de Luc [43]. As shown in Figure 5b, this Réaumur thermometer had a scale with resolution lower than that of the Amontons thermometer. Readings were recorded in Réaumur degrees without fractions (only rarely did he use one half degree). This means that the recorded values had a resolution of 1 °R, i.e., 1.25 °C.
To compare these measurements with the outdoor measurements taken by Toaldo in Padua, the Réaumur data has been converted from indoor to outdoor using the same transfer function to convert Poleni’s indoor data [59]:
T o u t = 1.116   T i n 5.737
where Tout and Tin are the outdoor and indoor temperatures, respectively.
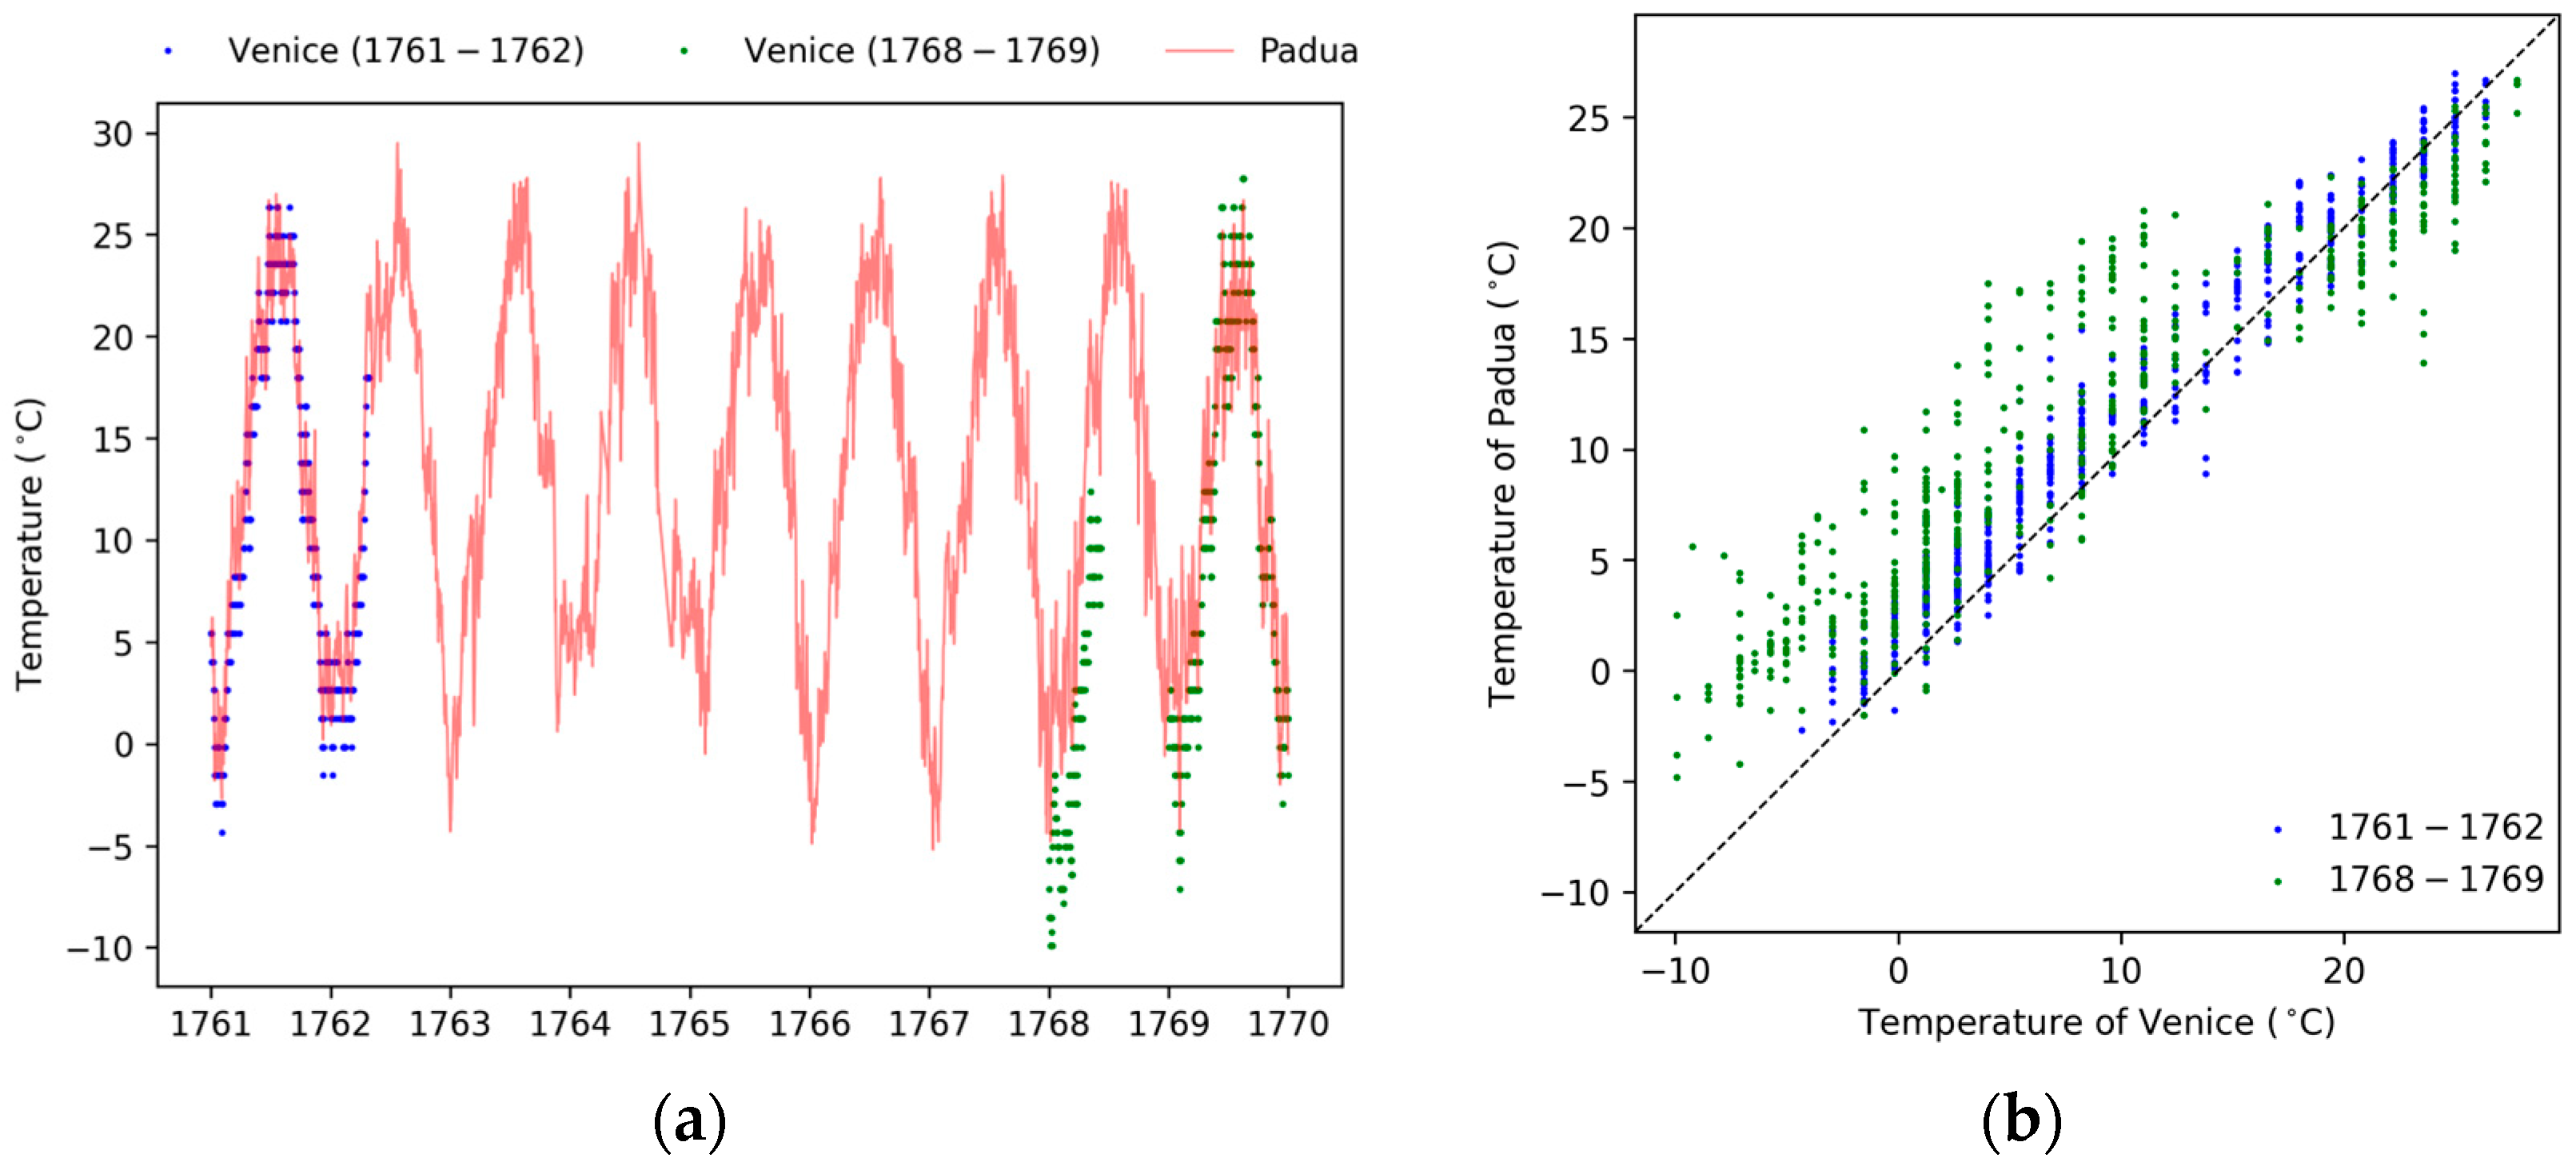
Despite the low resolution, the comparison with the measurements of Padua (Figure 10a) shows a general agreement. Winter temperatures are similar, even if in the second period Temanza recorded lower temperatures than in Padua.
The scatter plot in Figure 10b points out the two periods, i.e., 1761–1762 and 1768–1769. The gaps are due to the intense activities that Temanza performed outside of Venice. No discontinuities can be detected between the two subseries in the plot. This suggests that in January 1768, when Temanza returned to his measurements, he used the same room and the same Réaumur thermometer.
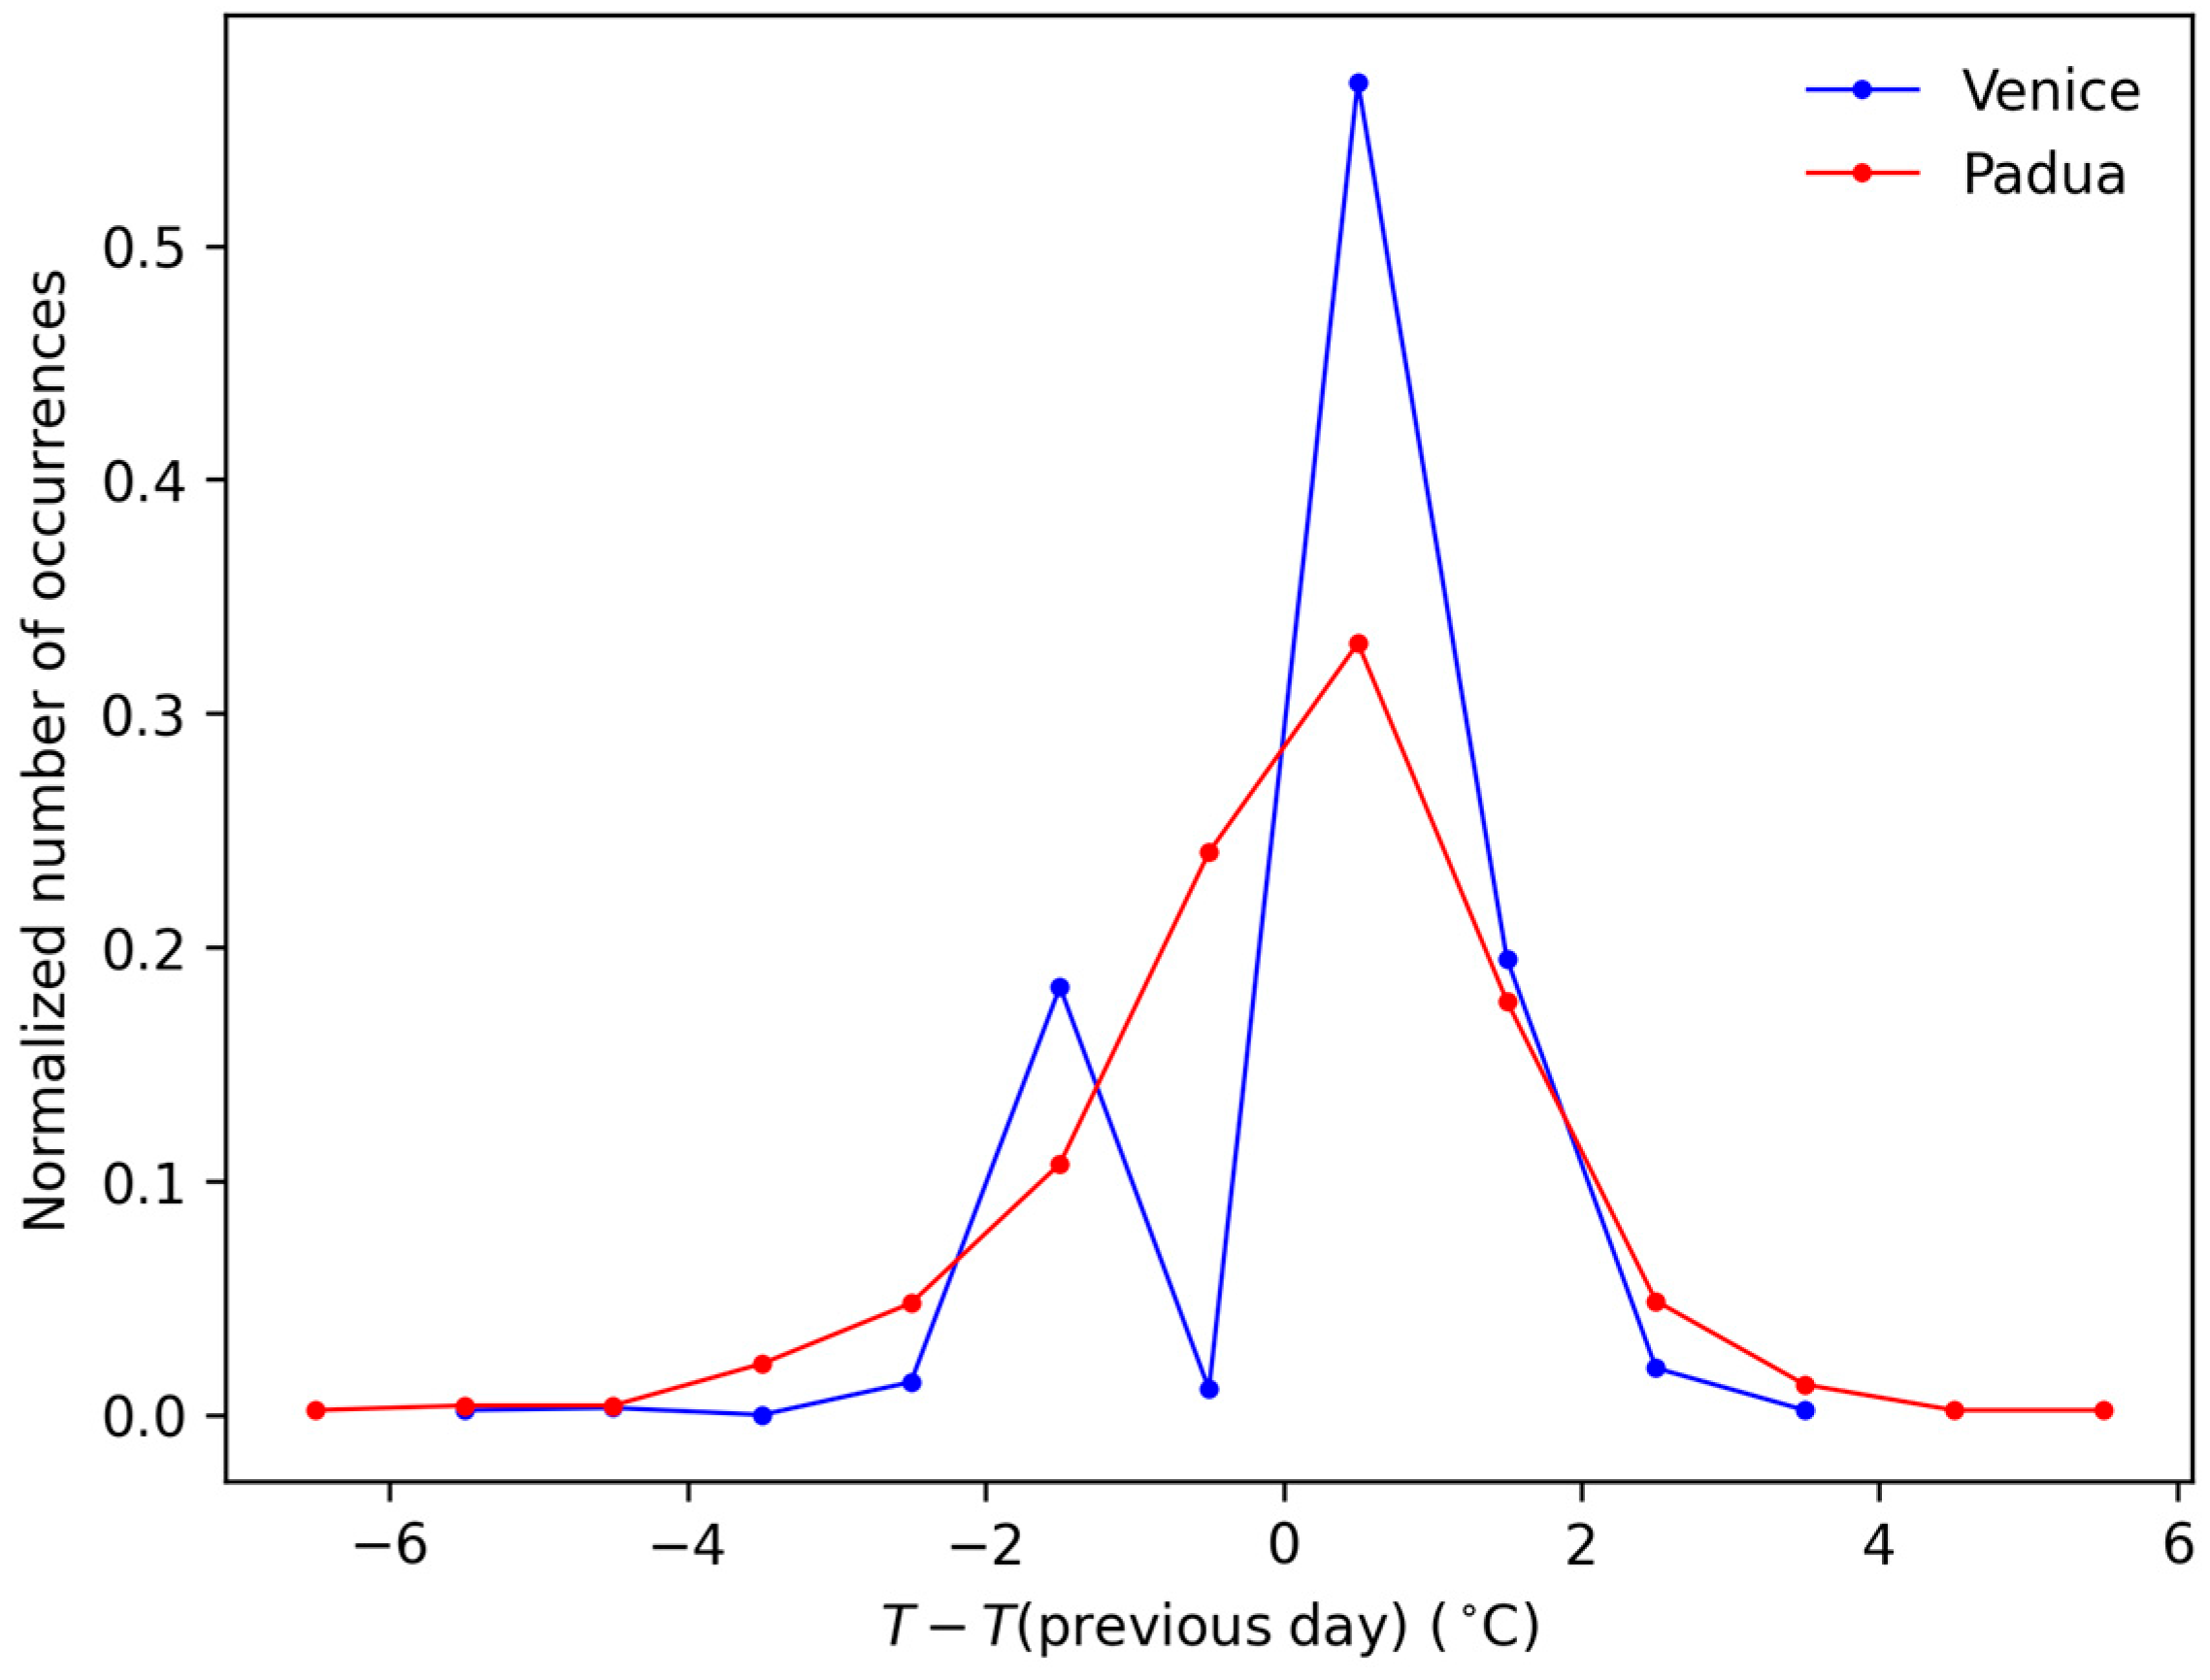
The low-pass filter generated by the building envelope and poor ventilation can be recognized by considering the distribution of the differences between the temperatures measured on a selected day n and the previous day n − 1. The higher the inertia, the smaller the differences. The data analysis shows that more than 50% of the differences have null value (blue line in Figure 11). For comparison, the distribution of the same difference, in the same period, but calculated with the Padua readings (i.e., the corrected dataset [6]) gave more variable results: only 30% of the differences were zero (red line in Figure 11). A null difference may be explained by highly stable temperatures (i.e., very high inertia of the room envelope), or a very low resolution of the thermometer. Both hypotheses are plausible, and the low resolution of 1 °R is confirmed because the readings had rounded values. With a resolution of 1 °R = 1.25 °C, each reading should be interpreted with an uncertainty of ±1.25/2 = ±0.6 °C; similarly, the monthly variance should be ±1.25/(2√3) °C = ±0.36 °C. Higher resolutions would be preferable for high-frequency variability studies. However, with only one measurement per day, and taken indoors with the building envelope acting as a low-pass filter, high-frequency analyses are not advisable.

3.4. Atmospheric Pressure

The construction of a barometer presents several difficulties, which were largely overcome in the 19th century. In the 18th century, the early homemade barometers had a series of problems, starting with mercury that was unrefined and contained different contaminants that altered its properties. The glass tube also had a non-standardized shape and composition and problems were encountered when filling it with mercury, and finally, the scale, whether mobile or fixed, was also an issue. These factors led to a series of errors, some of which were stable and others variable, as reported in Table 3.
Capillarity is the only large, fixed error that was considered and tabulated in the past. The results of the measurements made in the middle of the 19th century [82] are shown in Figure 12.
Unfortunately, we do not know whether the instrument tube was thin or thick.
The most common, largest, and unpredictable error was the introduction of small bubbles of air when the tube was filled with mercury. Each barometer had a different vacuum error, but it remained a constant error of the instrument, at least until the mercury was changed.
It must be said, however, that the detailed analysis and knowledge of all instrumental errors was a purely academic exercise. It does not matter whether the individual errors were large or small, but whether they were constant or variable. Instruments had constant errors that can be easily corrected. Observers caused unpredictable errors in reading or in exposure, that cannot be controlled.
In the past, all systematic errors were considered a normal and unknown part of a bulk instrumental error. In the 19th and 20th centuries, barometers had similar errors, but they were empirically removed by tuning or adjusting the scale. The instrument makers compared their barometers to a primary reference barometer, e.g., the reference barometer kept at the Royal Society, London, or the Académie des Sciences, Paris. Then, they adjusted the scale until the readings were close to the reference. At this point the barometer was calibrated, and any residual error was considered an instrumental error to be corrected by the user. Users were unaware that their instruments made a lot of errors, because the calibration by adjustment either masked or removed them. Users had to make the corrections prescribed by the factory and the standard correction prescribed by WMO [25,26] for temperature, latitude, and altitude above the mean sea level.
In this work we applied the same adjusting methodology, but digitally: after having made the standard WMO corrections, we compared the readings of Venice with the readings of Padua taken as a reference. This method is consistent with the definition of systematic measurement error and the related Note 2 in the International Vocabulary of Metrology [83]: “systematic measurement error: component of measurement error that in replicate measurements remains constant or varies in a predictable manner.” “NOTE 2 Systematic measurement error, and its causes, can be known or unknown. A correction can be applied to compensate for a known systematic measurement error.” After correction by comparison with the reference, all the systematic instrumental errors are removed.
In this work, pressure readings have been corrected for the thermal expansion of mercury, bringing them to the value they would be at under standard temperature at 0 °C, according to the formula:
P (0 °C) = P (T °C)/(1 + 0.0001818 T (°C))
where P (T°C) is Temanza’s reading of the barometric column hB, converted to Torr (mm Hg), as defined in Equation (1); P (0 °C) is the pressure value corrected for mercury expansion at 0 °C; and T (°C) is the air temperature expressed in Celsius degrees.
Once Temanza’s temperature has been recovered and corrected, it is possible to apply Equation (4) to correct the pressure readings.
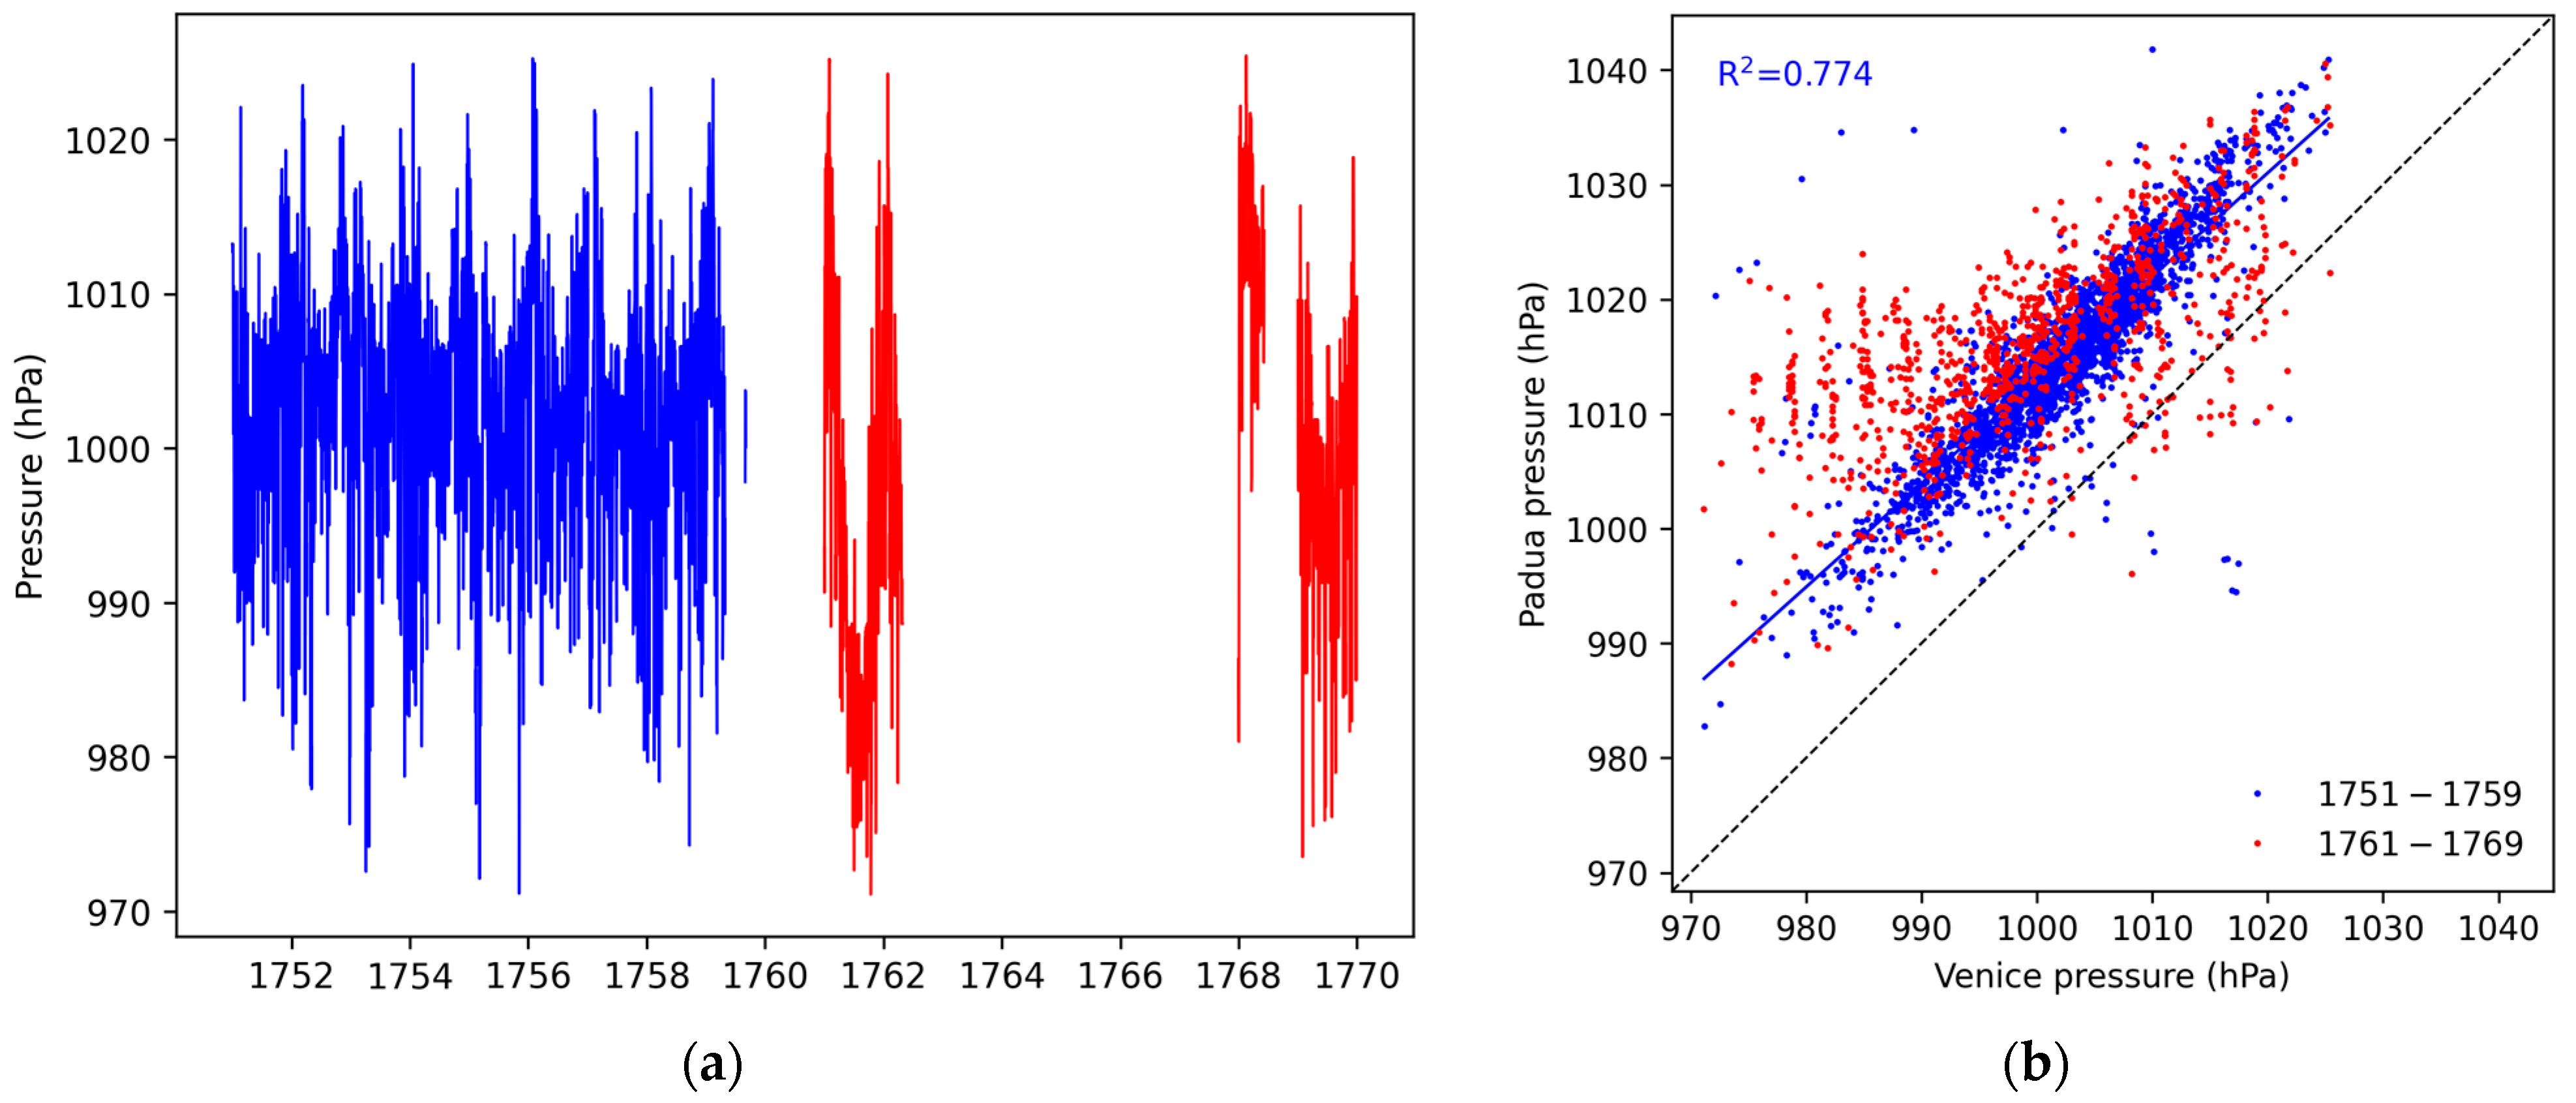
The recovered data are reported in Figure 13.
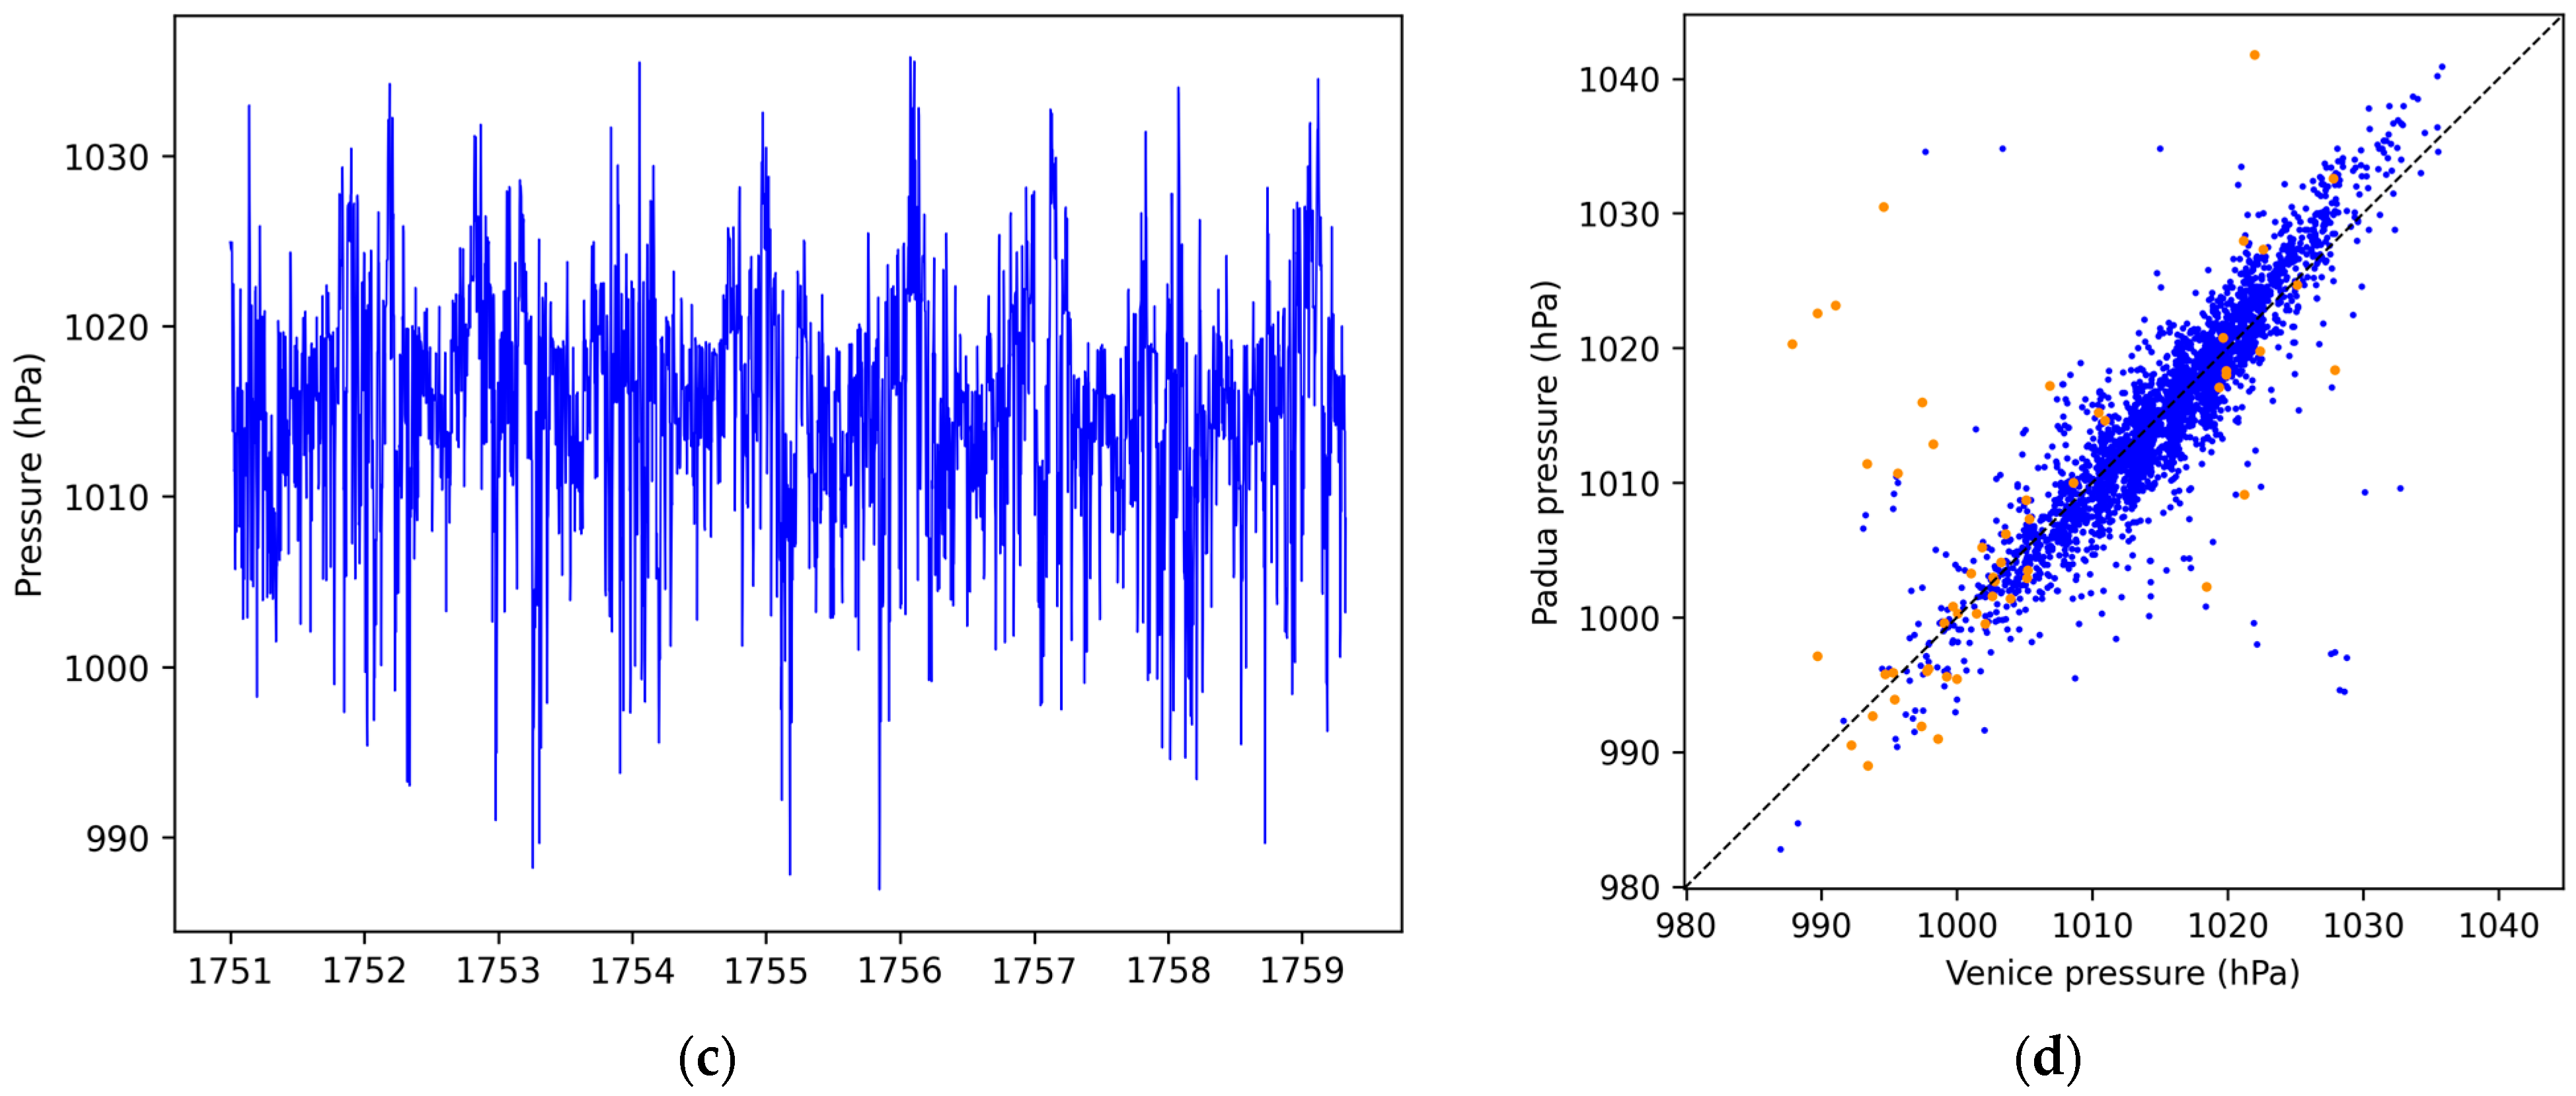
Figure 13b shows a surprising result. We know that Padua and Venice are close to each other, without geographical obstacles separating them, and have the same average pressure. However, Temanza’s readings can be divided into two subsets. The first subset for the period before 1760 (blue dots) shows a linear relationship with Padua, but Venice has lower values, around 10 hPa or less. This is a systematic error, due to capillarity, poor vacuum, and poor adjustment of the pressure scale. Therefore, in this work, this bias has been corrected by comparison with Padua (Figure 13d).
Padua was used as a reference series because it was carefully studied and corrected within the European projects IMPROVE and MILLENNIUM and further compared with other series and primary instruments. For the 1751–1759 period, the difference between the corrected Padua series (PPD) and the uncorrected Venice record of pressure (PVE) is around 15 hPa, and is given in Equation (5):
P V E = 0.90 · P P D + 109.75
Compensating for this difference with Equation (5) is a numerical operation like the mechanical shifting of the scale that the instrument manufacturers of the 19th and 20th century performed by comparison with a reference instrument. Figure 13c shows the corrected data only for the 1751–1759 period. In Figure 13c,d, some outliers have been highlighted in orange. Moreover, in the distributed dataset, such values have been flagged accordingly with a specific marker. Due to the lack of metadata, it is not possible to control and explain these outliers and recognize whether they are errors or actual extreme meteorological events.
The anomalous values have been recognized, specifically those differing from the previous and following day by more than a reasonably high threshold giving us reasonable confidence that values resulting from operational errors have been effectively removed from the series. The threshold has been established at 10 hPa, considering that the amplitude of the normal daily cycles is 1.0–1.5 hPa [84] and exceeds the dynamic overpressure of 1–2 hPa at most, when a strong Bora wind (100 km/h) blows against the window of the room where the barometer is placed.
The second subset (red dots) in Figure 13b is formed by readings taken in the 1761–1770 period, and it is almost unrelated to Padua; for instance, the subset shows relatively high pressures in Padua (1010–1020 hPa) with low pressures in Venice (970–990 hPa). This suggests that the instrument was changed, or the mercury was substituted, or the instrument had deteriorated over time (e.g., scale not secured properly, oxidation of the mercury, mercury sticking to the capillary) or that Temanza’s eyesight had declined. Whatever the reason, the readings of the second period should be considered unreliable and therefore have been rejected.

3.5. Temperature Anomaly

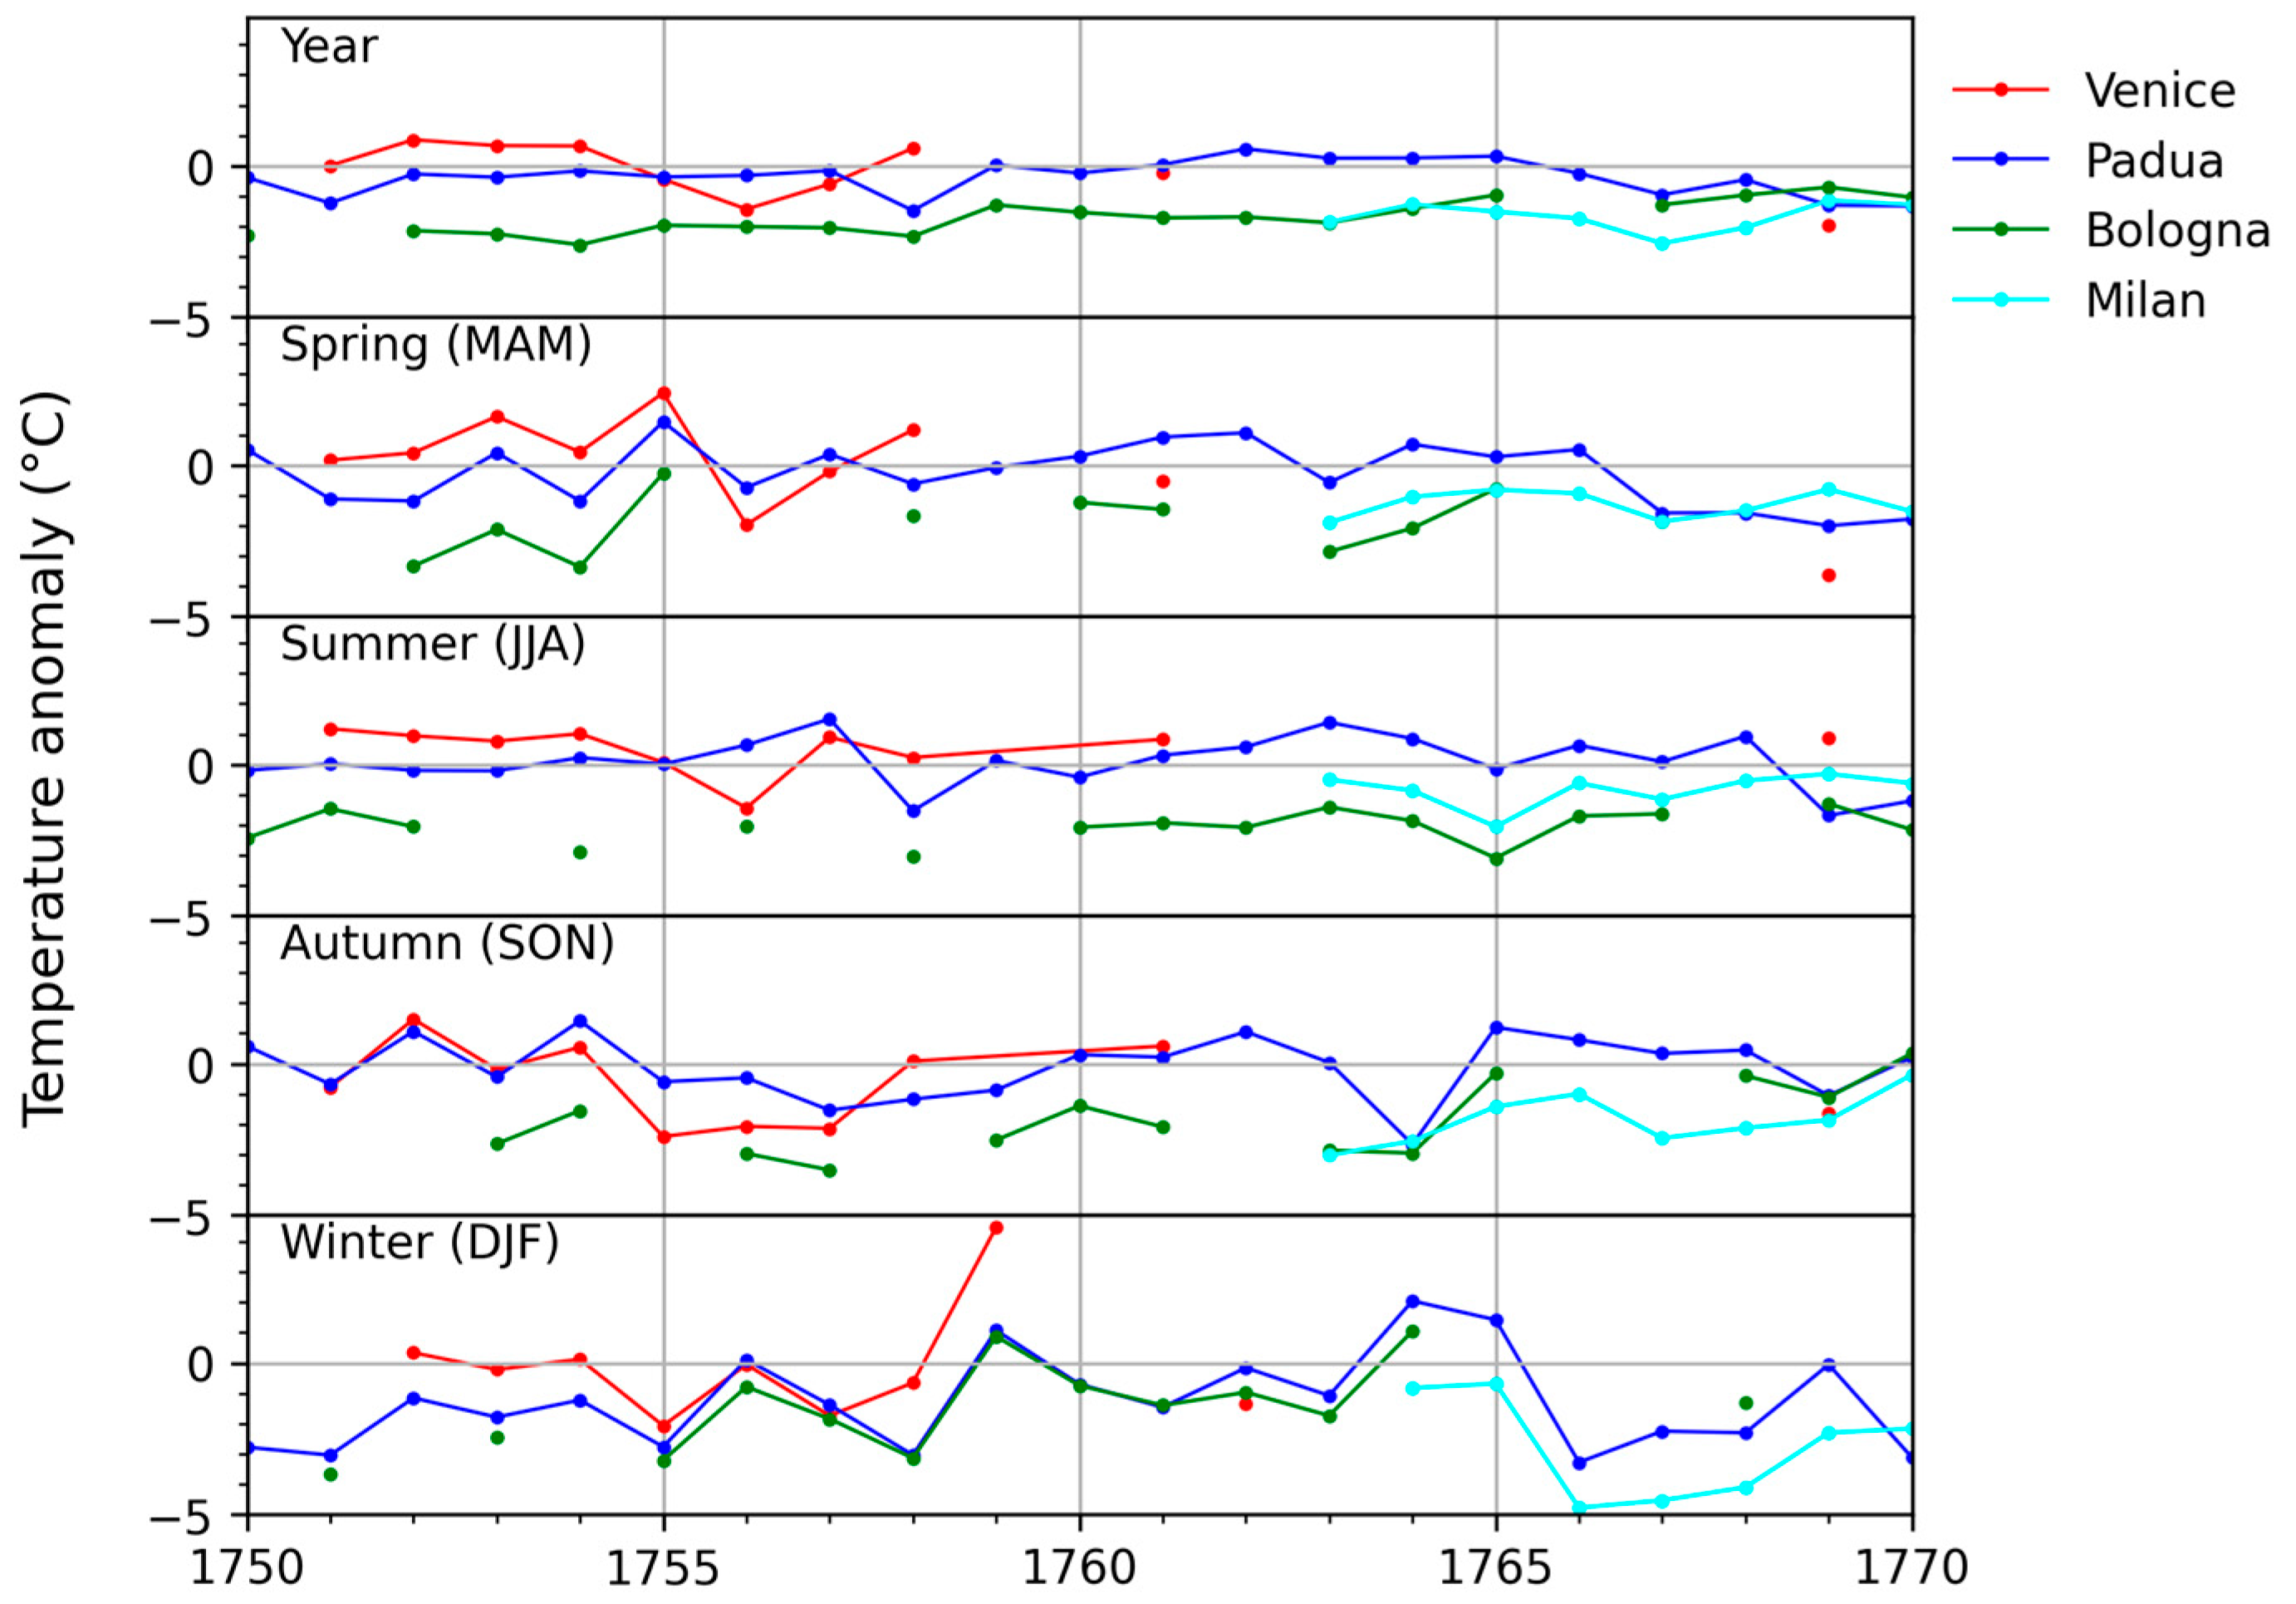
An anomaly is the departure of the value of a climatic element from its normal value [46]. The actual 30-year period used as a reference for the normal climate is 1991–2020 [85]. The anomaly of Venice has been calculated and compared to the anomalies of the contemporary data obtained by Poleni and Toaldo in Padua [59,61], Jacopo Bartolomeo Beccari in Bologna, and Louis La Grange in Milan [86] (Figure 14). The series of Bologna and Milan have been studied using the methodology explained in Section 2.6; the related bibliography can be found in [56,86]. The used reference period is 1961–1990, following the WMO prescription for long-time series [85,87,88].
The anomalies do not coincide but show some consistency in trend. The departure from Padua is within ±1 °C. While the various anomalies are negative by some degrees Celsius, the one in Venice suggests a milder climate. This is explained by the fact that the thermometer was kept indoors. This is the major limitation of these data, which seem to be 1° or 2 °C higher than what really occurred.

4. Conclusions

Taking up the challenge launched by Schouw [11], this research has been very stimulating due to a number of difficulties: (i) poor information from metadata; (ii) a rare air thermometer of Amontons type; (iii) the lack of traditional calibration points (melting ice and boiling water); (iv) unknown thermometric scale; (v) zero level referred to as an intermediate point between the absolute maximum and minimum values recorded in 1751; and (vi) reference extremes incorrectly reported on the scale, omitting the deviation caused by the atmospheric pressure.
It is known that the temperature of the Amontons thermometer is obtained by adding the atmospheric pressure values, but these were not immediately available throughout the period. In addition, a certain evil loop was established: the temperature data needed the pressure data to be added together, but the pressure data needed the temperature data to be corrected for the expansion of the mercury. The problem is that the system has two equations (i.e., Equations (1) and (2)) with three unknowns (hA, hB and X). Mathematically, this can only be solved if a third equation is added, i.e., by matching the values of Venice with those of another series taken as a reference. The only contemporary series available is Padua, which is an accurate reference. This is the only method that is possible, given the available data. Therefore, the observations made by Poleni in Padua have been used to decipher the data, starting from those taken under standard pressure conditions at 1013.25 ± 1 hPa, when it is not necessary to correct the Amontons readings. This was the first step that allowed the system to be deciphered. It has been found that the unknown Amontons scale corresponded to 1 °C for every 1 mm of the mercury column. Snowfall has been another useful reference to confirm the position of 0 °C on the Amontons scale.
It has been seen that in Italy there were only three temperature records taken with an Amontons thermometer. The first was due to Poleni, the other two were obtained by Zendrini and Temanza, who were closely linked to Poleni. It is very likely that after Zendrini’s death, the Amontons thermometer was passed to his friend Temanza, who continued the measurements in Venice. Temanza’s daily observations are important because they cover almost twenty years of the second half of the eighteenth century, when meteorological observations were rare. Unfortunately, the technology of the time, and of course, the vulnerability of the Amontons thermometer, did not allow the instrument to be kept outside, or carried outside for every measurement. As a matter of fact, all the records of regular temperature observations performed in Italy during the first part of the eighteenth century were made with thermometers that were kept indoors. This means that the most extreme temperatures, especially cold ones, are missing, because the buildings were well ventilated in summer and poorly so in winter. Furthermore, the harshness of winter was inevitably mitigated by some internal heat source, including the house’s occupants. The comparison between the anomalies of Venice, Padua, Bologna, and Milan suggests that the average bias of the Temanza temperatures was around +1 °C for indoor exposure.
Even though the Amontons thermometer had always been protected by being kept indoors, in 1756 it began a continuous linear drift, probably due to a microcrack in the bulb glassware or in welds. A similar drawback was observed in Bologna 37 years before, i.e., in 1719, with a Stancari type air thermometer. However, after three years, the damage became unbearable, and in 1759, Temanza definitively abandoned this thermometer. Temanza continued his observations with a small Réaumur thermometer which was gaining popularity in Italy. This was a good thermometer but it had poor resolution, i.e., 1 °R = 1.25 °C. This thermometer was also kept indoors, which was determined based on the low variability of the obtained readings from one day to the next.
The pressure measurements have been recovered and corrected for the first period 1751–1759. The next period was different. In addition to the long gaps in data, the pressure data differed significantly from those of Padua, unjustifiably increasing extreme values. It is unclear whether the reason was due to the aging of the instrument or the reader. However, whatever the reason, the second subset of the pressure observations is not reliable and should be disregarded.
This work has been useful in recovering some climate data from the second half of the seventeenth century, but above all, it has deepened our knowledge of the history of meteorology and early instruments.

Author Contributions

D.C., A.d.V. and F.B. contributed to the conception and design of this paper. D.C., A.d.V. and F.B. contributed to the data recovery and interpretation and discussion of results. The first draft of the manuscript was prepared by D.C. and revised by A.d.V. and F.B. All authors have read and agreed to the published version of the manuscript.

Funding

This research received no external funding.

Data Availability Statement

The data presented in this study are available in FigShare at the url https://doi.org/10.6084/m9.figshare.c.8095543 (accessed on 15 October 2025).

Acknowledgments

The authors sincerely thank their colleagues and the institutions who kindly provided data and images, in particular: Valeria Zanini, INAF-Historical Archive, Padua; Marciana National Library, Venice; Gallica, Bibliothéque Nationale de France; the Austrian National Library; Rijksmuseum, Amsterdam; and the Wellcome Collection, UK.

Conflicts of Interest

The authors declare no conflicts of interest.

Abbreviations

The following abbreviations are used in this manuscript:
BU TestBuishand U Test
INAF-HAIstituto Nazionale di Astrofisica–Historical Archive (Padua)
MKMann–Kendall test
SNH TestStandard Normal Homogeneity Test
TPTurning Point
ZMPS“Zero Mareografico Punta Salute”, i.e., the sea level reference of Venice

Appendix A

The complete dataset of the Amontons thermometer (1751–1759) has been transformed into 12 parallel sub-series, one for each month of the year, composed of the monthly means of the related month. The analysis was performed separately for each month to avoid the fact that seasonal variability could mask the turning point (TP). Homogeneity tests have been applied to the monthly series to find the TP. Figure A1 shows the result of the calculation, performed with the R-package trend, version 1.1.6 [89]. The twelve graphs show the monthly series and the mean values found by the homogeneities tests before (green) and after (red) the TP. The best documented discontinuity was in May 1756, and is related to instrument failure.
Figure A1. Homogeneity tests of the monthly series of temperature measured with the Amontons thermometer. Green (red) horizontal lines highlight the mean values of the series before (after) the discontinuities found by the homogeneity tests.
Climate 13 00217 g0a1

References

  1. du Crest, J.B.M. Description de La Méthode d’un Thermomètre Universel; Valleyre: Paris, France, 1741. [Google Scholar]
  2. Talas, S. Thermometers in the Eighteenth Century: J.B. Micheli Du Crest’s Works and the Cooperation with G.F. Brander. Nuncius 2002, 17, 475–496. [Google Scholar] [CrossRef]
  3. Cotte, L. Mémoires Sur La Météorologie Pour Servir de Suite et de Supplément Au Traité de Météorologie Publié En 1774; Imprimerie Royale: Paris, France, 1774. [Google Scholar]
  4. Martine, G. Chapter 3: Some Observations and Reflections Concerning the Construction and Graduation of Thermometer. In Essays Medical and Philosophical; Millar: London, UK, 1740. [Google Scholar]
  5. Martine, G. Chapter 4: The Comparison of Different Thermometers. In Essays Medical and Philosophical; Millar: London, UK, 1740. [Google Scholar]
  6. Camuffo, D. History of the Long Series of the Air Temperature in Padova. Clim. Change 2002, 53, 7–76. [Google Scholar] [CrossRef]
  7. Camuffo, D.; della Valle, A.; Becherini, F. Pressure and Temperature Observations in Venice by Bernardino Zendrini from 1738 to 1743. Atmosphere 2025, 16, 759. [Google Scholar] [CrossRef]
  8. Toaldo, G. Della Vera Influenza Degli Astri, Delle Stagioni e Delle Mutazioni Di Tempo, Saggio Meteorologico, 1st ed.; Manfré: Padua, Italy, 1770. [Google Scholar]
  9. Temanza, T. Osservazioni del Sig. Tommaso Temanza—Tabelle manoscritte dal 1751 al 1755. 1751; Venice, Italy, 1755. manuscript.
  10. Orteschi, P. Costituzione Corrente Brevemente Considerata Dal Dott, Pietro Orteschi Medico e Filosofo Veneziano; Deregni: Venice, Italy, 1762. [Google Scholar]
  11. Schouw, J.F. Tableau Du Climat de La Végétation de l’Italie. Résultat de Deux Voyages En Ce Pays Dans Les Années 1817–1819 et 1829–1830. In Tableau de la Température et des Pluies de l’Italie; Luno: Copenhagen, Denmark, 1839; Volume 1. [Google Scholar]
  12. Cossali, P. Elogio Di Giovanni Poleni; Bettoni: Padua, Italy, 1813. [Google Scholar]
  13. Crestani, G. L’inizio Delle Osservazioni Meteorologiche a Padova. Il Contributo Di Giovanni Poleni Alla Meteorologia. In Memorie della R. Accademia di Scienze Lettere ed Arti; Rondi, G.B.: Padua, Italy, 1926; Volume 42, pp. 19–83. [Google Scholar]
  14. Poleni, G. Johannis Poleni Miscellanea Hoc Est: I Dissertatio de Barometris et Termometris; Aloysium Pavinum: Venice, Italy, 1709. [Google Scholar]
  15. Ongaro, G. Il Sodalizio Tra Giovanni Poleni e Giambattista Morgagni. In Giovanni Poleni Idraulico Matematico Architetto Filologo (1683–1761); Collana Accademica; Accademia Patavina di Scienze Lettere ed Arti: Padua, Italy, 1988; Volume 10, pp. 187–202. [Google Scholar]
  16. Zendrini, B. Leggi e Fenomeni, Regolazioni Ed Usi Delle Acque Correnti; Pasquali: Venice, Italy, 1741. [Google Scholar]
  17. Zendrini, B. Observationes Meteorologicae Venetiis Habitae Ann. MDCCXXXVIII. In Raccolta d’Opusculi Scientifici, e Filologici; Calogerà, A., Ed.; Occhi: Venice, Italy, 1741; Volume 23. [Google Scholar]
  18. Zendrini, B. Fasciculus Observationum Astronomicarum & Meteorologicarum Ad Annum MDCCXXXVIII & MDCCXXXIX. In Raccolta d’Opusculi Scientifici, e Filologici; Calogerà, A., Ed.; Occhi: Venice, Italy, 1741; Volume 24. [Google Scholar]
  19. Zendrini, B. Fasciculus I Observationum Astronomicarum & Meteorologicarum Annorum MDCCXL & MDCCXLI. In Raccolta d’Opusculi Scientifici, e Filologici; Calogerà, A., Ed.; Occhi: Venice, Italy, 1744; Volume 30. [Google Scholar]
  20. Zendrini, B. Fasciculus II Observationum Astronomicarum & Meteorologicarum Annorum MDCCXLII & MDCCXLIII. In Raccolta d’Opusculi Scientifici, e Filologici; Calogerà, A., Ed.; Occhi: Venice, Italy, 1744; Volume 31. [Google Scholar]
  21. Raicich, F. Long-Term Variability of Storm Surge Frequency in the Venice Lagoon: An Update Thanks to 18th Century Sea Level Observations. Nat. Hazards Earth Syst. Sci. 2015, 15, 527–535. [Google Scholar] [CrossRef]
  22. Negri, F. Notizie Intorno Alla Persona e All’opere Di Tommaso Temanza; Fracasso: Venice, Italy, 1830. [Google Scholar]
  23. Corniani, G.B. I Secoli Della Letteratura Italiana Dopo Il Suo Risorgimento—Commentario; Unione Tipografico-Editrice: Turin, Italy, 1856; Volume 8. [Google Scholar]
  24. Crestani, G. Le Osservazioni Meteorologiche—I Fenomeni Meteorologici. In La Laguna di Venezia; Magrini, G., Ed.; Ferrari: Venice, Italy, 1933; Volume 1, Part 2, Tomo 3; pp. 1–203. [Google Scholar]
  25. World Meteorological Organization. Technical Note No. 7: Reduction of Atmospheric Pressure; World Meteorological Organization: Geneva, Switzerland, 1954; Volume WMO-No. 36. [Google Scholar]
  26. World Meteorological Organization. Technical Note No. 61: Note on the Standardization of Pressure Reduction in the International Network of Synoptic Stations; World Meteorological Organization: Geneva, Switzerland, 1964; Volume WMO-No. 154. [Google Scholar]
  27. Venice Municipality. The Altimetry of the Historical Center: Percentage of Flooding; Venice Municipality: Venice, Italy, 2020. [Google Scholar]
  28. Camuffo, D.; Bertolin, C.; Schenal, P. A Novel Proxy and the Sea Level Rise in Venice, Italy, from 1350 to 2014. Clim. Change 2017, 143, 73–86. [Google Scholar] [CrossRef]
  29. Camuffo, D. A Discussion on Sea Level Rise, Rate Ad Acceleration. Venice as a Case Study. Environ. Earth Sci. 2022, 81, 349. [Google Scholar] [CrossRef]
  30. World Meteorological Organization. Guide to Instruments and Methods of Observation; World Meteorological Organization: Geneva, Switzerland, 2023; Volume WMO-No. 8, I. ISBN 978-92-63-10008-5. [Google Scholar]
  31. Berzelius, J.J. Trattato Di Chimica; Puzziello: Naples, Italy, 1845; Volume 9. [Google Scholar]
  32. Belli, G. Corso Elementare Di Fisica Sperimentale; Società Tipografica de’ Classici Italiani: Milan, Italy, 1830. [Google Scholar]
  33. Amontons, G. Discours Sur Quelques Propriétés de l’Air & Le Moyen d’en Connaitre La Température Dans Tous Les Climats de La Terre. In Mémoires de Mathématique et de Physique; Coignard & Guerin: Paris, France, 1702; pp. 155–174. [Google Scholar]
  34. Zeno, A.; Zeno, P.C. Victorii Francisci Stancarii… Articolo VII. In Giornale de’ Letterati d’Italia; Giovanni Giacomo Hertz: Venice, Italy, 1714; Volume 17, pp. 170–202. [Google Scholar]
  35. Stancari, F. Vittorio De Thermometro Ab Amontonio Recens Inventis. Ex Epistula Ad Maraldum. In Printed Posthumous in: Schedae Mathematicae; Barbiroli Archigymnasium: Bologna, Italy, 1708; pp. 53–55. [Google Scholar]
  36. Camuffo, D.; della Valle, A.; Bertolin, C.; Santorelli, E. The Stancari Air Thermometer and the 1715–1737 Record in Bologna, Italy. Clim. Change 2016, 139, 623–636. [Google Scholar] [CrossRef]
  37. Rossetti, G.B. Descrizione Delle Pitture, Sculture Ed Architetture Di Padova; Stamperia del Seminario: Padua, Italy, 1776. [Google Scholar]
  38. Brandolese, P. Pitture Sculture e Architetture Ed Altre Cose Notabili Di Padova Nuovamente Descritte; Self-Published: Padua, Italy, 1795. [Google Scholar]
  39. Moschini, G. Guida per La Città Di Padova All’amico Delle Belle Arti; Gamba: Venice, Italy, 1817. [Google Scholar]
  40. Giormani, V. L’insegnamento Della Chimica All’Università Di Padova Dal 1749 al 1808; Antenore: Padua, Italy, 1984. [Google Scholar]
  41. Réaumur, R.A. Règles Pour Construire Des Thermomètres Dont Les Degrés Soient Comparables et Qui Donnent Des Idées d’un Chaud et d’un Froid Qui Puissent Être Rapportés à Des Mesures Connues. Mémoires De L’académie R. Des Sci. 1730, 10, 452–457. [Google Scholar]
  42. Réaumur, R.A. Second Mémoire Sur La Construction Des Thermomètres Dont Les Degrés Soient Compatibles. Mémoires De L’académie R. Des Sci. 1731, 4, 250–296. [Google Scholar]
  43. De Luc, J.A. Recherches Sur Les Modifications de l’atmosphère: Contenant l’histoire Critique Du Baromètre et Du Thermomètre; Self-Published: Geneva, Switzerland, 1772; Volume 1. [Google Scholar]
  44. Réaumur, R.A. Observations Du Thermomètre Pendant l’année MDCCXXXIX Faites à Paris et En Différents Pays. Mémoires De L’académie R. Des Sci. 1740, 5, 447–468. [Google Scholar]
  45. Middleton, W.E.K. A History of the Thermometer and Its Use in Meteorology; Hopkins University Press: Baltimore, MD, USA, 1966. [Google Scholar]
  46. World Meteorological Organization. International Meteorological Vocabulary; World Meteorological Organization: Geneva, Switzerland, 1992; Volume WMO No. 182. [Google Scholar]
  47. Camuffo, D. Key Problems in Early Wine-Spirit Thermometers and the “True Réaumur” Thermometer. Clim. Change 2020, 163, 1083–1102. [Google Scholar] [CrossRef]
  48. Camuffo, D. Microclimate for Cultural Heritage, 3rd ed.; Elsevier: Amsterdam, The Netherlands, 2019; ISBN 978-0-444-64106-9. [Google Scholar]
  49. Nollet, J.A. L’Art Des Experiences; Durand: Paris, France, 1770; Volume 3. [Google Scholar]
  50. Jurin, J. Invitatio Ad Observationes Meteorologicas Communi Consilio Instituendas a Jacobo Jurin M. D. Soc. Reg Secr et Colleg Med Lond Socio. Philos. Trans. 1723, 379, 422–427. [Google Scholar]
  51. Hemmer, J.J. Descriptio Instrumentorum Meteorologicorum, Tam Eorum, Quam Societas Distribuit, Quam Quibus Praeter Haec Manheimii Utitur. In Ephem Soc Meteorol Palat; Ex Officina Novae Societatis Typographicae: Mannheim, Germany, 1783; Volume 1, pp. 57–90. [Google Scholar]
  52. Toaldo, G. Investigatio Caloris Plurimum Italiae Locorum. In Saggi Scientifici e Letterari dell’Accademia di Padova; Accademia di Scienze Lettere e Arti: Padua, Italy, 1788; Volume 3, Part 1; pp. 216–228. [Google Scholar]
  53. Camuffo, D.; della Valle, A.; Becherini, F. From Time Frames to Temperature Bias in Long Temperature Series. Clim. Change 2021, 165, 38. [Google Scholar] [CrossRef]
  54. Toaldo, G. Costituzione Meteorologica Del Cielo Di Venezia. In Completa Raccolta di Opuscoli, Osservazioni, e Notizie Diverse Contenute nei Giornali Astro-Meteorologici Dall’anno 1773 sino All’ anno 1798; Andreola: Venice, Italy, 1795; Volume 4, pp. 159–169. [Google Scholar]
  55. Cocheo, C.; Camuffo, D. Corrections of Systematic Errors and Data Homogenisation in the Padova Series (1725-Today). Clim. Change 2002, 53, 77–100. [Google Scholar] [CrossRef]
  56. Camuffo, D.; della Valle, A.; Bertolin, C.; Santorelli, E. Temperature Observations in Bologna, Italy, from 1715 to 1815: A Comparison with Other Contemporary Series and an Overview of Three Centuries of Changing Climate. Clim. Change 2017, 142, 7–22. [Google Scholar] [CrossRef]
  57. Camuffo, D. Calibration and Instrumental Errors in Early Measurements of Air Temperature. Clim. Change 2002, 53, 297–330. [Google Scholar] [CrossRef]
  58. Camuffo, D. Errors in Early Temperature Series Arising from Changes in Style of Measuring Time, Sampling Schedule and Number of Observations. Clim. Change 2002, 53, 331–354. [Google Scholar] [CrossRef]
  59. Camuffo, D.; Bertolin, C. Recovery of the Early Period of Long Instrumental Time Series of Air Temperature in Padua, Italy (1716–2007). Phys. Chem. Earth 2012, 40–41, 23–31. [Google Scholar] [CrossRef]
  60. Camuffo, D.; della Valle, A.; Becherini, F. Instrumental and Observational Problems of the Earliest Temperature Records in Italy: A Methodology for Data Recovery and Correction. Climate 2023, 11, 178. [Google Scholar] [CrossRef]
  61. Stefanini, C.; Becherini, F.; della Valle, A.; Camuffo, D. Homogenization of the Long Instrumental Daily-Temperature Series in Padua, Italy (1725–2023). Climate 2024, 12, 86. [Google Scholar] [CrossRef]
  62. Camuffo, D.; Cocheo, C.; Sturaro, G. Corrections of Systematic Errors, Data Homogenisation and Climatic Analysis of the Padova Pressure Series (1725–1999). Clim. Change 2006, 79, 493–514. [Google Scholar] [CrossRef]
  63. Camuffo, D.; della Valle, A.; Becherini, F.; Zanini, V. Three Centuries of Daily Precipitation in Padua, Italy, 1713–2018: History, Relocations, Gaps, Homogeneity and Raw Data. Clim. Change 2020, 162, 923–942. [Google Scholar] [CrossRef]
  64. della Valle, A.; Camuffo, D.; Becherini, F.; Zanini, V. Recovering, Correcting, and Reconstructing Precipitation Data Affected by Gaps and Irregular Readings: The Padua Series from 1812 to 1864. Clim. Change 2023, 176, 9. [Google Scholar] [CrossRef]
  65. Camuffo, D.; Bertolin, C.; Bergonzini, A.; Amore, C.; Cocheo, C. Early Hygrometric Observations in Padua, Italy, from 1794 to 1826: The Chiminello Goose Quill Hygrometer versus the de Saussure Hair Hygrometer. Clim. Change 2014, 122, 217–227. [Google Scholar] [CrossRef]
  66. Alexandersson, H. A Homogeneity Test Applied to Precipitation Data. J. Climatol. 1986, 6, 661–675. [Google Scholar] [CrossRef]
  67. Buishand, T.A. Some Methods for Testing the Homogeneity of Rainfall Records. J. Hydrol. 1982, 58, 11–27. [Google Scholar] [CrossRef]
  68. Pettitt, A.N. A Non-Parametric Approach to the Change-Point Problem. J. R. Stat. Soc. Ser. C Appl. Stat. 1979, 28, 126–135. [Google Scholar] [CrossRef]
  69. Wijngaard, J.B.; Klein Tank, A.M.G.; Können, G.P. Homogeneity of 20th Century European Daily Temperature and Precipitation Series. Int. J. Climatol. J. R. Meteorol. Soc. 2003, 23, 679–692. [Google Scholar] [CrossRef]
  70. Mann, B. Henry Nonparametric Tests Against Trend. Econometrica 1945, 13, 245–259. [Google Scholar] [CrossRef]
  71. Kendall, M.G. Rank Correlation Methods, 4th ed.; Charles Griffin: London, UK, 1975. [Google Scholar]
  72. Hussain, M.M.; Mahmud, I. pyMannKendall: A Python Package for Non Parametric Mann Kendall Family of Trend Tests. J. Open Source Softw. 2019, 4, 1556. [Google Scholar] [CrossRef]
  73. Toaldo, G. Della Vera Influenza Degli Astri, Delle Stagioni e Delle Mutazioni Di Tempo, Saggio Meteorologico, 2nd ed.; Stamperia del Seminario: Padua, Italy, 1781. [Google Scholar]
  74. Boggs, P.T.; Rogers, J.E. Orthogonal Distance Regression. In Proceedings of the Statistical Analysis of Measurement Error Models and Applications, Humboldt State University, Arcata, CA, USA, 10–16 June 1989; American Mathematical Society: Arcata, CA, USA, 1990; Volume 112, pp. 183–194. [Google Scholar]
  75. Camuffo, D.; Bertolin, C.; Craievich, A.; Granziero, R.; Enzi, S. When the Lagoon Was Frozen over in Venice from A.D. 604 to 2012: Evidence from Written Documentary Sources, Visual Arts and Instrumental Readings. Méditerranée 2017, 129, 1–68. [Google Scholar] [CrossRef]
  76. Camuffo, D.; Becherini, F.; della Valle, A. Temperature Observations in Florence, Italy, after the End of the Medici Network (1654–1670): The Grifoni Record (1751–1766). Clim. Change 2020, 162, 943–963. [Google Scholar] [CrossRef]
  77. Matsuo, T.; Sasyo, Y. Non-Melting Phenomena of Snowflakes Observed in Subsaturated Air below Freezing Level. J. Meteorol. Soc. Jpn. 1981, 59, 26–32. [Google Scholar] [CrossRef]
  78. Masih, I. Understanding Hydrological Variability for Improved Water Management in the Semiarid Karkheh Basin, Iran. Ph.D. Thesis, Leiden University, Leiden, The Netherlands, 2011. [Google Scholar]
  79. O’Gorman, P.A. Contrasting Responses of Mean and Extreme Snowfall to Climate Change. Nature 2014, 512, 416–418. [Google Scholar] [CrossRef]
  80. Camuffo, D.; Becherini, F.; della Valle, A. Daily Temperature Observations in Florence at the Mid-Eighteenth Century: The Martini Series (1756–1775). Clim. Change 2021, 164, 42. [Google Scholar] [CrossRef]
  81. Galeazzi, D.M.G. De Thermometris Amontonianis Conficiendis. In Commentarii de Bononiensi Scientiarum et Artium Instituto atque Academia; Della Volpe: Bologna, Italy, 1746; Volume 2, Part 1; pp. 303–307. [Google Scholar]
  82. Parkes, E.A. A Manual of Practical Hygiene Prepared Especially for Use in the Medical Service of the Army; John Churchill & Sons: London, UK, 1866. [Google Scholar]
  83. JCGM. International Vocabulary of Metrology. 3rd Edition, Joint Committee for Guides in Metrology, 3rd ed.; BIPM: Sèvres Cedex, France, 2012. [Google Scholar]
  84. Dai, A. The Diurnal Cycle from Observations and ERA5 in Surface Pressure, Temperature, Humidity, and Winds. Clim. Dyn. 2023, 61, 2965–2990. [Google Scholar] [CrossRef]
  85. World Meteorological Organization. Climate Data Management System Specifications, 2nd ed.; WMO: Geneva, Switzerland, 2025; Volume WMO-No. 1131, ISBN 978-92-63-11131-9. [Google Scholar]
  86. Maugeri, M.; Buffoni, L.; Delmonte, B.; Fassina, A. Daily Milan Temperature and Pressure Series (1763–1998): Completing and Homogenising the Data. Clim. Change 2002, 53, 119–149. [Google Scholar] [CrossRef]
  87. World Meteorological Organization. Abridged Final Report of the Second Session. In Proceedings of the Commission for Weather, Climate, Water and Related Environmental Services and Applications, Geneva, Switzerland, 17–21 October 2022; WMO: Geneva, Switzerland, 2022; Volume WMO-No. 1307. [Google Scholar]
  88. World Meteorological Organization. Manual on the High-Quality Global Data Management Framework for Climate—Annex IX to the WMO Technical Regulations, 2nd ed.; WMO: Geneva, Switzerland, 2023; Volume WMO-No. 1238, ISBN 978-92-63-11238-5. [Google Scholar]
  89. Pohlert, T. Trend: The Non-Parametric Trend Tests and Change-Point Detection, version 1.1.6; R package; R Foundation: Vienna, Austria, 2023. [Google Scholar]
Figure 1. Portraits: (a) Giovanni Poleni; (b) Giovan Battista Morgagni; (c) Bernardino Zendrini; and (d) Tommaso Temanza. (Credits: (a,c) Austrian National Library, Public Domain; (b) Rijksmuseum, Amsterdam, Public Domain; and (d) Wellcome Collection, UK, CC-BY).
Climate 13 00217 g001
Figure 2. Timeline of the instruments used by Temanza: barometer (red), Amontons thermometer (blue), and Réaumur thermometer (green).
Climate 13 00217 g002
Figure 4. The two types of Réaumur thermometers and their calibration methods. (a) Left to right: a Réaumur thermometer (indicated as “Figure 5”) with two scales, i.e., the volumetric “true” and “false”, indicated with two calibration points. On the table, a pot E with hot steam for the boiling point calibration and a small thermometer C dipped inside it. The circular stand holds a series of flasks A for the volumetric calibration. Under the table: a box with small thermometers undergoing calibration, and in the middle, a long thermometer used as a reference (indicated as “Figure 3”). Note how the reference degrees were marked by tying a piece of silk thread onto the tubes. To the right of the table, a long thermometer F dipped in crushed ice for the melting point calibration, and a small thermometer C. On the extreme right, a high-resolution, long thermometer used for reference (indicated as “Figure 4”). (adapted by Nollet [49], Bibliothèque Nationale de France). (b) A Réaumur thermometer mounted on a tablet with the scale. (c) Technical detail showing how the glassware was fixed to the tablet with iron wires. (Cotte [3]; Gallica, Bibliothéque Nationale de France).
Climate 13 00217 g004
Figure 5. Original readings of Temanza measurements: (a) Amontons thermometer (Venice inches): green and red points are un-drifted and drifted values, respectively; (b) Réaumur thermometer (°R); and (c) barometer (Venice inches).
Climate 13 00217 g005
Figure 6. Scheme of how to read the temperature using Temanza’s Amontons thermometer. (a) Barometer; hB is the height of the mercury column that allows us to estimate the pressure P (T°C). (b) Amontons thermometer when temperature is greater than the “Temperate” value X; hA is the height of the mercury column; and A (T°C) is the same height referring to the mercury level when the temperature is X. (c) Amontons thermometer when temperature is less than the “Temperate”. The meaning of the symbols is the same as in (b).
Climate 13 00217 g006
Figure 7. Drift correction of measurements of Amontons thermometer. Green and red points are un-drifted and drifted data, respectively. (a) Uncorrected data. The green (red) line is the best fit line of un-drifted (drifted) data. (b) Data after drift correction.
Climate 13 00217 g007
Figure 8. (a) Original measurements of Temanza’s Amontons thermometer after the drift correction. (b) The same data compared with Padua. (c) Temperature of Venice after the pressure correction and the interpolation with the temperature of Padua. (d) Comparison between the temperatures of Padua and Venice. Solid line: the best fit interpolation, and dashed lines: the “Temperate” X.
Climate 13 00217 g008
Figure 9. Temperature distribution of snowy days in Venice (Amontons thermometer).
Climate 13 00217 g009
Figure 10. (a) Temperature of Venice measured by Temanza with the Réaumur thermometer (blue and green dots) compared with the measurements in Padua. (b) Comparison of the temperature of Venice and Padua. Blue and green dots highlight the 1761–1762 and 1768–1769 periods, respectively.
Climate 13 00217 g010
Figure 11. Distribution of the differences between the temperature of a selected day n and the value of the previous day n − 1, in Venice and in Padua.
Climate 13 00217 g011
Figure 12. Capillarity depression versus tube diameter.
Climate 13 00217 g012
Figure 13. (a) Time series of the pressure in Venice after the correction for the temperature. Blue and red colors highlight the temperature measurements performed with the Amontons and Réaumur thermometers, respectively. (b) Comparison of the pressure measurements of Poleni in Padua and Temanza in Venice. (c) Time series of the period 1751–1759 after the correction with Padua. (d) Scatter plot of Venice vs. Padua for the period 1751–1759 after correction. Values that exceed the limit of 10 hPa compared to the previous and next days are highlighted in orange.
Climate 13 00217 g013aClimate 13 00217 g013b
Figure 14. Annual and seasonal anomaly of Venice compared to the contemporary anomalies of Padua (30 km distance), Bologna (130 km) and Milan (240 km). Reference period: 1961–1990. MAM: March, April, May; JJA: June, July, August; SON: September, October, November; and DJF: December, January, February.
Climate 13 00217 g014
Table 1. Periods and sources of daily observations made by Temanza.
PeriodReferenceObservations
1751–1755INAF HAPressure, temperature (Amontons), ebb and flow of the sea, weather note, wind, rain amount.
1756–30 April 1759
1755Toaldo [8]Pressure, temperature (Amontons), ebb and flow of the sea, weather notes, wind, rain amount.
1755INAF HA—folii 21–25Description of the lagoon frozen out in 1755.
1761–30 April 1762Orteschi [10]Pressure, temperature (Réaumur), weather notes, wind and rain.
1765–30 June 1766INAF HAEbb and flow of the sea.
1 January–7 June 1768INAF HAPressure, temperature (Réaumur), weather note, wind and rain.
1769INAF HAPressure, temperature (Réaumur), ebb and flow of the sea, weather notes, wind and rain.
Table 2. List of the papers devoted to the recovery, correction, homogenization, and validation of the series of Padua (1725–2024).
Physical VariableReferences
Temperature[6,55,57,58,59,60,61]
Pressure[62]
Precipitation[60,63,64]
Humidity[65]
Observing time[53,57]
Table 3. Main types of errors in the early barometers of the 18th century, and a rough estimate of the largest error.
Error TypeExplanationLargest Value
Purity of mercury Crude mercury not purified, with inclusions of bismuth, tin, lead, iron, sulfur, calcium carbonate, and other impurities. It could be filtered from dust, rust, or other solid debris.5 mm
Glass composition and contaminantsGlass composition and impurities deposited on the tube.6 mm
MeniscusMeniscus curvature, deformation and selected part (top, base) for reading.2 mm
CapillarityDepression of the column for capillarity in narrow tubes.25 mm
Scale compositionDepending on the material of which the scale was made, it underwent different expansions. A wooden scale had shrinkage and swelling due to relative humidity.5 mm
Scale graduationIrregularities from being made manually.1 mm
Fixed scaleA fixed scale had the 0 dipped into the mercury, and the dipped value had to be read (meniscus error) and subtracted.2 mm
Adjustable scaleThe scale had to be adjusted manually, but the ivory point was invented by Fortin in 1805.2 mm
Imperfect vacuumSome small bubbles of moist air or other contaminants were outgassed by mercury or introduced when the tube was filled. These depressed the mercury column.10–30 mm
Bulk instrumental errorsAny other error different from the above list.5 mm
Wind dynamic effectUpwind overpressure or downwind low generated by strong winds interacting with the building.2 mm
Disclaimer/Publisher’s Note: The statements, opinions and data contained in all publications are solely those of the individual author(s) and contributor(s) and not of MDPI and/or the editor(s). MDPI and/or the editor(s) disclaim responsibility for any injury to people or property resulting from any ideas, methods, instructions or products referred to in the content.