Article

Contemporary Tendencies in Snow Cover, Winter Precipitation, and Winter Air Temperatures in the Mountain Regions of Bulgaria

National Institute of Meteorology and Hydrology, 1784 Sofia, Bulgaria
*
Author to whom correspondence should be addressed.
Climate 2025, 13(10), 212; https://doi.org/10.3390/cli13100212 (registering DOI)
Submission received: 19 August 2025 / Revised: 28 September 2025 / Accepted: 3 October 2025 / Published: 11 October 2025

Abstract

Snow is an essential meteorological variable and an indicator of the changing climate. Its variations, particularly in snow depth and snow water equivalent, result mainly from changes in winter precipitation and air temperature. Recently, these conditions have been thoroughly investigated worldwide, revealing a general prevailing decline in precipitation and increasing tendencies in air temperatures. However, no systematic or up-to-date studies for Bulgaria exist. The main goal of the current project is to fill this national knowledge gap in the snow conditions in our mountains. For that purpose, we used 31 stations with altitudes ranging from 527 to 2925 m a.s.l. for the period between 1961 and 2020, covering two significant reference climatic periods. We extracted data about snow cover maximums, mean air temperatures, and precipitation amounts for the whole winter season in mountainous regions from October to April; however, we mainly present the results for the three winter months: December, January, and February. Most of the stations do not demonstrate any significant trends for snow depth maximums, except for the three lower stations in central west Bulgaria, which show significant increases. On the opposite end of the scale, two of the highest stations demonstrated notable decreases. The time series for the precipitation amounts are also predominantly indefinite. Significant decreasing trends can be found at the highest three alpine stations. The change in the mean seasonal air temperature is predominantly positive—17 of the stations show positive trends, and for 12, the increases are significant. The altitude of the strongest seasonal temperature rise lies between 1000 and 1700 m. Finally, due to the obvious nonlinearity of some of the time series, we decided to check for change points and a nonlinear approach to fit the data. This analysis demonstrates general changes in the investigated characteristics from the beginning of the 1970s to the middle of the 1980s.

1. Introduction

Mountains cover about one-fifth of the Earth’s continental area and provide direct support for close to 10% of the world’s population and indirect support for over half [1]. In Bulgaria, they represent more than 30% of the country’s territory. Snow accumulated from early autumn to late spring is an important water resource, feeding lakes, rivers, reservoirs, groundwater, and the hydroelectric industry throughout the country. Mountain ecosystems and vegetation also strongly depend on snow cover conditions [2,3]. Snow cover depth and duration also play a key role as an essential resource for winter tourism. However, snow in these regions is also a hazard; this can include avalanches and their impact on infrastructure and human activities [4,5,6]. Snow is a significant load on buildings and construction, particularly in places where significant snow depth is expected, such as lee slopes or areas with large drifts due to snow transported by wind. Knowledge about maximum possible snow loads is thus very important in technical dimensioning and construction design. Snow is also a significant meteorological element and an indicator of the fluctuating climate, as demonstrated by changes in winter precipitation and air temperatures. In mountain regions, an average 1 °C rise in air temperatures is accompanied by a general rise of about 150 m in the altitude of the snowline [7]. Considering the recent tendencies of the warming climate, it is important to quantify changes in snow amount and duration and their altitudinal dependence, as this can have significant consequences for the aforementioned economic and environmental aspects. The Alps and other European mountain regions have been subject to various climatological investigations over a long period. Asymmetrical changes in minimum and maximum temperature trends were found in [8], such that “minimum temperatures have risen at a rate three times faster than the maximums since the 1950s”. In [9], it was shown that not only is there a time dependency on observed warming but also an altitudinal dependency of temperature anomalies. Many authors have investigated the behavior of extreme temperatures and precipitation in Alpine regions under anthropogenic influence and their possible impact on the shift in means [1,10,11,12], leading to the following two important conclusions. First, “in a warmer climate, precipitation amount in the Alps would be generally reduced, but isolated events of extreme precipitation could be expected to increase signifi-cantly” [1]. Second, in [13], it was shown that there is an asymmetry between shifts in the lower [minimum] extreme and the upper [maximum] extreme, leading to a changed frequency distribution profile for temperatures. Furthermore, the authors of [1] emphasized the complex character of the Alpine climate due to several factors, including relief, global atmospheric circulation, and exposure to different climatological influences—Mediterranean, Atlantic, continental, and polar. Snow depth and its duration in the Swiss Alps for the past 50 years were investigated in [14], encountering periods of abundant and sparse snow winters, which were found to be connected to the North Atlantic Oscillation [NAO] index. The authors also found that the snow pack at altitudes above 1750 m is not sensitive to climatic fluctuations. The sensitivity of snow cover days to the air temperature in the Austrian Alps was investigated in [15] over a 30-year period. The behavior of snow as a function of temperature, precipitation, and altitude was examined in [16], and a temperature-precipitation matrix was proposed, upon which snow cover was superimposed. One of the few recent studies on snow cover in the Bulgarian mountains can be found in [17]. The possible impacts of expected snow cover changes on ski resorts in the Swiss Alps were explored in [18]. That study focused on the threshold of 30 cm snow depths as the limit necessary for ski lifts to operate, clearly demonstrating that “every selected ski resort in Switzerland, despite their important climatic differences, will encounter a reduction, sometimes drastic, in snow amount and in terms of the duration of the winter season”. A long-term analysis of snow depth in the Sonnblick region [2400–3100 m a.s.l.] and its relationship with climate change for highly elevated sites of the European Alps was carried out in [19]. In [20], the joint probability distribution of air temperature and precipitation was utilized to categorize winters and to estimate snow amount and duration. A survey of the reported evidence for elevation-dependent warming [EDW] was conducted in [21], examining its possible mechanisms. The authors proposed a strategy for future research to reduce current uncertainties in the observation of this phenomenon, especially in remote, high-elevation regions. Recent studies of snow cover depth, snowfall days, and temperature and precipitation conditions in the Carpathians and Italian Alps have also reported about snow cover decreases and precipitation and temperature increases [22,23,24]. In 2018, a comprehensive review of the state of the art of investigations of the European mountain cryosphere and their perspective was completed [25]. In 2021, another international collaboration summarized the observed snow depth trends in the European Alps [26]. Our study aims to reveal the main contemporary meteorological conditions in the mountainous regions of Bulgaria with a focus on the variables that determine the formation of snow cover and its duration, as the last such investigations were carried out in the 1950s and 1980s [27,28]. Recently, preliminary results from two Bulgarian mountains were reported [29,30]. The current study is a summarization of this contemporary research.

2. Materials and Methods

2.1. Data and Station Information

The data used in this research consists of information about the daily measurements for snow cover depth, air temperature, and precipitation amounts collected and archived by the National Institute of Meteorology and Hydrology (NIMH), the national weather service of Bulgaria. All measurements were made by an observer. From this information, monthly summaries of the investigated variables were extracted—the monthly maxi-mums of the snow cover, mean monthly air temperatures, and monthly precipitation sums for November to April. However, in the current study, we focused only on the pure winter months—December, January, and February. The collected data mainly covers the period from 1960 to 2021, which encompasses two reference climatic periods (1961–1990 and 1991–2020). There were 31 stations, but not all of them have full data records for the whole period—8 of them are rain stations and measure only precipitation and snow cover; others were altered to be the same type, and temperature measurements were cut off in the 1990s. One station—Rojen—only started recording data in 1982. The highest station in our mountains—on Musala, the highest peak on the Balkan peninsula—does not measure snow depth, so this characteristic is unfortunately also unavailable here. A list of the stations with their altitudes and data availability is provided in Table 1, and their geographical locations and distribution are presented in Figure 1. All of the stations with incomplete data are marked in the table with the symbol *. However, the missing years were very few and did not hamper the investigation. The collected data was checked for gross errors using different approaches, namely, by comparing the data with neighboring stations or by checking its conformity with other meteorological variables.

2.2. Methods

We used the Mann–Kendall test for trend analysis [31,32], assessing the significance of a monotonic upward or downward trend in the selected meteorological characteristics at a significance level of 0.05. Before starting the analysis, we checked the homogeneity of the data by using the standard normal homogeneity test [33]. We detected only four stations with possible inhomogeneity in the data—three temperature data series and one snow cover set. We checked them additionally and decided to retain the original data records. In the last part of this study, because of nonlinearity in some of the time series, we decided to also include Pettitt’s test for change point detection [34], as well as Locally Weighted Regression (LOWESS) [35] for a better fit to the data. The Pettit test is a nonparametric robust test for detection of shifts in the data distribution. The local regression is a moving smoothing procedure for local fitting. Pettitt’s test was performed on all stations’ data, and in eleven of them, change points were detected. The results based on LOWESS must be considered preliminary, and they are limited only to the highest four stations: Musala, Botev, Cherni Vrah, and Murgash.
The Mann–Kendall trend test was performed with two statistical software packages SYSTAT 13® and XLSAT®, and the other two assessments were conducted in the R environment. The R package trend (version 1.1.6) was used for Pettitt’s test change-point detection. More details can be found in [36,37].

3. Results

3.1. Trend Analysis with the Mann–Kendall Trend Test

3.1.1. Seasonal Snow Cover Maximum (Hmax)

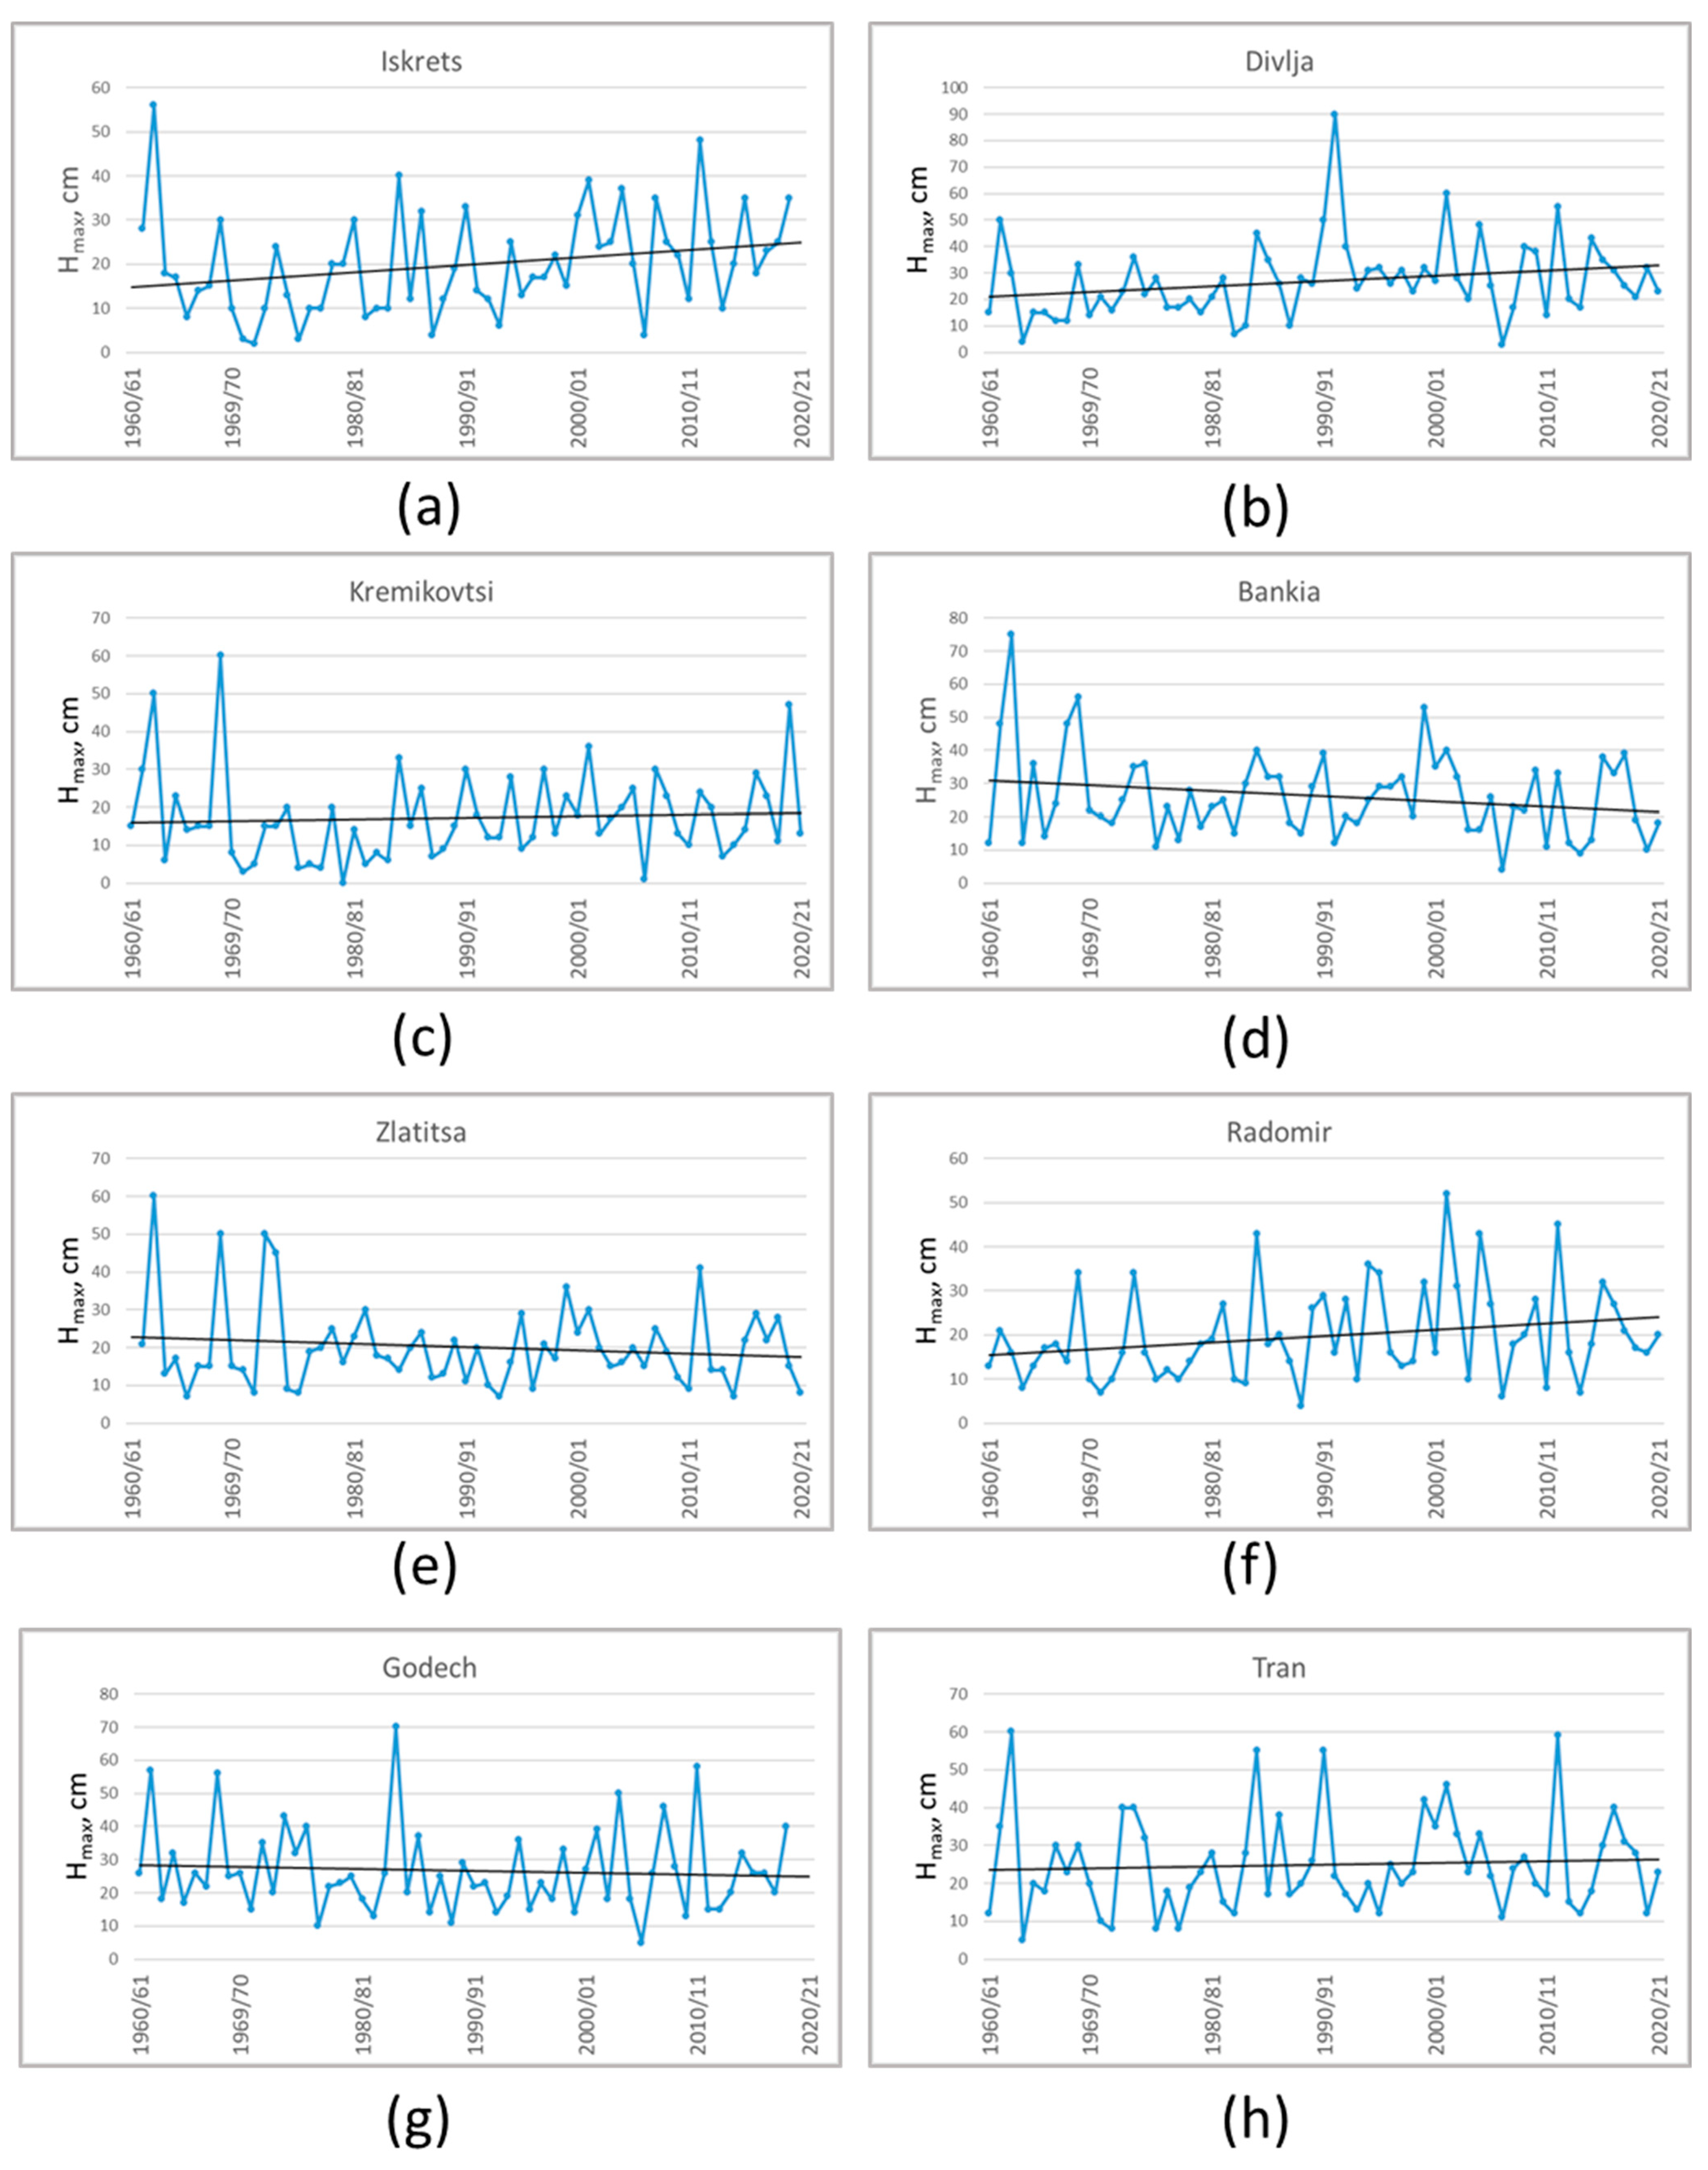
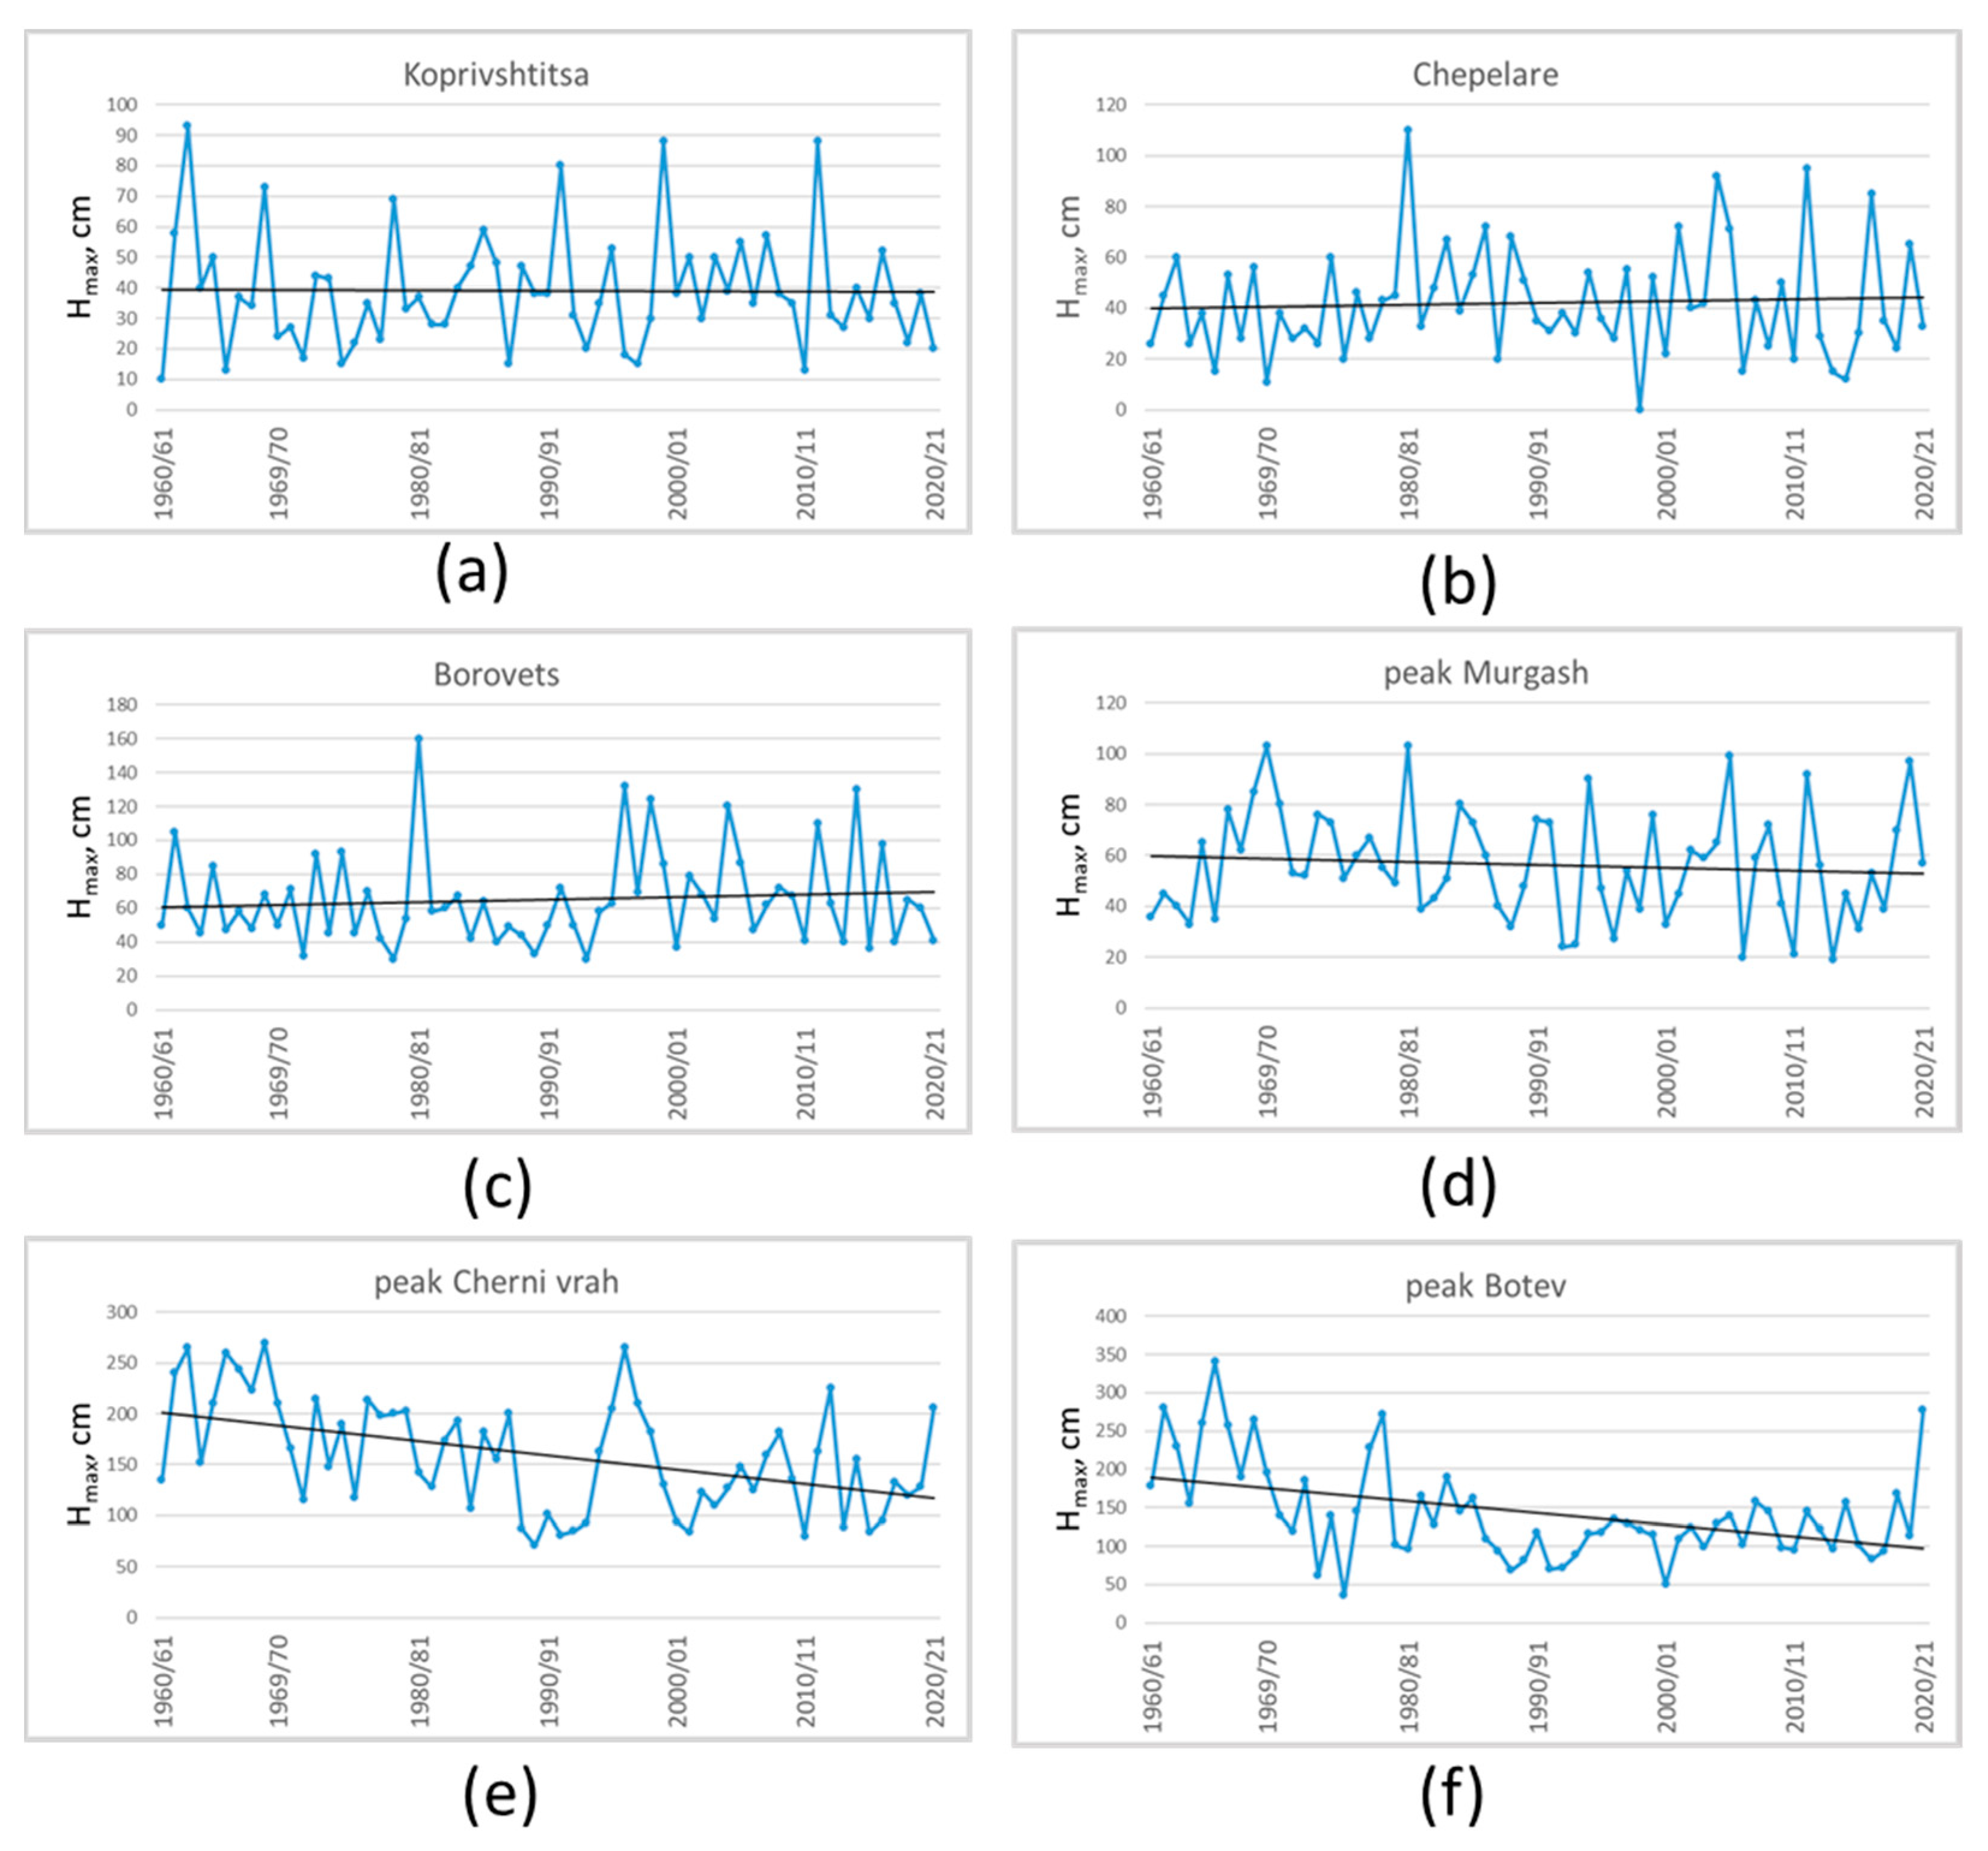
In this section, we present the results of the assessment for a monotonic change in the time series of the seasonal snow cover maximums (Hmax) for the months December to February. We extended the period from November to April only for the highest stations because of the later date of the seasonal snow maximum, which is usually in March or April. The main results are presented in Figure 2, Figure 3 and Figure 4. Figure 2 and Figure 3 summarizes the outputs for all stations with altitudes of up to 1200 m, and Figure 4c,d summarizes the rest with available data above this altitude, i.e., four stations. Only three stations are missing from the whole picture: Musala, for the reason explained above, and stations Godech and Rojen, which do not cover the full investigated period. Only three of the mosaic pictures in Figure 2, Figure 3 and Figure 4 depict a significantly increasing Hmax trend: Iskrets, Divlja, and Radomir. All are located in central west Bulgaria and are more exposed to cold advections from the northwest. The other stations with significant changes in this characteristic, but with the opposite signs, are Botev vrah in Stara Planina and Cherni Vrah on Vitosha Mountain. All other regions show either undetermined trends or similar, with slight changes in the upward or downward (Bankia, Raikovo, Bansko, Samokov) directions, including the unrepresented regions of Godech and Rojen. These findings may seem surprising because of the recent common feeling of disappearing snow. One explanation could be the character of the investigated variable. The snow cover maximum is important for assessment of the snow load and water reserves in the snow but is more representative for higher altitudes. In lower locations, it is a transitory feature. It can be assumed that the snow maximums in the low mountain regions are formed in a single synoptic event and that the snowfall conditions have not changed considerably in time, so they can maintain relatively constant level of the snow maximum. That is way, no significant trends of this characteristic in the lower mountain regions were detected. In the higher mountain regions, snow cover is cumulatively accumulated during the whole winter, and, here the decrease in seasonal snow cover maximums is caused by the diminishing of winter precipitation amounts.
Figure 4c–f show the behavior of four stations for the October–April period. The first two stations—Borovets and Murgash (second row of Figure 4)—do not indicate any linear trends. The graphs for the other two stations —the highest ones in the study with available snow cover data—manifest significant decreases in the seasonal snow cover maximums. The decrease for Botev vrah in comparison with the previous climatic period (1961–1990) is 32%, for Cherni vrah, it is 26%, and for Murgash, it is only 7% (Figure 5).

3.1.2. Winter Precipitation Amounts (PAs)

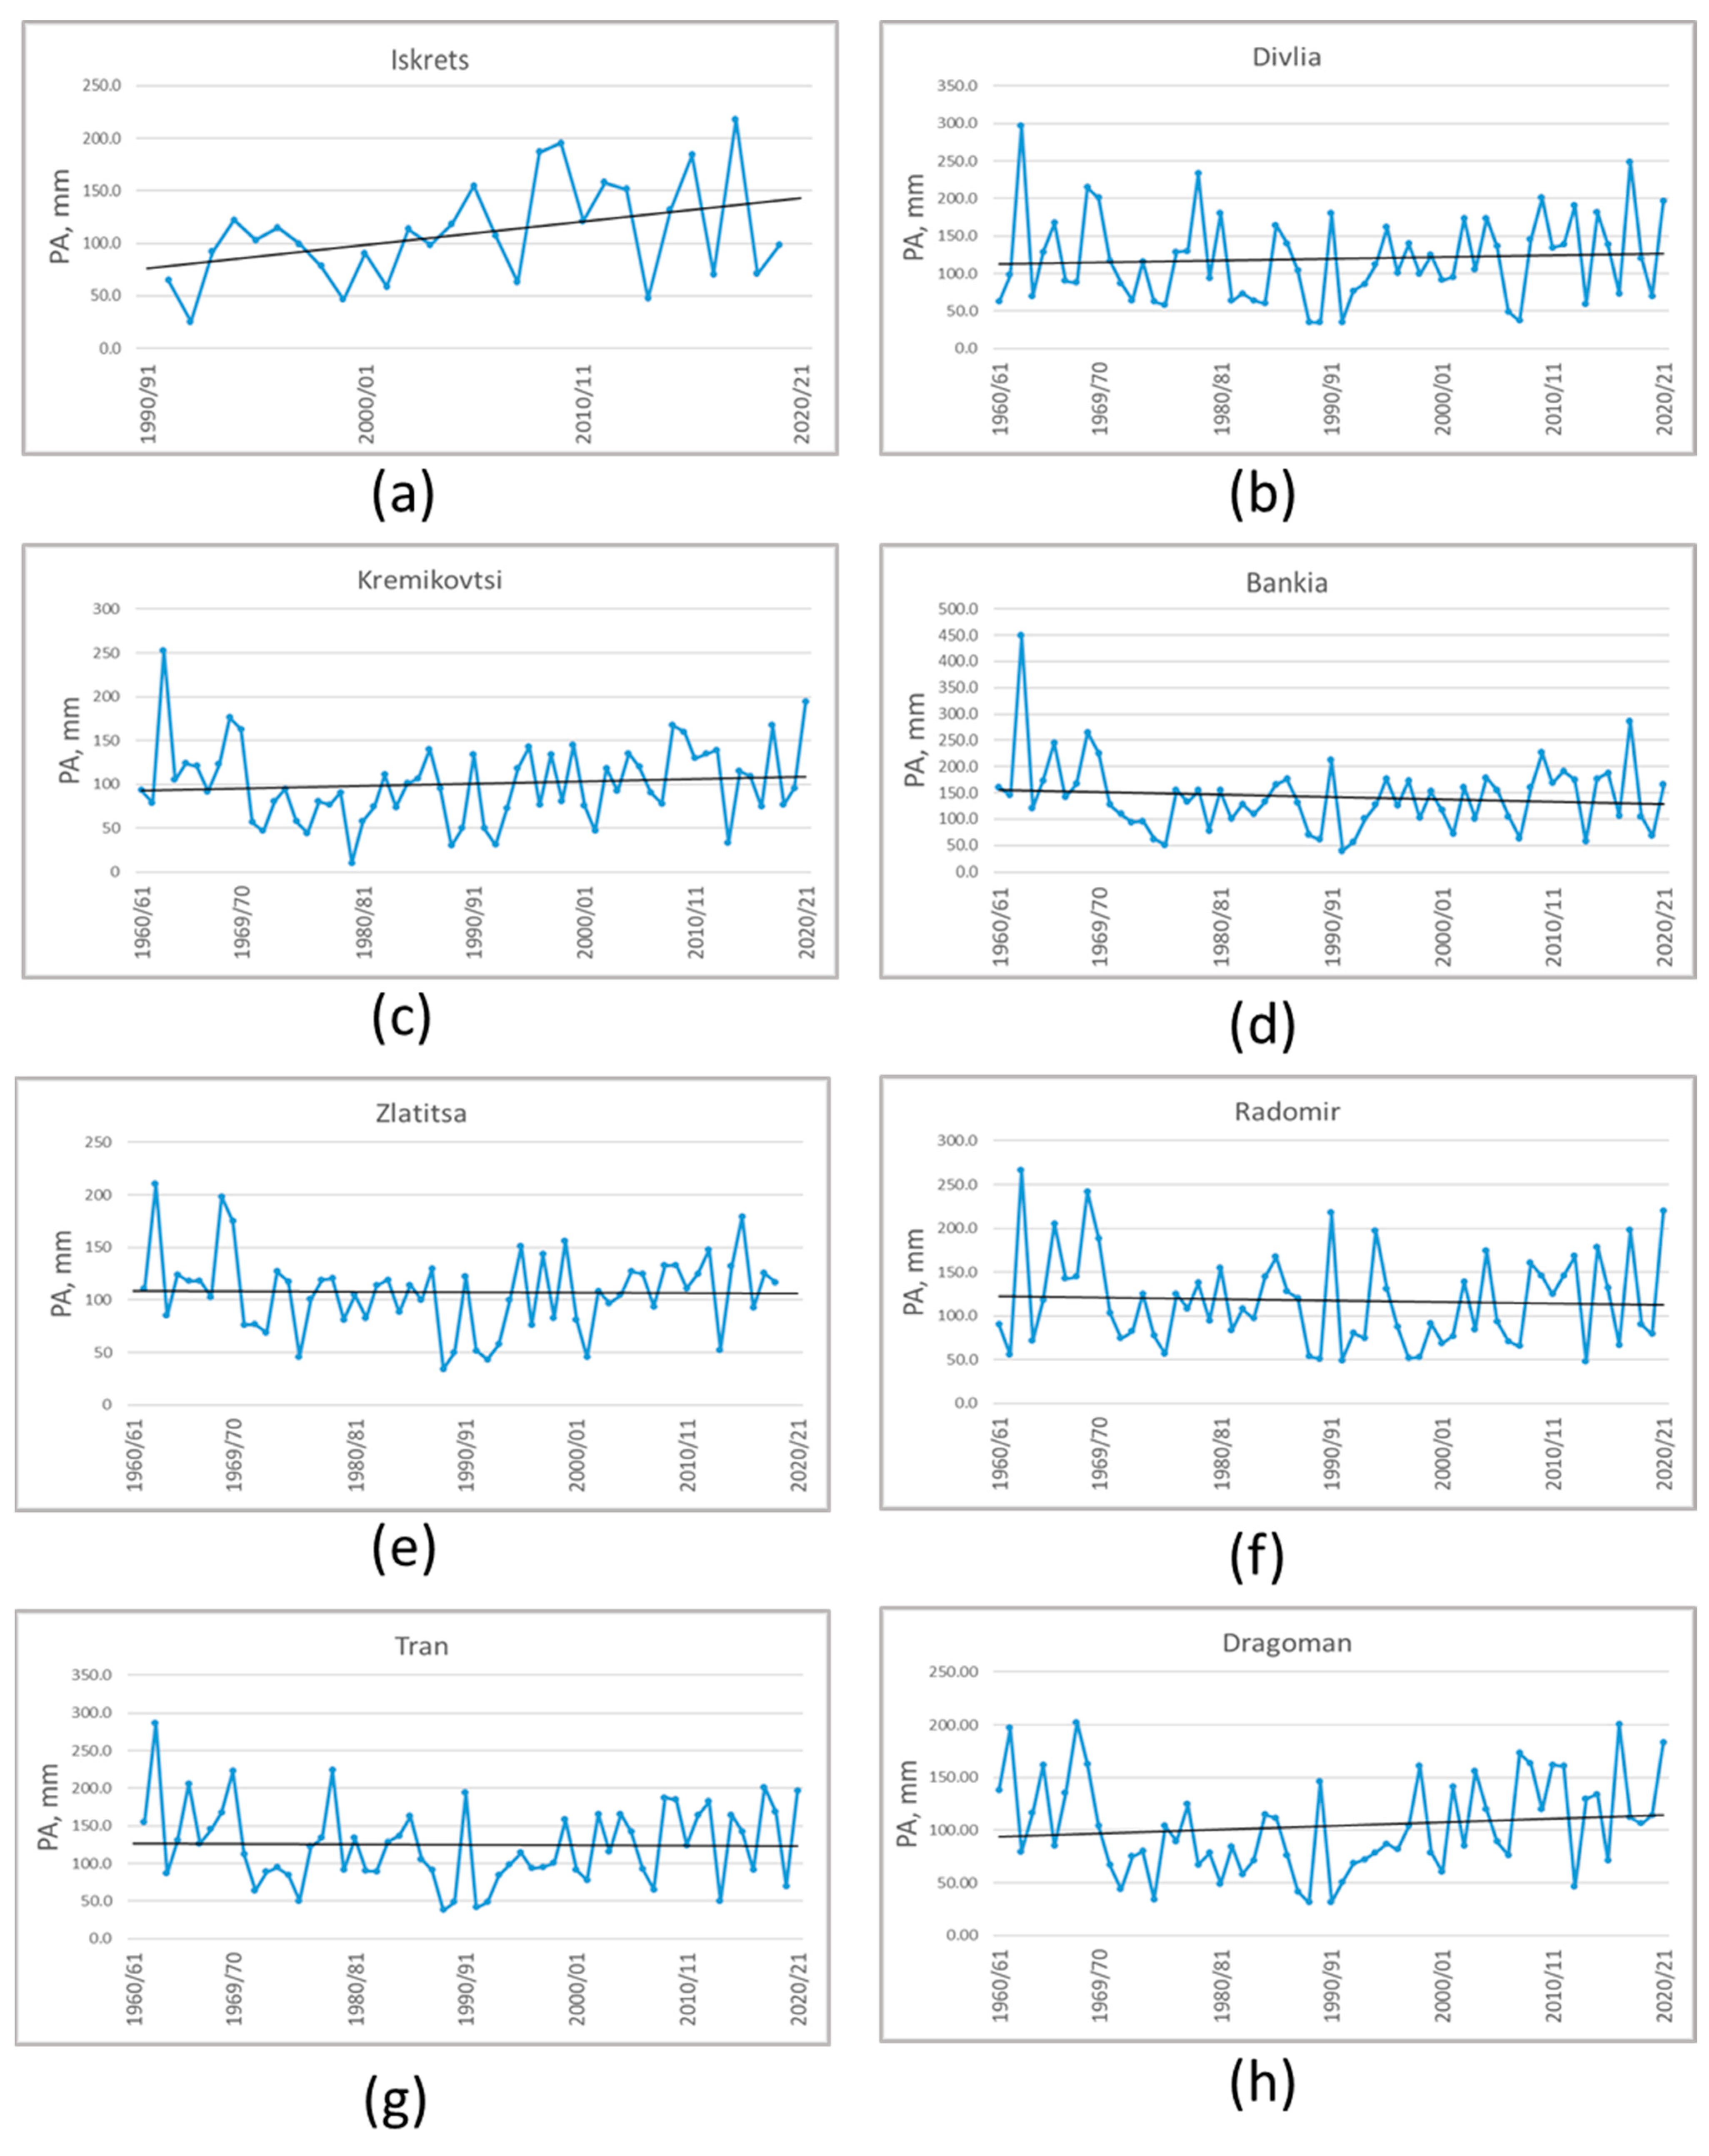
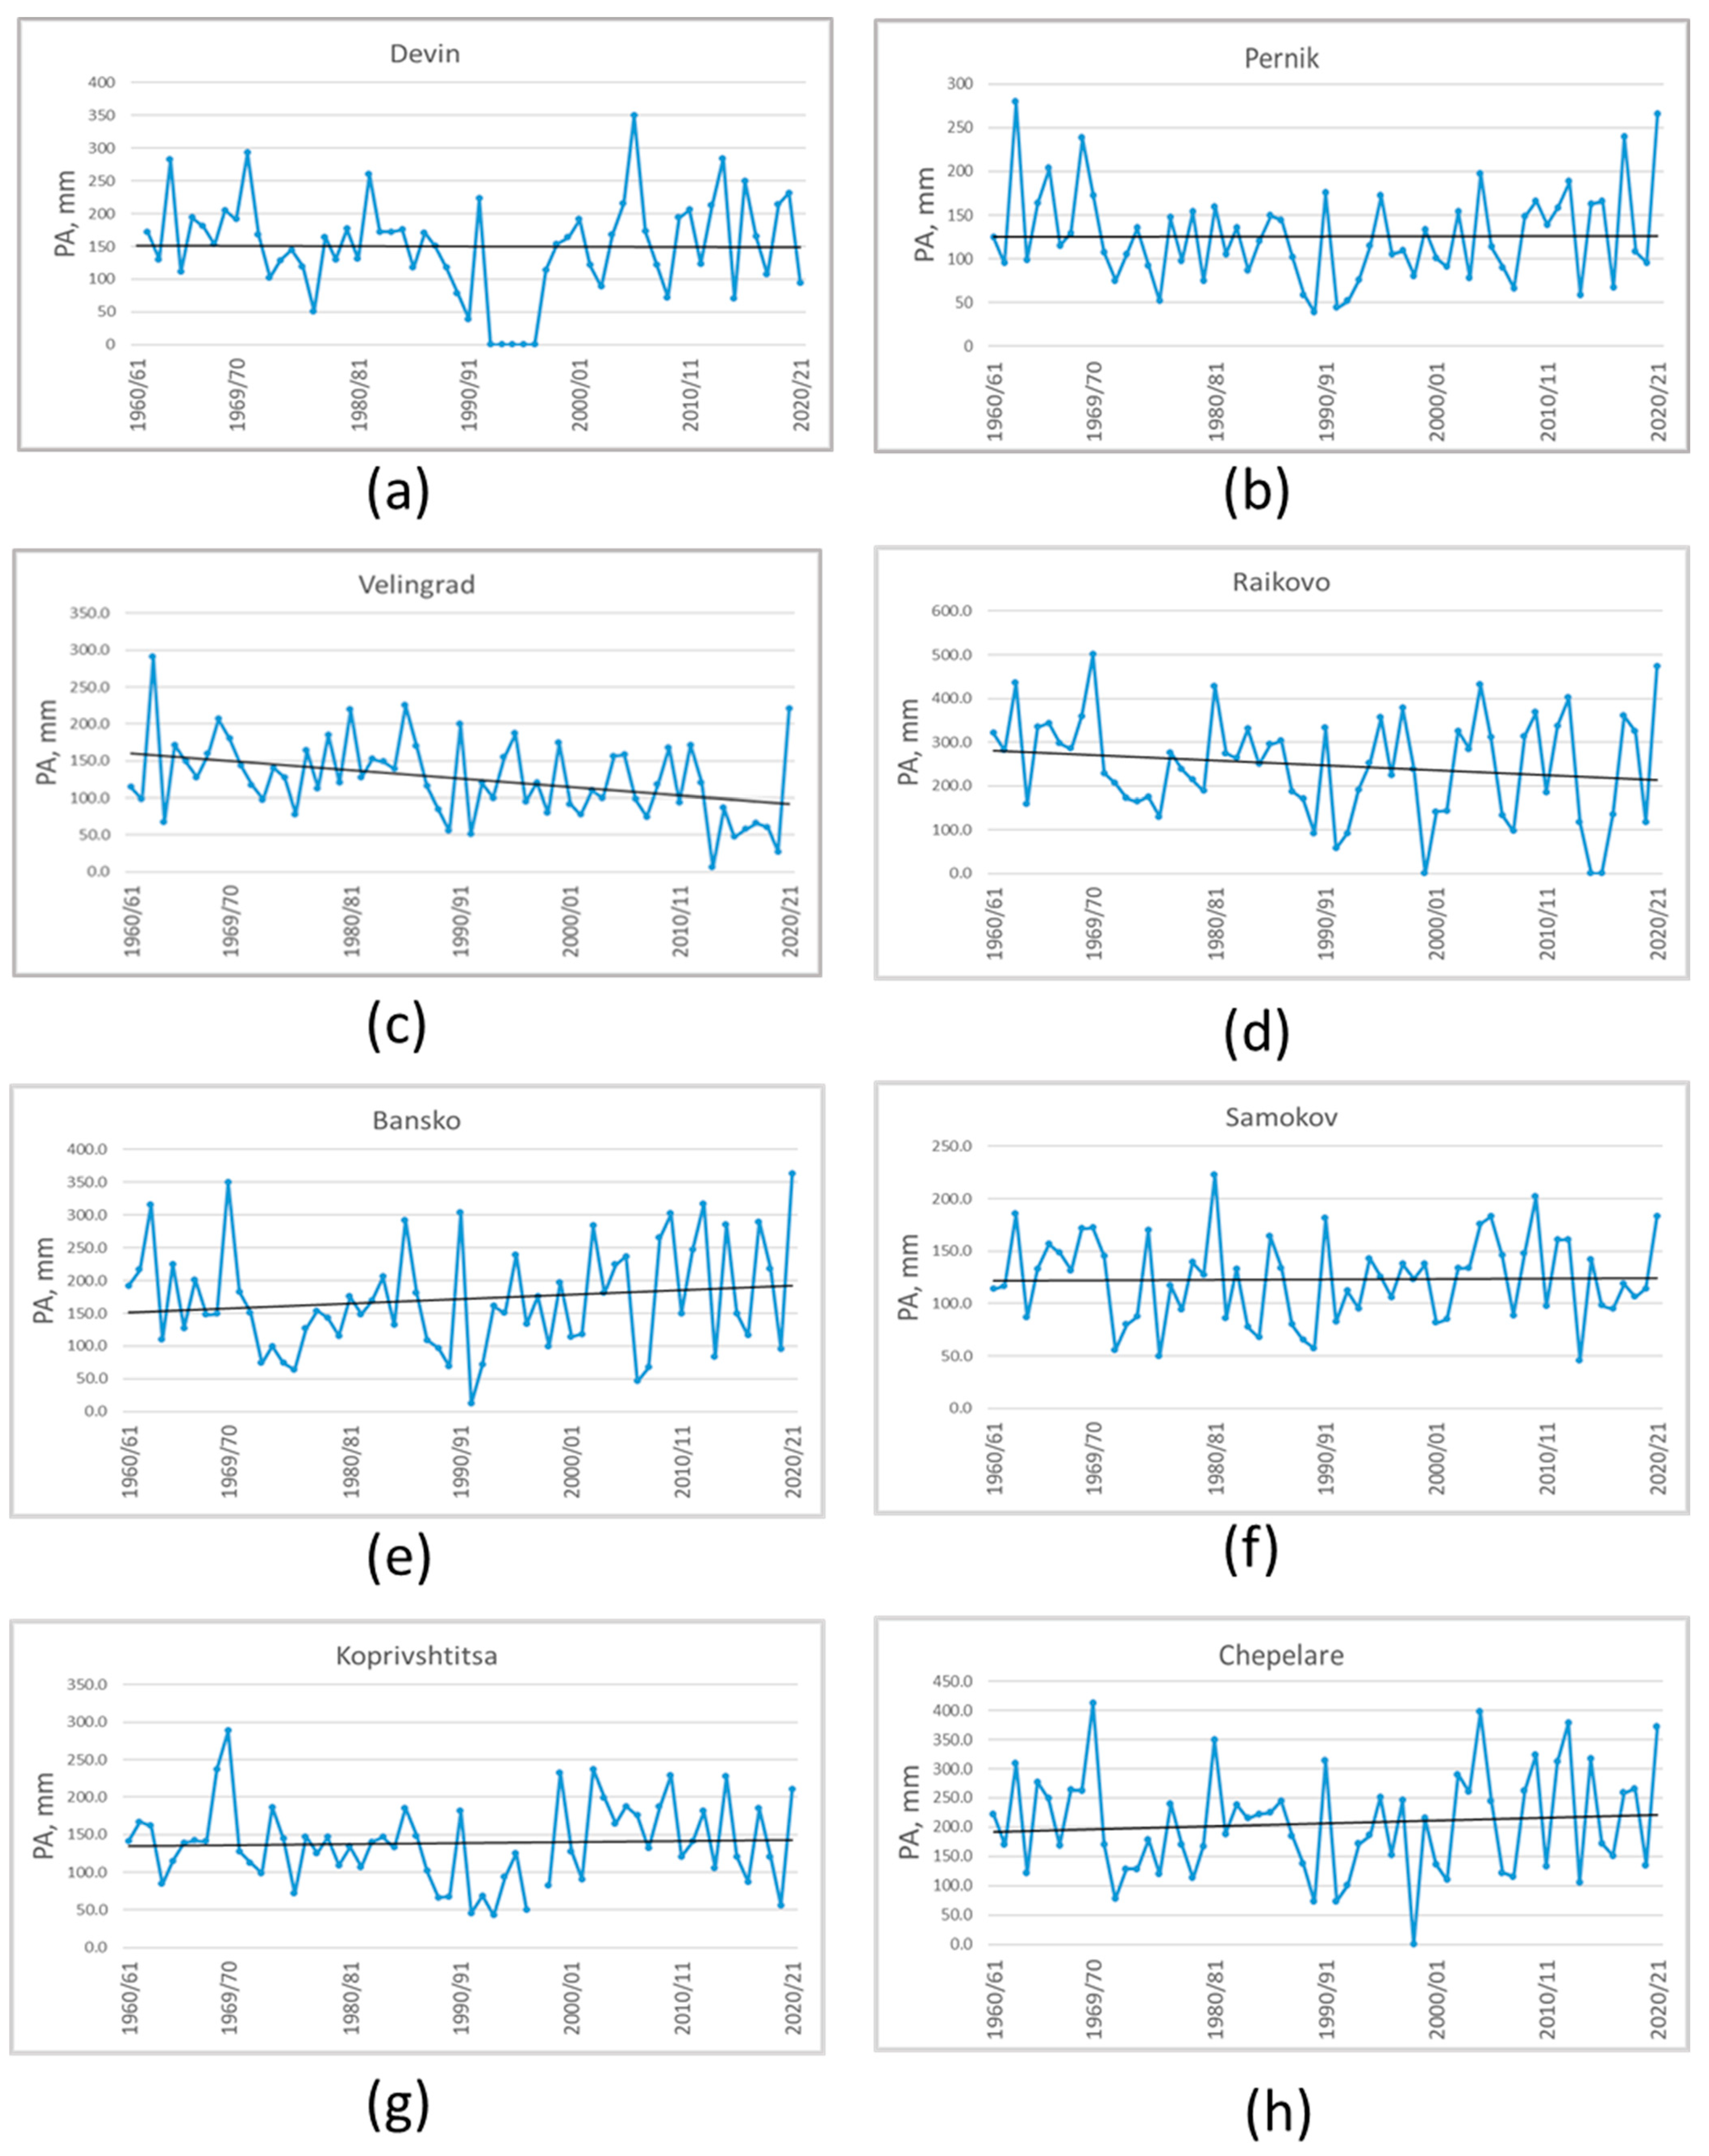
The graphical results of the time series for the winter (December–February) precipitation amounts for 24 of the investigated stations are provided in the next three figures, Figure 6, Figure 7 and Figure 8.
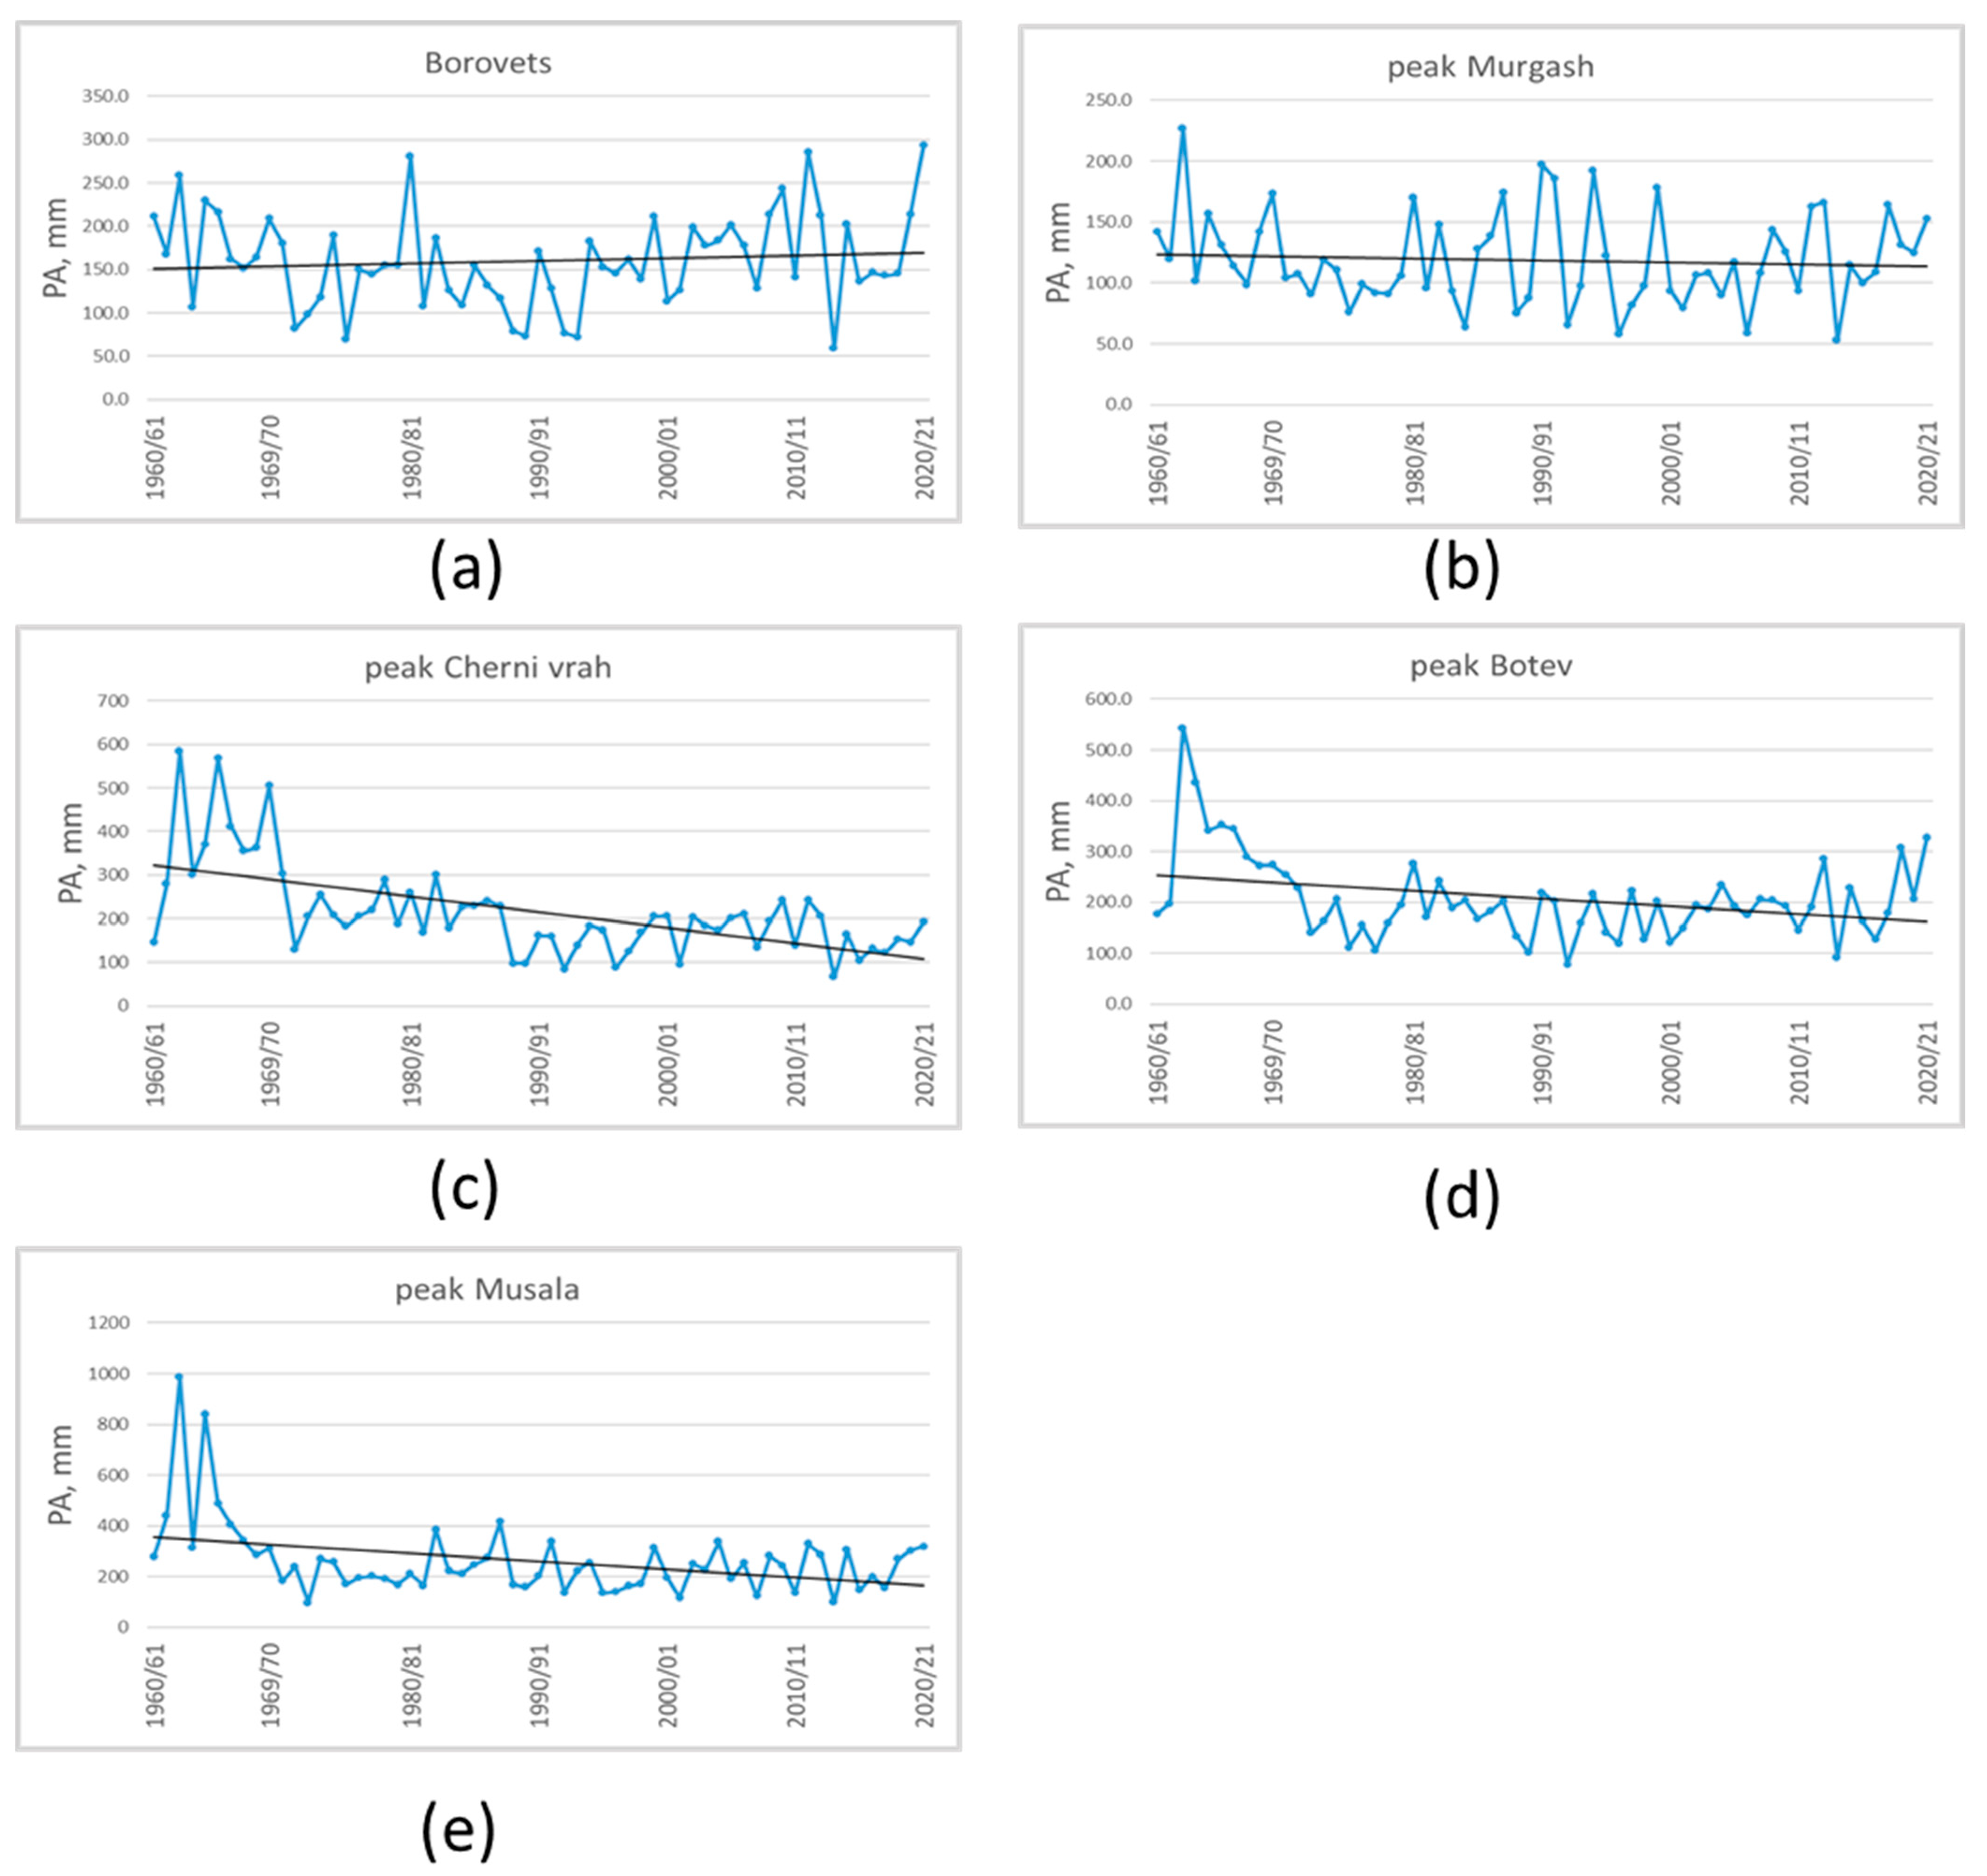
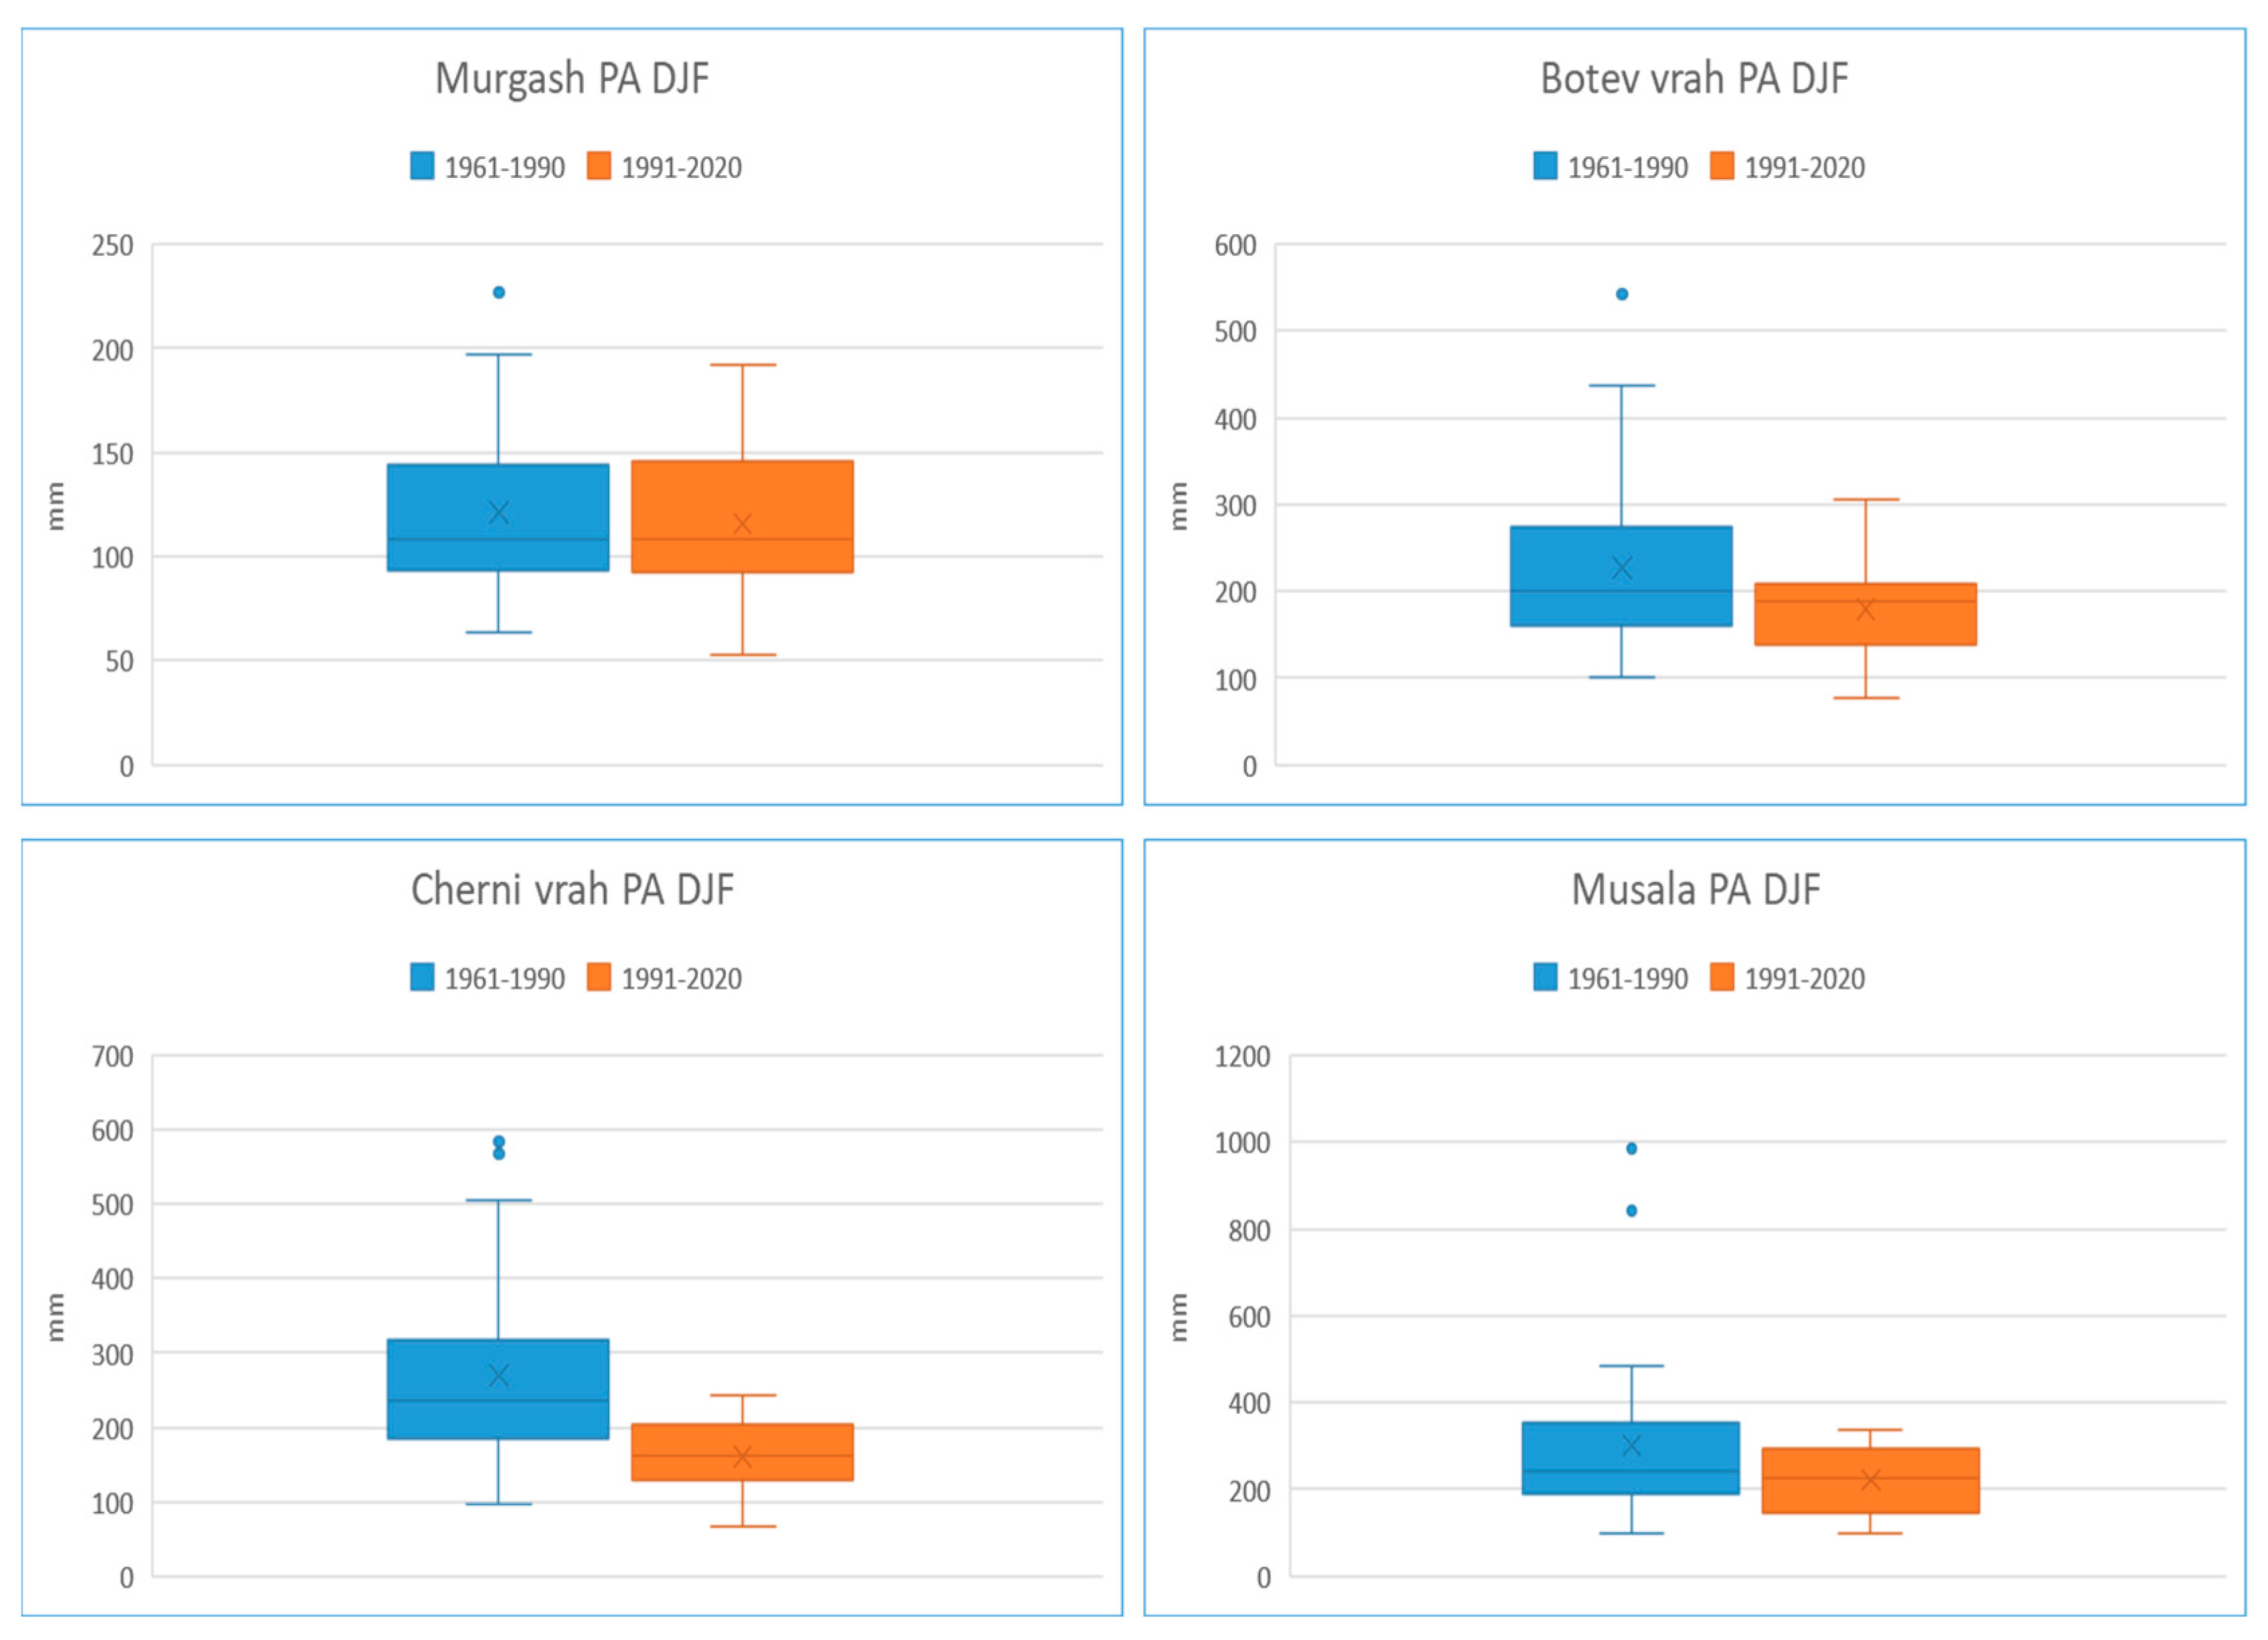
Significant upward trends in PAs at a significance level of 0.05 are demonstrated for stations Bansko and Samokov, and downward trends are outlined in the graphs for Velingrad and the top three stations: Cherni vrah, Botev, and Musala. However, station Velingrad needs more attention because its trend distinguishes between the others in the Rhodopes. In the rest of the stations, the seasonal change in winter PAs is generally undefined, but again, in many of them, an upward change point or weak rising tendency is possible after the 1990s, e.g., at Divlja, Radomir, Zlatits, Dragoman, Tran, Radomir, Separeva Banja, Koprivshtits, Chepelare, and Borovets. The significant decrease in winter PAs for the highest station (see also Figure 9) is notable and requires further investigation in these alpine regions.

3.1.3. Winter Mean Air Temperatures (Tmean)

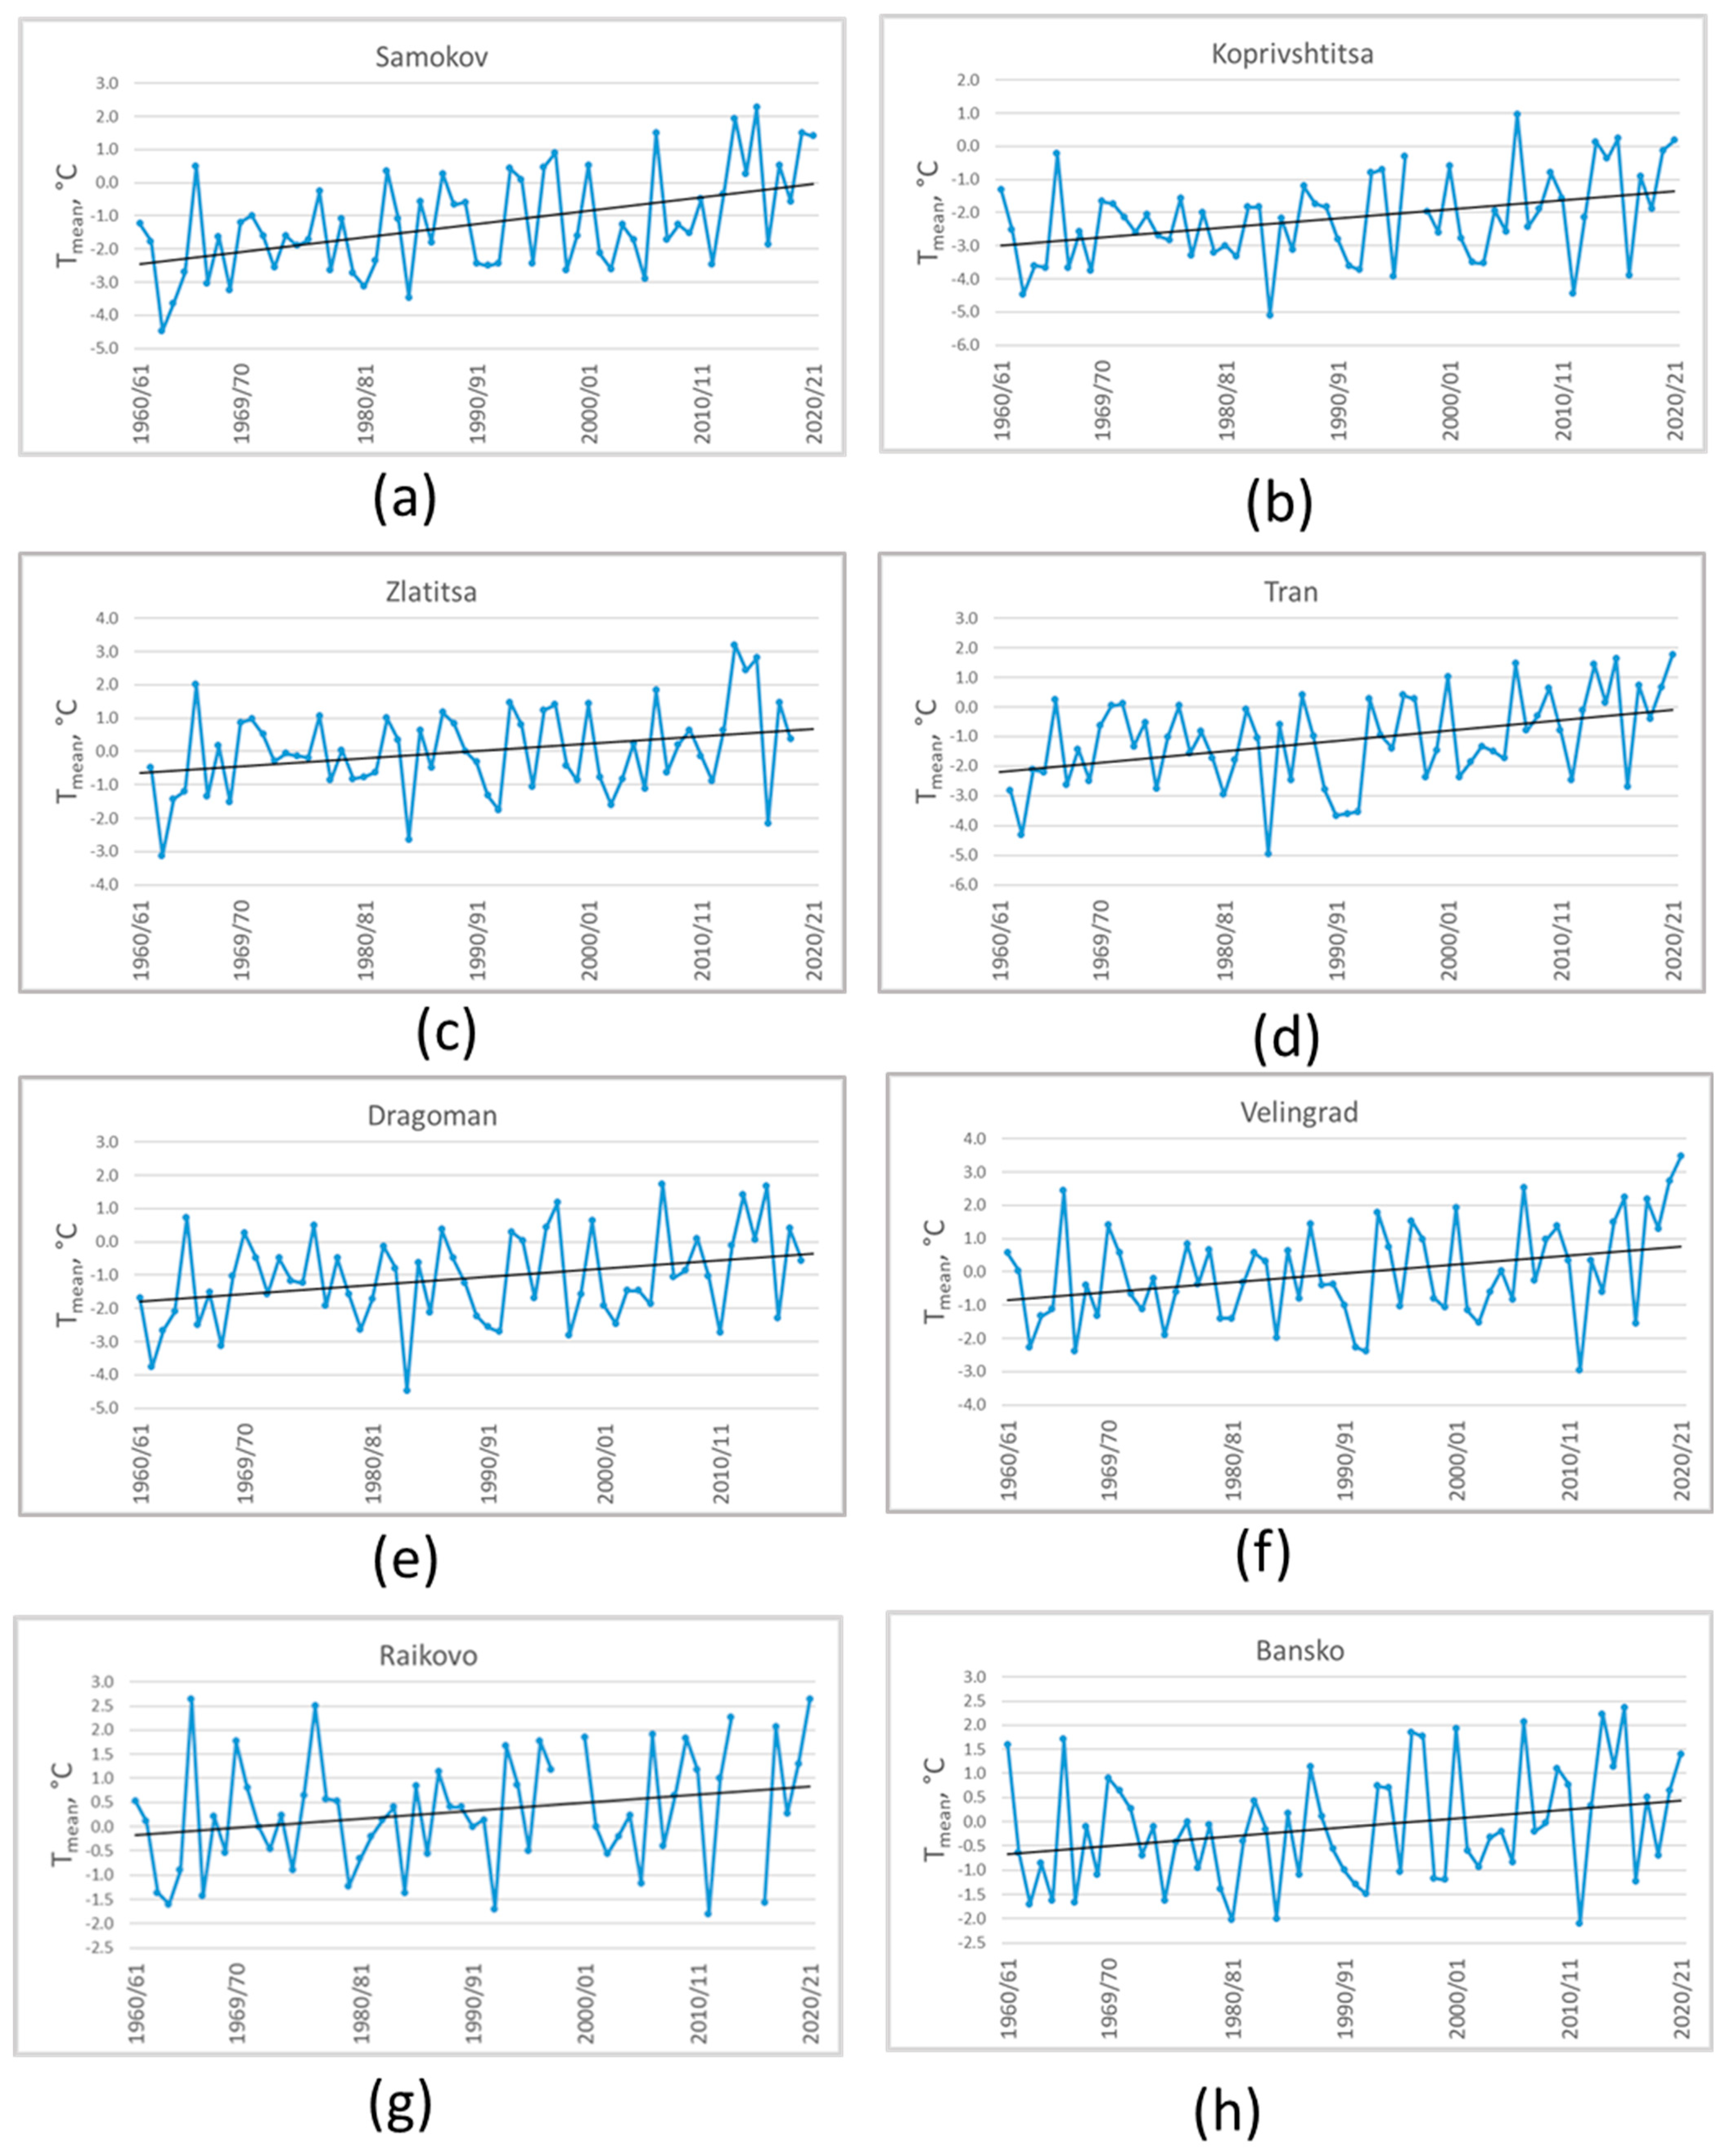
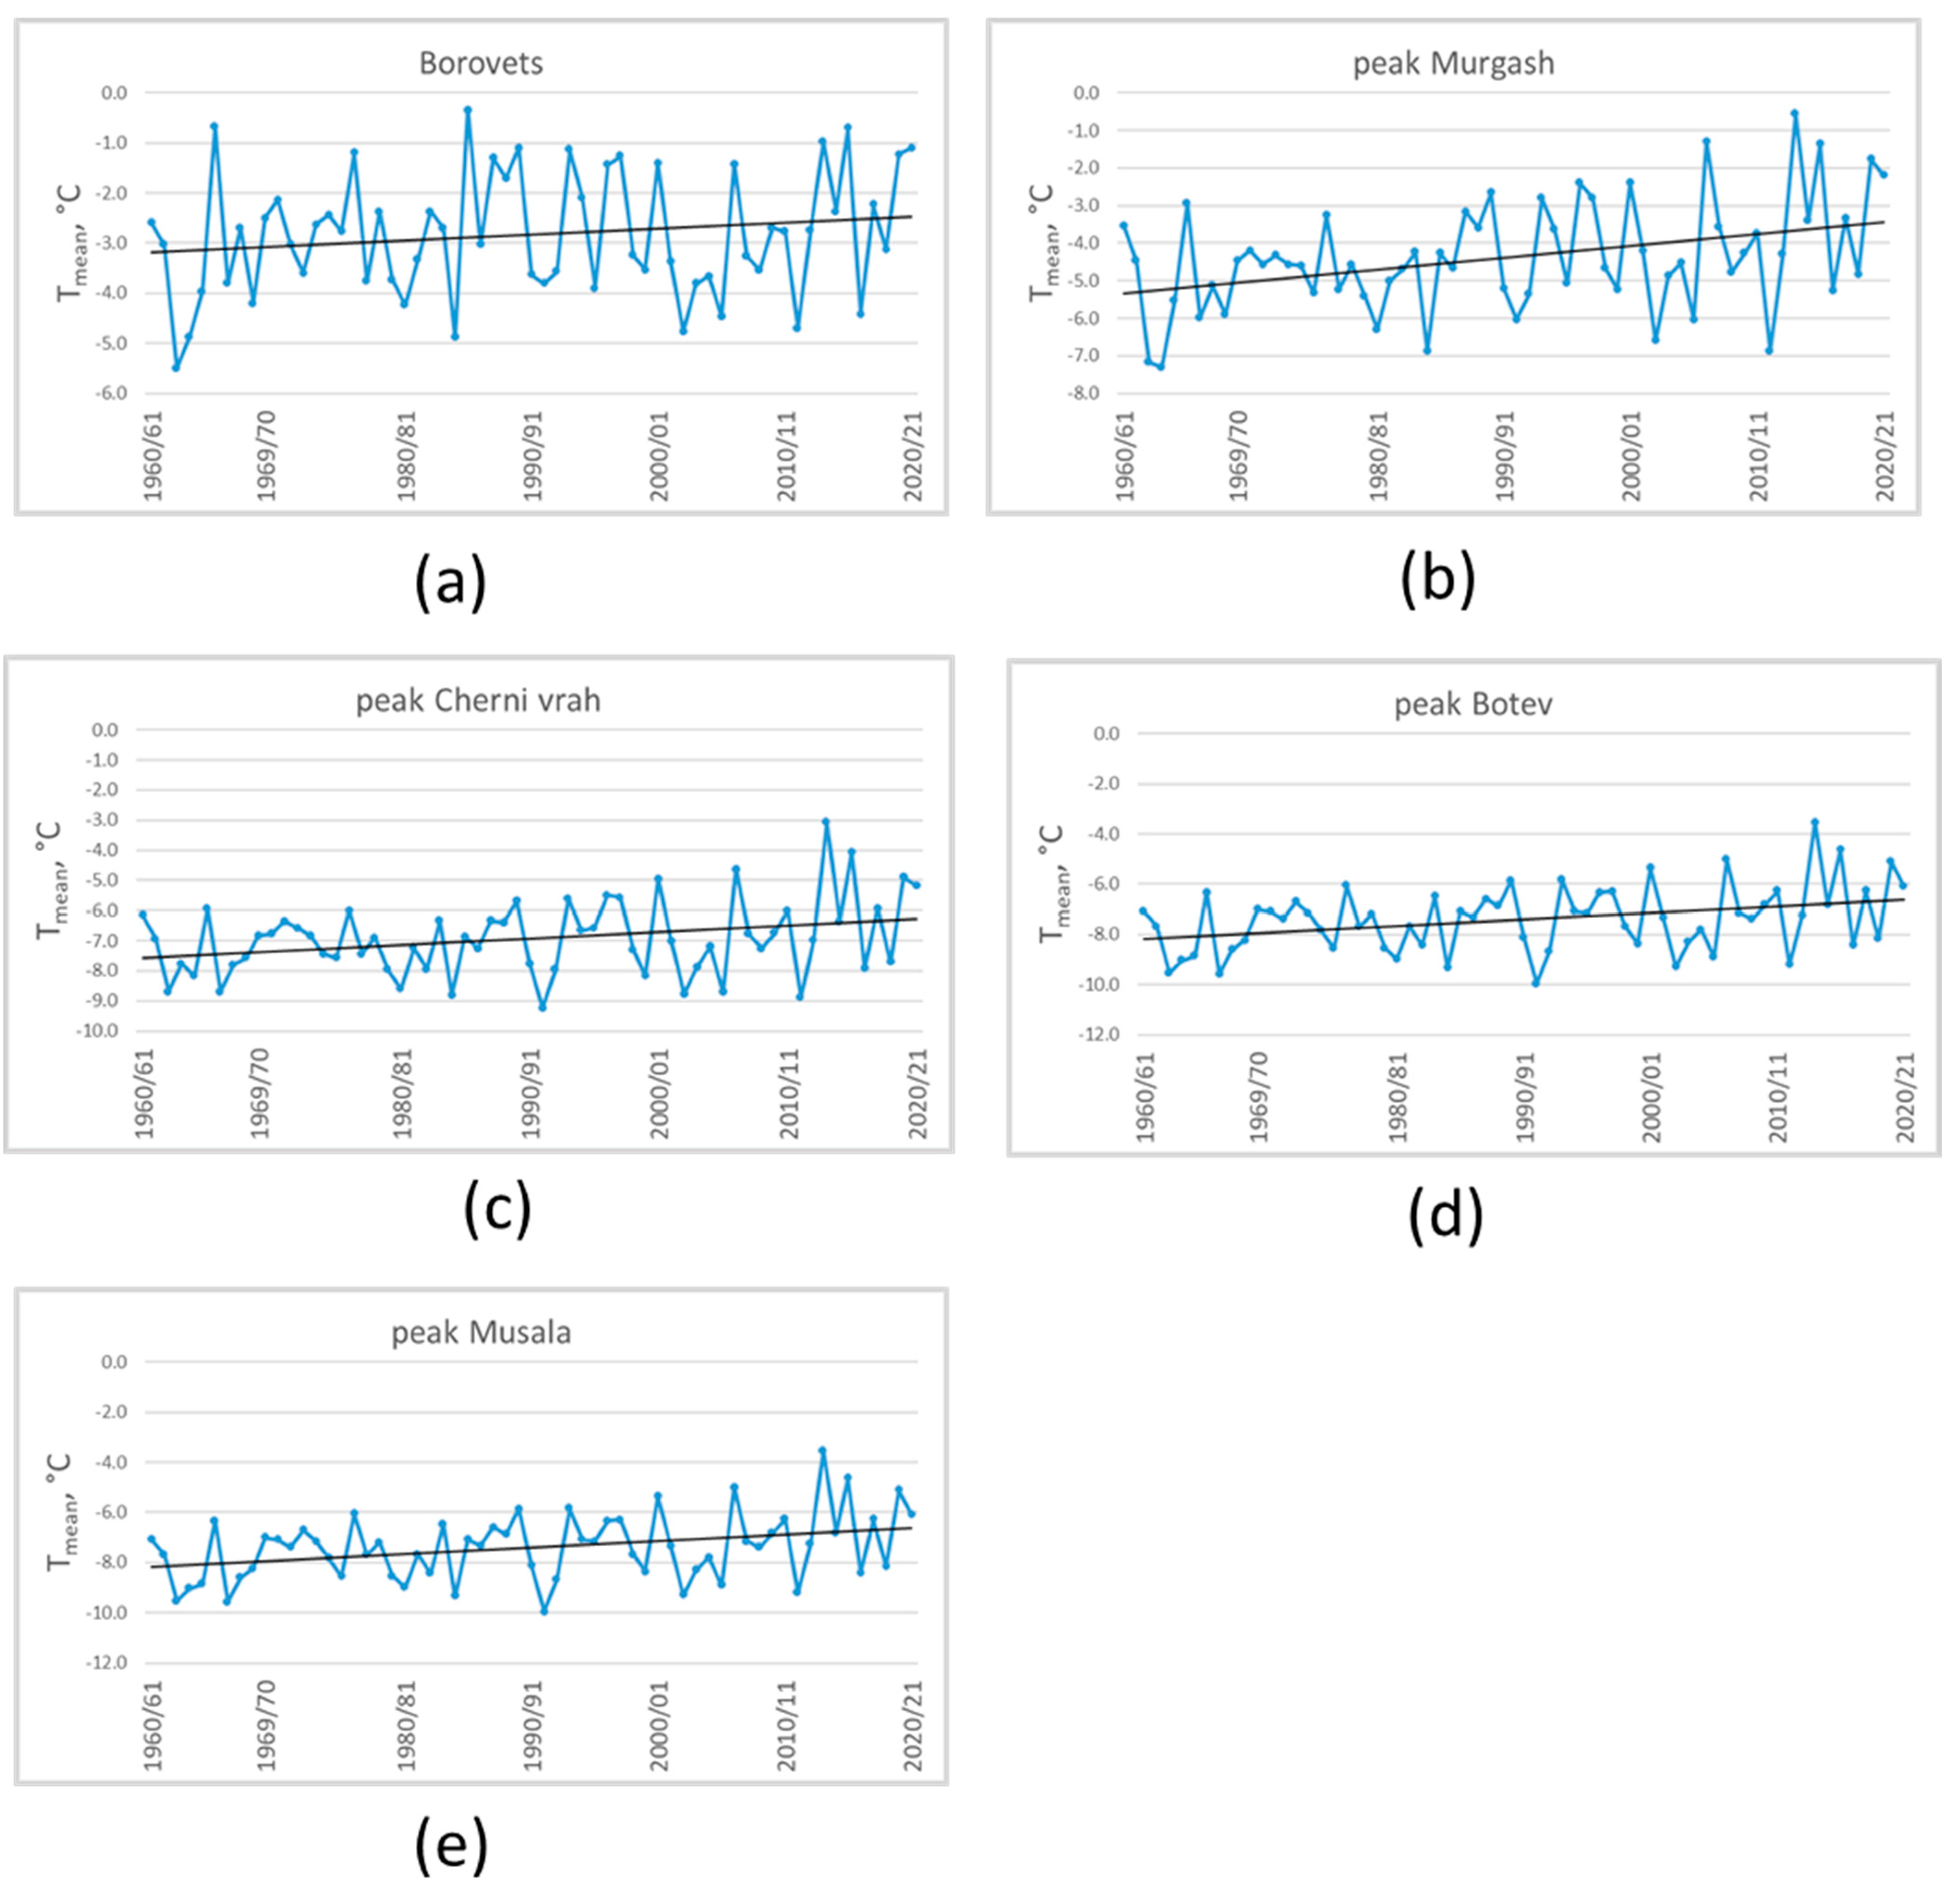
The results of the trend analysis for the mean winter air temperature from the stations with available data are presented in figures Figure 10, Figure 11 and Figure 12. In contrast to the other investigated characteristics, clear and monodirectional upward trends can be observed in almost all of them (15 out of 19 stations), and for 12 of them, the rise in the temperature is significant. Obviously, this increase is caused by the general tendency of warming. Only the Divlia, Pernik, Hvoina, and Chepelare (not depicted) regions show no distinguishable positive trends, although the last two indicate signs of nonlinear changes and a later increase after 1990. However, these differences are locally determined, probably because of the influence of the relief.
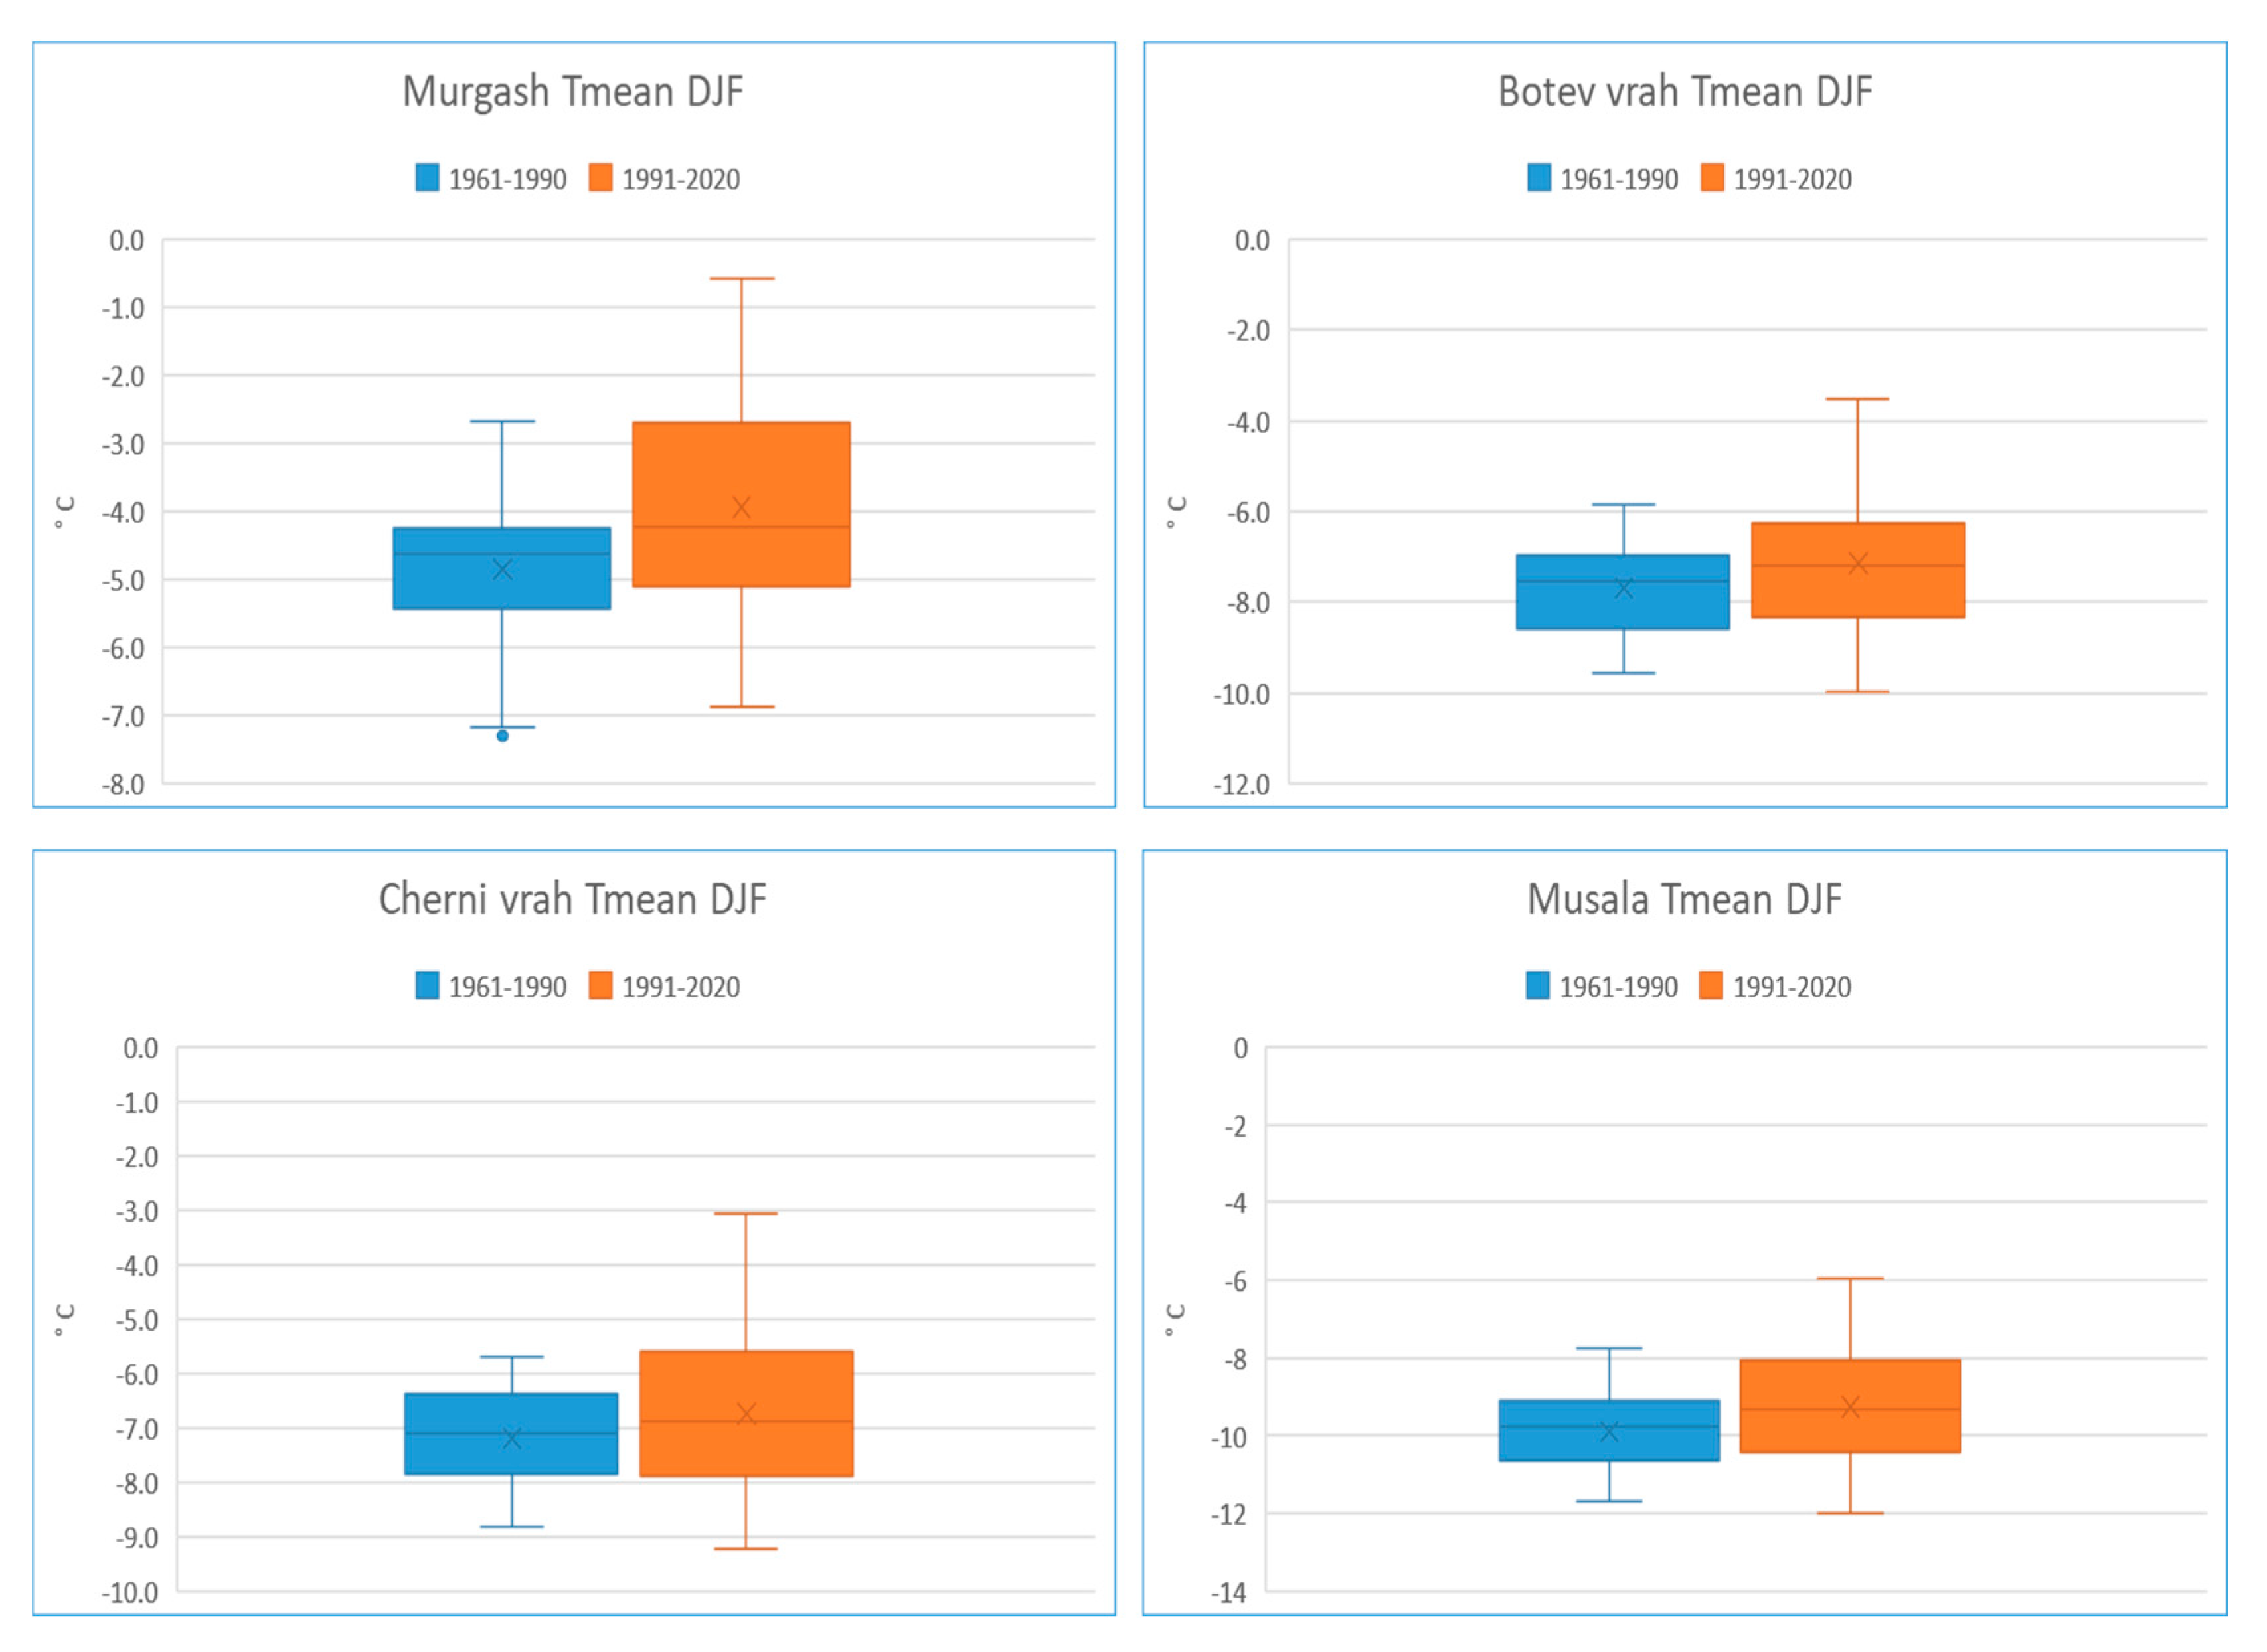
The vertical alteration in the mean air temperature was investigated not only in terms of the average for the winter season but also for each of the winter months separately by comparison of values for the periods—1961–1990 and 1991–2020. The results are summarized in Table 2. It can be seen that except for the mentioned stations above, all other differences are positive, with the strongest temperature rise at altitudes about 1000–1100 m for the seasonal data and some separate locations below this altitude in the separate months. It is also remarkable that the greatest warming happens in the coldest months—January and February—and with wider altitude range, from 700 up to 1700 (peak Murgash). The highest regions are also affected by winter warming, and this is presented in Figure 13 as a comparison of Tmean for both climatic periods.
Finally, we have summarized all results from the Mann–Kendal trend analysis in Table 3.

3.2. Pettitt’s Test and LOWESS

Due to nonlinearities encountered in some of the time series, we decided to try additional approaches, which could help in handling such data. We chose Pettitt’s test to determine change points in the investigated variables and the local regression and LOWESS for a better fit to the data. We tested the three winter variables from all stations with Pettitt’s test. LOWESS was applied only to the precipitation amounts for each of the winter months for the four highest stations, and therefore, the results are only preliminary, and we present some of them here mainly to illustrate the use of such methods.
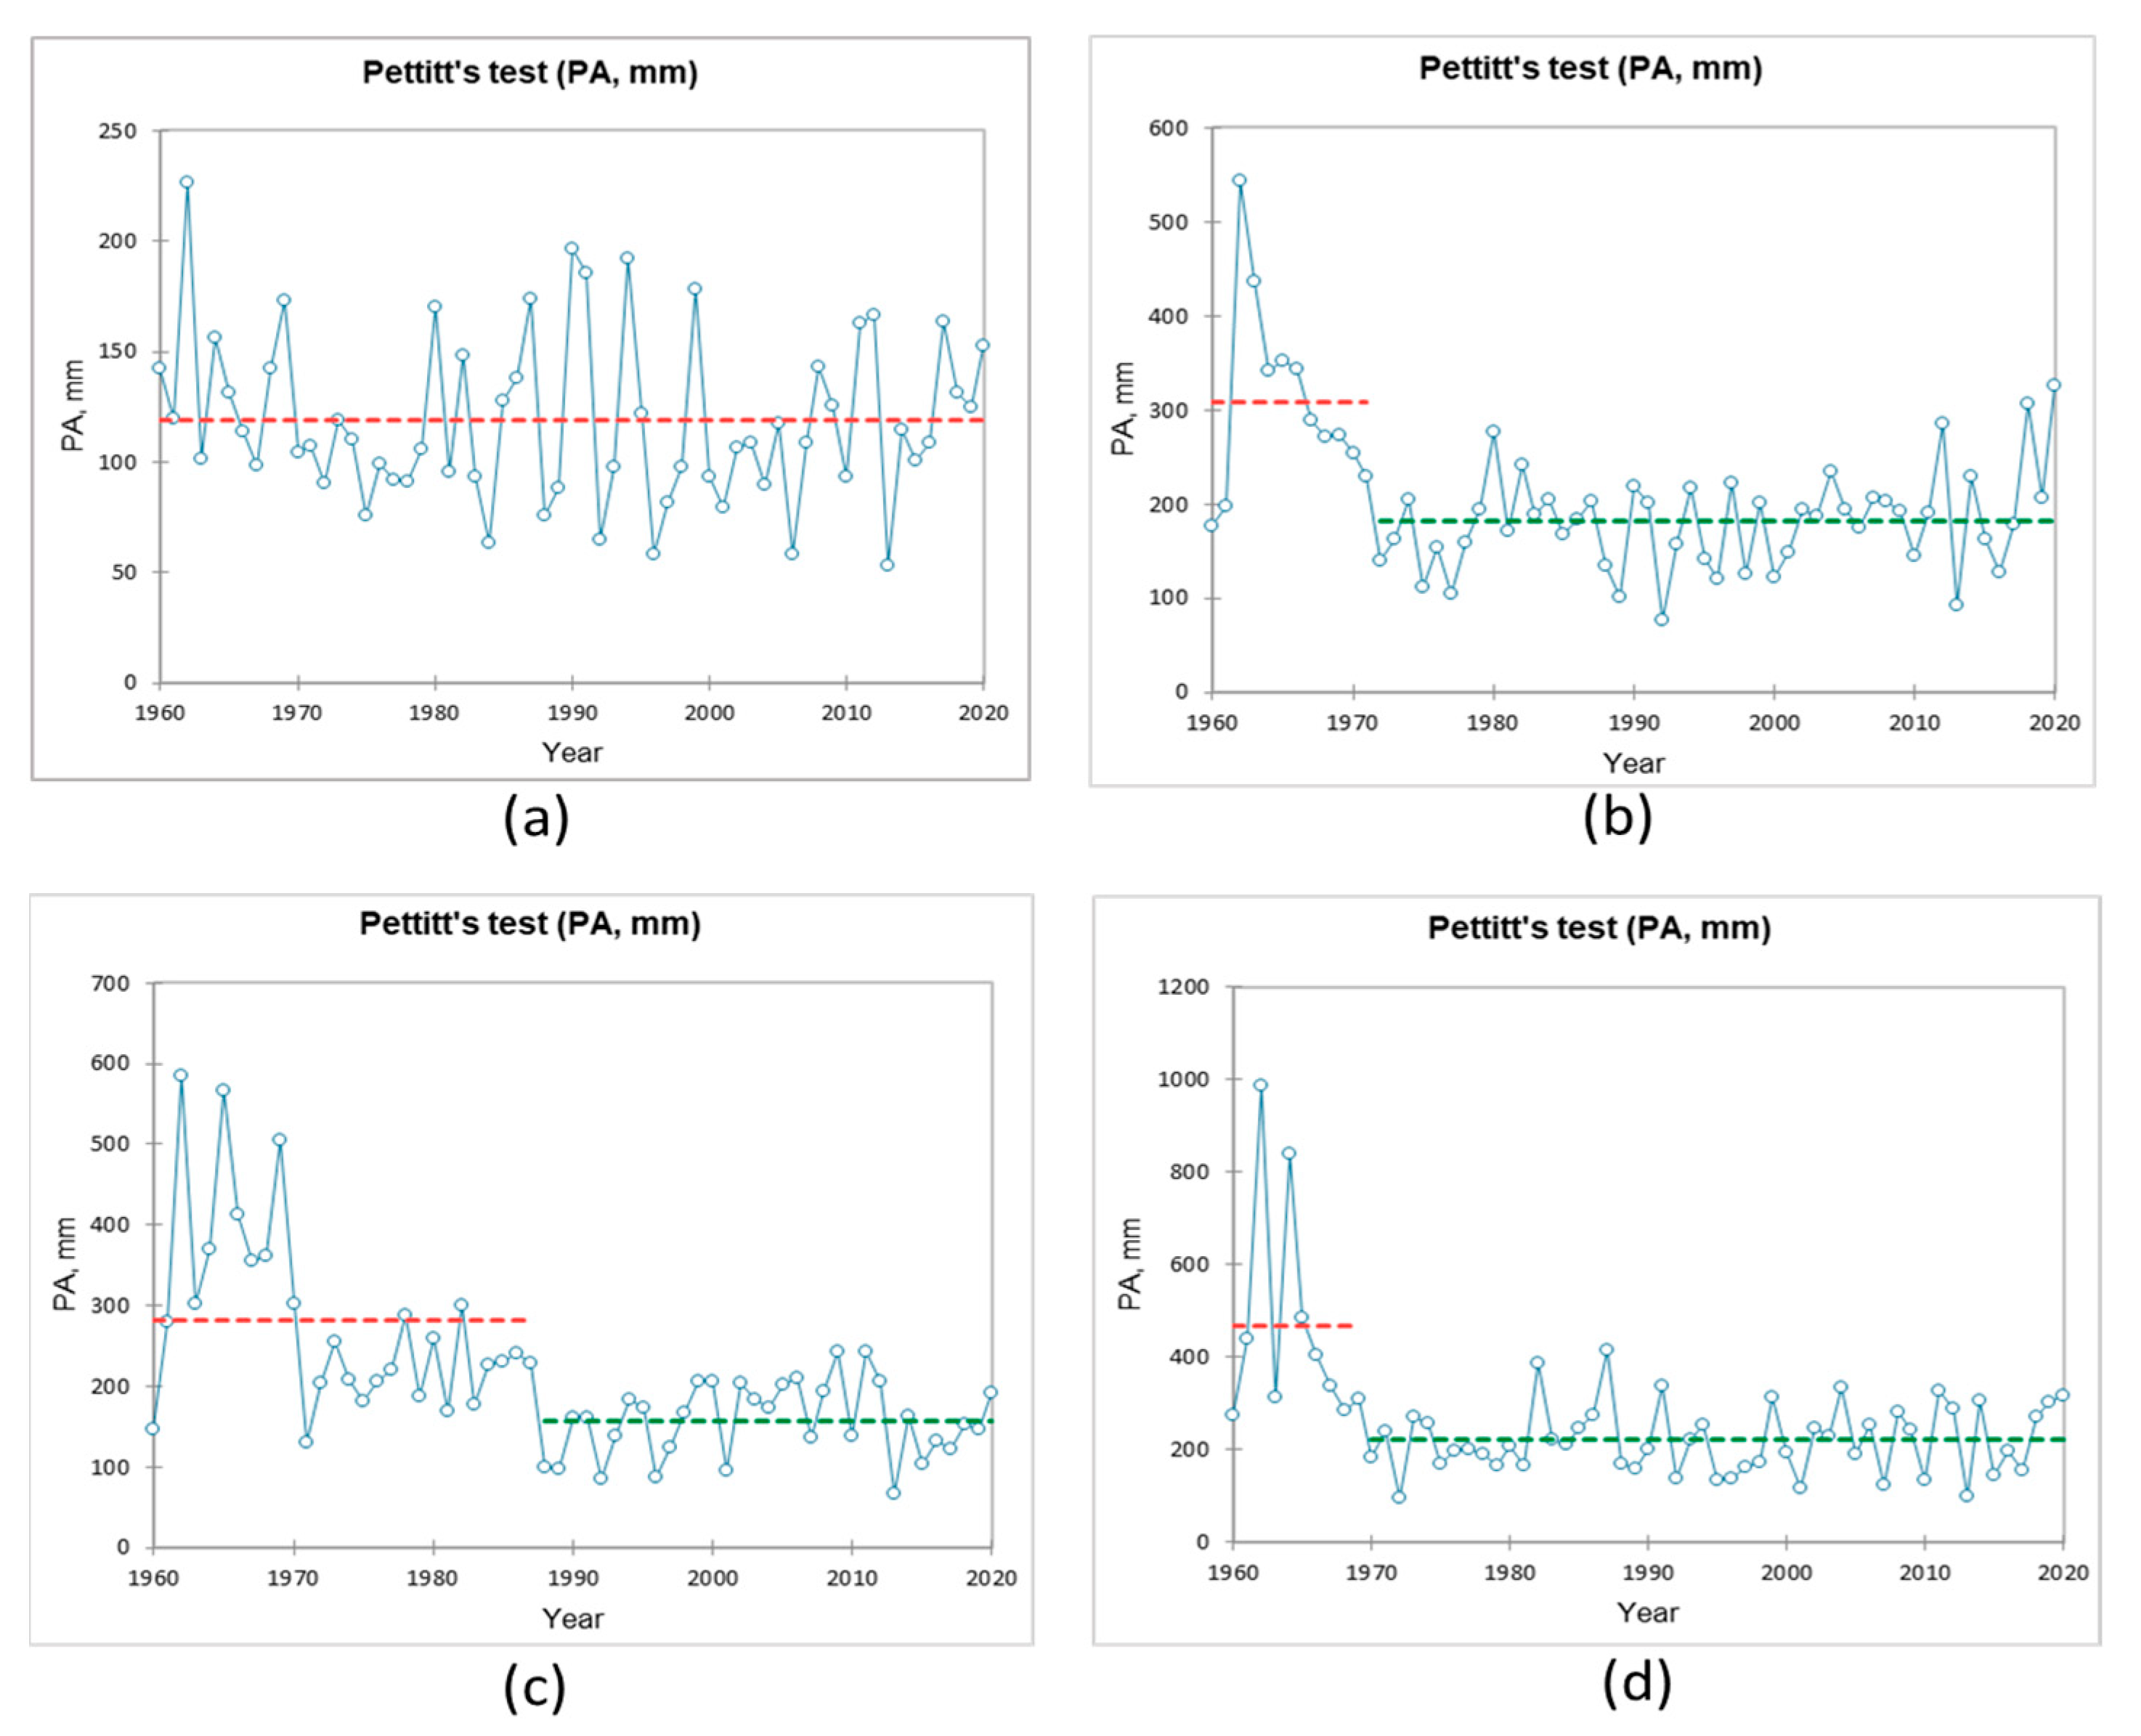
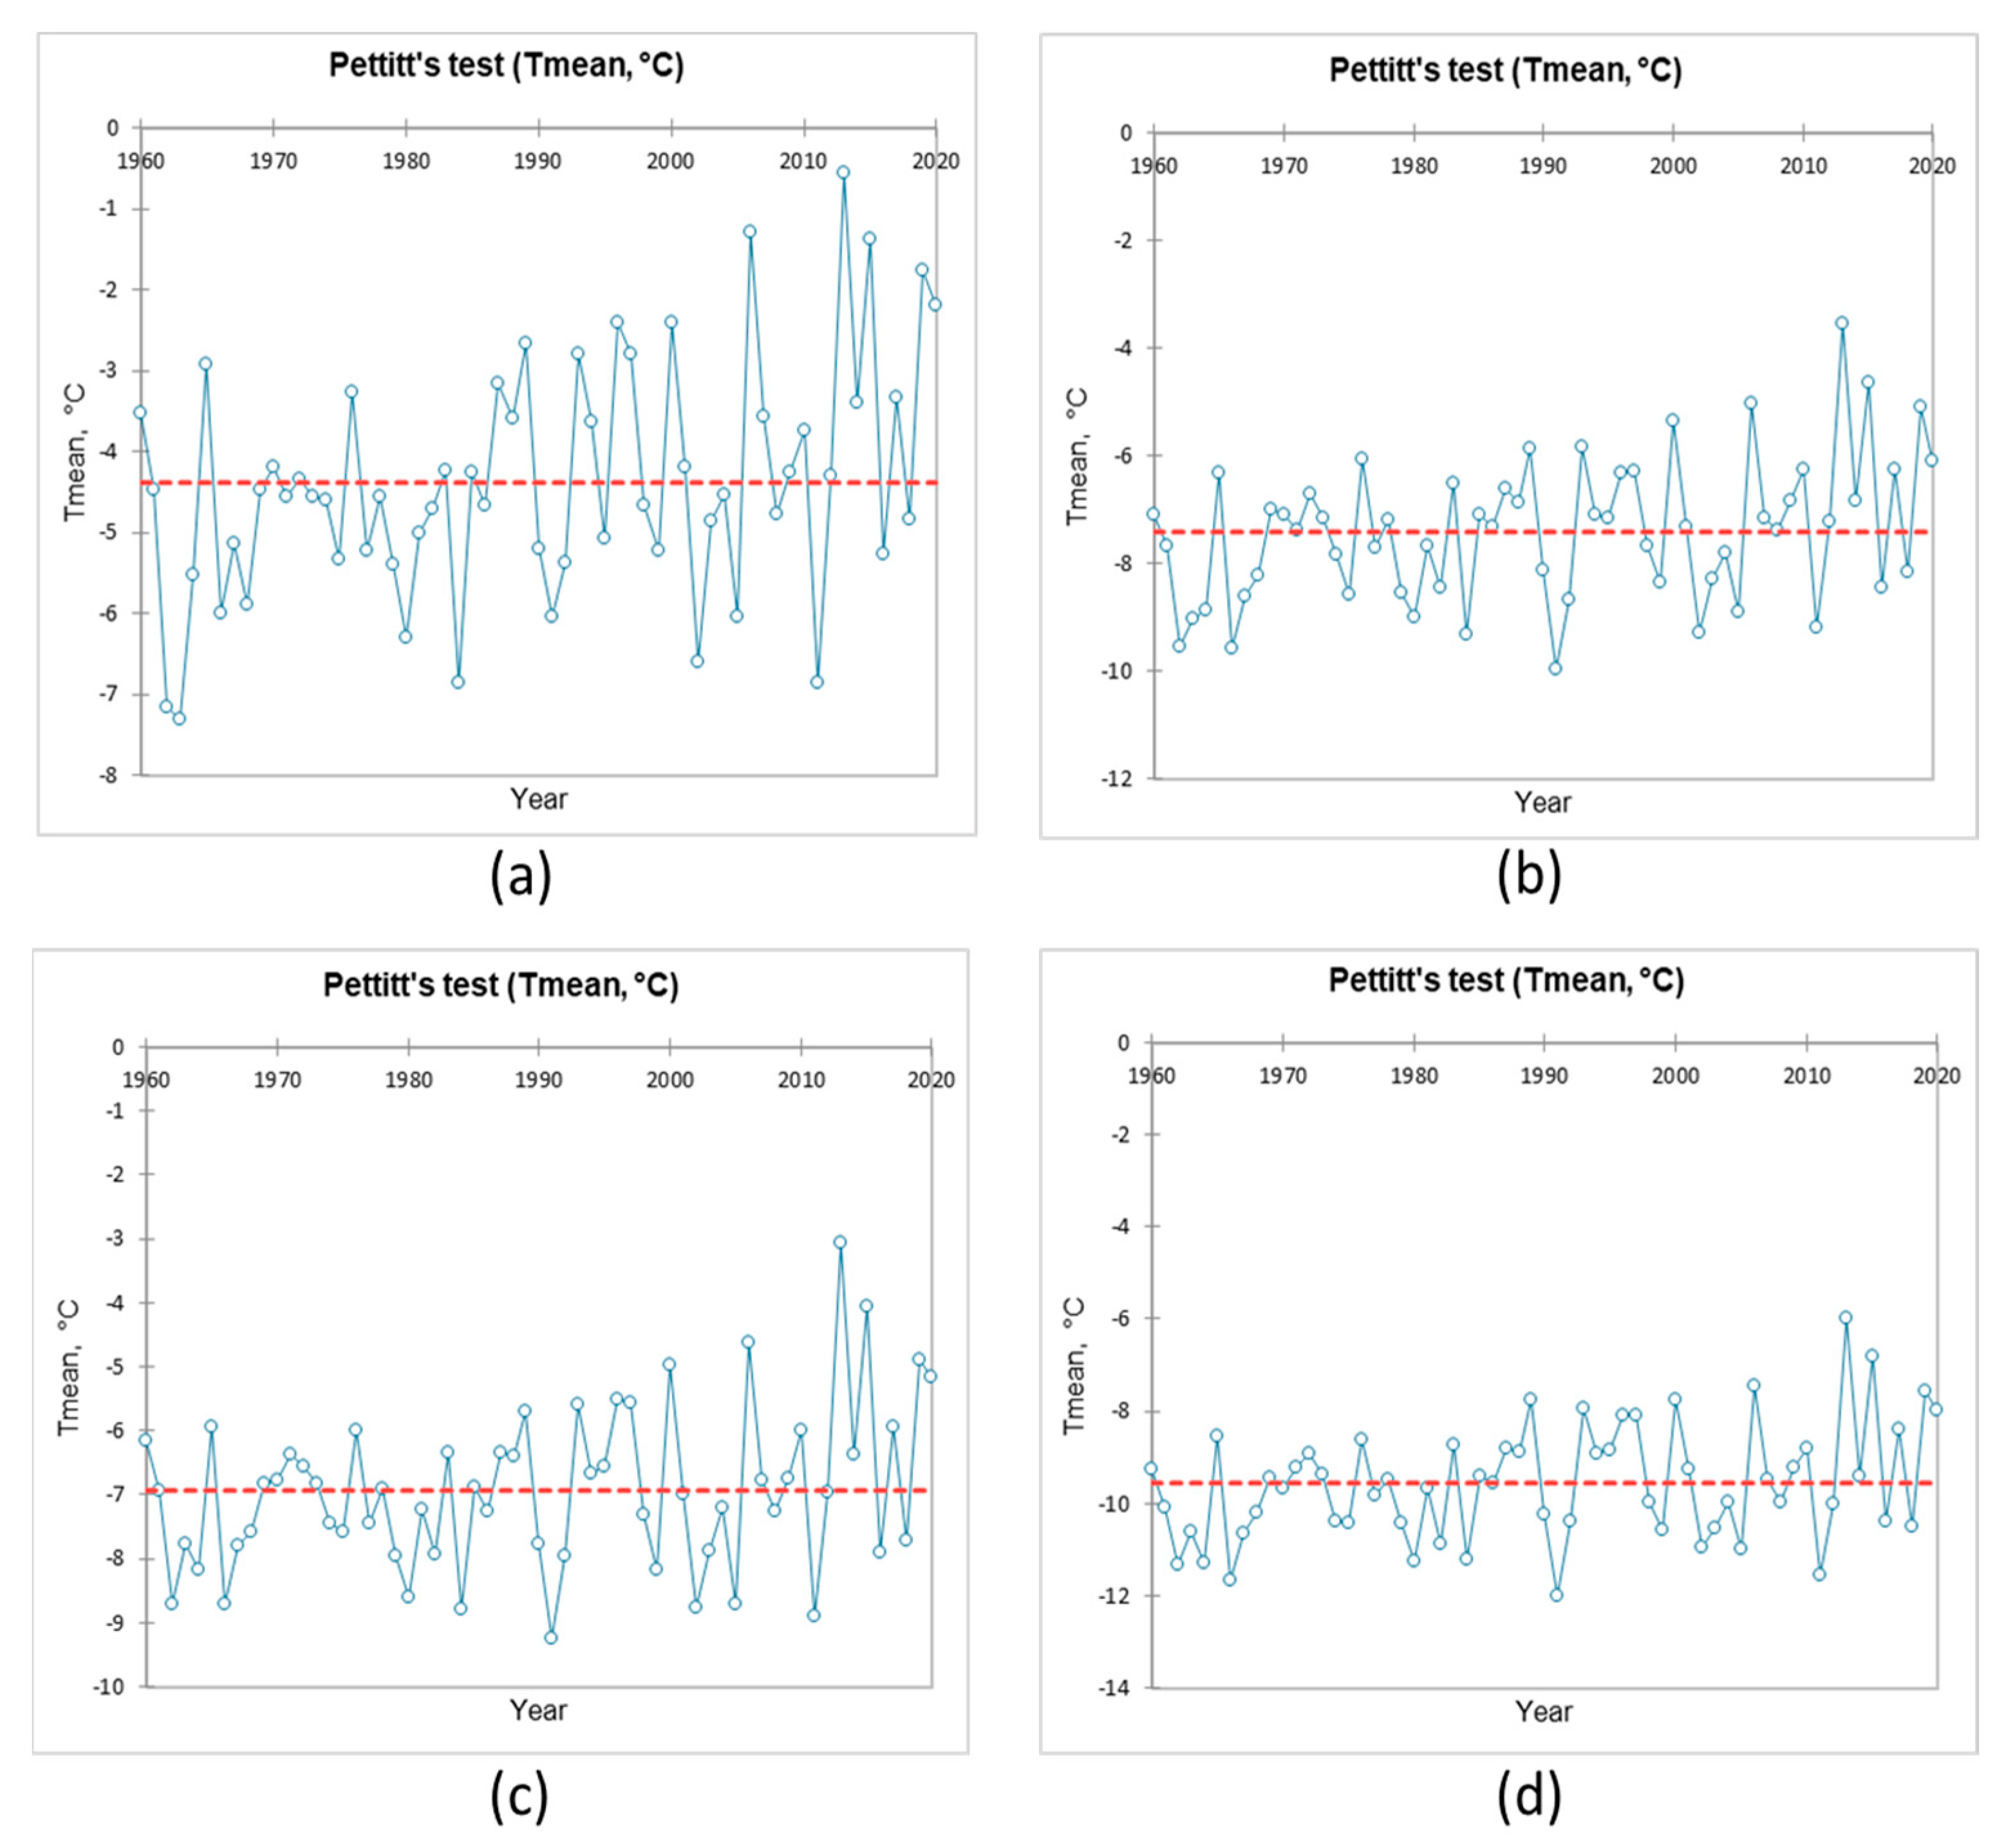
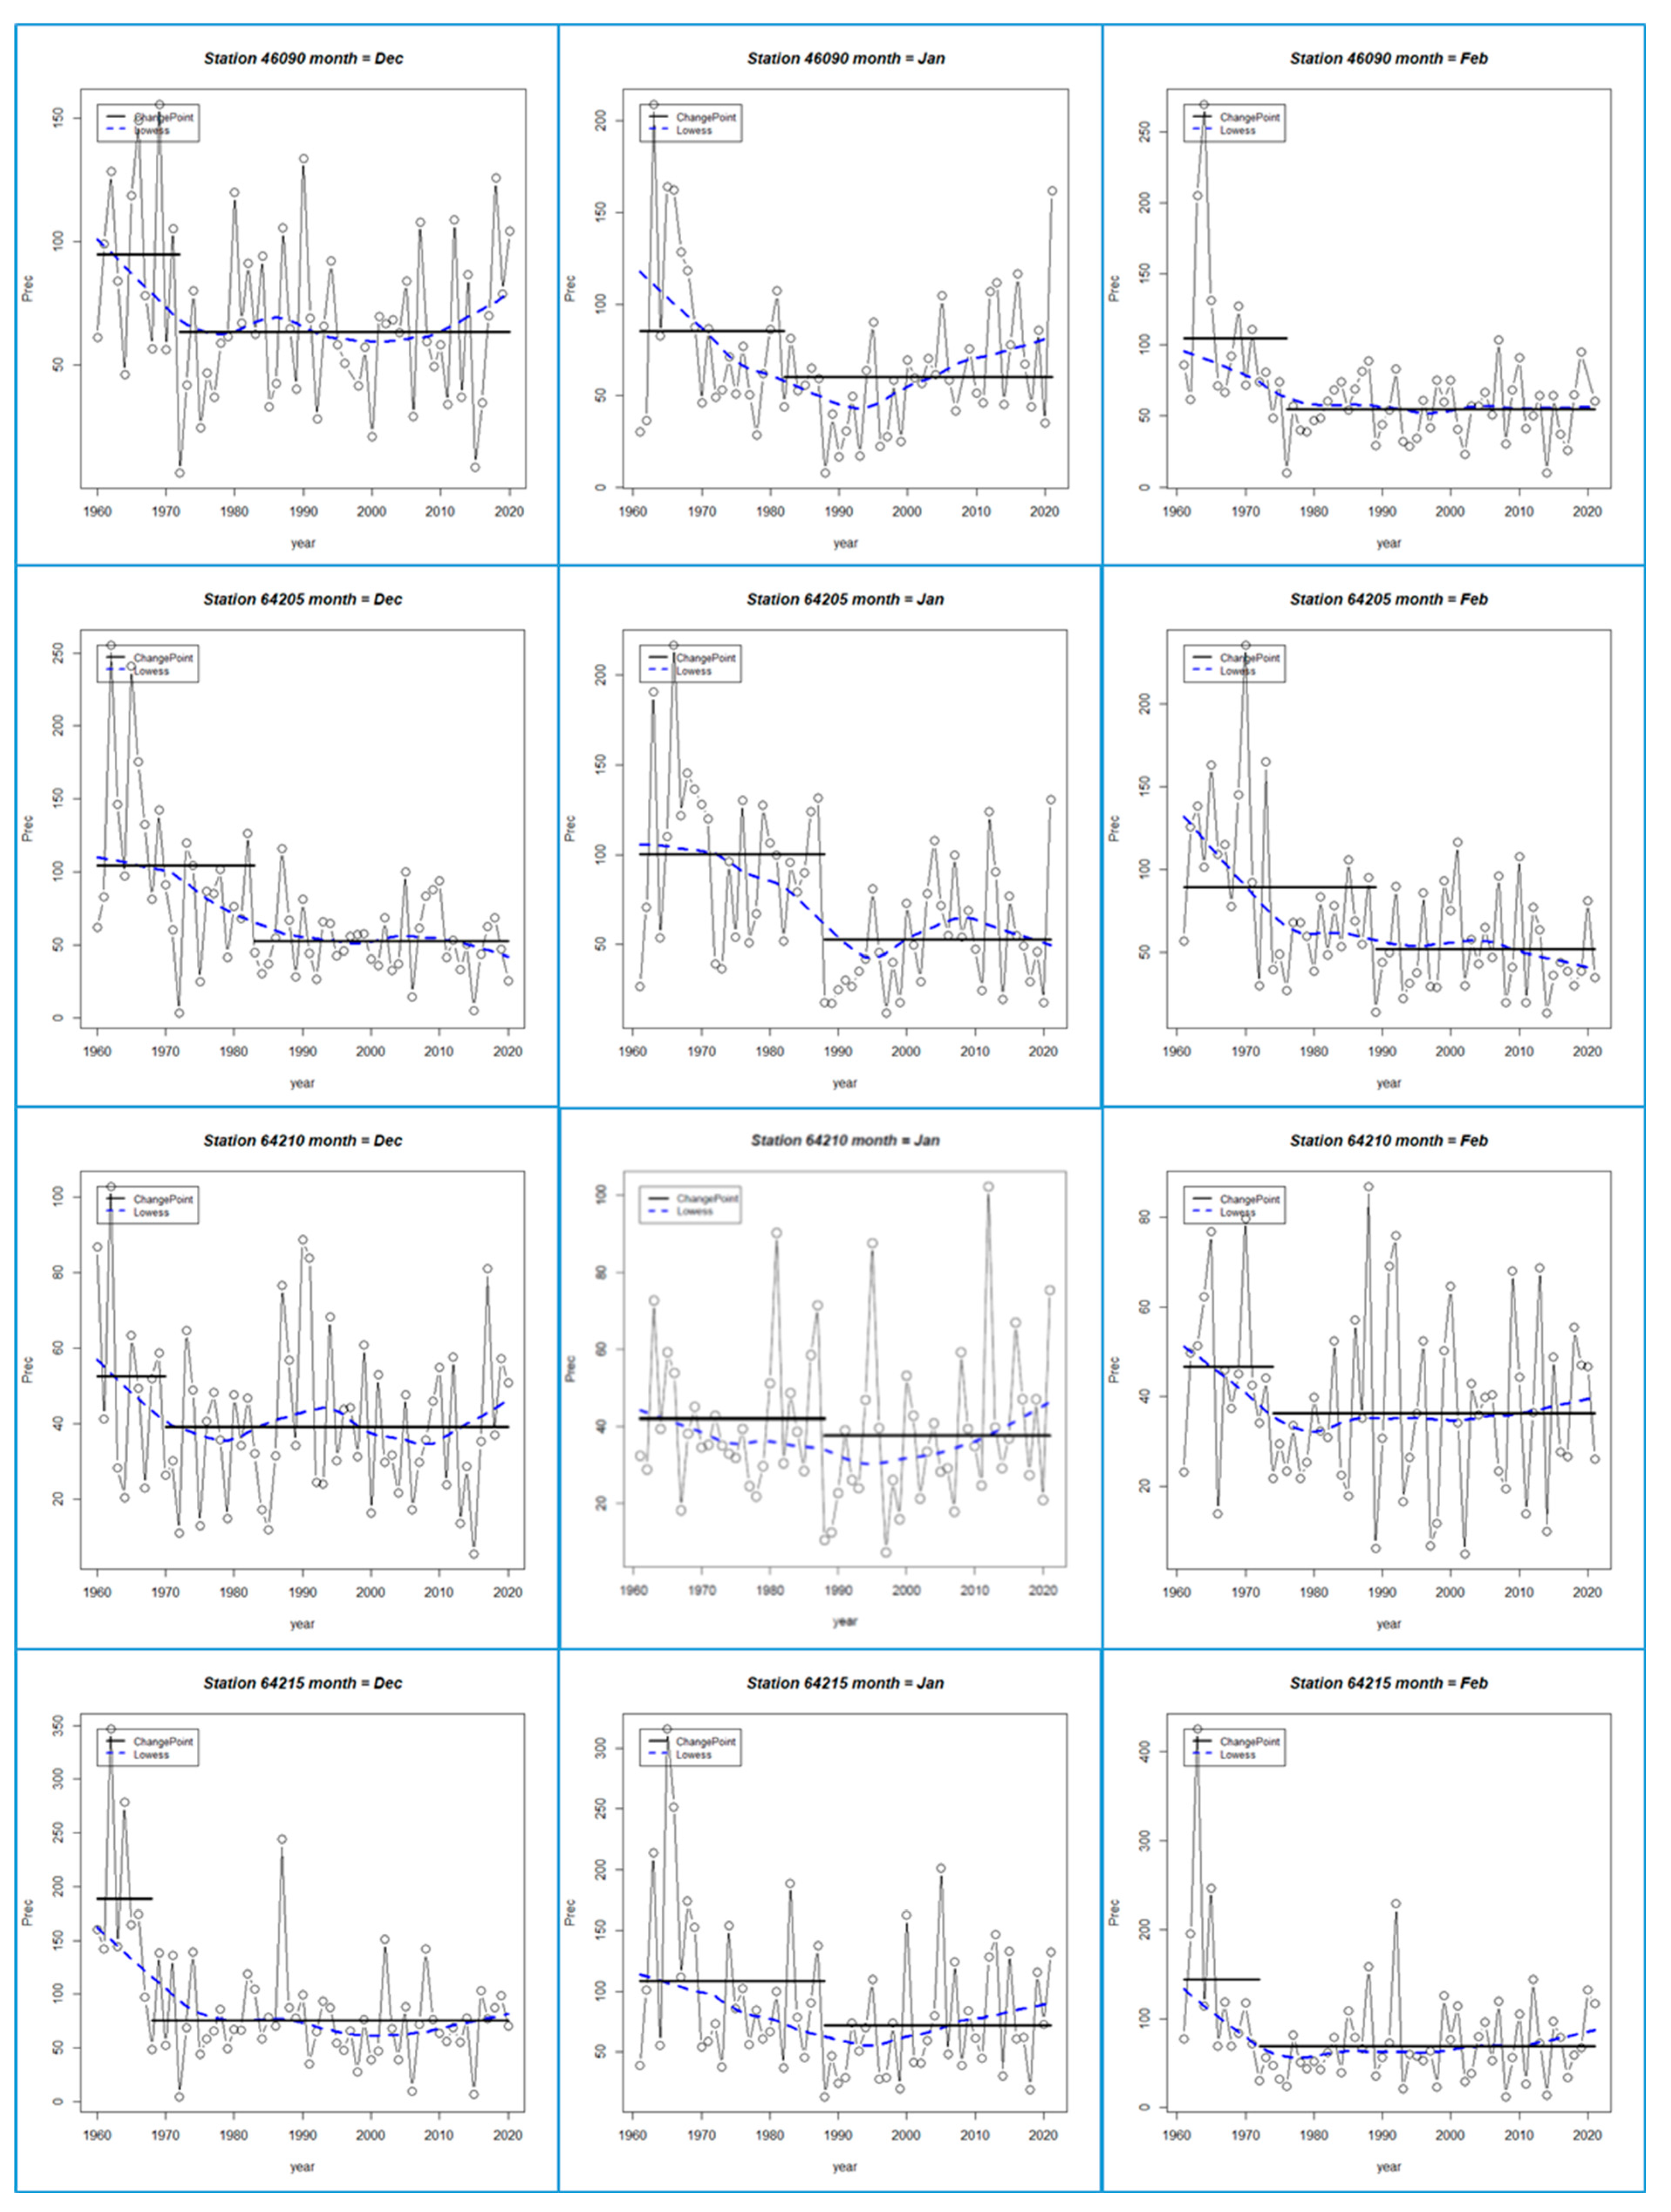
The use of Pettitt’s test revealed 11 data sets with possible change points. Most of them concerned the seasonal snow cover maximums and the precipitation amounts. The graphical results of the test from the highest stations are presented in the next three figures Figure 14, Figure 15 and Figure 16, and the quantitative results are summarized in Table 4. At station Murgash, no change points were detected in all investigated winter variables. Botev peak and Cherni Vrah only demonstrated one change point each in Hmax and PA, as well as Musala for the PA. No change points for Tmean were detected. Only station Cherni Vrah possessed change points in PA in each winter month (Figure 17)—December 1983, January 1988, and February 1989—probably because of this station’s exposure to advections from Atlantic cyclones, not only Mediterranean ones. These PA findings show that more investigation into this issue is needed. These greater values at only higher altitudes were probably caused by the orographic enhancement of precipitation during severe winter storms. Otherwise, the correspondence between the precipitation amounts in the top three stations is notable—the coefficients of correlation between them are higher than 0.70 and are significant at a 0.05 level. Another station with a change point in the data is the PA in Velingrad, as mentioned above.
The LOWESS curves confirm the general tendency of decreasing winter precipitation but also reveal some recent increasing signs in January for all stations and also for Botev peak in December.

4. Discussion

The main goal of this study was to update our knowledge of snow cover in our country’s mountains and its primary determining factors: winter air temperatures and precipitation. We had to make up for this knowledge gap because reliable environmental information on these regions is very important for their development, especially when considering global warming tendencies. That said, this large gap in local snow science gave us a significant opportunity to comprehensively investigate a wide time interval, allowing us to make better assessments of any possible trends and compare two climatic periods: 1961–1990 and 1991–2020. One common and intuitive expectation would be disappearing, or at least decreasing, snow and rising temperatures. Our findings confirmed only the second expectation, which was the firmest conclusion of this study. Almost all of the investigated stations manifested significant upward trends in mean winter air temperatures with very few exceptions. It was estimated that the regions with the strongest warming in winter were those with altitudes of about 1000–1100 m: Samokov and Koprivshtitsa. Both locations are high mountain valleys, which are usually characterized by lower temperatures in winter because of temperature inversions. The other location with the strongest warming was Murgash, which is a mountain summit. Surprisingly, the winter warming was most clearly expressed in the coldest winter months, January and February.
The first intuitive expectation about the snow, however, was not confirmed. We could estimate any clear trend in Hmax except for in six stations: three in lower altitudes and three of the highest alpine ones. The first group showed increasing tendencies and is at the furthest northwest corner of the used stations; it was obviously influenced more often by cold and snowy advections from the NW. The Hmax decreases in the second group are distinct and can be attributed to a decrease in precipitation amounts at high altitudes. The other stations show unclear or even no Hmax trend. This fact could be because at lower altitudes, the snow cover maximum develops easily in a single synoptic event but is short-lasting. At higher altitudes, the snow cover maximum is cumulatively formed over the entire winter. However, significant decreases in Hmax were only observed namely here—at the highest locations, above 2000 m a.s.l.
Winter precipitation was generally undefined or demonstrated upward tendencies after 1990. At two stations in Rila, the increases are even more significant. Three other stations—the highest ones—demonstrate remarkable decrease. This decreased PA in the alpine regions of the country is the main factor in the decreasing Hmax here; however, this requires more investigation and is thus part of our plans for future research.
As a next step, we will also include minimum and maximum air temperatures, as they determine the duration of snow cover, and this characteristic is seemingly more affected by current climate than snow cover maximums. Snow cover duration will be examined in terms of the number of days with snow cover (all days) and with different depth thresholds. Air temperature also influences the type of precipitation and the density and liquid water content of snow (freshly fallen and snow cover). Thus, we will complement this research by also including these characteristics. The last two approaches in this study—Pettitt’s test for change point detections and LOWESS analysis—will also be incorporated into further research because of the opportunity for deeper insights into the time evolution of these investigated characteristics. We will also discuss circulation at higher altitudes in the future.

Author Contributions

Conceptualization, D.N. and C.D.; methodology, D.N.; software, D.N.; validation, D.N. and C.D.; formal analysis, D.N.; investigation, D.N. and C.D.; resources,; data curation, D.N.; writing—original draft preparation, D.N.; writing—review and editing, C.D.; visualization, D.N. and C.D.; supervision, D.N.; project administration, D.N.; funding acquisition, D.N. All authors have read and agreed to the published version of the manuscript.

Funding

The main part of this work was supported through the National Science Fund in a bilateral scientific program between Bulgaria and Austria in the period 2019–2022 under grant number KP-06-Austria2.

Data Availability Statement

Data is being prepared to be shared. For now, the author Dimitar Nikolov should be contacted.

Acknowledgments

We thank NIMH for the long-term datasets provided for this study. We also acknowledge the commitment of generations of meteorological observers in the mountain regions for their hard work and dedication. We express our gratitude to Neyko Neykov for the performance of the Pettitt tests, the LOWESS analysis, and the creation of the corresponding plots.

Conflicts of Interest

The authors declare no conflicts of interest.

References

  1. Beniston, M.; Diaz, H.F.; Bradley, R.S. Climatic change at high elevation sites; a review. Clim. Change 1997, 36, 233–251. [Google Scholar] [CrossRef]
  2. Keller, F.; Goyette, S.; Beniston, M. Sensitivity analysis of snow cover to climate change scenarios and their impact on plant habitats in Alpine Terrain. Clim. Change 2005, 72, 299–319. [Google Scholar] [CrossRef]
  3. Körner, C. Alpine Plant Life; Springer-Verlag: Berlin/Heidelberg, Germany; New York, NY, USA, 1999; 338p. [Google Scholar]
  4. Beniston, M.; Keller, F.; Koffi, B.; Goyette, S. Estimates of snow accumulation and volume in the Swiss Alps under changing climatic conditions. Theor. Appl. Climatol. 2003, 76, 125–140. [Google Scholar] [CrossRef]
  5. Elsasser, H.; Messerli, P. The vulnerability of the snow industry in the Swiss Alps. Mt. Res. Dev. 2001, 21, 335–339. [Google Scholar]
  6. Strasser, U. Snow loads in a changing climate: New risks? Nat. Hazards Earth Syst. Sci. 2008, 8, 1–8. [Google Scholar] [CrossRef]
  7. Haeberli, W.; Beniston, M. Climate Change and its Impacts on Glaciers and Permafrost in the Alps. Ambio 1998, 27, 258–265. [Google Scholar]
  8. Beniston, M. (Ed.) Mountain Environments in Changing Climates; Routledge Publishing Co.: London, UK; New York, NY, USA, 1994; p. 492. [Google Scholar]
  9. Beniston, M.; Rebetez, M. Regional Behavior of Minimum Temperatures in Switzerland for the Period 1979–1993. Theor. Appl. Clim. 1996, 53, 231–243. [Google Scholar] [CrossRef]
  10. Giorgi, F.; Mearns, L.O. Approaches to the Simulation of Regional Climate Change. Rev. Geophys. 1991, 29, 191–216. [Google Scholar] [CrossRef]
  11. Katz, R.W.; Brown, B.G. Extreme Events in a Changing Climate: Variability is More Important than Averages. Clim. Change 1992, 21, 289–302. [Google Scholar] [CrossRef]
  12. IPCC; Watson, R.T.; Zinyowera, M.; Moss, R.H. (Eds.) Climate Change 1995; The IPCC Second Assessment Report; Cambridge University Press: Cambridge, UK; New York, NY, USA, 1996; p. 862. [Google Scholar]
  13. Rebetez, M.; Beniston, M. Changes in temperature variability in relation to shifts in mean temperatures in the swiss alpine region this century. In The Impacts of Climate Variability on Forests; Beniston, M., Innes, J.L., Eds.; Lecture Notes in Earth Sciences; Springer: Berlin/Heidelberg, Germany, 1998; Volume 74. [Google Scholar] [CrossRef]
  14. Beniston, M. Variations in snow depth and duration in the Swiss Alps over the last 50 years; links to changes in the large scale climatic forcings. Clim. Change 1997, 36, 281–300. [Google Scholar] [CrossRef]
  15. Hantel, M.; Ehrendorfer, M.; Haslinger, A. Climate sensitivity of snow cover duration in Austria. Int. J. Climatol. 2000, 20, 615–640. [Google Scholar] [CrossRef]
  16. Beniston, M.; Keller, F.; Goyette, S. Snow pack in the Swiss Alps under changing climatic conditions: An empirical approach for climate impacts studies. Theor. Appl. Climatol. 2003, 74, 19–31. [Google Scholar] [CrossRef]
  17. Brown, R.; Petkova, N. Snow cover variability in Bulgarian mountainous regions, 1931–2000. Int. J. Climatol. 2007, 27, 1215–1229. [Google Scholar] [CrossRef]
  18. Uhlmann, B.; Goyette, S.; Beniston, M. Sensitivity analysis of snow patterns in Swiss ski resorts to shifts in temperature, precipitation and humidity under conditions of climate change. Int. J. Climatol. 2009, 29, 1048–1055. [Google Scholar] [CrossRef]
  19. Schöner, W.; Auer, I.; Böhm, R. Long term trend of snow depth at Sonnblick (Austrian Alps) and its relation to climate change. Hydrol. Process. 2009, 23, 1052–1063. [Google Scholar] [CrossRef]
  20. Beniston, M.; Uhlmann, B.; Goyette, S.; Lopez-Moreno, J.I. Will snow-abundant winters still exist in the Swiss Alps in an enhanced greenhouse climate? Int. J. Climatol. 2011, 31, 1257–1263. [Google Scholar] [CrossRef]
  21. Pepin, N.; Bradley, R.S.; Diaz, H.; Baraer, M.; Caceres, E.B.; Forsythe, N.; Fowler, H.; Greenwood, G.; Hashmi, M.Z.; Liu, X.D.; et al. Elevation-Dependent Warming in Mountain Regions of the World. Nat. Clim. Change 2015, 5, 424–430. [Google Scholar] [CrossRef]
  22. Micu, D. Snow pack in the Romanian Carpathians under changing climatic conditions. Meteorog. Atmos. Phys. 2009, 105, 1–16. [Google Scholar] [CrossRef]
  23. Nikolova, N.; Faško, P.; Lapin, M.; Švec, M. Changes in snowfall/precipitation-day ratio in Slovakia and their linkages with air temperature and precipitation. Contrib. Geophys. Geod. 2013, 43, 141–155. [Google Scholar] [CrossRef]
  24. Gentilucci, M.; Catorci, A.; Panichella, T.; Moscatelli, S.; Hamed, Y.; Missaoui, R.; Pambianchi, G. Analysis of Snow Cover in the Sibillini Mountains in Central Italy. Climate 2023, 11, 72. [Google Scholar] [CrossRef]
  25. Beniston, M.; Farinotti, D.; Stoffel, M.; Andreassen, L.M.; Coppola, E.; Eckert, N.; Fantini, A.; Giacona, F.; Hauck, C.; Huss, M.; et al. The European mountain cryosphere: A review of its current state, trends, and future challenges. Cryosphere 2018, 12, 759–794. [Google Scholar] [CrossRef]
  26. Matiu, M.; Crespi, A.; Bertoldi, G.; Carmagnola, C.M.; Marty, C.; Morin, S.; Schöner, W.; Berro, D.C.; Chiogna, G.; De Gregorio, L.; et al. Observed snow depth trends in the European Alps: 1971 to 2019. The Cryosphere 2021, 15, 1343–1382. [Google Scholar] [CrossRef]
  27. Staneva, B. On the Regime of Snow Cover in Bulgaria, Works of the Hydro-Meteorological Service; State Publishing House “Science and Art”: Sofia, Bulgaria, 1955; Volume IV, pp. 213–269. [Google Scholar]
  28. Hershkovich, E. Regime of Snow Cover in Bulgaria, Works of the Hydro-Meteorological Service; State Publishing House “Science and Art”: Sofia, Bulgaria, 1955; Volume IV, pp. 271–328. [Google Scholar]
  29. Nikolov, D.; Dimitrov, C. Assessment of the long term variability of the snow cover in the Vitosha mountain, 2021, SGEM Conference Paper. In Proceedings of the 21st SGEM International Multidisciplinary Scientific GeoConference Proceedings 2021, Albena, Bulgaria, 16–22 August 2021. [Google Scholar] [CrossRef]
  30. Nikolov, D.; Dimitrov, C. Analysis of the variability of the winter precipitations and temperatures in two mountain regions of Bulgaria, 2022, SGEM Conference Paper. In Proceedings of the 22nd SGEM International Multidisciplinary Scientific GeoConference Proceedings 2022, Vienna, Austria, 6–8 December 2022. [Google Scholar] [CrossRef]
  31. Mann, H.B. Nonparametric tests against trend. Econometrica 1945, 13, 245–259. [Google Scholar] [CrossRef]
  32. Kendall, M.G. Rank Correlation Methods, 2nd ed.; Hafner: New York, NY, USA, 1972. [Google Scholar]
  33. Alexandersson, H. A homogeneity test applied to precipitation data. J. Climatol. 1986, 6, 661–675. [Google Scholar] [CrossRef]
  34. Pettitt, A.N. A non-parametric approach to the change point problem. J. R. Stat. Soc. Ser. C Appl. Stat. 1979, 28, 126–135. [Google Scholar] [CrossRef]
  35. Cleveland, W.S.; Devlin, S.J. Locally Weighted Regression: An Approach to Regression Analysis by Local Fitting. J. Am. Stat. Assoc. 1988, 83, 596–610. [Google Scholar] [CrossRef]
  36. Pohlert, T. Trend: Non-Parametric Trend Tests and Change-Point Detection. 2024. Available online: https://cran.r-project.org/web/packages/trend/index.html (accessed on 18 February 2025).
  37. Pohlert, T.; Hillebrand, G.; Breitung, V. Trends of persistent organic pollutants in the suspended matter of the River Rhine. Hydrol. Process. 2011, 25, 3803–3817. [Google Scholar] [CrossRef]
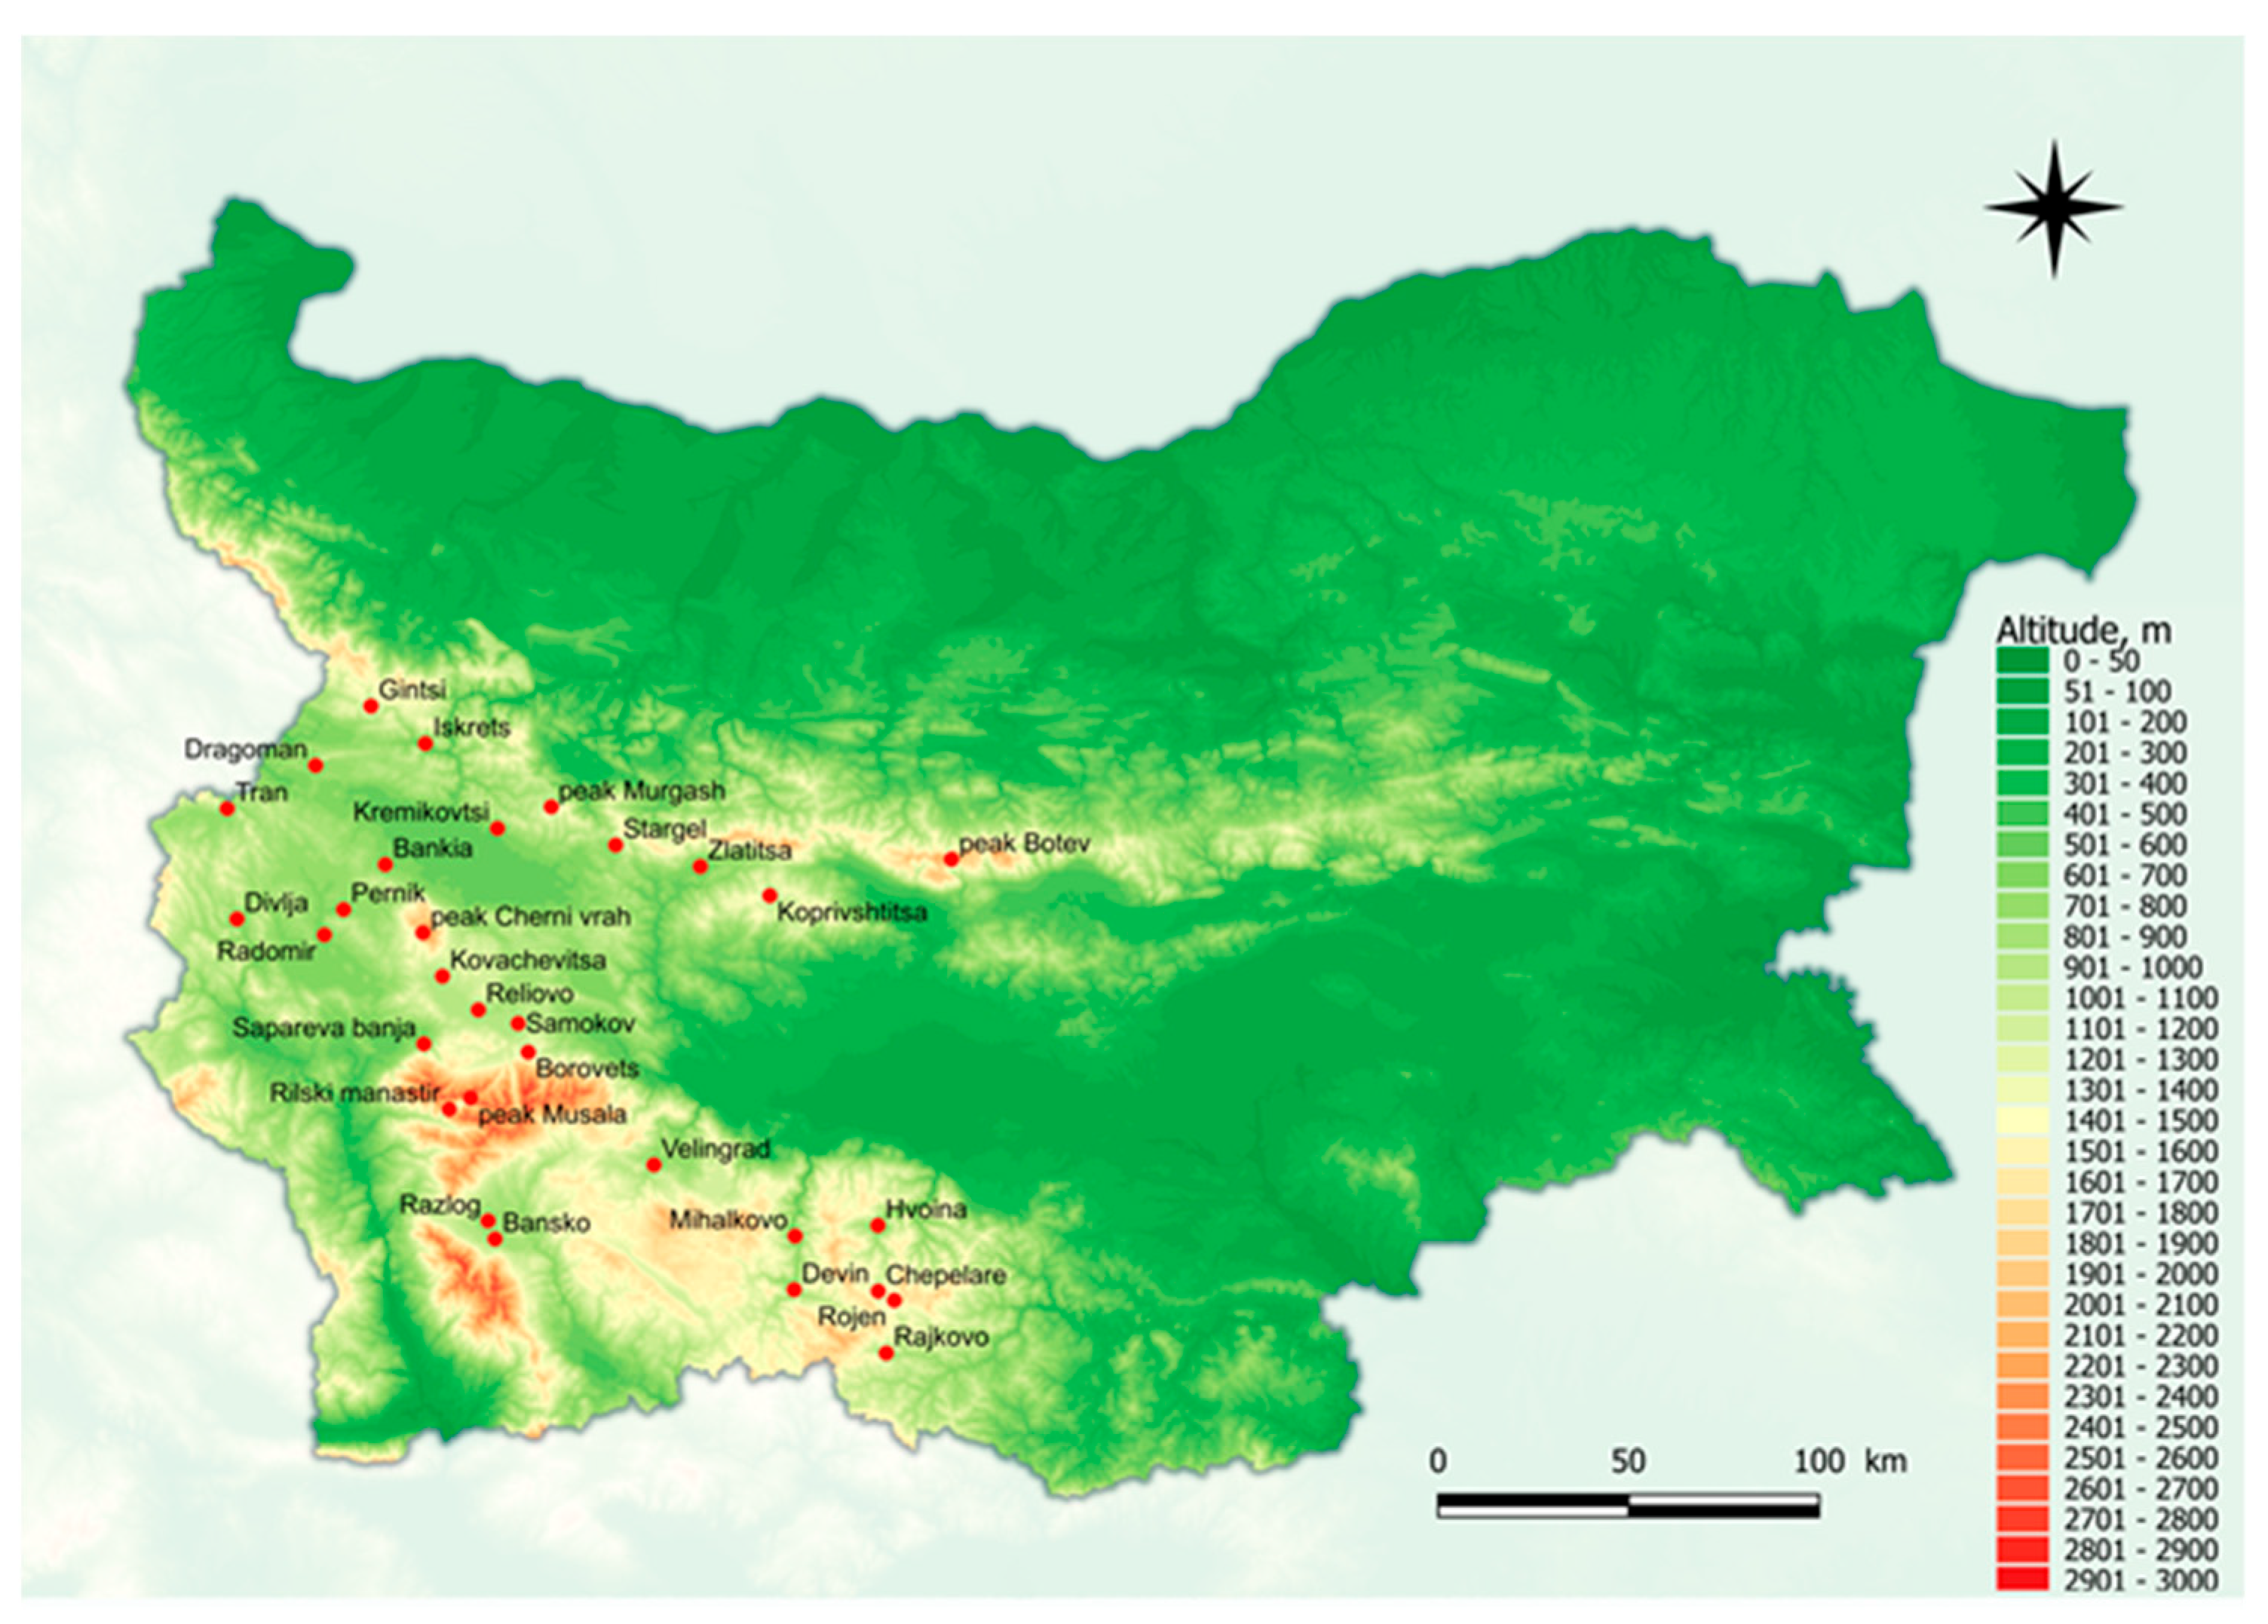
Figure 1. Geographical location of the used stations.
Climate 13 00212 g001
Figure 2. Time series of the snow cover maxima (cm) for the used stations: (a) Iskrets, (b) Divlja, (c) Kremikovtsi, (d) Bankia, (e) Zlatitsa, (f) Radomir, (g) Godech, (h) Tran.
Climate 13 00212 g002
Figure 3. Time series of the snow cover maxima (cm) for the used stations: (a) Dragoman, (b) Mihalkovo, (c) Devin, (d) Pernik, (e) Velingrad, (f) Raikovo, (g) Bansko, (h) Samokov.
Climate 13 00212 g003
Figure 4. Time series of the snow cover maxima (cm) for the used stations: (a) Koprivshtitsa, (b) Chepelare, (c) Borovets, (d) peak Murgash, (e) peak Cherni Vrah, (f) peak Botev.
Climate 13 00212 g004
Figure 5. Comparison of the mean seasonal snow cover (sc) maxima for the periods 1961–1990 and 1991–2020.
Climate 13 00212 g005
Figure 6. Time series of the winter precipitation amounts (mm) for investigated stations: (a) Iskrets, (b) Divlja, (c) Kremikovtsi, (d) Bankia, (e) Zlatitsa, (f) Radomir, (g) Tran, (h) Dragoman.
Climate 13 00212 g006
Figure 7. Time series of the winter precipitation amounts (mm) for investigated stations: (a) Devin, (b) Pernik, (c) Velingrad, (d) Raikovo, (e) Bansko, (f) Samokov, (g) Koprivshtitsa, (h) Chepelare.
Climate 13 00212 g007
Figure 8. Time series of the winter precipitation amounts (mm) for investigated stations: (a) Borovets, (b) peak Murgash, (c) peak Cherni vrah, (d) peak Botev, (e) peak Musala.
Climate 13 00212 g008
Figure 9. Comparison of the winter precipitation amounts for the periods 1961–1990 and 1991–2020 for the top four stations.
Climate 13 00212 g009
Figure 10. Trend plots of Tmean for investigated stations: (a) Iskrets, (b) Bankia.
Climate 13 00212 g010
Figure 11. Trend plots of Tmean for investigated stations: (a) Samokov, (b) Koprivshtitsa, (c) Zlatitsa, (d) Tran, (e) Dragoman, (f) Velingrad, (g) Raikovo, (h) Bansko.
Climate 13 00212 g011
Figure 12. Trend plots of Tmean for investigated stations: (a) Borovets, (b) peak Murgash, (c) Cherni Vrah, (d) peak Botev, (e) peak Musala.
Climate 13 00212 g012
Figure 13. Comparison of the winter mean air temperatures for the periods 1961–1990 and 1991–2020 for the top four stations.
Climate 13 00212 g013
Figure 14. Graphical results of Pettitt’s test for the seasonal snow cover maximum for the investigated stations: (a) peak Murgash, (b) peak Botev, and (c) peak Cherni vrah. The different color dashed lines represent the averages for the different data groups if change point is detected.
Climate 13 00212 g014
Figure 15. Graphical results of Pettitt’s test for the winter precipitation amount, PA, for the investigated stations: (a) peak Murgash, (b) peak Botev, (c) peak Cherni Vrah, and (d) peak Musala.
Climate 13 00212 g015
Figure 16. Graphical results of Pettitt’s test for the winter air temperature, Tmean, for the investigated stations: (a) peak Murgash, (b) peak Botev, (c) peak Cherni Vrah, and (d) peak Musala.
Climate 13 00212 g016
Figure 17. Graphical results of Pettitt’s test and LOWESS of winter (PA) at the investigated stations (in brackets are the station numbers): peak Botev (46090), peak Cherni vrah (64205), peak Murgash (64210), and peak Musala (64215). Here the averages of the different groups are represented by solid lines; dashed blue lines are the nonlinear fits according to LOWESS.
Climate 13 00212 g017
Table 1. Station name, altitude, snow cover maximum (Hmax), mean air temperature (Tmean), and precipitation amounts (PA); NA denotes data which is not available.
Station NameAltitude, mHmaxTmeanPA
Iskrets5271960–20211991–20201991–2020
Divlja *6001960–20211967–20211960–2021
Kremikovtsi *6271960–2021NA1960–2021
Bankia6481960–20211973–20211960–2021
Zlatitsa6741961–20201961–20191961–2020
Radomir6911960–20211960–19901960–2021
Godech *6921960–2015NANA
Tran7061961–20211961–20191961–2019
Dragoman7151960–20211961–20191961–2019
Mihalkovo *7171960–2019NANA
Devin *7231960–2021NA1960–2021
Pernik7261960–20211960–20211960–2021
Velingrad7431960–20211960–20211960–2021
Hvoina *7281960–20211966–20211960–2021
Separeva Banja7461960–20211960–19911960–2021
Raikovo8681960–20211960–20211960–2021
Stargel *9031960–2021NANA
Reliovo *9041960–2021NANA
Bansko9171960–20211960–20211960–2021
Samokov9261960–20211960–20211960–2021
Kovachevtsi *10261960–2021NANA
Koprivshtisa10451953–20211960–20211960–2021
Gintsi *10731960–2021NANA
Rilski manastir *11271960–20211960–19911960–2021
Chepelare11501960–20211960–20211960–2021
Borovets12641960–20211960–20211960–2021
Peak Murgash16871960–20211960–20211960–2021
Rojen *17501983–20211983–20211983–2021
Peak Cherni vrah22861960–20211960–20211960–2021
Peak Botev23761960–20211960–20211960–2021
Peak Musala2925NA1960–20211960–2021
Table 2. Difference between mean air temperature for 1961–1990 and 1991–2020 (°C), averaged for the winter season as well as for each of these months (highlighted are values above 0.8).
Station NameAltitude, mAveraged for DJFDecemberJanuaryFebruary
Divlja644−0.01−0.130.12−0.17
Zlatitza6800.44−0.180.640.71
Tran7060.690.541.140.44
Pernik710−0.11−0.300.240.04
Dragoman7150.520.561.020.60
Hvoina728−0.15−0.410.24−0.09
Velingrad7430.510.270.730.82
Raikovo8680.38−0.070.820.44
Bansko9170.540.190.770.92
Samokov10290.940.461.471.18
Koprivshtitza10450.830.480.840.72
Chepelare11500.01−0.280.220.34
Borovetz12640.04−0.020.450.29
Murgash16870.920.451.031.14
Boetvvrah23760.580.190.750.70
Cherni Vrah22900.560.360.720.60
Musala29220.540.440.740.64
Table 3. Summary of the Mann–Kendal trend analysis for Hmax, PA, and Tmean with given slope of the trend line and the p-value of the test; significant values are in bold.
Station NameAltitude, mHmaxPATmean
Slopep-ValueSlopep-ValueSlopep-Value
Iskrets5270.1690.0092.2470.0490.0330.293
Divlja6000.1980.0210.2300.3020.0040.935
Kremikovtsi6270.0420.1000.2590.237xx
Bankia648−0.0750.370−0.0250.9010.0200.142
Zlatitsa674−0.0880.600−0.0440.5200.0210.000
Radomir6910.1430.000−0.1630.8860.0190.523
Godech692−0.0590.653xxxx
Tran7060.0440.200−0.0540.3000.0350.000
Dragoman715−0.0700.6000.3550.4090.0280.000
Mihalkovo717−0.0910.300xxxx
Devin723−0.0230.4000.0560.837xx
Pernik7260.0060.7130.0030.9010.0080.377
Velingrad743−0.0580.300−1.1240.0000.0270.000
Hvoina7280.0440.6950.0590.8470.0070.543
Separeva Banja746−0.0380.9150.4170.191xx
Raikovo868−0.2610.100−1.1170.3000.0160.000
Stargel903−0.0250.995xxxx
Reliovo904−0.0070.400xxxx
Bansko917−0.2590.1230.6890.3540.0200.000
Samokov926−0.1000.3500.0390.6590.0400.000
Kovachevtsi10260.0000.849xxxx
Koprivshtisa1045−0.0150.3000.0250.5000.0290.010
Gintsi10730.1820.700xxxx
Rilski manastir1127−0.0040.3000.7720.187xx
Chepelare11500.0750.4000.4730.3890.0960.313
Borovets12640.1490.6540.3110.3000.0120.091
peak Murgash1687−0.1120.200−0.1650.2870.0300.050
Rojen17500.2900.7004.7830.0130.0400.073
peak Cherni Vrah2286−1.4120.001−3.5920.0000.0210.046
peak Boetv2376−1.5470.002−1.5100.0120.0250.007
peak Musala2925xx−3.1500.0140.0260.022
Table 4. Change points and corresponding p-values from Pettitt’s test of the investigated winter variables—Hmax. PA, and Tmean of the top four stations. The significant p-values are given in bold.
Station NameHmax DJFPA DJFTmean DJF
Yearp ValueYearp ValueYearp Value
Peak Murgash19860.86519690.96519840.084
Peak Cherni Vrah19870.00019870.000119920.297
Peak Botev19850.00019710.00819920.171
Peak Musalaxx19690.01619920.168
Disclaimer/Publisher’s Note: The statements, opinions and data contained in all publications are solely those of the individual author(s) and contributor(s) and not of MDPI and/or the editor(s). MDPI and/or the editor(s) disclaim responsibility for any injury to people or property resulting from any ideas, methods, instructions or products referred to in the content.