Article

Assessment of Modeled Mean Radiant Temperature in Hot and Dry Environments: A Case Study in Saudi Arabia

1
Department of Islamic Architecture, College of Engineering and Islamic Architecture, Umm Al-Qura University, Makkah 24382, Saudi Arabia
2
Department of Architecture and the Built Environment, University of Nottingham, Nottingham NG7 2RD, UK
*
Author to whom correspondence should be addressed.
Climate 2024, 12(7), 91; https://doi.org/10.3390/cli12070091
Submission received: 10 May 2024 / Revised: 24 June 2024 / Accepted: 24 June 2024 / Published: 27 June 2024

Abstract

:
Envi-met is the most-used simulation tool to assess outdoor thermal comfort in urban microclimates. Considering reported disparities between modeled and observed mean radiant temperature (MRT), failing to accurately predict the MRT may have a negative impact on the conclusions drawn by urban designers and policy makers. Therefore, this study aims to validate the Envi-met model’s efficiency for predicting MRT in the hot arid climate of Mecca city. Sensitivity analyses were conducted to investigate the settings and inputs of Envi-met, including two- and six-directional methods for calculating MRT, shortwave radiation projection factors, Indexed View Sphere (IVS), Advanced Canopy Radiation Transfer (ACRT), and the localization of materials and vegetation. Two statistical metrics (RMSE and MAE) were employed to assess Envi-met’s performance for the two evaluation points. Envi-met produced the best results with the 6-directional, ƒp-RayM (in winter) and ƒp-City (in summer), IVS on and ACRT on mode, and localized soil condition, materials, and vegetation inputs. An analysis of the modeled MRT results illustrated that error magnitudes were decreased significantly as a result of sufficient settings and inputs; for example, RMSE was improved by 2.31 and 8.48 K in the winter and summer open site results, respectively, and by 7.30 K in the summer under-tree site. Overall, the results of winter and summer analyses demonstrate average RMSE of 4.99 K and MAE of 4.02 K. The findings illustrate that substantial enhancement of model performance can be achieved through the use of proper settings and inputs.

1. Introduction

1.1. Background

As much as rural-to-urban migration provides opportunities, urban development and growth can pose challenges. The World Cities Report 2022—UN-Habitat states that more than half of the world’s population lives in urban cities, and this number is continuing to grow [1]. The quality of outdoor urban spaces has been negatively influenced by rapid urbanization and climate change [2], requiring further considerations of microclimate conditions. In the last two decades, numerical modeling has been increasingly used in environmental studies to assess outdoor thermal comfort and examine various mitigation strategies [3,4,5]. This approach is reasonably justified as it provides an easier, quicker, and inexpensive way to assess urban microclimates in early stages [6,7]. However, models have been developed to simulate the built environment across various scales with varying input and computational requirements, as well as calculation methods and output values. The most powerful recognized tool for simulating urban microclimate is Computational Fluid Dynamics (CFD), which is based on the equations of fluid dynamics and the conservation of mass, momentum, and energy. It considers air flow, thermal and radiation transfer, and the physical characteristics of various environmental elements [8]. Envi-met stands out as one of the most widely acknowledged CFD modeling software programs for the assessment of outdoor climate variables and microclimatic conditions [9,10].

1.2. Envi-met Model

Envi-met was created to simulate the urban microclimate interactions between the surface, atmosphere, and vegetation within the built environment [6]. It usually simulates a period of one to two days with resolution varying from 0.5 to 10 m and a time step between 1 and 5 s. Nevertheless, it can simulate a longer timeframe, which requires increased computational power and extended processing time [11]. The software evaluates climatic parameters, including (but not limited to) air temperature (AT), relative humidity (RH), wind velocity (V), and mean radiant temperature (MRT), which allows for the generation of outdoor thermal comfort (OTC) indices such as predicted mean vote/predicted percentage of dissatisfied (PMV/PPD), physiological equivalent temperature (PET), dynamic thermal comfort (dPET), universal thermal climate index (UTCI), and standard effective temperature (SET), thus enabling its application in the context of mitigation strategies [12,13]. A comparative analysis of model outputs and field measurement values is usually performed to evaluate model reliability. In this context, simulation studies have identified discrepancies, of various magnitudes, between modeled and observed values [14,15], as it is challenging for models to represent the complexity of the real-world physical and environmental interactions [16].

1.3. Envi-met Practice and Performance

Envi-met has been commonly utilized to mitigate urban heat stress and improve outdoor thermal comfort on urban microclimate scale [3], investigating various strategies such as cool materials [17,18], shading scenarios [19], greenery [20,21,22], urban configurations [23,24], street ratio [25] and orientation [26], and water bodies [27,28]. Other studies have integrated multiple strategies in an effort to optimize the obtained enhancements [29,30]. The investigated enhancements have mainly been quantified according to the air temperature, mean radiant temperature, and outdoor thermal comfort indices, among other parameters. Mean radiant temperature (MRT) is the environmental factor that affects pedestrians’ outdoor thermal comfort in urban areas the most [23,31], particularly in hot arid climates [32,33]. It can be defined as the quantity of radiative exchange of longwave and shortwave radiation between the human body and its surroundings [34]. Therefore, it is critical that relevant models are capable of reproducing accurate results regarding the outdoor environmental variables, especially considering the crucial role of assessing radiative fluxes [35].
The Envi-met representation of MRT has been investigated in several studies (see Table A1 for further details). These studies were conducted in various climatic regions, such as those characterized by a temperate climate (Cfb) [16,36,37,38,39,40], humid subtropical climate (Cfa) [41,42,43,44,45], Mediterranean climate (Csa) [29,46,47], hot arid climate (BWh) [33,48], tropical savanna climate (Aw) [49], or tropical wet climate (Af) [50]. While some studies have aimed to investigate the radiative performance of Envi-met, others assessed the Envi-met modeling of MRT through comparing it to observed values, as a model validation process conducted prior to the testing of various mitigation strategies. These previous studies showed MRT evaluation criteria—depending on availability of statistical metrics—ranging between 1.64–19.02 K for root mean square error (RMSE) and 4.22–15.81 K for mean absolute error (MAE). Even though the accuracy of the MRT results varied evidently between studies, most of them suggested that Envi-met generates reliable results in regard to microclimate studies [29,38,39,41,42,43,44,45,48,49,50,51].
The recognized discrepancies arise from the availability and quality of input data or/and model limitations [43]. To tackle model limitations, for instance, related to overestimating MRT under sun exposure and underestimating it under shade, which can be attributed to the domain average calculation of emitted and reflected radiation [36], the Indexed View Sphere (IVS) and the Advanced Canopy Radiation Transfer (ACRT) schemes have been introduced [52,53]. Yet, these new radiative calculations have not been investigated across various climates and conditions, especially in the hot arid climate of Saudi Arabia. As improving model accuracy requires refinement of initial input values and settings [36,46], it is worthwhile to investigate the effect of radiative fluxes of the atmosphere and the ground material in the modeled MRT. Thus, this study aims to systematically investigate the upgraded settings of Envi-met and evaluate the mean radiant temperature for a sacred outdoor site in the hot arid climate of Mecca city. To achieve the study aim of thoroughly investigating the model radiative performance in the hot arid climate, three objectives were identified and tackled:
  • To evaluate the effects of different settings on the radiative performance of Envi-met.
  • To explore the influence of the localized soil conditions, materials, and vegetation on the model’s accuracy.
  • To assess the model’s MRT results in summer and winter.
To achieve the study objectives:
  • Two field measurements were performed in winter and summer, using instruments located at three measuring points (to obtain meteorological data for the study).
  • Sensitivity analyses were conducted testing model settings and input with respect to 2- and 6-directional MRT calculations, projection factors, IVS/ACRT, initial soil conditions, and localized materials and vegetation.
  • The model performance in the hot arid climate was evaluated in summer and winter seasons using two statistical metrics.

2. Methods and Materials

2.1. Study Area

The study site was located in Mecca city (also called Makkah or Makkah Al-Mukarramah), located on the western side of Saudi Arabia within around 80 km from the Red sea (between 21°40′–21°10′ N and 40°00′–39°40′ E). The city’s climate is categorized as a hot arid climate (BWh), in which the city encounters hot dry summers and less severe to moderately mild winters with low annual relative humidity and rainfall. According to historical climate data retrieved from Arafat station for the period between 2004 and 2021 [54], January is the coldest month, registering a mean air temperature (AT) of 22.1 °C, with the minimum temperature dropping to 5 °C. In contrast, July marks the peak of the hot season, with mean AT of 35.2 °C and reaching a maximum temperature of 49 °C. The rainfall is minimal in the city, mostly occurring in winter, and the annual mean relative humidity is 42.7%. The city stands as a sacred destination for Muslims as it comprises the Holy Mosque and Kabaa, a cubic construction built by Prophets Abraham and Ishmael which is the direction of Muslim prayers. Other holy sites, such as Arafat, Muna, and Muzdalifah, that involve the annual Islamic worship (called Hajj) are located in Mecca city as well. For example, it is essential that Hajj performers (pilgrims) stay in the Arafat area for a complete day, from noon to dusk, on a designated day of the lunar Islamic calendar. The Hajj ritual continues for five days, in which activities such as sitting, standing, walking, and praying in open spaces could be exhausting for pilgrims. The Saudi government has made substantial efforts to manage the safety of Hajj and mitigate heat-related illnesses [55]. Moreover, to alleviate the effects of extreme heat conditions for pilgrims, Saudi authorities are constantly developing holy places [56] to increase their safety and comfort [55]. Mecca city was selected as a case study to investigate the model’s predicted MRT values, as it is situated in a hot arid region where MRT has the greatest impact on visitors’ thermal comfort.
Experimental field studies were conducted in the Arafat area, particularly within Mount Arafat, also called Jabal Ar Rahmah in Arabic, which means The Mercy Mountain (see Figure 1). Even though the site is part of Hajj, it is constantly visited by foreigners and residents Muslims on a daily basis, either to pray or for social gathering and recreational activities. The circular plaza has a diameter of 360 m (approximate area of 0.10 km2) with Mount Arafat at the center, which is around 29 m above plaza level. The lack of any vegetation and physical building inside the circular site is mainly for crowd management related to the Hajj season. Therefore, buildings such as WCs, Arafat hospital, the Saudi broadcasting tower, and other one-story facilities are distributed around the plaza. Additionally, only the western and northern boundaries are covered in vegetation, where long-existing Neem (Azadirachta indica) trees and Conocarpus erectus trees, in addition to recently planted Poinciana trees and C2000-American grass, can be found. This allowed for the successful selection of an open point (OP) as the first evaluation point, with sky view factor (SVF) of 1.00, calculated using a Nikon D850 camera with fish eye lens and the RayMan Pro software (version 3.1 Beta) [57,58,59,60,61]. The selection was also influenced by the site re-development which occurred during the first field study (i.e., in winter), as well as the behavior of visitors to the site. The reconstruction included the setting up of a new irrigation system on the western side, which was completed prior to the second field study in summer. Therefore, the vegetation on the western side presented an opportunity to establish a second evaluation point to capture different environmental characteristics for model testing. Thus, the under-tree point (UTP) served as a greenery evaluation point, which was tested only in summer, with an SVF of around 0.32.

2.2. Field Measurements and MRT Calculation

Two in situ measurements, each with a 24 h cycle, were conducted to collect meteorological data for 15 January 2023, a typical winter day with highest observed AT of 27.6 °C and lowest AT of 17.3 °C, as well as 18 July 2023, a typical summer day with maximum and minimum observed AT of 46.5 °C and 30.6 °C, respectively. The field measurement instruments obtained weather data such as air temperature, relative humidity, wind speed and direction, globe temperature, and global radiation in an hourly interval (between 00:00 and 23:00); see Table 1. Two specific points were selected for the instruments in order to simultaneously measure various environmental parameters, each located at a height of 1.5 m above ground level. At the first evaluation point, the Kestrel 5400 was positioned at an open point (OP), in an area devoid of construction or notable pedestrian movement on the western side of the plaza; meanwhile, the model meteorological input values were taken from the Davis Vantage Pro 2 weather station, situated at the site’s highest elevation of around 29 m above plaza level, on the summit of Arafat Mountain. An additional evaluation point was introduced in the second field study (i.e., in summer) through the addition of another Kestrel 5400 instrument. The new device was placed at an under-tree point (UTP) on the western side of the plaza, also at 1.5 m above ground level. The meteorological parameters were collected at the selected points to ensure representative and undisturbed measurements of the environmental conditions. Furthermore, the ground surface temperature was measured in three-hour intervals (from 00:00 to 21:00) during the evaluation period using an infrared thermometer (Fluke 62 max plus). Mean radiant temperature was calculated based on globe thermometers with the following Equation (1) [34]:
M R T = T g + 273.15 4 + 1.1 × 10 8 V a 0.6 ε D 0.4 × ( T g T a ) 0.25 273.15 ,
where Tg represents the globe temperature (°C), Va is the wind velocity (m s∂1), ε indicates the globe emissivity (which is 0.95), D represents the globe diameter (0.25 m), and Ta is the air temperature (°C).

2.3. Envi-met Modeling

Envi-met V5.6.1 was utilized for microclimate simulation to evaluate the seasonal radiative performance (i.e., winter and summer) of the model by investigating the model’s output variable (MRT) in an urban plaza in Mecca city, Saudi Arabia. The site’s actual environment was specified within the area input model, see Figure 2. The model domain contained 176 × 164 × 16 grids with horizontal (Δx and Δy) and vertical (Δz) resolution of 3 m. This domain resolution was selected to balance between simulation time, computational capabilities, and accuracy [46]. The vertical telescoping was set as 25%, starting after 31 m, in order to minimize calculation time associated to the higher atmosphere. The model consisted of a mountain topography that represents the actual site situation, with an area of around 23,773 m2 and a height of 29 m. Buildings were scattered around the plaza with heights ranging from 4.5 to 21 m, and the materials of walls and roofs were determined based on an observational field survey. The model domain was rotated 30° anti-clockwise.
As the model accuracy can be enhanced through the use of correct input values for the used materials [46,50], sensitivity analyses were performed to ensure the accurate representation of ground materials and vegetation in the studied site. The default and localized characteristics of the constructions and vegetation in the model are shown in Table 2. The gray cement pavement in the OP, covering more than 35% of the plaza, was the first tested material. Due to a lack of data about the properties of gray cement pavement—particularly albedo—in the Mecca region, a typical value of 0.15 for albedo was investigated. This typical value was obtained from field data through calculating the measured mean ratio of the received and reflected solar radiations in [62]. The application of measured albedo values for construction materials was conducted with reference to numerous studies in the field [33,39,41,42]. Therefore, an albedo value of 0.15 was determined as a localized albedo input for the model, as it represents a typical value for the applied material. In general, the material default albedo in Envi-met (0.30) was simulated alongside the localized value of (0.15) to test the adaptability of the Envi-met default database and confirm a representative material property. Furthermore, the second tested components were the 5 cm grass found in the UTP, in addition to trees (including height, width, and tree structure). As the Envi-met database did not contain the site’s trees, models and modifications of comparable trees were made to replicate the real trees at the site.
As part of the material and greenery adjustments, soil conditions were addressed as well, in order to mimic the ground and underground soil environments in the actual site. The modeling of soil conditions in Envi-met involves four layers, which are situated at varying depths beneath the ground surface. The upper layer is set between 0 and 0.2 m, the middle layer goes down to 0.5 m, and the deep layer extends to 2 m, and the final layer is the bedrock layer which is below 2 m. Each layer is assigned an initial temperature and relative humidity when the simulation commences. In this study, soil relative humidity values were kept as default, due to a lack of data, while soil temperatures of the four layers were retrieved from a geothermal study conducted by [63] in Riyadh city (the closest available data to study site); see Figure 3. This approach has been used in several studies conducted in the Mediterranean region [46,47]. Although the model is expected to act differently based on running time, according to the initial soil conditions, the obtained average soil temperatures were initiated with the study’s starting time.
Following the construction of the site’s physical and environmental components, the preparation of meteorological data was required to initialize the model. The hourly meteorological data gathered from the weather station placed on the top of Arafat Mount were used as input data to fully force the boundary meteorological conditions. The global radiation was divided into direct and diffuse shortwave radiation to be used as input values for the model, based on [64]. However, forcing radiation requires longwave radiation which was not obtained at the site; thus, it was left to be estimated by the model. Finally, all simulations began at 23:00 on the day before the day under investigation and ran for the full 24 h. Table 3 shows the initial input data and general settings for the model.

2.4. Sensitivity Analysis

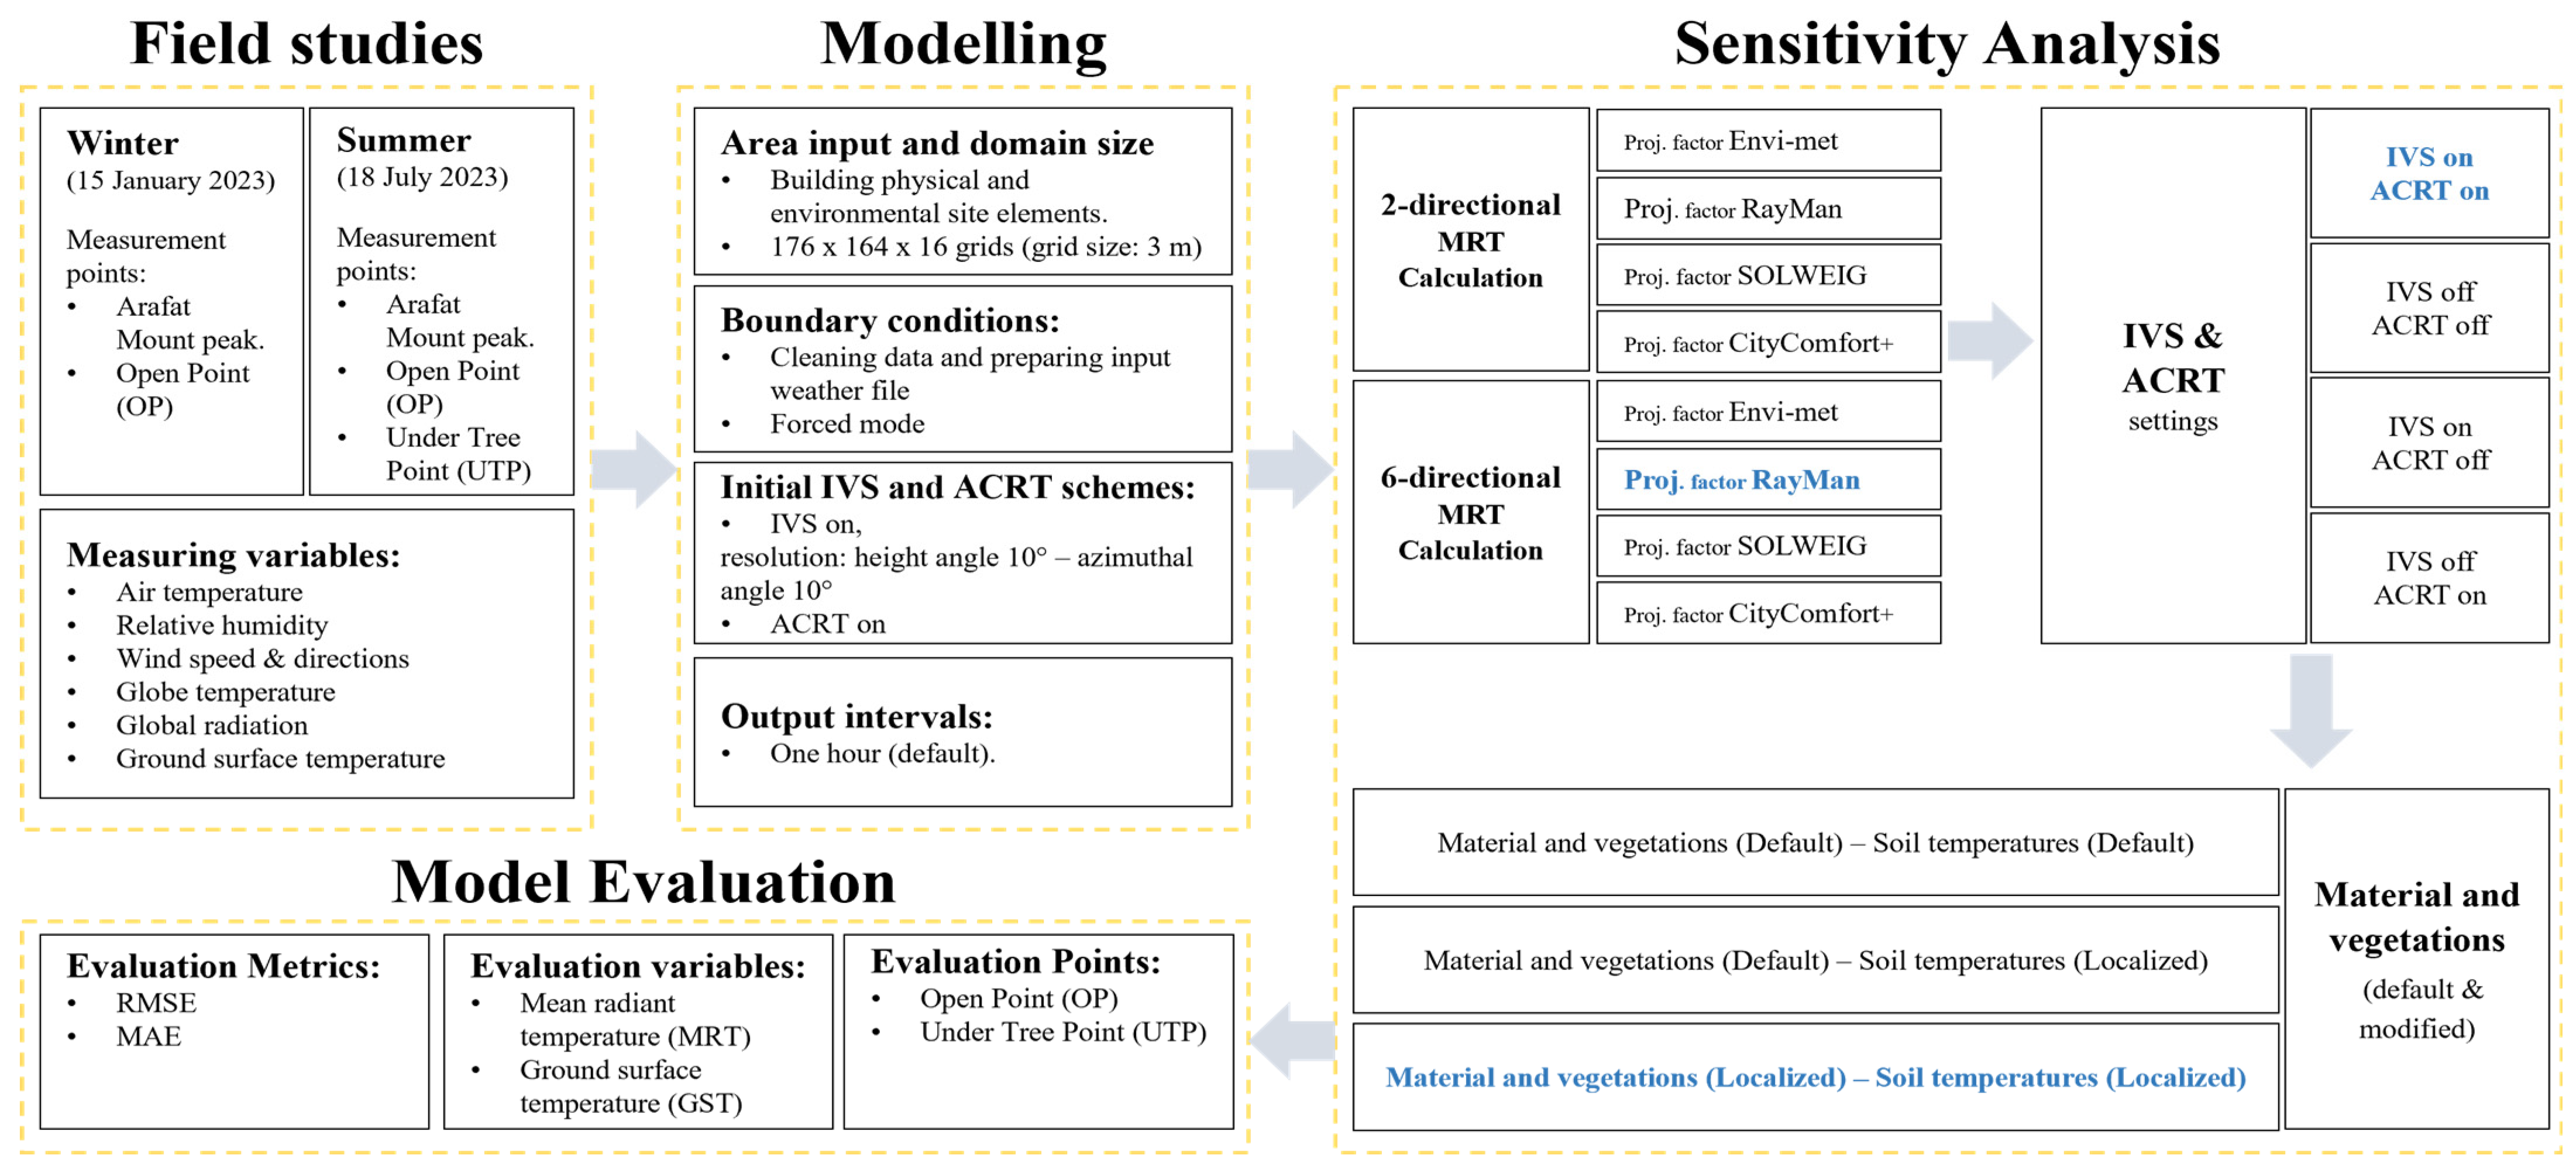
In Envi-met versions V4 and V5 (the latest version), new features were released to overcome limitations regarding the calculation of different radiative fluxes. The indexed view sphere (IVS) was released to overcome the drawback of the old Averaged View Factor (AVF) by considering the emitted longwave and reflected shortwave radiation from adjoining surfaces and trees in a grid-based manner, instead of averaging values over the entire domain [53]. When enabling IVS, each grid takes into account the emitted and reflected radiative fluxes from the surrounding surfaces considering the angle of a view facet, different resolutions, and a vegetation transmission factor. Therefore, altering the resolution (azimuth angles) changes the amount of calculated view facets and, thus, the model accuracy [41]. The various methods for calculating MRT in the model, including the detailed equations, are thoroughly documented in [41]. Moreover, three supplementary methods for estimating the radiation exposure on the human surface, commonly referred to as projection factors, have been incorporated. The model’s calculation of received shortwave radiation involves a projection factor representing an upright standing human body and computes the received shortwave radiation based on the angle of solar altitude [41]. This calculation differs based on the angle of the sun, as more of the body is exposed to the sun’s radiation at lower sun angles while only the head and shoulders are hit by the radiation at higher sun altitudes [41]. In addition to the Envi-met projection factor (ƒp-Envi), three projection factors were implemented in the model, as follows: RayMan and SURM (ƒp-RayM) as employed by [60,65], SOLWEIG (ƒp-SOLW) as employed by [66], and CityComfort+ (ƒp-City) as employed by [67]. Furthermore, the Advanced Canopy Radiation Transfer (ACRT) was introduced, aiming to enhance the estimation of diffuse radiation within a plant’s canopy and to refine the interactions between the plant and the atmosphere [52]. The implementations of such features are expected to improve the interactions between the physical environment and the atmosphere, leading to an increase in the model performance. Sensitivity analyses were conducted to understand the influence of different settings and inputs on the Envi-met outcomes, covering the three following aspects:
  • Old and new MRT calculations: The 2-directional (2-dir) method involves received radiation from upper and lower hemispheres in the calculation, each weighted by 50%, while the 6 directional (6-dir) method takes into account additional values to calculate the received radiation (down, up, north, south, west, east) [41]. The 6-dir method considers direct and diffuse radiation from six angles to predict more representative MRT values, which is expected to increase the model’s accuracy. The sensitivity analysis of the old 2-directional and the new 6-directional calculations of MRT was conducted using the four projection factors (ƒp-Envi, ƒp-RayM, ƒp-SOLW, and ƒp-City) with each method. This was conducted to investigate the four projection factors and evaluate the difference between the old and new calculation methods.
  • IVS and ACRT: The IVS and ACRT were introduced to improve radiation interactions between surfaces, plants, and the atmosphere. While IVS allows for further calculation of secondary radiation from surfaces, ACRT takes into account further calculation of the diffused and direct scattered shortwave radiation through tree canopies. The examination of various sequences between the recent IVS and ACRT schemes was carried out, in order to assess how the model responds to different settings, particularly at evaluation points featuring varying environments.
  • Material and vegetations characteristics: The default and adjusted materials and greenery were applied and examined to evaluate the accuracy under Envi-met default database and improved input data. Additionally, local initial soil conditions (in particular, soil temperatures) are addressed in this section while, due to the unavailability of data, the initial soil relative humidity was set as default.
To assess the model performance, its sensitivity to different settings and inputs was evaluated by comparing the modeled MRT against the calculated MRT. The ground surface temperature (GST) comparison, however, was included subsequently in the last aspect as it was significantly influenced by the adjustment of initial soil conditions, materials, and vegetation. It is important to note that, although the MRT comparisons utilized hourly data (with 24 observed points per day), GST provided eight observed data points per day (with three-hour intervals) for comparison.
An initial model was created with default constructions (IVS on/ACRT on) and full forced boundary conditions, in order to evaluate the three aspects. To investigate the sensitivity of each setting, one aspect was adjusted in each run while all other variables remained constant. Subsequently, the optimal settings in each assessed aspect were selected to be utilized in the next evaluation. The study framework and examination steps are shown in Figure 4.

2.5. Evaluation metrics

This study utilized two statistical metrics to assess the radiative performance of Envi-met: the root mean square error (RMSE) and the mean absolute error (MAE). These metrics were applied to evaluate the model outcomes in each step through comparing the hourly simulated MRT against observed values. RMSE is the square root of the average squared differences between simulated (predicted) and observed data, while MAE is the average of absolute differences between predicted and observed data. RMSE and MAE can represent a range of values from 0 to infinity, with values closer to zero indicating more accurate predictions. The used statistical metrics were calculated using Equations (2) and (3) [68].
R M S E = 1 N i = 1 N ( P O ) 2 ,
M A E = 1 N i = 1 N P O ,
where P denotes predicted values and O denotes observed values.

3. Results

To assess the Envi-met simulation of MRT in the hot arid climate of Mecca city, sensitivity analyses regarding three settings were conducted, namely, 2-directional and 6-directional MRT calculations, plus the four projection factors, and different sets of IVS, ACRT, materials, and vegetation modifications. The simulation results are reported based on the three sensitivity analysis steps. The predicted MRT and GST values were evaluated at one point in winter (OP) and two points in summer (OP and UTP).

3.1. MRT Calculations Methods and Projection Factors

During this phase of the investigation, 16 models were evaluated considering the 4 projection factors (ƒp-Envi, ƒp-RayM, ƒp-SOLW, and ƒp-City) for the old 2-directional and the new 6-directional approaches in winter and summer seasons. To assess the impact of each setting in terms of improving MRT prediction, two statistical metrics were used to compare the modeled and calculated values (i.e., RMSE and MAE).
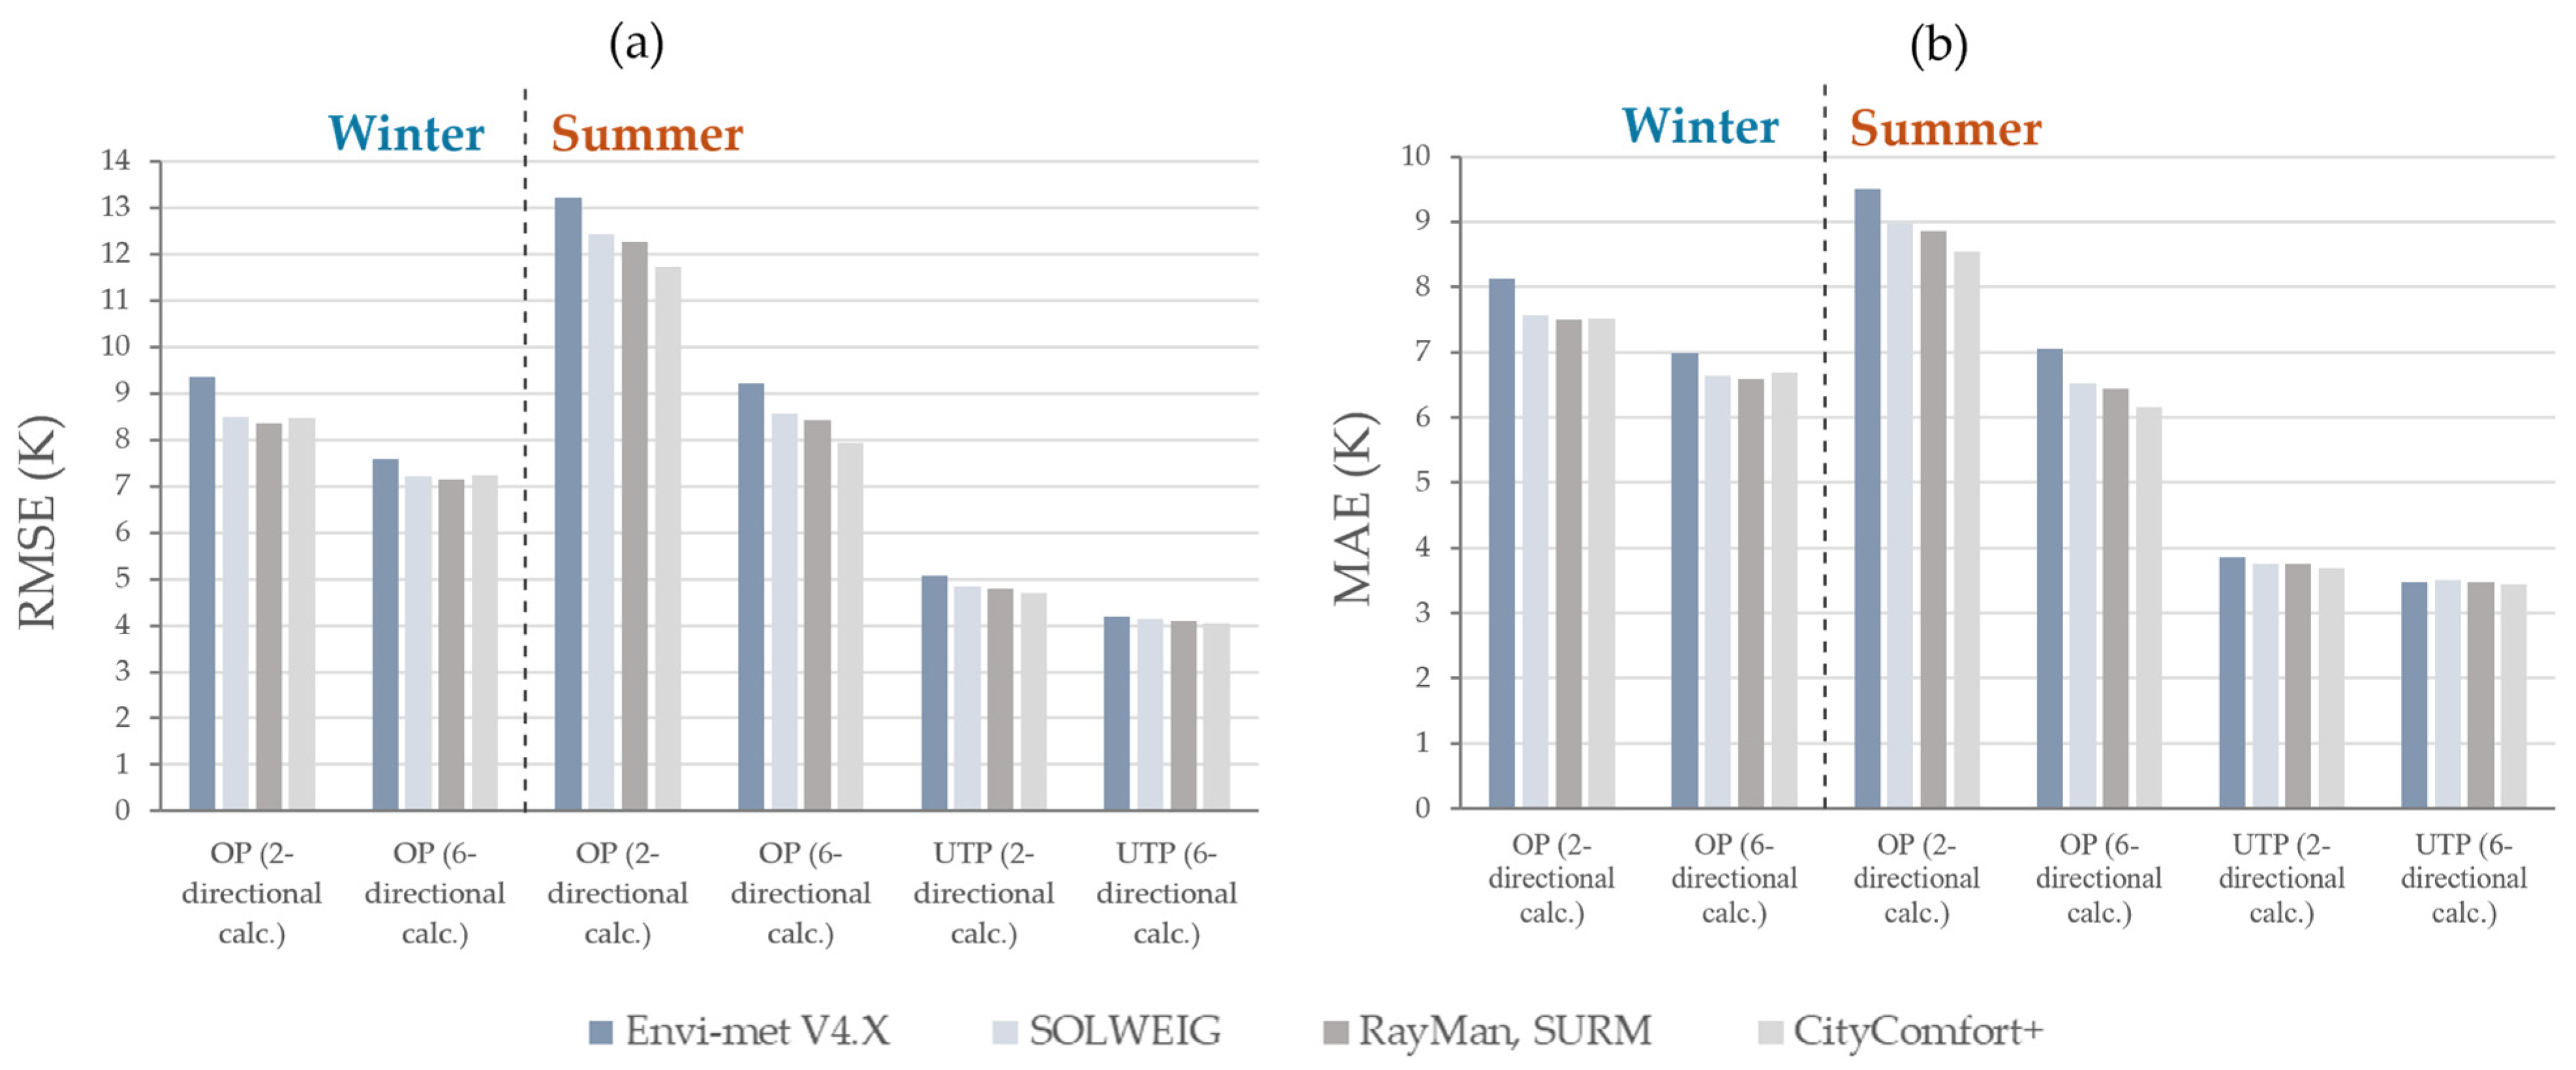
Figure 5 presents the statistical analysis of all models that involve the 2 MRT calculation methods and the 4 projection factors. In the old 2-dir and the new 6-dir MRT calculations and between all projection factors, the models showed a large range of error magnitudes for all models, for example, the RMSE ranged between 4.05–13.21 K, and MAE between 3.44–9.50 K. These error values were at the highest in the 2-dir approach and lowest in the 6-dir approach for all measurement points in both seasons. In general, the new 6-dir approach showed better results than the 2-dir method in all four projection factors, with an average decrease of 2.62 K RMSE and 1.69 K MAE for the OP and 0.73 K RMSE and 0.29 K MAE for the UTP. The increased accuracy with the 6-dir approach over the 2-dir approach was anticipated in the study’s hypothesis, as more received radiation (from north, east, west, and south angles) is involved in the calculation of the modeled MRT values. Among the measurement points, OP in summer illustrated the highest MRT inaccuracy, with an average RMSE value of 10.47 K among all models, followed by the OP in winter with 7.98 K and, finally, the UTP in summer with 4.49 K. This variation could be attributed to differences in radiation intensity, sun angles, and SVF at each evaluation point.
In the comparison of the projection factors in summer and winter, the worst MRT predictions were produced by ƒp-Envi, while the results were relatively close between the other three projection factors. For the two studied days, ƒp-RayM and ƒp-City showed better MRT results in winter and summer, respectively. These findings generally suggest that ƒp-RayM works better with a low sun angle, while ƒp-City works better with higher sun angles, as sun’s highest angles measured on winter and summer days are ~47° and ~89°, respectively. Notably, ƒp-Envi recorded the least accurate results in both measurement points and seasons, especially with the 2-dir approach, showing higher differences compared to the best scenario in summer OP (RMSE 5.28 K) and winter OP (RMSE 2.23 K) and a lower difference in summer UTP (RMSE 1.03 K). The minimal error variations of the UTP can be attributed to radiation blockage by tree shade, exhibiting the greatest differences of only 1.03 K RMSE and 0.41 K MAE. This aligned with the findings of a model performance study conducted in Singapore, which noted that a decrease in the effect of projection factors can be caused by a reduction of received direct shortwave radiation; for example, due to very cloudy or overcast conditions [50]. Moreover, ƒp-Envi overestimated MRT values mostly in the late morning and afternoon of the summer day, compared to other projection factors, which reveals that ƒp-Envi tends to misrepresent the shape of the body receiving direct shortwave radiation when the radiation hits at a lower angle. Similar results of higher MRT predictions at low to medium solar angles by ƒp-Envi have been reported in an Envi-met radiative performance study in Hong Kong [41]. According to the study, the overestimation of MRT can be attributed to the defined big cylindrical area with great values of about 0.425 by ƒp-Envi that is involved in calculating received radiation at declined sun elevations. The values are low and closer between the other three projection factors, between 0.225 and 0.3, [41], which explains the better representations of the body receiving radiation in comparison with ƒp-Envi. Overall, the results illustrated an improvement in the radiative performance with the 6-dir MRT calculations. Despite the small difference between the three projection factors (ƒp-RayM, ƒp-SOLW, and ƒp-City), the model showed better performance of projection factors in the order ƒp-City, then ƒp-RayM, ƒp-SOLW and, finally, ƒp-Envi in Summer. However, ƒp-RayM performed better in winter, followed by ƒp-SOLW, ƒp-City, and ƒp-Envi. In this study, the balance of accuracy between all compared points and seasons led to the selection of ƒp-RayM as well as the new 6-dir MRT calculation as the settings to be used in further investigations.

3.2. IVS and ACRT

Following the previous investigation, this test utilized the settings that provided the most accurate MRT results to further evaluate different IVS and ACRT modes. To assess the effects of the IVS and ACRT variations (IVS on and ACRT on, IVS off and ACRT off, IVS on and ACRT off, and IVS off and ACRT on), eight models were examined at the two evaluation points for the winter and summer days.
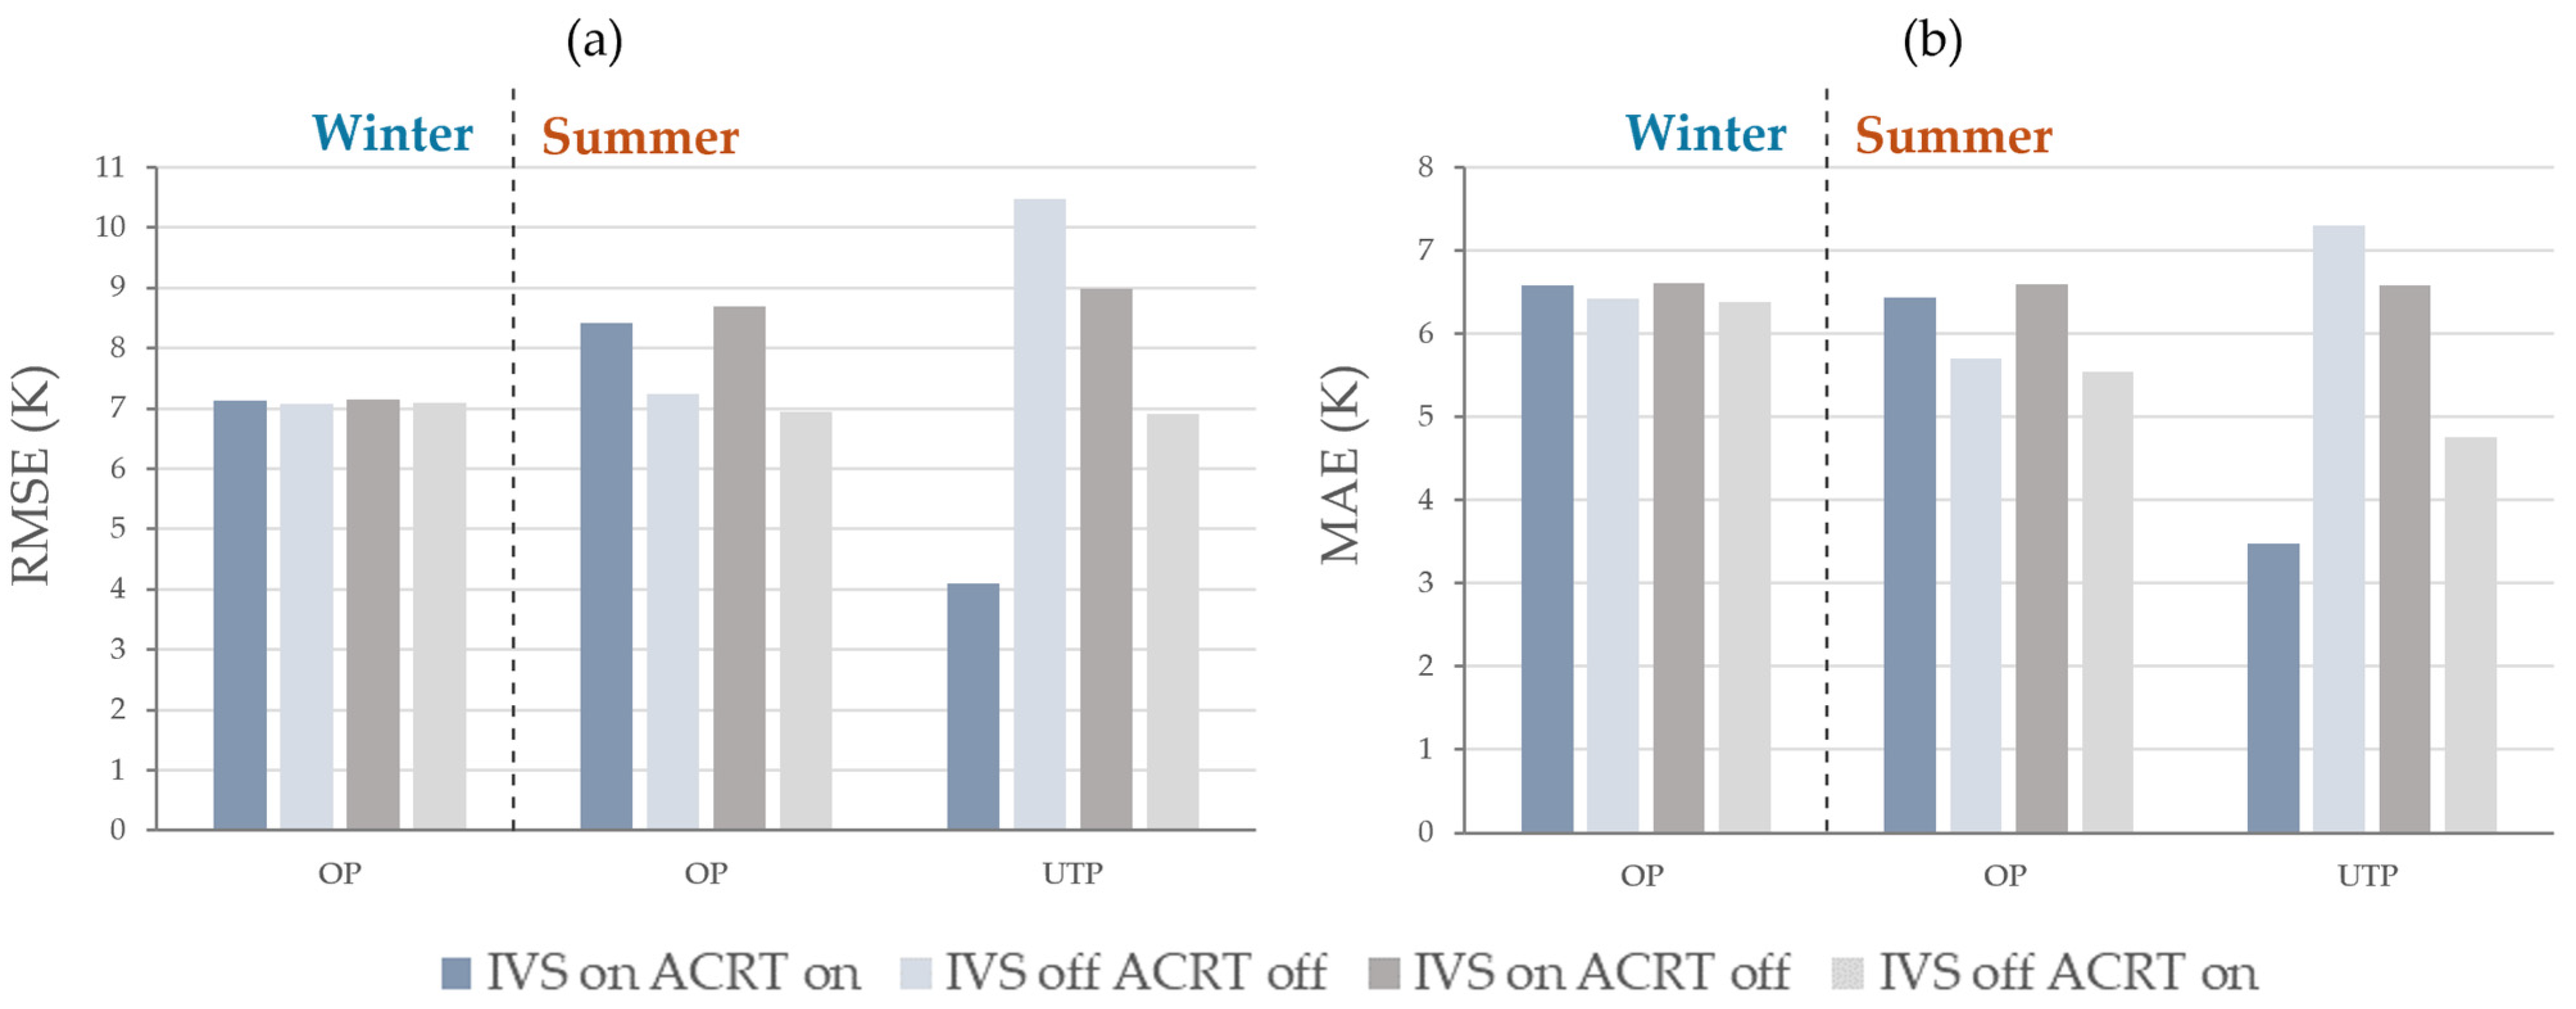
Figure 6 reveals the statistical evaluation of the different IVS/ACRT modes, showing RMSE ranging between 4.10–10.48 K and MAE between 3.48–7.30 K. The various IVS/ACRT choices had different impacts, depending on the season and the evaluation point. In regard to error magnitudes, it was surprising that the OP models did not exhibit the expected improved outcomes with IVS on. Instead, the best results were observed when disabling IVS and enabling ACRT in summer (RMSE of 6.95 K and MAE of 5.54 K). This might be explained by the influence of non-representative materials on the modeled site, which resulted from a lack of actual data regarding material properties. Thus, in order to provide an accurate reflection of the site’s materials, sensitivity analysis of the material properties was carried out, as detailed in the following section. In terms of IVS and ACRT modes, the model performance at the open evaluation point (OP) was found to differ more between the best and worst models in the summer than in the winter, as indicated by differences of RMSE (1.74 K and 0.09 K for summer and winter, respectively) and MAE (1.05 K and 0.23 K). One explanation for the greater variances is that the impact of the non-representative materials was amplified by higher levels of received radiation during the summer. Moreover, this investigation revealed that, when ACRT was activated in the UTP, lower error magnitudes were seen, in agreement with other studies that concluded ACRT was responsible for improving canopy radiation [42,52]. The model showed the worst results in UTP when disabling IVS and ACRT, with RMSE and MAE of 10.48 K and 7.30 K, respectively. These results improved slightly when enabling only IVS, a larger improvement was achieved with enabling only ACRT, and the most accurate results were exhibited when enabling both IVS and ACRT as (RMSE of 4.10 K and MAE of 3.48 K). These results agree with the initial hypothesis, stating that the ACRT mode is expected to improve the model radiative performance within greenery sites.
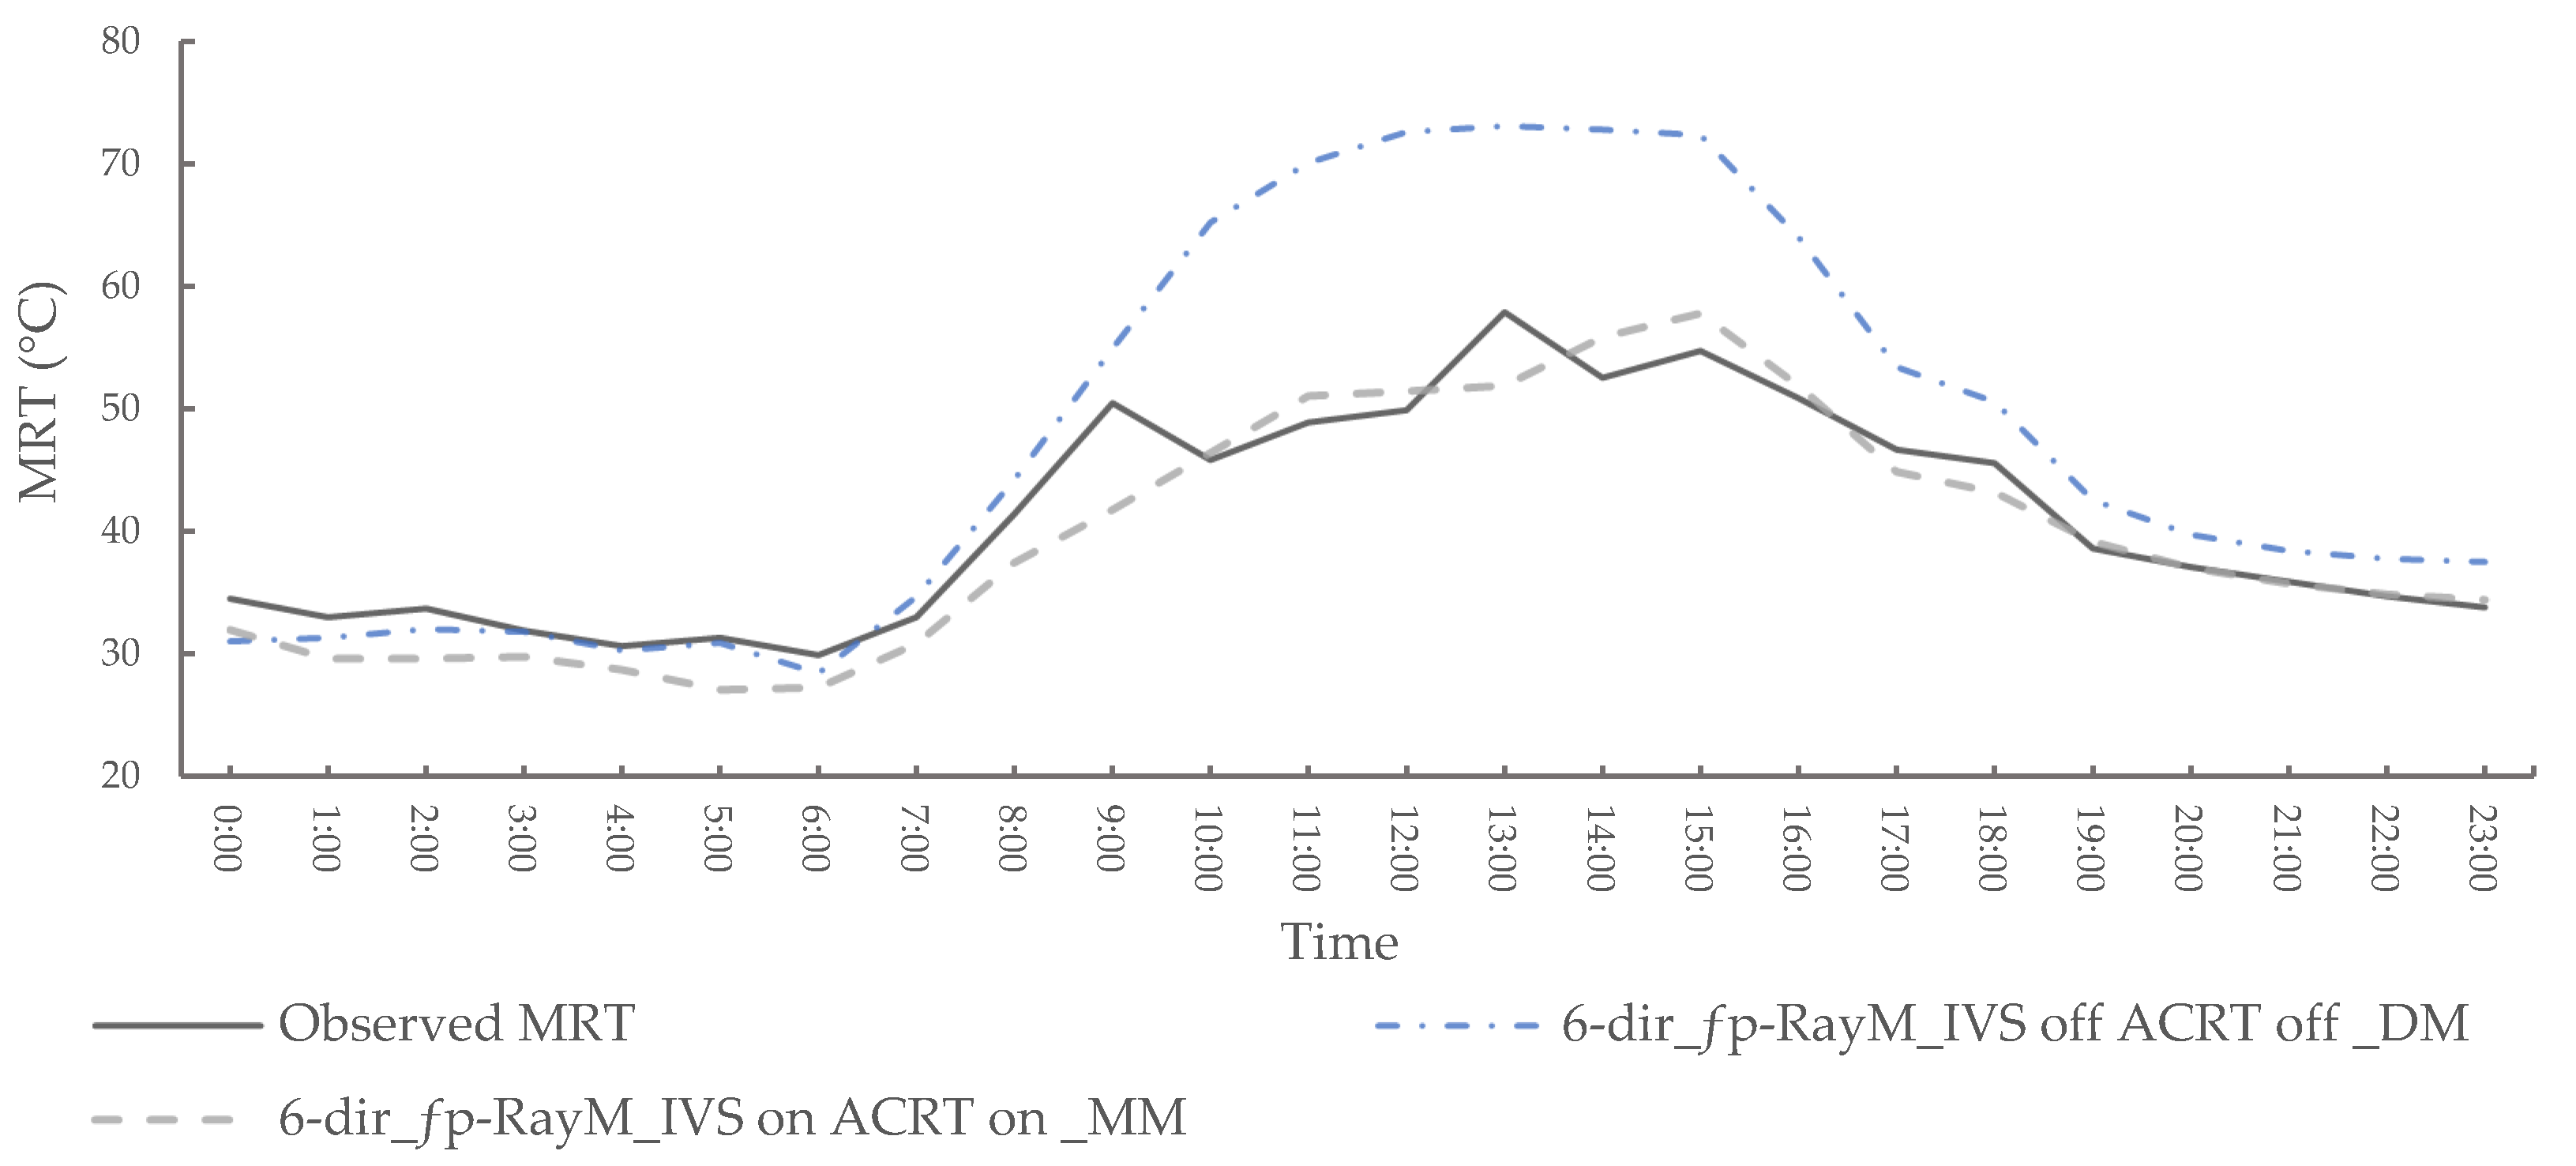
According to the sensitivity analysis of several (IVS/ACRT) modes, especially in the summer under-tree location, the IVS and ACRT schemes improved the model’s radiative performance (see Figure 7). For example, the results showed that the error magnitudes of the modeled MRT in the under-tree area was decreased by 6.38 K for RMSE and 3.82 K for MAE, when enabling both IVS and ACRT, in comparison to the worst model (disabling both settings). A study found that the optimal configuration of (IVS on/ACRT on) exhibited high MRT accuracy at an under-tree evaluation site [41]. These highly accurate findings were achieved by adjusting the model and settings based on an earlier study [42], which reported lower accuracy at the same evaluation point. This demonstrates how crucial precise site modeling and settings are to the model’s validity. Therefore, the remaining MRT discrepancies are also expected to be improved through more realistic representation of the actual vegetation properties [42]. Accordingly, the localization of materials, trees, and grass is essential to ensure accurate representation of the actual study site.
Following the findings shown in this section, (IVS on/ACRT on) can be evaluated as the best setting across a range of statistical measures, evaluation points, and seasons. This optimal configuration was selected based on the best average results for evaluation points and seasons across the two statistical measures, with an average RMSE of 6.56 K and MAE of 5.50 K. Therefore, the setup of (IVS on/ACRT on) was utilized for additional assessments based on soil condition, material, and vegetation adjustments in the following section.

3.3. Material and Vegetation Modifications

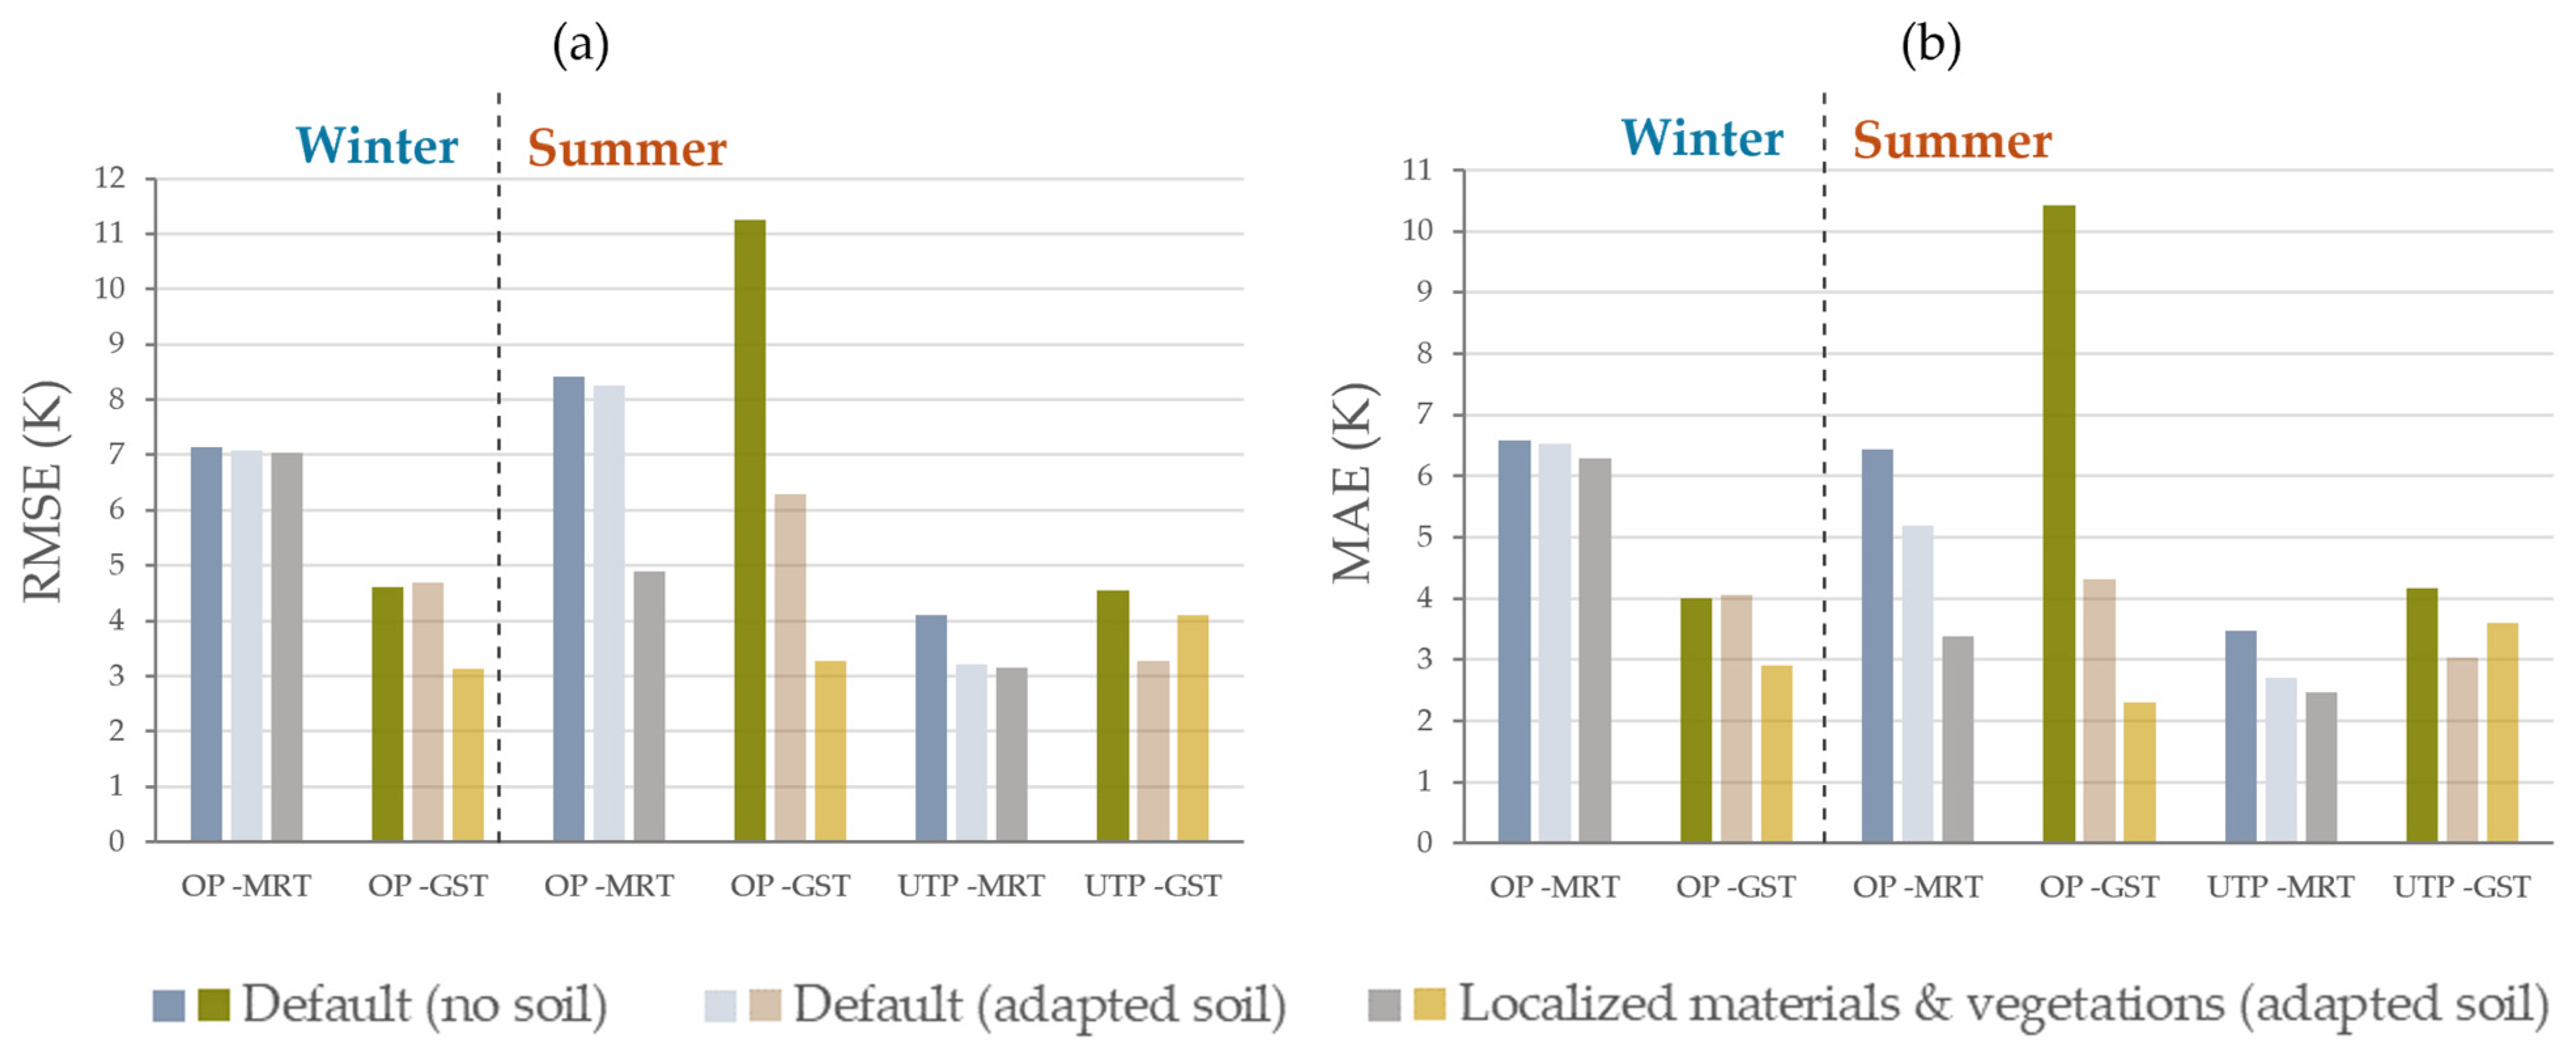
To tackle the negative impact of poor inputs on model performance, this section introduces adjustments to the soil condition settings, in addition to ground material, grass, and plants settings, in order to ensure better representation of the study site. The evaluation was based on each assessment point, where model estimations of MRT and GST were compared to the observed data. The statistical evaluation of model outcomes with regard to default, adapted initial soil temperatures, and adapted soil temperatures with localized materials and vegetation can be seen in Figure 8.
First, the integration of only initial soil temperatures, while keeping default materials and vegetation, produced significant improvements in both MRT and GST for the two evaluation points. The model summer results in the OP were significantly enhanced, with a decrease in RMSE of 0.17 and 4.96 K, and MAE of 1.26 and 6.11 K for MRT and GST, respectively. The winter OP results indicated minor improvements in MRT, with reductions of 0.07 K and 0.06 K in RMSE and MAE, respectively. However, slight drawbacks were observed in GST, with an increase of 0.09 K in RMSE and 0.05 K in MAE. Moreover, the UTP results showed improvements of RMSE by 0.91 and 1.27 K, and MAE by 0.78 and 1.14 K for MRT and GST, respectively. Despite the fact that the data of soil temperatures were derived from a study conducted off-site and that the soil humidity input was left at default, the model showed improved MRT and GST outcomes in most assessment metrics. Nonetheless, summer soil temperatures were found to have a bigger impact than winter soil temperatures, as the modified values differed significantly from the default, while winter values were comparable to the defaults (especially in the top two layers). Thus, it can be concluded that integrating local relevant values of soil temperatures as initial soil condition inputs improved the model’s performance, especially in summer. As ENVI-met’s default values for materials and plants may be unsuitable for use in locations outside Germany—where the model was originally developed [42,50]—the localization of ground material, grass, and plants was also anticipated to enhance the model’s outcomes.
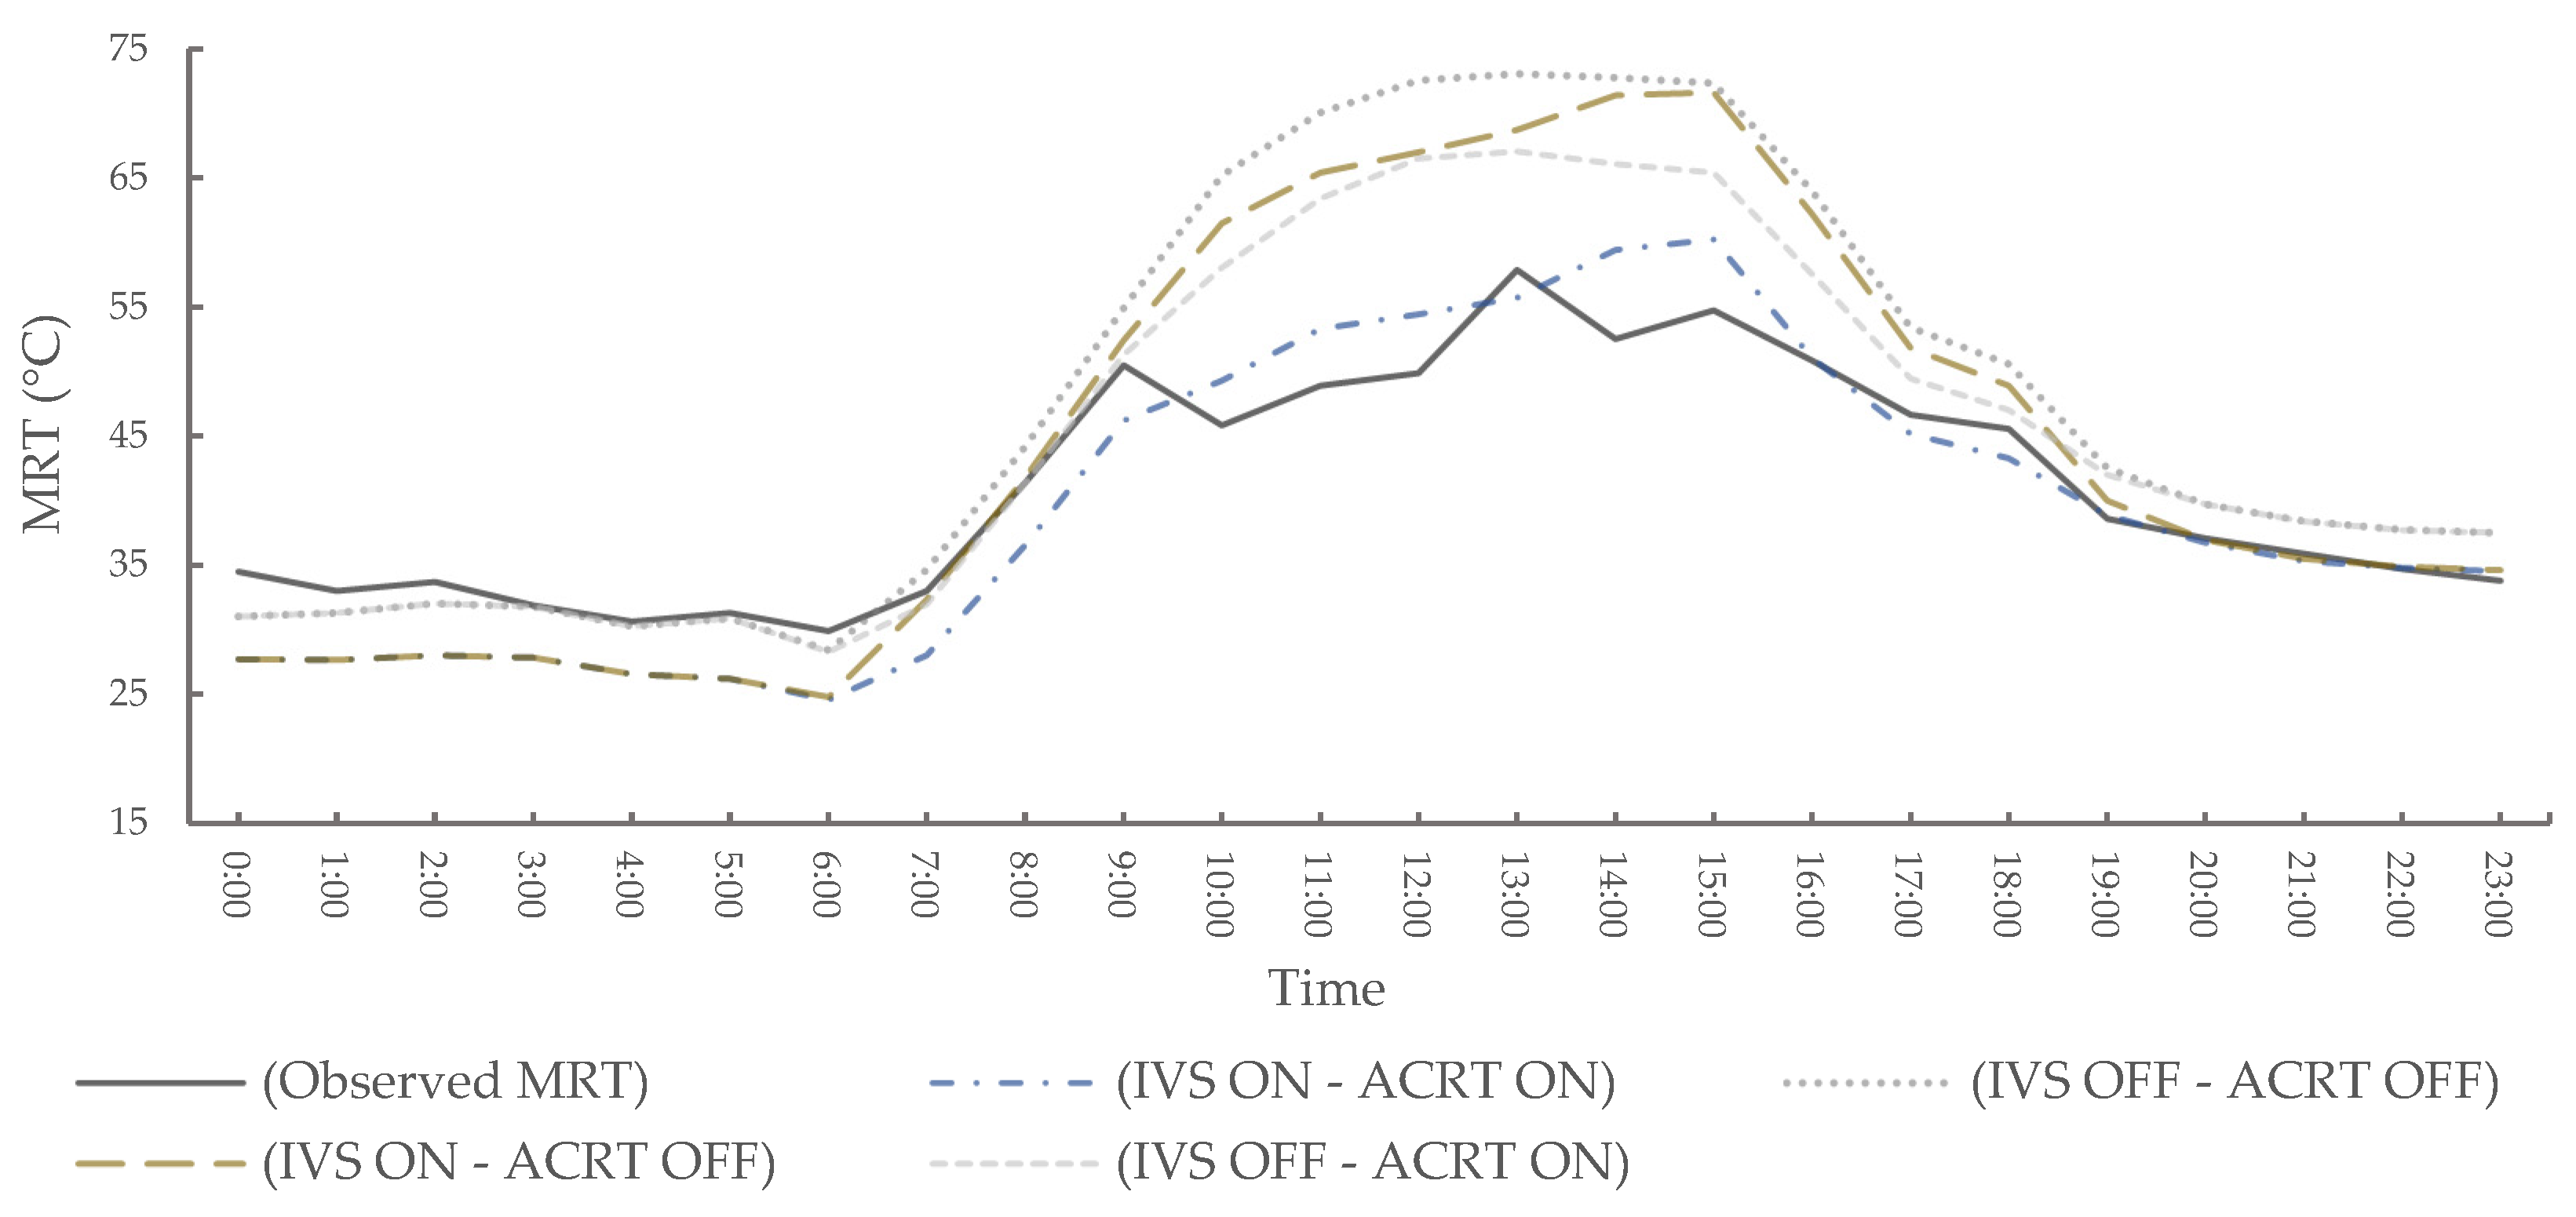
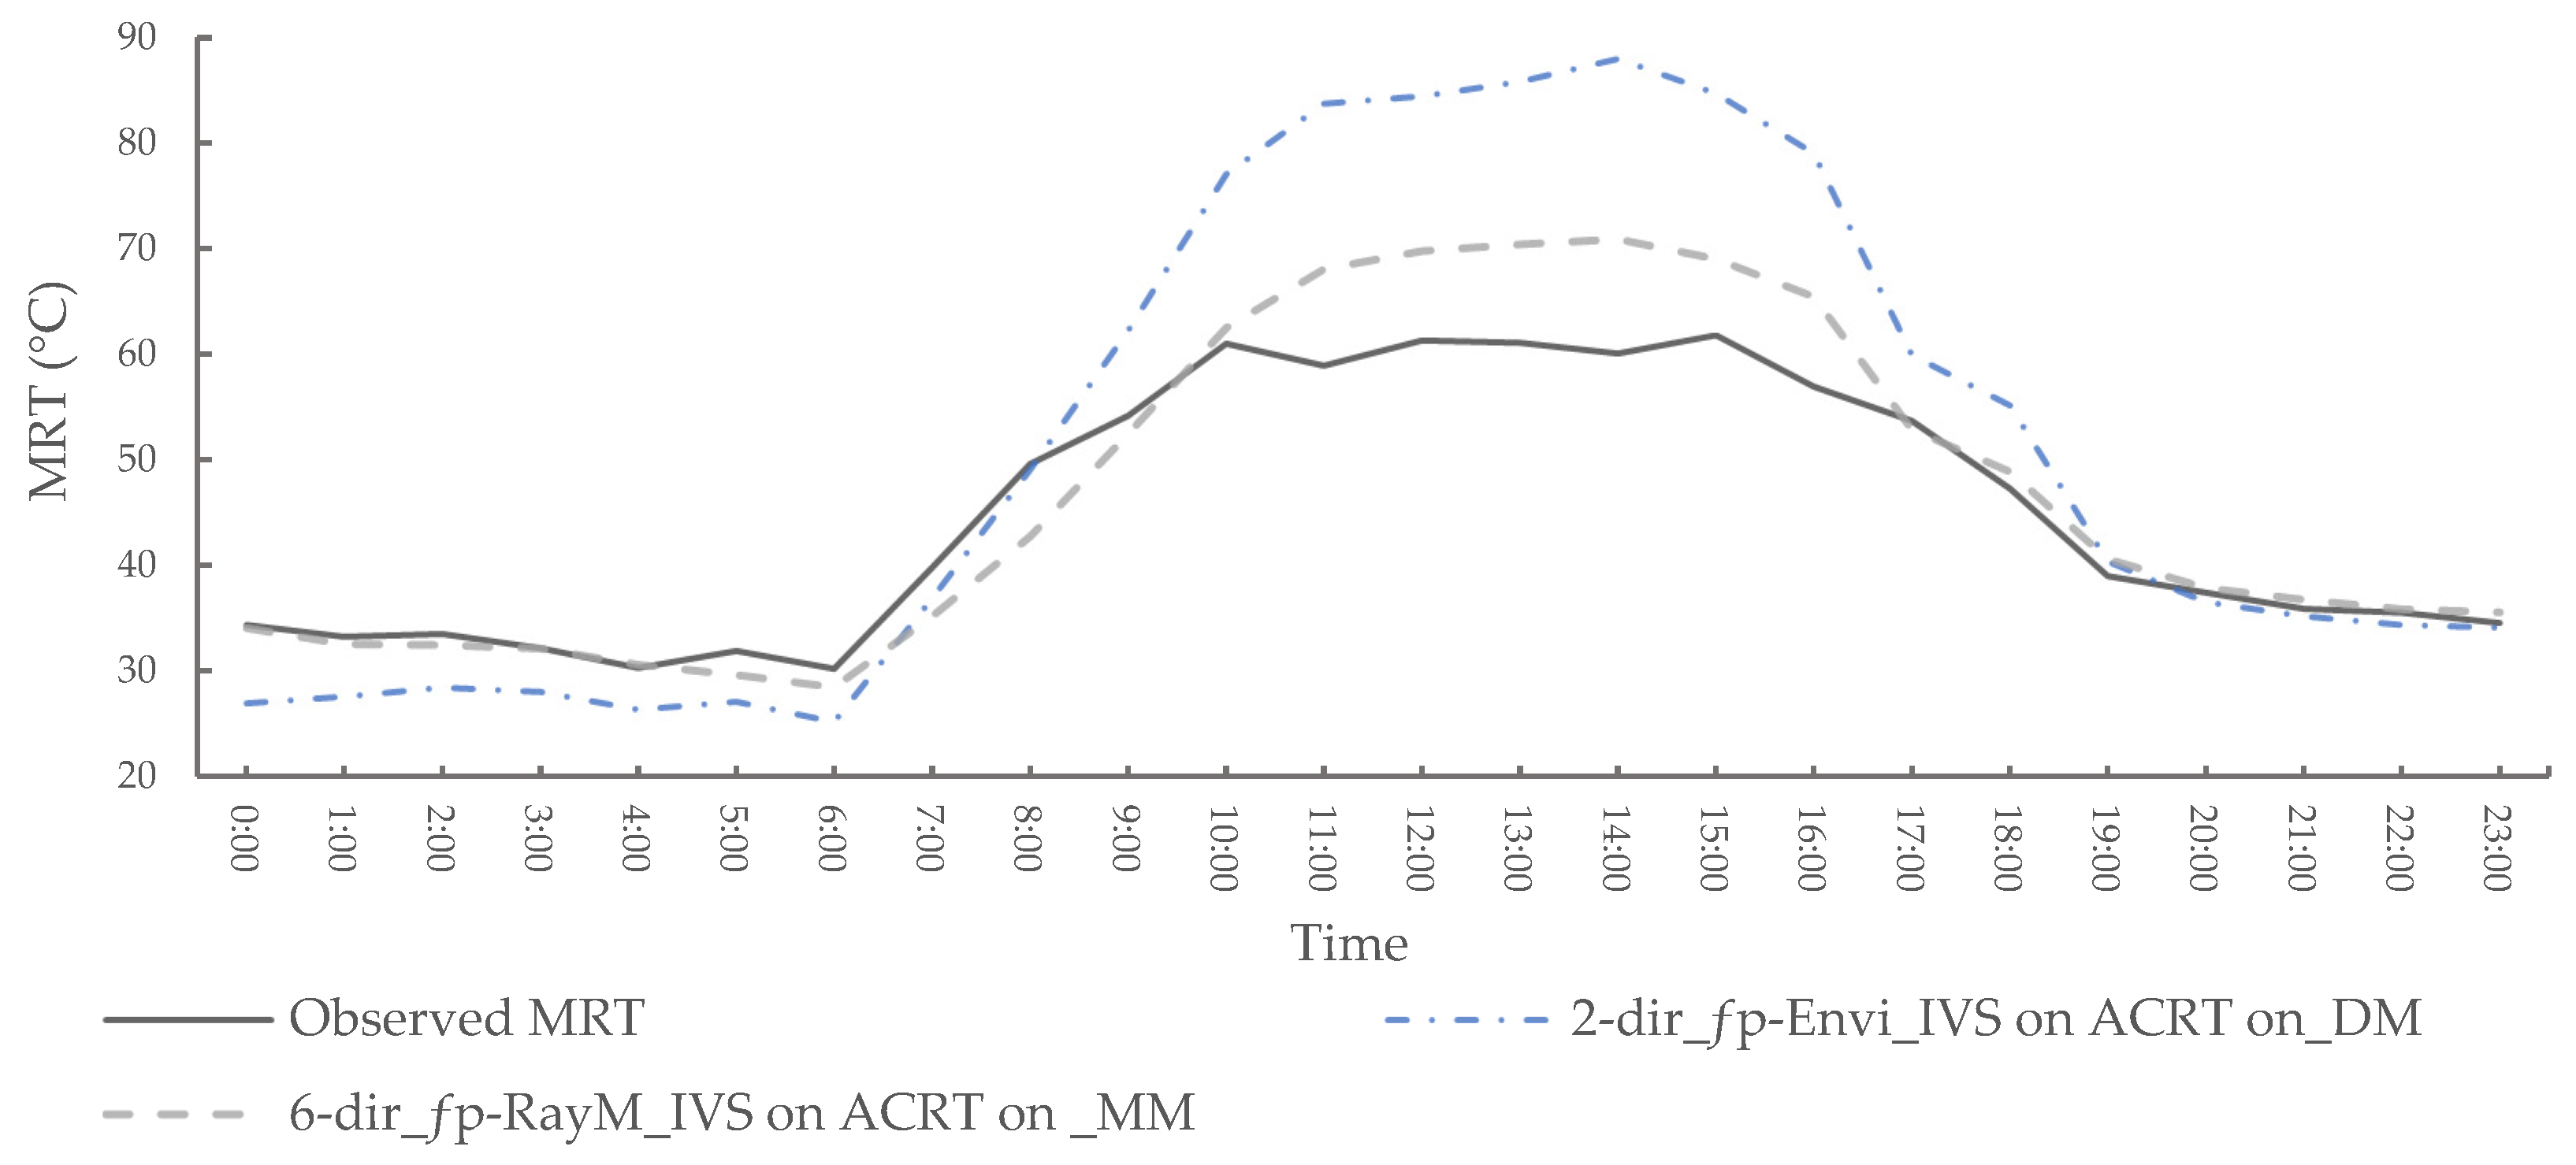
Given localization of the OP ground material, the summer analysis indicated RMSE 4.73 and 3.19 K, and MAE 3.30 and 2.26 K for MRT and GST, respectively. These results showed significant improvements in MRT and GST values, by RMSE ~8.48 K and ~8.07 K, and MAE ~6.20 K and ~8.16 K, respectively, in comparison to the worst settings addressed in this paper (see Figure 9). These results emphasize the importance of using localized soil conditions and material properties in the model. The results of our study were consistent with those published in [23,39], despite the use of different methodologies, particularly in terms of how input data such as soil conditions, materials, and vegetation details were retrieved. Moreover, the winter OP outcomes generally exhibited lower MRT agreement, in comparison to summer analysis of the same evaluation point, with RMSE 7.05 and 3.10 K, and MAE 6.33 and 2.88 K for MRT and GST, respectively. Compared to the worst model introduced in this study, these results demonstrated considerable enhancements in MRT and GST values (by RMSE ~2.31 K and ~1.50 K, and MAE ~1.79 K and ~1.13 K, respectively); see Figure 10. The model underestimated MRT significantly at night and early morning, with fluctuating results during the daytime. Given the disparities between modeled and calculated MRT, it is likely that the division of solar global radiation into direct and diffuse radiation as an input for the model in the winter study day may have been influenced by unaccounted factors. These factors could include atmospheric vapor, resulting from recent intensive rainfall that had been experienced for approximately a month prior to the winter field measurement. The water vapor in the sky and the high humidity (reaching 100%) may scatter some coming radiation and increase the amount of diffused shortwave radiation, as well as absorbing and emitting longwave radiation in the atmosphere. There is also a chance that the observed discrepancy was influenced by shade from scattered clouds or human presence that impacted one field sensor but not the other. This is evident between 15:00 and 17:00, when globe temperatures displayed flat readings, yet the global solar radiation sensor registered fluctuations (i.e., a rapid drop and increase). Therefore, the measurement of combined global radiations as well as a lack of measured longwave radiation, which forced the use of the model for computation, may have highly influenced the winter modeled MRT. To further investigate this issue, more advanced instruments are needed that are capable of calculating direct, diffuse, and reflected shortwave radiations, along with the longwave radiation emitted from surrounding materials. This would facilitate identifying the shortcomings that underlie the observed discrepancies. In general, the model’s radiative performance was improved in OP as a result of using localized material properties and the adaptation of local soil temperatures, with larger enhancements observed in the summer season.
The summertime modifications made to the ground grass and tree properties at the UTP led to an improvement in the model’s MRT and GST values. Considering the localizations made to mimic the real site, the comparison of predicted and observed values at UTP gave RMSE values of 3.18 and 4.02 K, and MAE values of 2.44 and 3.54 K for MRT and GST, respectively. These results displayed reductions of MRT and GST, compared to the worst model, by RMSE 7.30 and 0.73 K, and MAE 4.86 and 0.37 K, respectively; see Figure 11. Some discrepancies may be explained by minor errors in the Envi-met database and the overall computational constraints of modeling real detailed information [41]. These differences may result from difficulties or incomplete data when re-modeling the size, shape, and leaf distribution of trees accurately, in addition to setting up other variables such as leaf area density (LAD) and the atmospheric interaction of foliage including foliage transmittance and albedo. Other studies have shown that proper tree modeling improves the accuracy of model outcomes [41,42,44]. The comprehensive description of the vegetation characteristics, which provided helpful input data and enabled more realistic modeling of the studied location, contributed to improved MRT precision.

3.4. Final Validation of Envi-met Modeled MRT

Overall, the model’s radiative performance improved with each iterative stage through the study, highlighting the necessity of precise input data and settings that are specific to the study conditions; see Table A2. The results of modeled MRT regarding the adaptation of optimal settings in this study, including local initial soil temperatures and localized properties of materials and vegetation, are shown in Table 4.

4. Discussion

In this study, an up-to-date Envi-met version (V5.6.1) was utilized to investigate the influence of Envi-met settings and inputs on the production of accurate MRT results in the hot arid climate of Mecca city through sensitivity analyses. The findings demonstrated an improvement in model performance, achieved through sensitivity analysis, thus validating the accuracy of Envi-met. The validation of the model’s performance with respect to MRT in open and under-tree locations indicates how capable Envi-met is of modeling different microclimate conditions, as well as shading via trees as a mitigation strategy.
Most previous studies have been conducted using older versions of Envi-met, in which the model limitations that cause certain discrepancies are expected to be resolved. For example, a previous study that employed measured soil temperatures and humidity as well as albedo values for materials and green facades in Germany during summertime produced MRT accuracy in front of bare and green walls ranging from 7.98–8.30 K and 6.72–6.90 K for RMSE and MAE, respectively, [39]. However, our analysis of MRT produced lower error magnitudes of RMSE 3.18–4.73 K and MAE 2.44–3.30 K in summer UTP and OP. While employing soil temperatures and keeping soil humidity values as default in a study of reflective materials, the modeling of MRT inside a courtyard in Spain produced even higher RMSE of 7.07 K [47]. Considering the GST results, [23] attempted to evaluate the GST of concrete pavement in a summer day in Phoenix city through comparing the results of average six sun-exposed measurements conducted on a different day from the simulated day, but with similar weather conditions to the average modeled values at 15:00. The results showed very good agreement between the average measured GST for concrete pavement and the modeled value, at 56.7 °C and 57–60 °C, respectively. These results are similar to our study, which illustrated mean daily measured and modeled GST values of 46.3 °C and 44.6 °C, respectively. Compared to these previous studies which employed older versions of Envi-met (V3.1.5–V4.0), our model demonstrated a significant improvement in MRT and GST outcomes through the incorporation of localized soil condition, materials, and vegetation, as well as the newly updated settings.
As the new MRT calculation method (6-directional), the three additions of projection factors, and the new IVS/ACRT features have recently been incorporated in the model, there is a lack of studies investigating these settings. In our study, the observed pattern of values for MRT and GST demonstrated their improvement under the new settings and the localization of materials and vegetation, indicating that altering the model settings and inputs can be helpful in ensuring increased model accuracy. The conducted sensitivity analysis showed that the model performance under a similar microclimate can be improved through the new updated MRT calculation method and projection factors over the 2-dir approach and ƒp-Envi. In our case, this improvement reached reductions of 2.23 K RMSE and 1.54 K MAE in the winter open area, 5.28 K RMSE and 3.34 K MAE in the summer open area, and by 1.03 K RMSE and 0.41 K MAE in the summer under-tree area. These findings align with the conclusions drawn by [41], who stated that the new 6-dir approach yielded a substantial reduction in RMSE, reaching around 4.5 K, compared to the old 2-dir approach. While agreeing with the previous study that ƒp-Envi produced the worst MRT results in all models, the results between the other three projection factors (ƒp-RayM, ƒp-SOLW, and ƒp-City) showed minor differences. These variations are small and within the expected uncertainty/error margins. Similar findings were found by [41] which stated that (ƒp-RayM, ƒp-SOLW, and ƒp-City) reported only marginal differences. Therefore, the overall optimal projection factor cannot be determined, requiring further investigation; in particular, such studies should be carried out for more than the two days in this study. As Envi-met enables choice of the projection factor according to the purpose of the research [42], the solar altitudes and exposure of the evaluated site are key factors for its better selection. These key factors are influenced by geographical location, seasons, weather condition, and SVF, as well as the evaluated period.
Considering the four combinations of IVS/ACRT modes (IVS on/ACRT on, IVS off/ACRT off, IVS on/ACRT off, and IVS off/ACRT on), the model’s MRT results varied depending on the season and assessed site. Despite most conducted sensitivity analyses leading to improvements in the model, the MRT results in the open area evaluation encountered drawbacks when IVS and ACRT were enabled, especially in the summer. Unexpectedly, the modeled MRT of the OP showed the best results with (IVS off/ACRT on) in summer, with RMSE 6.95 K and MAE 5.54 K; while (IVS on/ACRT on) displayed RMSE of 8.43 K and MAE of 6.44 K. The winter OP results indicated that enabling or disabling IVS/ACRT had minimal impact on the MRT errors. However, these results should be interpreted with caution, as the examination of different IVS/ACRT modes was conducted prior to the implementation of localized material properties. Since the introduction of IVS was intended to enhance the modeling of reflected and emitted radiation in the model, to fully comprehend the application of Envi-met’s various (IVS/ACRT) modes in open spaces within hot arid climates, further research might be necessary. This research should involve the use of representative measured material properties and advanced instruments which are capable of capturing different types of radiation from various angles. In an assessment of Envi-met performance in Hong Kong, a research study reported that the model performed better when both the IVS and ACRT features were enabled, yielding an RMSE of 4.05 K, while turning off both features resulted in an RMSE of 9.27 K at an evaluation point devoid of trees [41]. The increased level of accuracy with the IVS feature was achieved through the use of grid-based computation for both reflected shortwave radiation and longwave radiation released by surrounding materials [41,53]. Thus, default and uncertain material properties may lead to inaccurate calculation of the reflected and emitted radiations by the model, thus affecting the evaluation of the new features (IVS/ACRT), especially in an open area. The same study found that the optimal configuration of (IVS on/ACRT on) improved MRT predictions for an under-tree evaluation area with RMSE of 1.64 K, in comparison to disabling both IVS and ACRT, which resulted in RMSE of 20.75 K [41]. These results are in alignment with ours in UTP, which showed the best model performance when enabling IVS and ACRT as RMSE 4.10 K and MAE 3.48 K, while disabling both IVS and ACRT exhibited the worst results of RMSE 10.48 K and MAE 7.30 K. The consistency of results for the under-tree evaluation point may be attributed to the foliage albedo of the plants replicating those of the real tree at the study site. Overall, and as the model’s settings behaved differently across various tested variables and sites, certain trade-offs may have to be made in order to achieve a balanced performance when diverse locations are targeted [42].
Furthermore, the adaptation of local soil conditions, materials, and vegetation in the OP and UTP provided an overall model improvement; largely in the summer sun-exposed location. This can mostly be attributed to higher radiation affected by localized material properties and the larger disparities between introduced and default initial soil temperatures. The overall improvement of our model can be reported as MRT accuracy of RMSE 7.05 in winter OP, 4.73 in summer OP, and 3.18 in summer UTP. For comparison, a study that utilized the new IVS/ACRT modes, output intervals, and localized materials and vegetation in a diurnal cycle for six sites showed an RMSE of 5.79 K in the under-tree evaluation site and RMSE of 5.74 K in an exposed evaluation site [42]. A follow-up study that used higher resolution and enhanced model details obtained an RMSE of 1.64 K and 3.66 K for the under-tree and the open evaluation sites, respectively, [41]. It must be pointed out that the two studies examined MRT values during daytime in a subtropical climate and used a more advanced measuring technique—the six-directional shortwave and longwave radiation method—in order to estimate MRT at the site. These two different methods of calculating MRT—globe temperature and 6-dir radiations measurements—may result in discrepancies [34,69]. However, the main findings of this study indicate that appropriate settings depending on the study conditions can improve the model’s outcomes with regard to MRT. The model radiative performance can also be enhanced significantly through using more detailed inputs that mimic the investigated site.

5. Limitations

For the model in this study, the inputs of diffuse and direct shortwave radiation were calculated from measured global radiation, while longwave radiation was left for the model to assume based on the location, weather, and model configuration. Thus, more accurate input radiation data, such as longwave, diffuse, and direct shortwave radiation, could be useful to account for actual weather conditions and avoid the need for estimation. Moreover, it is anticipated that observed MRT values, which were calculated from the data obtained from the Kestrel device, will be underestimated in the early morning and at night and overestimated in the middle of the day [9,33,34]. Subsequently, the instrument utilized in this study may have contributed to the error observed in the MRT, which might have been more accurate if more advanced devices were employed in the field study. Furthermore, the material properties, emissivity, and albedo were not specifically measured at the site. The lack of soil condition, temperature, and humidity data in Mecca city led to the consideration of averaged data from a local study, which was conducted around 1000 km away from the study site. Considering such limitations, the model produced very good results with regard to the MRT values.

6. Conclusions

This study was conducted to assess the performance of Envi-met modeling in the hot arid climate of Mecca city, with a focus on sensitivity analyses of the recent model updates, as well as localized material and vegetation properties. The sensitivity analyses involved the old two-directional and new six-directional MRT calculation methods, four projection factors (ƒp-Envi, ƒp-RayM, ƒp-SOLW, and ƒp-City), different IVS/ACRT modes (on and off), and material and vegetations properties (default and localized). Using two statistical criteria (RMSE and MAE), the models were assessed through comparing their results to field measurements obtained in summer and winter seasons at open and under-tree evaluation points.
In general, it can be concluded that, with the right adjustments to the settings and correct, detailed input data, the radiative performance of the model concerning MRT can be improved significantly. Envi-met provided the most accurate results when considering the 6-directional MRT calculation method, ƒp-RayM (in winter) and ƒp-City (in summer), enabling both IVS and ACRT features, and the localization of soil condition, materials, and vegetation. The new 6-directional method for calculating MRT was shown to enhance the radiative performance of ENVI-met under all examined alterations, involving four projection factors, in winter and summer seasons. Nevertheless, the projection factors behaved differently depending on sun angle and solar radiation exposure, necessitating careful consideration of the study site circumstances during the selection process. Site components, geographical location, meteorological conditions, seasons, SVF, and the targeted investigation time all had influences on the obtained results.
Concerning IVS/ACRT schemes, the analysis did not demonstrate the anticipated improvement in model accuracy for the open site, as the investigations were conducted using material default (not representative) values. Further research might be required, including the measurement of material properties and advanced instruments, in order to capture the various involved radiations. Considering the complexity of trees in the real world—especially replicating actual tree conditions or challenges related to obtaining detailed data of a tree—Envi-met succeeded to produce very good MRT results within the greenery site in summer. These results were further improved with the use of IVS/ACRT modes, as well as localization of initial soil temperatures and vegetation in the model. Moreover, the MRT and GST findings indicate that defining local soil conditions, materials, and vegetation plays a pivotal role in ensuring overall improvements in model outcomes. This means that, if at all possible, it is advisable to conduct on-site research to gather accurate material and vegetation data, rather than accepting Envi-met’s databases as absolute facts. Additionally, the model exhibited various outcomes based on the season and site-specific conditions. Thus, incorporating multiple locations within the study area as evaluation points—preferably with diverse environmental settings and Sky View Factor (SVF) ranges—is recommended to increase model reliability.
This study focused on the evaluation of MRT modeling in a hot arid climate, as it plays a significant role in outdoor thermal comfort. The findings suggested that careful attention should be paid to the settings and input data—especially radiation options and the properties of materials and vegetation—in order to improve Envi-met modeling of MRT. This research also highlighted Envi-met’s capabilities and strengths, as well as potential areas for improvement. The overall improvement of the model radiative performance and the agreement across several studies reinforces the robustness of our findings and contributes to the body of knowledge regarding Envi-met validation. Future studies could explore the model’s new features in different climates, night-time modeling, and the impacts of model settings (including the starting time and duration) on different variable outcomes.

Author Contributions

Conceptualization, M.G. and A.A.; methodology, M.G. and A.A.; software, A.A.; validation, A.A.; formal analysis, A.A.; investigation, A.A.; resources, A.A.; data curation, A.A.; writing—original draft preparation, A.A.; writing—review and editing, M.G. and A.A.; visualization, A.A.; supervision, M.G.; project administration, A.A.; funding acquisition, A.A. All authors have read and agreed to the published version of the manuscript.

Funding

This research received no external funding.

Data Availability Statement

The data that support the findings of this study are available from the corresponding author, A.A., upon reasonable request.

Acknowledgments

The first author gratefully acknowledges the support of the Saudi Arabian Cultural Bureau (SACB) in the United Kingdom and the scholarship provided by Umm Al-Qura University.

Conflicts of Interest

The authors declare no conflicts of interest.

Appendix A

Table A1. MRT validation results of Envi-met in previous studies and in this study. The columns give the analyzed time period, location, climate classification (Cfb: temperate climate, Cfa: humid subtropical climate, Csa: Mediterranean climate, BWh: hot arid climate, Aw: tropical savanna climate, Af: tropical wet climate), Envi-met version used in the validation, and the available applied metrics (R2, d, RMSE, and MAE).
Study (Time)Location (Climate Classification)VersionMRT
RMSE (K)MAE (K)
This study
(15 January and 18 July 2023) (from 00:00 to 23:00)
Mecca, Saudi Arabia
(BWh)
V5.6.1winter
Open area
7.05

Summer
Open area
4.73
Under-tree
3.18
winter
Open area
6.33

Summer
Open area
3.30
Under-tree
2.44
[41]
(11 September 2019) (from 09:30 to 17:30)
Hong Kong, China
(Cfa)
Shaded (tree)
1.64
Unshaded
3.66
[47]
(14 August 2018) (from 00:00 to 00:00)
Seville, Spain
(Csa)
V4.4.57.07
[42]
(11 September 2019) (from 09:00 to 17:30)
Hong Kong, China
(Cfa)
V4.4.65.74–9.08
Shaded (tree)
5.79
Unshaded
5.74
4.34–8.18
Shaded (tree)
5.55
Unshaded
4.34
[33]
(24 October 2014, 18 February, 23 March, 20 June 2015, 21 June 2017) (from 03:00 to 03:00)
Phoenix, AZ, USA
(BWh)
V4.311.17–16.19.66–12.82
[36]
(7–8 August 2016) (from 18:00 to 20:00)
Szeged, Hungary
(Cfb)
V4.4.26.926.26
[16]
(7, 8, 19, and 20 July, and 4 August 2016, 27 January, and 2 February 2017) (Different timing)
Hannover, Germany
(Cfb)
V4.1.0Inside courtyard
2.19–8.44
[43]
(23 August, 15 and 17 October 2016) (24 h)
Hong Kong, China
(Cfa)
V4Shaded (tree)
2.2
Unshaded
3.9
[44]
(16 August 2016, and 14 January 2017) (from 09:00 to 18:00)
Wuhan, China
(Cfa)
V4.0Summer
5.21
Winter
5.03
Summer
4.82
Winter
4.71
[37]
(6–8 August 2010) (Different timing)
Bilbao, Spain
(Cfb)
V4.0 7.42–19.026.44–15.81
[50]
(1, 8 and 15 October 2012, 29 January, 2 February, 21 24, and 28 July 2013)
(Daytime from 06:30 to 18:00)
(Nighttime from 18:00 to 06:00)
Telok Kurau, Singapore
(Af)
V3.1Daytime
6.44–14.1
Night-time
4.29–9.18
Daytime
5.01–12.7
Night-time
4.22–9.08
[29]
(18 July 2014) (24 h)
Rome, Italy
(Csa)
V3.13.86
[45]
(5 August 2015) (from 10:00 to 22:00)
Hong Kong, China
(Cfa)
V4.05.705.07
[38]
(27–29 July 2009) (35 h)
Freiburg, Germany
(Cfb)
V45.49
[46]
(6 and 13 February, 21 June, 7 August, and 3 October 2014)
Rome, Italy
(Csa)
V3.1 2.79
[39]
(23 July 2013) (from 00:00 to 23:00)
Berlin, Germany
(Cfb)
V3.1.5 (simple)
V4.0 (simple)
V4.0 (forced)
7.98
8.30
8.18
6.72
6.90
6.87
Table A2. The overall MRT statistical results for all investigated settings and inputs in both seasons and evaluation points.
SeasonStudied VariablesSettings and InputOpen Point (OP)
2-Directional Calculation (2-Dir.)/6-Directional Calculation (6-Dir.)Projection Factor
(ƒp-Envi, ƒp-SOLW, ƒp-RayM, ƒp-City)
IVS/ACRTDefault Soil (DS)/Modified Soil (MS)Default Material (DM)/Modified Material and Vegetation (MM)RMSEMAE
Winter2- and 6-Dir. and projection factors2-Dir.ƒp-EnviOn/OnDSDM9.368.12
2-Dir.ƒp-SOLWOn/OnDSDM8.497.57
2-Dir.ƒp-RayMOn/OnDSDM8.357.50
2-Dir.ƒp-CityOn/OnDSDM8.477.51
6-Dir.ƒp-EnviOn/OnDSDM7.586.98
6-Dir.ƒp-SOLWOn/OnDSDM7.216.64
6-Dir.ƒp-RayMOn/OnDSDM7.146.58
6-Dir.ƒp-CityOn/OnDSDM7.246.68
(IVS/ACRT) modes6-Dir.ƒp-RayMOn/OnDSDM7.146.58
6-Dir.ƒp-RayMOff/OffDSDM7.076.42
6-Dir.ƒp-RayMOn/OffDSDM7.166.61
6-Dir.ƒp-RayMOff/OnDSDM7.096.38
Default and Localization6-Dir.ƒp-RayMOn/OnDSDM7.146.58
6-Dir.ƒp-RayMOn/OnMSDM7.076.52
6-Dir.ƒp-RayMOn/OnMSMM7.056.33
Summer2 and 6 Dir. and projection factors2-Dir.ƒp-EnviOn/OnDSDM13.219.50
2-Dir.ƒp-SOLWOn/OnDSDM12.428.97
2-Dir.ƒp-RayMOn/OnDSDM12.268.86
2-Dir.ƒp-CityOn/OnDSDM11.738.54
6-Dir.ƒp-EnviOn/OnDSDM9.227.04
6-Dir.ƒp-SOLWOn/OnDSDM8.576.53
6-Dir.ƒp-RayMOn/OnDSDM8.436.44
6-Dir.ƒp-CityOn/OnDSDM7.936.16
(IVS/ACRT) modes6-Dir.ƒp-RayMOn/OnDSDM8.436.44
6-Dir.ƒp-RayMOff/OffDSDM7.255.70
6-Dir.ƒp-RayMOn/OffDSDM8.696.59
6-Dir.ƒp-RayMOff/OnDSDM6.955.54
Default and Localization6-Dir.ƒp-RayMOn/OnDSDM8.436.44
6-Dir.ƒp-RayMOn/OnMSDM8.265.18
6-Dir.ƒp-RayMOn/OnMSMM4.733.30
Under-Tree Point (UTP)
2 and 6 Dir. and projection factors2-Dir.ƒp-EnviOn/OnDSDM5.083.85
2-Dir.ƒp-SOLWOn/OnDSDM4.843.76
2-Dir.ƒp-RayMOn/OnDSDM4.783.75
2-Dir.ƒp-CityOn/OnDSDM4.693.69
6-Dir.ƒp-EnviOn/OnDSDM4.203.47
6-Dir.ƒp-SOLWOn/OnDSDM4.143.50
6-Dir.ƒp-RayMOn/OnDSDM4.103.48
6-Dir.ƒp-CityOn/OnDSDM4.053.44
(IVS/ACRT) modes6-Dir.ƒp-RayMOn/OnDSDM4.103.48
6-Dir.ƒp-RayMOff/OffDSDM10.487.30
6-Dir.ƒp-RayMOn/OffDSDM8.986.58
6-Dir.ƒp-RayMOff/OnDSDM6.904.76
Default and Localization6-Dir.ƒp-RayMOn/OnDSDM4.103.48
6-Dir.ƒp-RayMOn/OnMSDM3.212.70
6-Dir.ƒp-RayMOn/OnMSMM3.182.44

References

  1. United-Nations. UN-Habitat, 2022, The World Cities Report 2022: Envisaging the Future of Cities; United-Nations: New York, NY, USA, 2022. [Google Scholar]
  2. IPCC. Summary for Policymakers. In Climate Change 2023: Synthesis Report. Contribution of Working Groups I, II and III to the Sixth Assessment Report of the Intergovernmental Panel on Climate Change; Core Writing Team, Lee, H., Romero, J., Eds.; IPCC: Geneva, Switzerland, 2023; pp. 1–34. [Google Scholar]
  3. Tsoka, S.; Tsikaloudaki, A.; Theodosiou, T. Analyzing the ENVI-met microclimate model’s performance and assessing cool materials and urban vegetation applications—A review. Sustain. Cities Soc. 2018, 43, 55–76. [Google Scholar] [CrossRef]
  4. Lai, D.; Liu, W.; Gan, T.; Liu, K.; Chen, Q. A review of mitigating strategies to improve the thermal environment and thermal comfort in urban outdoor spaces. Sci. Total Environ. 2019, 661, 337–353. [Google Scholar] [CrossRef] [PubMed]
  5. Lam, C.K.C.; Lee, H.; Yang, S.-R.; Park, S. A review on the significance and perspective of the numerical simulations of outdoor thermal environment. Sustain. Cities Soc. 2021, 71, 102971. [Google Scholar] [CrossRef]
  6. Bruse, M.; Fleer, H. Simulating surface–plant–air interactions inside urban environments with a three dimensional numerical model. Environ. Model. Softw. 1998, 13, 373–384. [Google Scholar] [CrossRef]
  7. Sailor, D.J.; Dietsch, N. The urban heat island mitigation impact screening tool (MIST). Environ. Model. Softw. 2007, 22, 1529–1541. [Google Scholar] [CrossRef]
  8. Jamei, E.; Seyedmahmoudian, M.; Horan, B.; Stojcevski, A. Verification of a bioclimatic modeling system in a growing suburb in Melbourne. Sci. Total Environ. 2019, 689, 883–898. [Google Scholar] [CrossRef] [PubMed]
  9. Johansson, E.; Thorsson, S.; Emmanuel, R.; Krüger, E. Instruments and methods in outdoor thermal comfort studies—The need for standardization. Urban Clim. 2014, 10, 346–366. [Google Scholar] [CrossRef]
  10. Chen, L.; Ng, E. Outdoor thermal comfort and outdoor activities: A review of research in the past decade. Cities 2012, 29, 118–125. [Google Scholar] [CrossRef]
  11. Envi-met. ENVI-met 3.1 Manual Contents. 2022. Available online: https://envi-met.info/documents/onlinehelpv3/cnt.htm (accessed on 15 May 2022).
  12. Bruse, M. Modelling and strategies for improved urban climates. In Proceedings of the International Conference on Urban Climatology & International Congress of Biometeorology, Sydney, Australia, 8–12 November 1999. [Google Scholar]
  13. Simon, H.; Lindén, J.; Hoffmann, D.; Braun, P.; Bruse, M.; Esper, J. Modeling transpiration and leaf temperature of urban trees—A case study evaluating the microclimate model ENVI-met against measurement data. Landsc. Urban Plan. 2018, 174, 33–40. [Google Scholar] [CrossRef]
  14. Detommaso, M.; Costanzo, V.; Nocera, F. Application of weather data morphing for calibration of urban ENVI-met microclimate models. Results and critical issues. Urban Clim. 2021, 38, 100895. [Google Scholar] [CrossRef]
  15. Mao, J. Automatic Calibration of an Urban Microclimate Model under Uncertainty; Massachusetts Institute of Technology: Cambridge, MA, USA, 2018. [Google Scholar]
  16. Forouzandeh, A. Numerical modeling validation for the microclimate thermal condition of semi-closed courtyard spaces between buildings. Sustain. Cities Soc. 2018, 36, 327–345. [Google Scholar] [CrossRef]
  17. Salata, F.; Golasi, I.; Vollaro, A.d.L.; Vollaro, R.d.L. How high albedo and traditional buildings’ materials and vegetation affect the quality of urban microclimate. A case study. Energy Build. 2015, 99, 32–49. [Google Scholar] [CrossRef]
  18. Gachkar, D.; Taghvaei, S.H.; Norouzian-Maleki, S. Outdoor thermal comfort enhancement using various vegetation species and materials (case study: Delgosha Garden, Iran). Sustain. Cities Soc. 2021, 75, 103309. [Google Scholar] [CrossRef]
  19. Abdallah, A.S.H.; Hussein, S.W.; Nayel, M. The impact of outdoor shading strategies on student thermal comfort in open spaces between education building. Sustain. Cities Soc. 2020, 58, 102124. [Google Scholar] [CrossRef]
  20. Zhao, Q.; Sailor, D.J.; Wentz, E.A. Impact of tree locations and arrangements on outdoor microclimates and human thermal comfort in an urban residential environment. Urban For. Urban Green. 2018, 32, 81–91. [Google Scholar] [CrossRef]
  21. Ng, E.; Chen, L.; Wang, Y.; Yuan, C. A study on the cooling effects of greening in a high-density city: An experience from Hong Kong. Build. Environ. 2012, 47, 256–271. [Google Scholar] [CrossRef]
  22. Zölch, T.; Rahman, M.A.; Pfleiderer, E.; Wagner, G.; Pauleit, S. Designing public squares with green infrastructure to optimize human thermal comfort. Build. Environ. 2019, 149, 640–654. [Google Scholar] [CrossRef]
  23. Middel, A.; Häb, K.; Brazel, A.J.; Martin, C.A.; Guhathakurta, S. Impact of urban form and design on mid-afternoon microclimate in Phoenix Local Climate Zones. Landsc. Urban Plan. 2014, 122, 16–28. [Google Scholar] [CrossRef]
  24. Perini, K.; Magliocco, A. Effects of vegetation, urban density, building height, and atmospheric conditions on local temperatures and thermal comfort. Urban For. Urban Green. 2014, 13, 495–506. [Google Scholar] [CrossRef]
  25. Morakinyo, T.E.; Kong, L.; Lau, K.K.-L.; Yuan, C.; Ng, E. A study on the impact of shadow-cast and tree species on in-canyon and neighborhood’s thermal comfort. Build. Environ. 2017, 115, 1–17. [Google Scholar] [CrossRef]
  26. Nasrollahi, N.; Namazi, Y.; Taleghani, M. The effect of urban shading and canyon geometry on outdoor thermal comfort in hot climates: A case study of Ahvaz, Iran. Sustain. Cities Soc. 2021, 65, 102638. [Google Scholar] [CrossRef]
  27. Fahed, J.; Kinab, E.; Ginestet, S.; Adolphe, L. Impact of urban heat island mitigation measures on microclimate and pedestrian comfort in a dense urban district of Lebanon. Sustain. Cities Soc. 2020, 61, 102375. [Google Scholar] [CrossRef]
  28. Cruz, J.A.; Blanco, A.C.; Garcia, J.J.; Santos, J.A.; Moscoso, A.D. Evaluation of the cooling effect of green and blue spaces on urban microclimate through numerical simulation: A case study of Iloilo River Esplanade, Philippines. Sustain. Cities Soc. 2021, 74, 103184. [Google Scholar] [CrossRef]
  29. Salata, F.; Golasi, I.; Petitti, D.; de Lieto Vollaro, E.; Coppi, M.; de Lieto Vollaro, A. Relating microclimate, human thermal comfort and health during heat waves: An analysis of heat island mitigation strategies through a case study in an urban outdoor environment. Sustain. Cities Soc. 2017, 30, 79–96. [Google Scholar] [CrossRef]
  30. Mushtaha, E.; Shareef, S.; Alsyouf, I.; Mori, T.; Kayed, A.; Abdelrahim, M.; Albannay, S. A study of the impact of major Urban Heat Island factors in a hot climate courtyard: The case of the University of Sharjah, UAE. Sustain. Cities Soc. 2021, 69, 102844. [Google Scholar] [CrossRef]
  31. Taleghani, M. Outdoor thermal comfort by different heat mitigation strategies—A review. Renew. Sustain. Energy Rev. 2018, 81, 2011–2018. [Google Scholar] [CrossRef]
  32. Elnabawy Mahgoub, M.H.K.M. Assessment of Thermal and Visual Micro-Climate of a Traditional Commercial Street in a Hot Arid Climate; Newcastle University: Newcastle upon Tyne, UK, 2016. [Google Scholar]
  33. Crank, P.J.; Middel, A.; Wagner, M.; Hoots, D.; Smith, M.; Brazel, A. Validation of seasonal mean radiant temperature simulations in hot arid urban climates. Sci. Total Environ. 2020, 749, 141392. [Google Scholar] [CrossRef]
  34. Thorsson, S.; Lindberg, F.; Eliasson, I.; Holmer, B. Different methods for estimating the mean radiant temperature in an outdoor urban setting. Int. J. Climatol. 2007, 27, 1983–1993. [Google Scholar] [CrossRef]
  35. Acero, J.A.; Herranz-Pascual, K. A comparison of thermal comfort conditions in four urban spaces by means of measurements and modelling techniques. Build. Environ. 2015, 93, 245–257. [Google Scholar] [CrossRef]
  36. Gál, C.V.; Kántor, N. Modeling mean radiant temperature in outdoor spaces, A comparative numerical simulation and validation study. Urban Clim. 2020, 32, 100571. [Google Scholar] [CrossRef]
  37. Acero, J.A.; Arrizabalaga, J. Evaluating the performance of ENVI-met model in diurnal cycles for different meteorological conditions. Theor. Appl. Climatol. 2018, 131, 455–469. [Google Scholar] [CrossRef]
  38. Lee, H.; Mayer, H.; Chen, L. Contribution of trees and grasslands to the mitigation of human heat stress in a residential district of Freiburg, Southwest Germany. Landsc. Urban Plan. 2016, 148, 37–50. [Google Scholar] [CrossRef]
  39. Jänicke, B.; Meier, F.; Hoelscher, M.-T.; Scherer, D. Evaluating the effects of façade greening on human bioclimate in a complex urban environment. Adv. Meteorol. 2015, 2015, 747259. [Google Scholar] [CrossRef]
  40. Chen, Y.-C.; Lin, T.-P.; Matzarakis, A. Comparison of mean radiant temperature from field experiment and modelling: A case study in Freiburg, Germany. Theor. Appl. Climatol. 2014, 118, 535–551. [Google Scholar] [CrossRef]
  41. Sinsel, T.; Simon, H.; Ouyang, W.; dos Santos Gusson, C.; Shinzato, P.; Bruse, M. Implementation and evaluation of mean radiant temperature schemes in the microclimate model ENVI-met. Urban Clim. 2022, 45, 101279. [Google Scholar] [CrossRef]
  42. Ouyang, W.; Sinsel, T.; Simon, H.; Morakinyo, T.E.; Liu, H.; Ng, E. Evaluating the thermal-radiative performance of ENVI-met model for green infrastructure typologies: Experience from a subtropical climate. Build. Environ. 2022, 207, 108427. [Google Scholar] [CrossRef]
  43. Morakinyo, T.E.; Lau, K.K.-L.; Ren, C.; Ng, E. Performance of Hong Kong’s common trees species for outdoor temperature regulation, thermal comfort and energy saving. Build. Environ. 2018, 137, 157–170. [Google Scholar] [CrossRef]
  44. Zhang, L.; Zhan, Q.; Lan, Y. Effects of the tree distribution and species on outdoor environment conditions in a hot summer and cold winter zone: A case study in Wuhan residential quarters. Build. Environ. 2018, 130, 27–39. [Google Scholar] [CrossRef]
  45. Zhao, T.; Fong, K. Characterization of different heat mitigation strategies in landscape to fight against heat island and improve thermal comfort in hot–humid climate (Part I): Measurement and modelling. Sustain. Cities Soc. 2017, 32, 523–531. [Google Scholar] [CrossRef]
  46. Salata, F.; Golasi, I.; de Lieto Vollaro, R.; de Lieto Vollaro, A. Urban microclimate and outdoor thermal comfort. A proper procedure to fit ENVI-met simulation outputs to experimental data. Sustain. Cities Soc. 2016, 26, 318–343. [Google Scholar] [CrossRef]
  47. Lopez-Cabeza, V.P.; Alzate-Gaviria, S.; Diz-Mellado, E.; Rivera-Gomez, C.; Galan-Marin, C. Albedo influence on the microclimate and thermal comfort of courtyards under Mediterranean hot summer climate conditions. Sustain. Cities Soc. 2022, 81, 103872. [Google Scholar] [CrossRef]
  48. Elnabawi, M.H.; Hamza, N.; Dudek, S. Numerical modelling evaluation for the microclimate of an outdoor urban form in Cairo, Egypt. HBRC J. 2019, 11, 246–251. [Google Scholar] [CrossRef]
  49. Srivanit, M.; Jareemit, D. Modeling the influences of layouts of residential townhouses and tree-planting patterns on outdoor thermal comfort in Bangkok suburb. J. Build. Eng. 2020, 30, 101262. [Google Scholar] [CrossRef]
  50. Roth, M.; Lim, V.H. Evaluation of canopy-layer air and mean radiant temperature simulations by a microclimate model over a tropical residential neighbourhood. Build. Environ. 2017, 112, 177–189. [Google Scholar] [CrossRef]
  51. Salata, F.; Golasi, I.; de Lieto Vollaro, R.; de Lieto Vollaro, A. Outdoor thermal comfort in the Mediterranean area. A transversal study in Rome, Italy. Build. Environ. 2016, 96, 46–61. [Google Scholar] [CrossRef]
  52. Simon, H.; Sinsel, T.; Bruse, M. Introduction of fractal-based tree digitalization and accurate in-canopy radiation transfer modelling to the microclimate model ENVI-met. Forests 2020, 11, 869. [Google Scholar] [CrossRef]
  53. Simon, H.; Sinsel, T.; Bruse, M. Advances in simulating radiative transfer in complex environments. Appl. Sci. 2021, 11, 5449. [Google Scholar] [CrossRef]
  54. Climate.OneBuilding. Repository of Free Climate Data for Building Performance Simulation. 12 July 2023. Available online: https://climate.onebuilding.org (accessed on 25 July 2023).
  55. Yezli, S.; Mushi, A.; Yassin, Y.; Maashi, F.; Khan, A. Knowledge, attitude and practice of pilgrims regarding heat-related illnesses during the 2017 Hajj mass gathering. Int. J. Environ. Res. Public Health 2019, 16, 3215. [Google Scholar] [CrossRef]
  56. Kang, S.; Pal, J.S.; Eltahir, E.A. Future heat stress during Muslim pilgrimage (Hajj) projected to exceed “extreme danger” levels. Geophys. Res. Lett. 2019, 46, 10094–10100. [Google Scholar] [CrossRef]
  57. Fröhlich, D.; Gangwisch, M.; Matzarakis, A. Effect of radiation and wind on thermal comfort in urban environments-Application of the RayMan and SkyHelios model. Urban Clim. 2019, 27, 1–7. [Google Scholar] [CrossRef]
  58. Matzarakis, A.; Fröhlich, D. Influence of urban green on human thermal bioclimate-application of thermal indices and micro-scale models. Proceedings of International Symposium on Greener Cities for More Efficient Ecosystem Services in a Climate Changing World 1215, Bologna, Italy, 12–15 September 2017. [Google Scholar]
  59. Matzarakis, A.; Rutz, F.; Mayer, H. Modelling radiation fluxes in simple and complex environments—Application of the RayMan model. Int. J. Biometeorol. 2007, 51, 323–334. [Google Scholar] [CrossRef] [PubMed]
  60. Matzarakis, A.; Rutz, F.; Mayer, H. Modelling radiation fluxes in simple and complex environments: Basics of the RayMan model. Int. J. Biometeorol. 2010, 54, 131–139. [Google Scholar] [CrossRef] [PubMed]
  61. Matzarakis, A.; Gangwisch, M.; Fröhlich, D. RayMan and SkyHelios model. In Urban Microclimate Modelling for Comfort and Energy Studies; Springer: Berlin/Heidelberg, Germany, 2021; pp. 339–361. [Google Scholar]
  62. Yang, X.; Zhao, L.; Bruse, M.; Meng, Q. Evaluation of a microclimate model for predicting the thermal behavior of different ground surfaces. Build. Environ. 2013, 60, 93–104. [Google Scholar] [CrossRef]
  63. Abdel-Ghany, A.M.; Al-Helal, I.M.; Alsadon, A.; Ibrahim, A.; Shady, M. Measuring and predicting the in-ground temperature profile for geothermal energy systems in the desert of arid regions. Energies 2022, 15, 7268. [Google Scholar] [CrossRef]
  64. Skartveit, A.; Olseth, J.A. A model for the diffuse fraction of hourly global radiation. Sol. Energy 1987, 38, 271–274. [Google Scholar] [CrossRef]
  65. Fischereit, J. The simple urban radiation model for estimating mean radiant temperature in idealised street canyons. Urban Clim. 2021, 35, 100694. [Google Scholar] [CrossRef]
  66. Holmer, B.; Lindberg, F.; Rayner, D.; Thorsson, S. How to transform the standing man from a box to a cylinder–a modified methodology to calculate mean radiant temperature in field studies and models. In Proceedings of the 9th International Conference on Urban Climate (ICUC9), Toulouse, France, 20–24 July 2015. [Google Scholar]
  67. Huang, J.; Cedeno-Laurent, J.G.; Spengler, J.D. CityComfort+: A simulation-based method for predicting mean radiant temperature in dense urban areas. Build. Environ. 2014, 80, 84–95. [Google Scholar] [CrossRef]
  68. Stunder, M.; Sethuraman, S. A statistical evaluation and comparison of coastal point source dispersion models. Atmos. Environ. 1986, 20, 301–315. [Google Scholar] [CrossRef]
  69. Naboni, E.; Meloni, M.; Mackey, C.; Kaempf, J. The simulation of mean radiant temperature in outdoor conditions: A review of software tools capabilities. In Proceedings of the Building Simulation Conference Proceedings, International Building Performance Simulation Association, Rome, Italy, 2–4 September 2019. [Google Scholar]
Figure 1. The study site; indicating Saudi Arabia, Mecca city, Arafat area (Google Earth), the study site (aerial image taken by Drone Pilot Husam Altalhi, Dr. Azzam Alosaimi, and the author), and photos of the measurement points.
Climate 12 00091 g001
Figure 2. Three-dimensional view of the study site created in Rhino software https://www.rhino3d.com/, utilizing data collected from the drone (left), and the modeled site in Envi-met (right).
Climate 12 00091 g002
Figure 3. The soil temperature depending on month and depth for the year 2021/2022 in Riyadh city, Saudi Arabia (from [63]).
Climate 12 00091 g003
Figure 4. The general framework of the study, where blue words represent the optimal option which was applied in the following analysis.
Climate 12 00091 g004
Figure 5. Statistical analysis of observed and modeled MRT using two evaluation metrics—RMSE (a) and MAE (b)—for winter and summer seasons, investigating the old 2-directional and new 6-directional MRT calculation methods as well as the four projection factors (ƒp-Envi, ƒp-RayM, ƒp-SOLW, and ƒp-City) in Open Point (OP) and Under-Tree Point (UTP) locations with default material and vegetations and (IVS on/ACRT on) for all models.
Climate 12 00091 g005
Figure 6. Statistical analysis of observed and modeled MRT using two evaluation metrics—RMSE (a) and MAE (b)—for winter and summer seasons, investigating different IVS and ACRT modes in Open Point (OP) and Under-Tree Point (UTP) locations with 6-directional MRT calculation approach and ƒp-RayM, as well as default materials and vegetation in all models.
Climate 12 00091 g006
Figure 7. Comparison of calculated and modeled MRT with various IVS/ACRT settings in UTP.
Climate 12 00091 g007
Figure 8. Statistical analysis of observed and modeled MRT and GST using two evaluation metrics—RMSE (a) and MAE (b)—for winter and summer seasons, investigating (default soil condition, materials, and vegetation), (localized soil condition), and (localized soil condition, materials, and vegetation) in Open Point (OP) and Under-Tree Point (UTP) locations with 6-directional MRT calculation, ƒp-RayM, and (IVS on/ACRT on) in all models.
Climate 12 00091 g008
Figure 9. Comparison of calculated MRT between worse (2-dir, ƒp-Envi, IVS on/ACRT on, Default Materials (DM)) and optimal (6-dir, ƒp-RayM, IVS on/ACRT on, Modified Materials (MM)) modeled MRT in summer OP.
Climate 12 00091 g009
Figure 10. Comparison of calculated MRT between worse (6-dir, ƒp-RayM, IVS off/ACRT off, Default Materials (DM)) and optimal (6-dir, ƒp-RayM, IVS on/ACRT on, Modified Materials (MM)) modeled MRT in summer UTP.
Climate 12 00091 g010
Figure 11. Comparison of calculated MRT between worse (2-dir, ƒp-Envi, IVS on/ACRT on, Default Materials (DM)) and optimal (6-dir, ƒp-RayM, IVS on/ACRT on, Modified Materials (MM)) modeled MRT in winter OP.
Climate 12 00091 g011
Table 1. The specifications of instruments used in the field measurements.
InstrumentParameterRangeAccuracy
Kestrel 5400
(Quantity: 2)
Air temperature−29.0 to 70.0 °C±0.5 °C
Wind speed0.6 to 40.0 m/s±0.1 m/s
Globe temperature−29.0 to 60.0 °C±1.4 °C
Relative humidity10 to 90% 25 °C non-condensing±2%
Davis Vantage Pro 2
(Quantity: 1)
Air temperature−40 °C to 65 °C±0.3 °C
Relative humidity0–100%±2%
Wind speed
Wind direction
0 to 89 m/s
1–360°
0.9 m/s or ±5%, whichever is greater
±3°
Solar radiation0 to 1800 W/m2±5% of full scale
Fluke 62 MAX plus
(Quantity: 1)
Surface temperature−30 °C to 650 °C+1.0 °C or +1.0%, whichever is greater
Table 2. Model default and localized materials and vegetation.
Model CharacteristicsInputSettings
DefaultModified
Gray cement pavementAlbedo0.300.15
Emissivity0.900.90
Thickness (m)0.040.06
GrassHeight (m)0.250.05
Leaf Area (LAD) Profile0.30 (z/h)0.30 (z/h)
TreesHeight (m)/Width (m)15.5/9.513/10
Leaf positioningOppositeAlternate
Leaf length/width0.30/0.140.10/0.03
Foliage Albedo/transmittance0.18/0.300.18/0.30
Table 3. The model general properties and input data.
SettingsInput
LocationMecca city, Saudi Arabia
Latitude: 21.25 N
Longitude: 39.80 E
Starting date14 January.2023 (winter)
17 July 2023 (summer)
Starting time23:00
Duration24 h
Meteorological boundary conditionsFull Forced mode.
Dimensions176 × 164 × 16
Resolutions (X, Y, Z) (3 × 3 × 3 m)
Lowest grid cell splitYes
Telescoping factor and starting height 25%, after 31 m
Model Rotation out of grid north 30
Initial soil temperature per layer (°C)20, 20, 19, 18
Adapted soil temperature per layer (°C)Summer: 42, 41, 38, 32
Initial soil humidity per layer (%)65, 70, 75, 75
Initial IVS:Yes
Altitude angle res.10
Azimuthal angle res.10
Height boundary10 m
Initial ACRTYes
Table 4. Statistical evaluation of Envi-met performance based on evaluated points using RMSE and MAE, indicating average results for all evaluated points and seasons.
MRTRMSEMAE
OP (winter)7.056.33
OP (Summer)4.733.30
UTP (Summer)3.182.44
Overall Mean4.994.02
Disclaimer/Publisher’s Note: The statements, opinions and data contained in all publications are solely those of the individual author(s) and contributor(s) and not of MDPI and/or the editor(s). MDPI and/or the editor(s) disclaim responsibility for any injury to people or property resulting from any ideas, methods, instructions or products referred to in the content.