Article

Analysis of Climate Risk in Panama’s Urban Areas

by
Michelle A. Ruíz
1 and
Yazmin L. Mack-Vergara
2,3,*
1
Sustainable Construction UTP Research Group, Faculty of Civil Engineering, Universidad Tecnológica de Panamá, Panama City 0819-07289, Panama
2
Sustainable Construction UTP Research Group, Experimental Center for Engineering, Universidad Tecnológica de Panamá, Panama City 0819-07289, Panama
3
Sistema Nacional de Investigación (SNI) of Panama, Panama City 0816-02852, Panama
*
Author to whom correspondence should be addressed.
Climate 2024, 12(7), 104; https://doi.org/10.3390/cli12070104
Submission received: 2 July 2024 / Accepted: 12 July 2024 / Published: 17 July 2024

Abstract

:
To mitigate the effects of climate change and increase the resilience of cities, climate risks in urban areas are crucial issues to be addressed. This study analyzes the risks, vulnerability, capacity, degree of exposure, and characteristics of the threats to Panama’s urban areas that result from climate change. Data from DesInventar—a conceptual and methodological tool developed for the construction of databases regarding losses, damages, or effects caused by emergencies or disasters—were analyzed. The main current impacts are floods, landslides, and extreme winds in that order. From 1933 to 2019, Panama recorded 1903 flood reports, 625 landslide reports, and numerous extreme wind events. The affected population totaled 527,394 people, with 101,738 homes impacted. The most affected provinces are Panama, Panama Oeste, and Chiriquí, based on the number of reports. It is expected that in the future, the current effects will increase, and the country’s energy and water security will be put at risk. Strategies to address climate change include enhancing early warning systems and investing in climate-resilient infrastructure. Key measures involve developing public policies for renewable energy and sustainable transportation, preserving ecosystems, and financial mechanisms to support a transition to a sustainable economy.

1. Introduction

Climate risks in urban areas are critical factors that need to be addressed in order to mitigate the impacts of climate change and ensure the resilience and sustainability of cities. Therefore, various sources highlight the importance of understanding these concepts, as well as their incidence and implications [1,2,3]. This is even more relevant for regions that are highly susceptible to the effects of climate change, as is the case of Panama.
By recognizing the vulnerability of the urban ecosystem and the necessity to adapt to climate change, research focus areas such as urban resilience, risk management, and sustainable development [4,5,6,7] have emerged. These research focus areas take a holistic and comprehensive approach, considering long-term strategies for building resilience in cities.
The effects of climate change in Panama are increasingly evident, manifesting in rising temperatures, changes in precipitation patterns, and the frequency of severe weather events. These changes impact various aspects of the country, such as agriculture, water resources, biodiversity, and human settlements.
In this context, improving urban resilience and sustainability is essential to seize the opportunities arising from a changing climate. However, the currently available data are irregular and highly scattered. This situation, along with adjustments to international methodologies, has complicated the establishment of a national baseline at the local level regarding the incidence of climate change.
This study analyzes the risk and characteristics of threats in urban areas of Panama due to climate change, with the aim of understanding its incidence and proposing local mitigation and adaptation measures. These measures aim to achieve resilient and sustainable cities that, in the long term, minimize the consequences of climate change and protect both the environment and the livelihoods of the population.

1.1. Understanding Climate Change: Causes and Effects

Climate change is a complex phenomenon that has multiple causes and effects [8]. To understand it better, it is necessary to define it first, so referring to the first formal definition of the term given in the United Nations Framework Convention on Climate Change [9,10], Article 1 states the following: “a climate change attributed directly or indirectly to human activity that alters the composition of the global atmosphere and which is in addition to natural climate variability observed over comparable time periods”.
Subsequently, various institutions such as the International Organization for Standardization [11] or the Intergovernmental Panel on Climate Change (IPCC) [12] have provided different definitions that maintain that climate change has been triggered by multiple factors and which effects are converging in dangerous directions, causing unprecedented negative impacts on the quality of life and stability of the population in general [13].
It can be intuited that the world is facing one of the greatest challenges of all time, with adverse impacts capable of undermining the ability of countries to achieve sustainable development [14]. People, societies, economic sectors, and ecosystems are exposed to climate variability and extreme events resulting from climate change [15,16], a fact that, over the years, has become valid with the scientific community and its agreement that the human influence on climate change is clear and increasing [17].
In this context, scientific evidence indicates that the cause of climate change is primarily the increase in anthropogenic emissions since the pre-industrial era as a result of economic and demographic growth [18]. The Climate Change 2007: Synthesis Report [19] mentions that, in the case of forcings caused by solar activity and volcanic eruptions, there is a well-established cycle of 11 years, with no important long-term trends.
With this information, it can be inferred that the causes of climate change undoubtedly come from multiple factors. The contribution of urban areas to changes in global climatic conditions is influenced by aspects such as geographical location, the demographic and economic fabric of the city, its design and population density, the change in the quality of construction, transportation, forms of electricity production, as well as the consumption patterns of the inhabitants [20]. These factors converge in dangerous directions, adding significant negative impacts on the general population’s stability and quality of life [14].
In this sense, it is indicated that the main effects of climate change can be known through certain indicators that offer a broad global overview with important information on the areas of greatest interest in relation to climate change. Therefore, various publications and scientific institutions, such as the World Meteorological Organization’s State of the Global Climate [21], reaffirmed by experts, summarize the following main effects on a global scale: the increase in the global average temperature on the earth’s surface, the increase in the heat content of the oceans, the rise in sea level on a global scale, ocean acidification, sea ice extent, increases in extreme climate events, and mass imbalance of glaciers and ice sheets.
Therefore, there is a need to understand the impacts of climate change on urban areas. Given the increasing urbanization, the management of these impacts will become increasingly important due to the fact that the consequences are not equitable. Therefore, depending on the location, there will be effects on water supply, energy supply, transport, industries, etc. This harms local economies and increases existing inequalities that will damage the social fabric of cities and further aggravate poverty [13].

1.2. Cities and Climate Change

The city is the greatest scenario for the transformation of the inhabited and experiential space in which human beings develop [22]. Therefore, since ancient times, cities have been the economic and political poles [23,24,25]. For this reason, they are considered the perfect scenario to incubate ideas and actions toward sustainable, just, and democratic solutions that lead to true social transformations.
However, cities face significant challenges ranging from exacerbated population growth, poor urban planning, infrastructure deficit, pollution, overburdened urban services, and increased vulnerability to catastrophes resulting from climate change [26]. Furthermore, there is a huge bias in terms of sensitivity in different geographical regions. In the case of Latin America and the Caribbean, 81% of its population lives in urban areas [27,28].
Governments are faced with the pragmatic challenges arising from the impacts of climate change, as they trigger alterations in human health, risks, and insecurities in the supply of energy, food, and water [29]. Therefore, the challenge of urban management is no longer to solve problems of rapid rural–urban transition but also to improve the quality of life, close inequality gaps, and achieve the resilience and sustainability of cities [27].
For its part, Panama, since its Political Constitution [30], has indicated its commitment to the conservation of the environment. Article 118 determines that the State “shall guarantee that the population lives in a healthy environment free of pollution”. Likewise, Article 119 establishes that it is the duty of the State and of all inhabitants “to promote social and economic development that prevents pollution of the environment, maintains ecological balance and avoids the destruction of ecosystems”.
Panama has made an effort to incorporate the issue of climate change into the national framework of sustainable development, which is why, since its inclusion in the United Nations Framework Convention on Climate Change [9], it has developed studies that collect data on climate variability and climate prediction scenarios that involved areas such as human health, agriculture, water resources, marine–coastal resources, and forest resources. Likewise, these studies have been updated and expanded over the years by various governmental and non-governmental institutions in order to identify and evaluate the impact of such effects throughout the national territory.

1.3. Climate Risk in Urban Areas

Significant new international agreements and initiatives have been achieved in recent years, each of which has far-reaching implications for the management of rapid urbanization and climate change. Examples of these efforts include the Paris Agreement [31]; the 2030 Agenda for Sustainable Development, including the Sustainable Development Goals (SDGs) [32]; the Sendai Framework for Disaster Risk Reduction [33]; the New Urban Agenda [34]; the Addis Ababa Action Agenda [35]; and the World Humanitarian Summit [36]. However, history is being rewritten at a speed and scale that was unimaginable in the previous century. Therefore, spearheading a change that incorporates climate change adaptation and mitigation measures in cities is essential.
In the face of this nature and severity of impacts resulting from climate change and extreme phenomena arises the risk, which the Intergovernmental Panel on Climate Change (IPCC) defines as the potential for consequences when something of value is at stake and when the outcome is uncertain, recognizing the diversity of values [37]. And that climatic terms depend not only on climate-related hazards but also on exposure (people and assets at risk) and vulnerability (susceptibility to damage) of human and natural systems [38,39]. Furthermore, it may arise from mitigation or adaptation responses to climate change when the response fails to achieve its intended objective or when it leads to adverse effects for other societal objectives.
In this sense, since the Third Assessment Report (AR3) [40], efforts began to lay the foundations in terms of assessments regarding climate variability, but it was not until the Fifth Assessment Report (AR5) [19] that a risk-based framework was introduced, focusing on three elements: hazard, vulnerability, and exposure. Thus, risk is defined as the combination of these three components and whose assessment includes various appropriate methods and metrics, where the general approach used and recommended by the IPCC is iterative risk management (Figure 1).
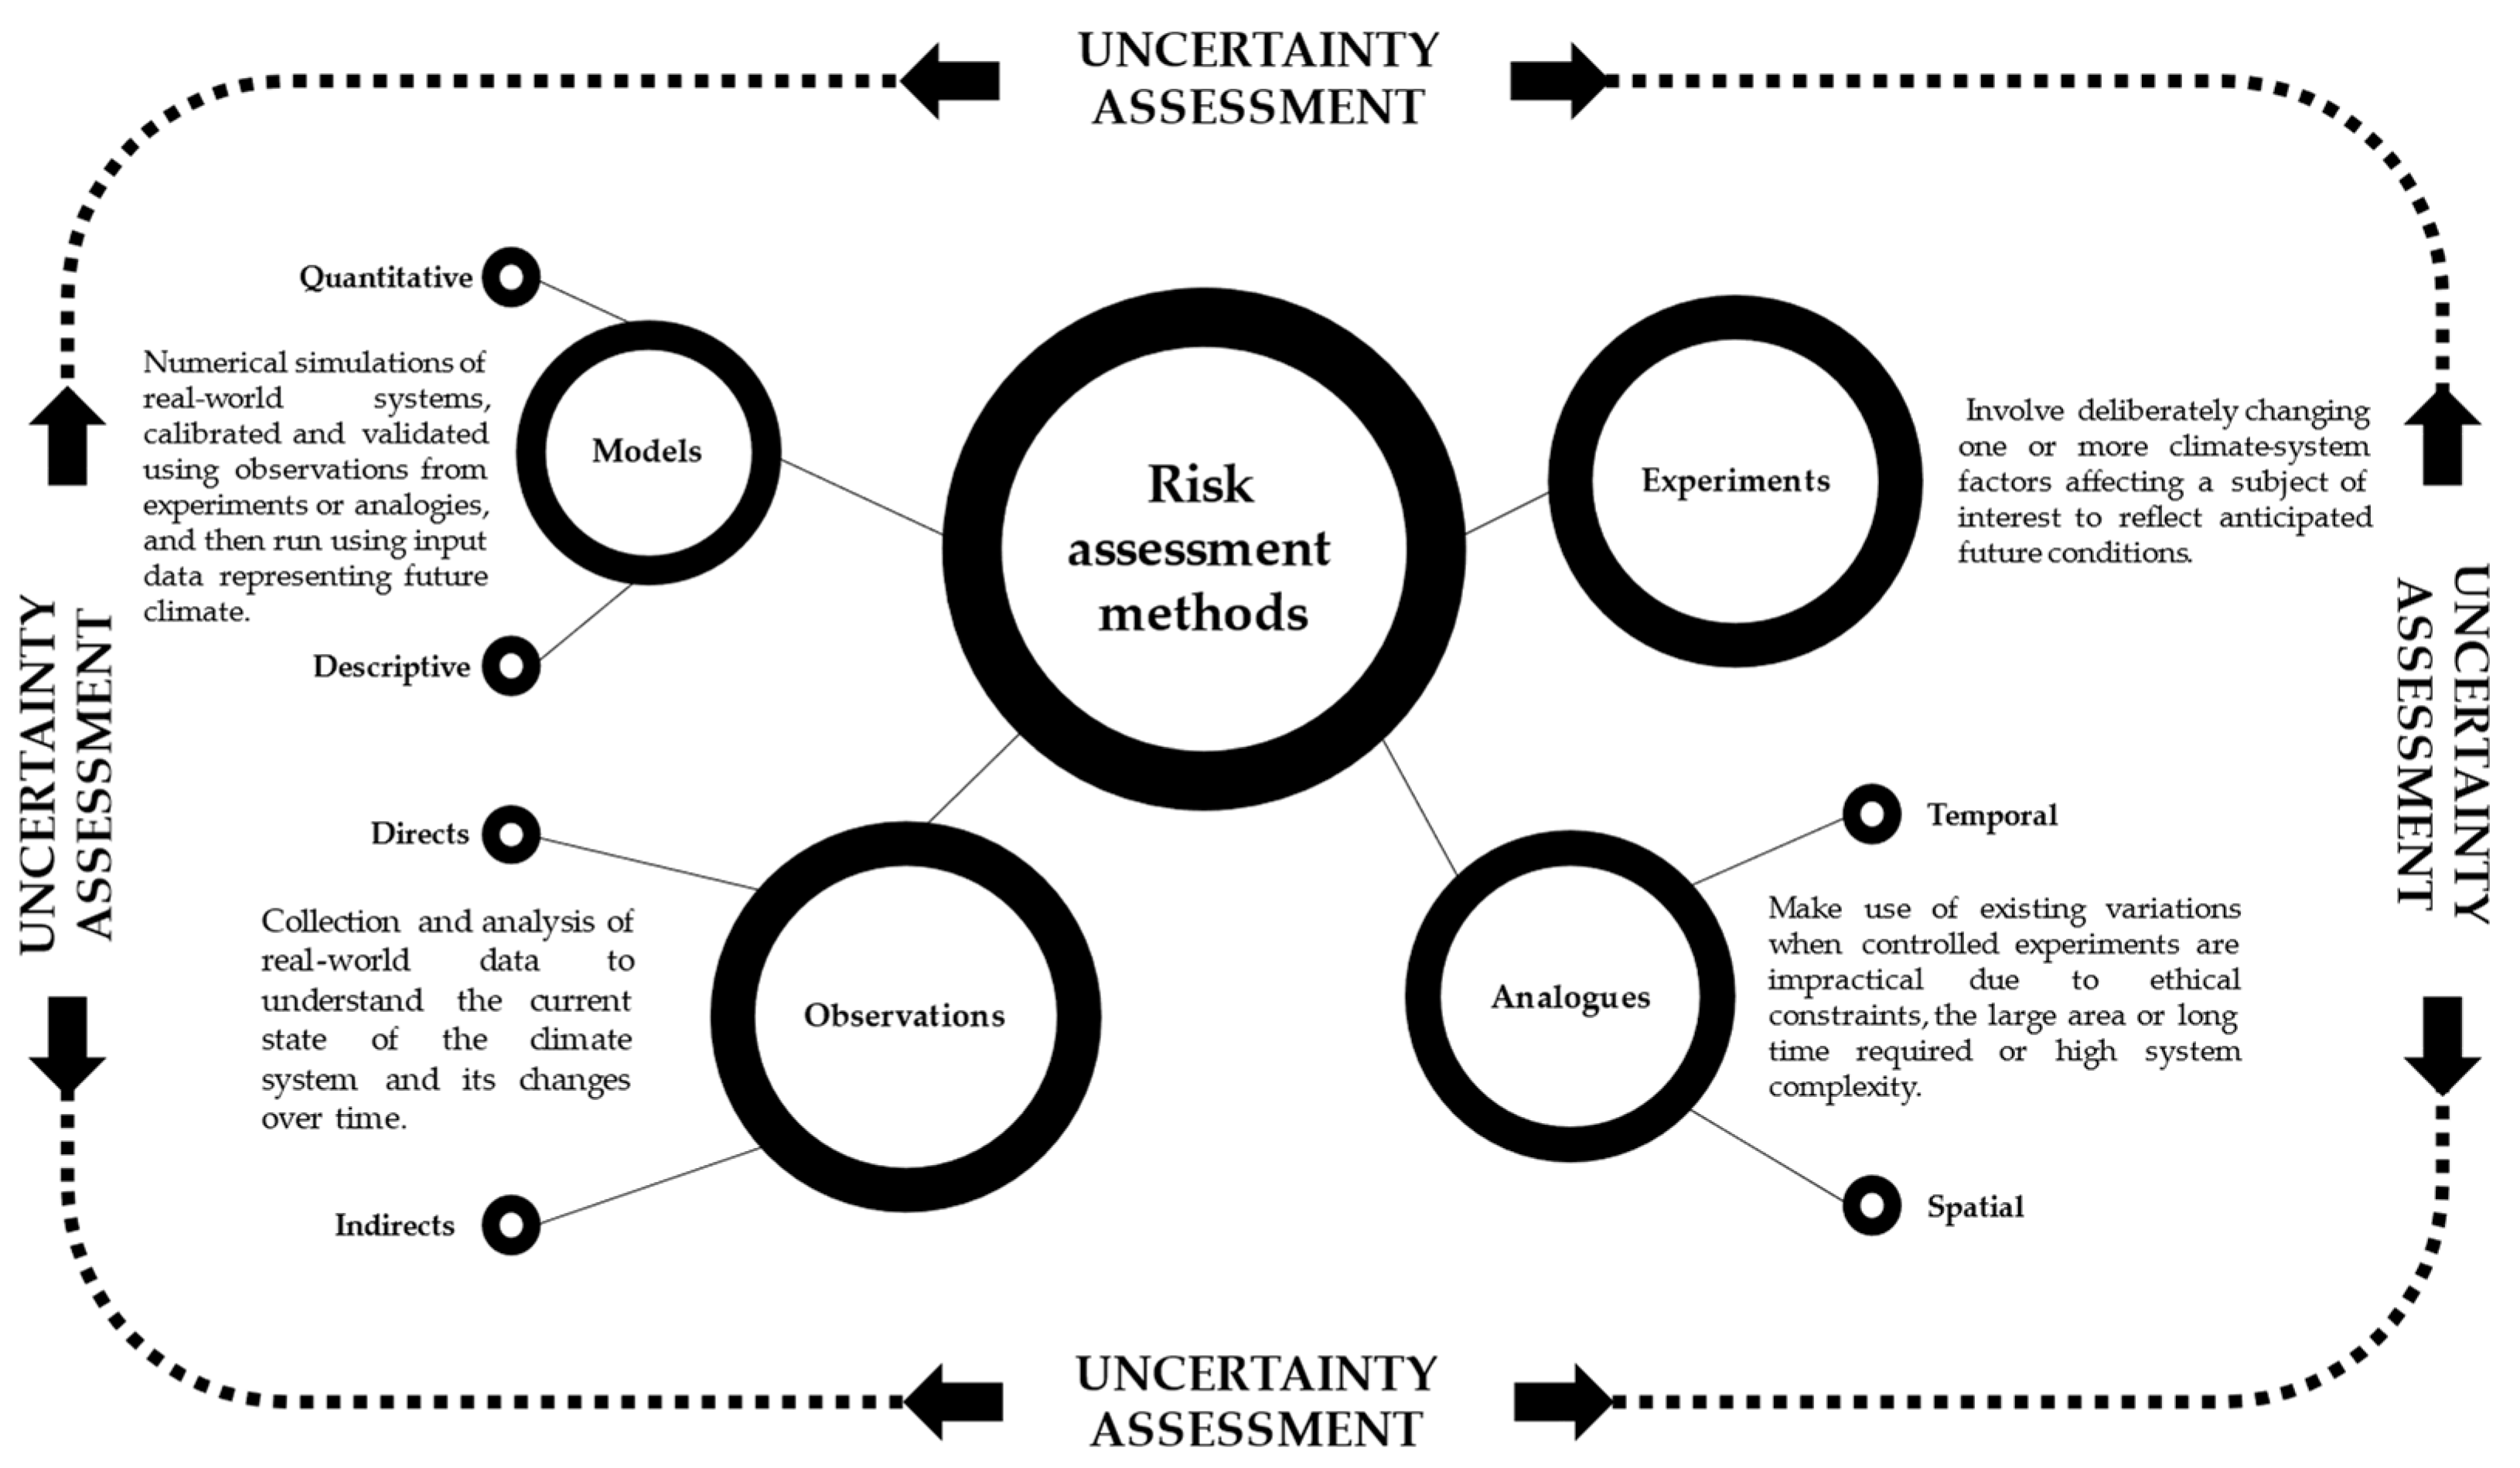
Although assessments of future climate change are integrated within and among the three IPCC Working Groups through the use of three basic components, scenarios, global warming levels, and the relationship between cumulative CO2 emissions and global warming, risk assessment can be carried out specifically through experiments, analogies, models, and observations [42] (Figure 2). In addition, the most recent assessment information, the Sixth Assessment Report, uses representative concentration pathways (RCPs) and shared socioeconomic pathways (SSP), respectively. In turn, it is important to emphasize that the degree of certainty is based on the type, quantity, quality, and consistency of evidence (e.g., data, mechanistic understanding, theory, models, and expert judgment) and the degree of agreement [19].
Hence, knowing this delimitation, its close link is identified and creates the opportunity to establish strategies to deal with the impacts of climate change and disasters that succumb to urban areas [43], specified as any region with a population of at least 1500 inhabitants that have basic service systems [44]. In such a way, the bases are generated to cover the problem from more comprehensive perspectives, such as resilience and sustainability. Urban resilience is considered the measurable capacity of any urban system to maintain continuity through all shocks and tensions while adapting positively and transforming toward sustainability. Sustainability is the application of planning, development, and construction processes that drive the protection and efficient use of natural resources [26].

2. Materials and Methods

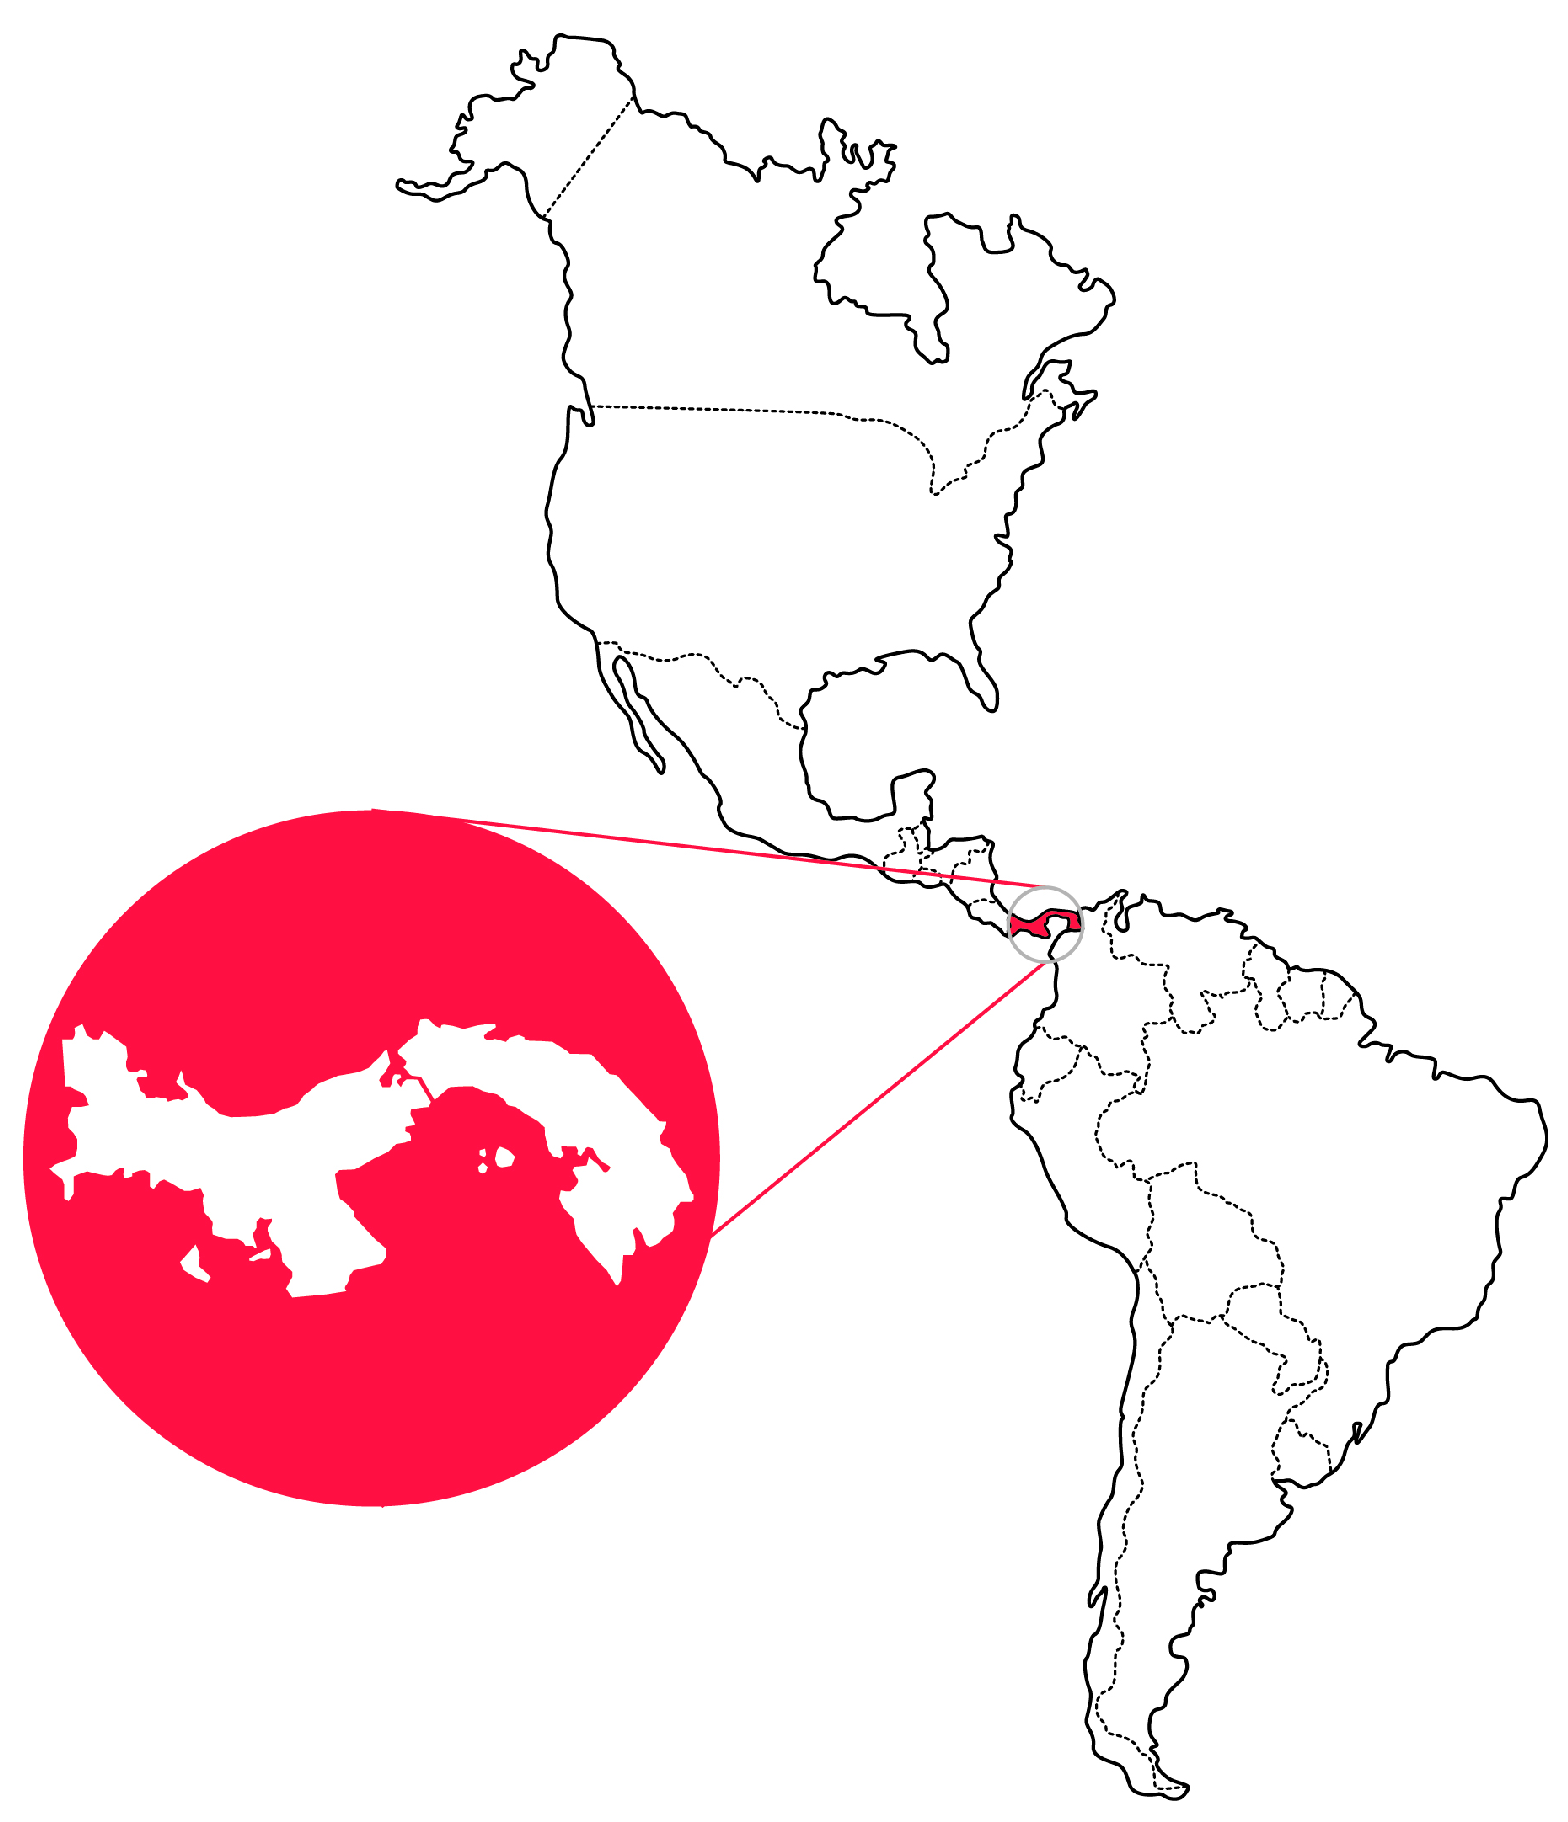
This study considered all the aspects that correspond to the typology of climate change in Panama. Panama is a country located in the intertropical zone between 8°58′ N latitude and 79°32′ W longitude (Figure 3), with a territorial extension of 75,417 km2, bordered to the north by the Caribbean Sea, to the south by the Pacific Ocean, to the east by the Republic of Colombia, and to the west by the Republic of Costa Rica [45].
The territory comprises a uniform tropical climate with average annual temperatures ranging between 23 and 27 °C, with maximums reaching up to 33 °C in coastal areas and temperatures dropping to around 16 °C at higher altitudes [46,47]. On the other hand, precipitation varies between 1500 and 3000 mm per year, with variations according to regions, topographies, and oceanic slopes; precipitation is higher on the Caribbean side compared to the Pacific slope.
Regarding the economic engine, according to reports from 2023 [48], construction, commerce, the Colon Free Zone, transportation, and electricity production were the most prominent activities. However, it is estimated that the current annual cost due to recurrent climate events ranges between B/.125 and 150 million/year (0.36% to 0.42% of GDP), which could have significant effects on Panama’s long-term growth [49].
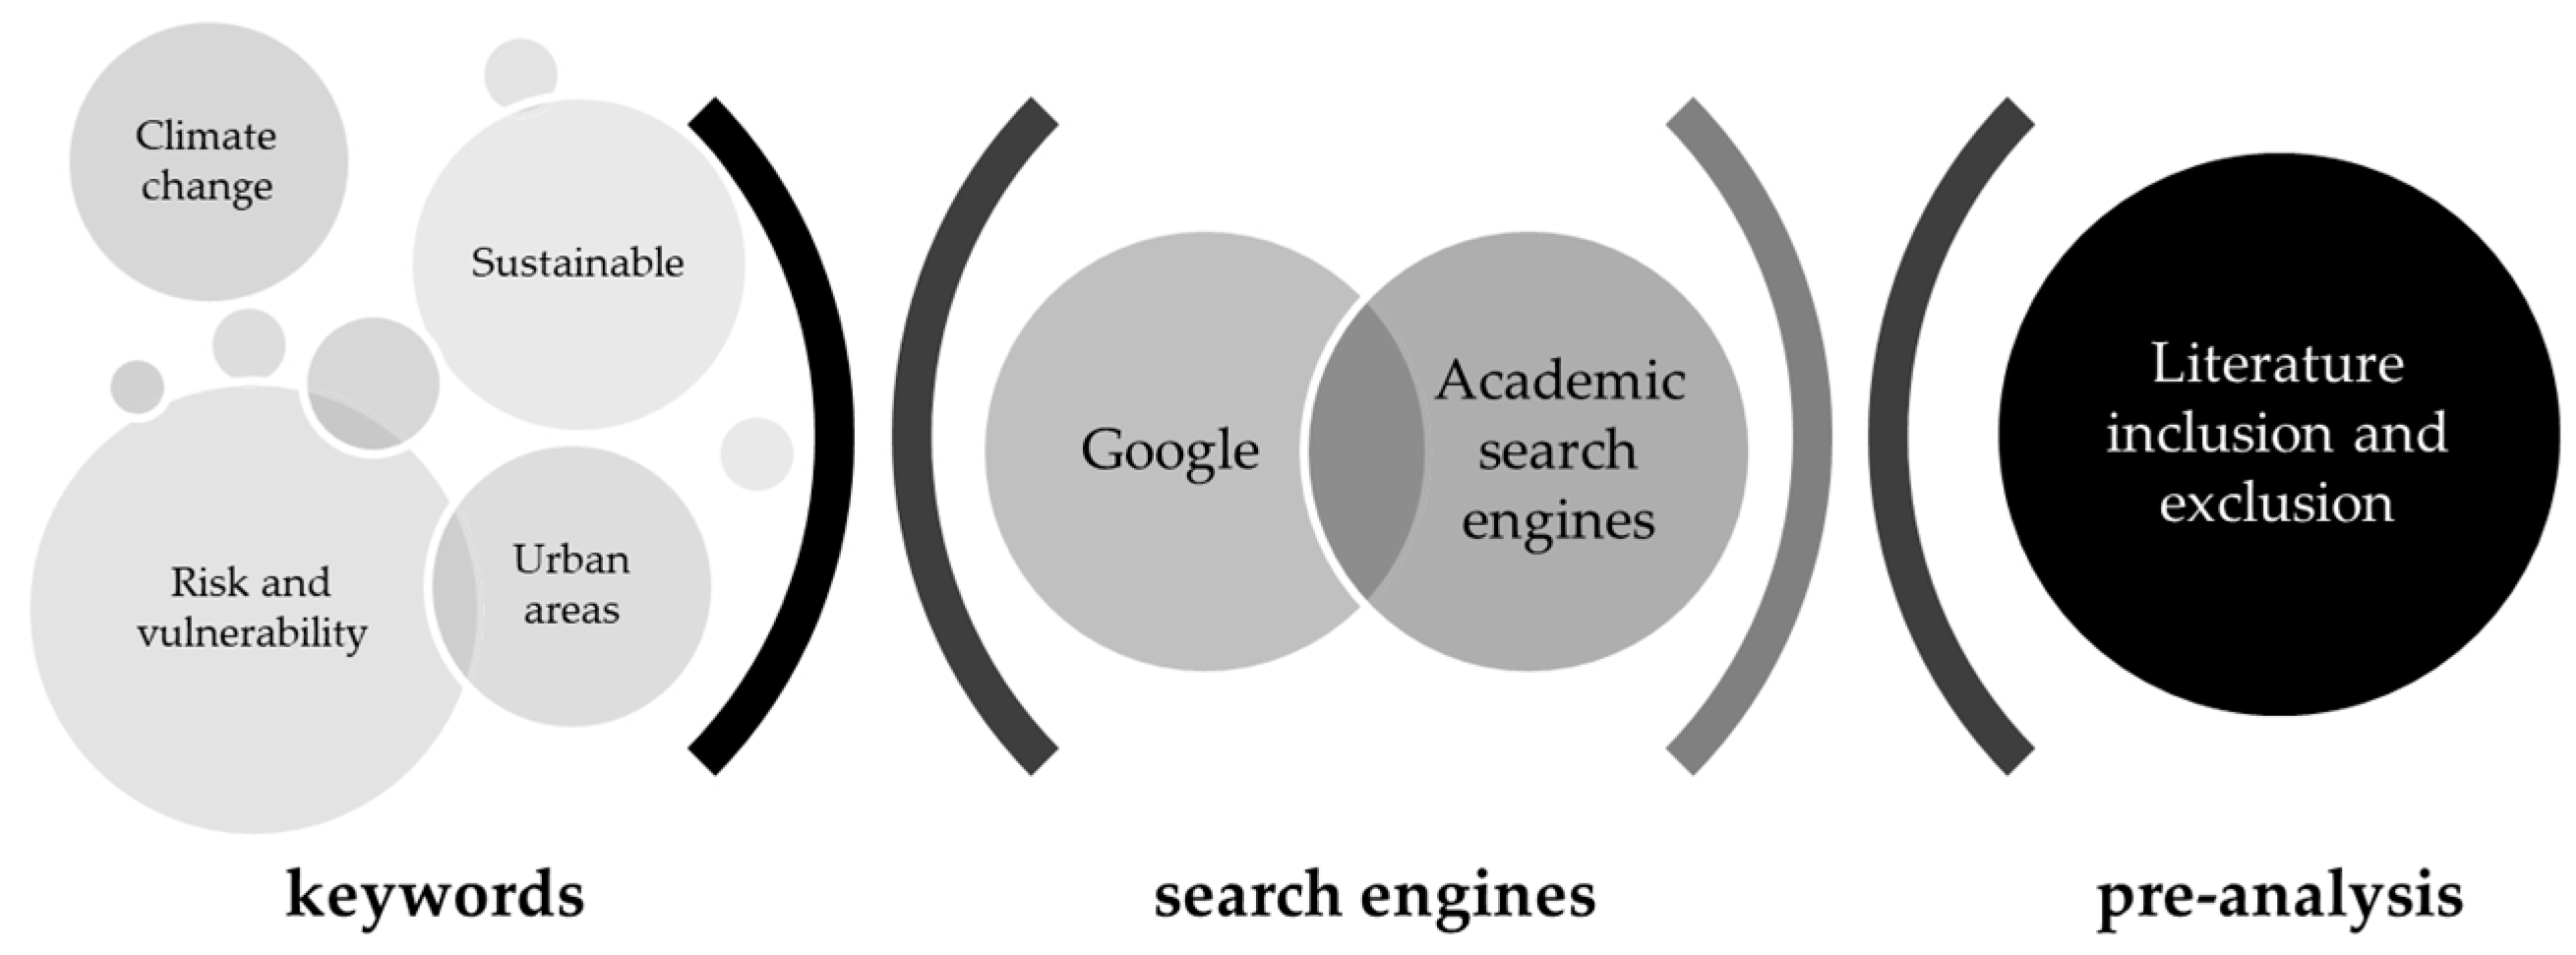
In this context, an analysis was conducted through a literature review (Figure 4) focusing on the theme and considering more than 100 publications ranging from books, national and international documents, scientific articles, laws, and current regulations related to urban areas and the climate crisis. Academic literature search engines and grey literature were used. Additionally, scientific articles published since the year 2000 were considered to identify data, technologies, etc. It is noteworthy that exceptions were made for articles or documents that were published before 2000 but had a high impact (i.e., a high number of citations) and are still relevant.
In this process (Figure 4), the first step was to focus the research on the analysis of climate vulnerability and risk by using keywords in English and Spanish to guide the selection of published articles and relevant texts. In the second step, scientific–academic literature search engines (SCOPUS, Web of Science, etc.) were used as they cover the majority of scientific publications, and Google was used as a search engine for grey literature. This approach aimed to capture the breadth and richness, as well as emerging trends of background information at the regional and national levels: history, development, and current and future situations through various reports, articles, and other documents.
Once the information was compiled, step three utilized quality criteria such as relevance, appropriateness, and credibility for the inclusion and exclusion of articles and texts from the final database. This ensured compliance with the selected study period, non-duplication of information, and the relevance of texts to the research objective. Consequently, a manual inspection was carried out, topic by topic, to contain only those that explicitly met the established criteria.
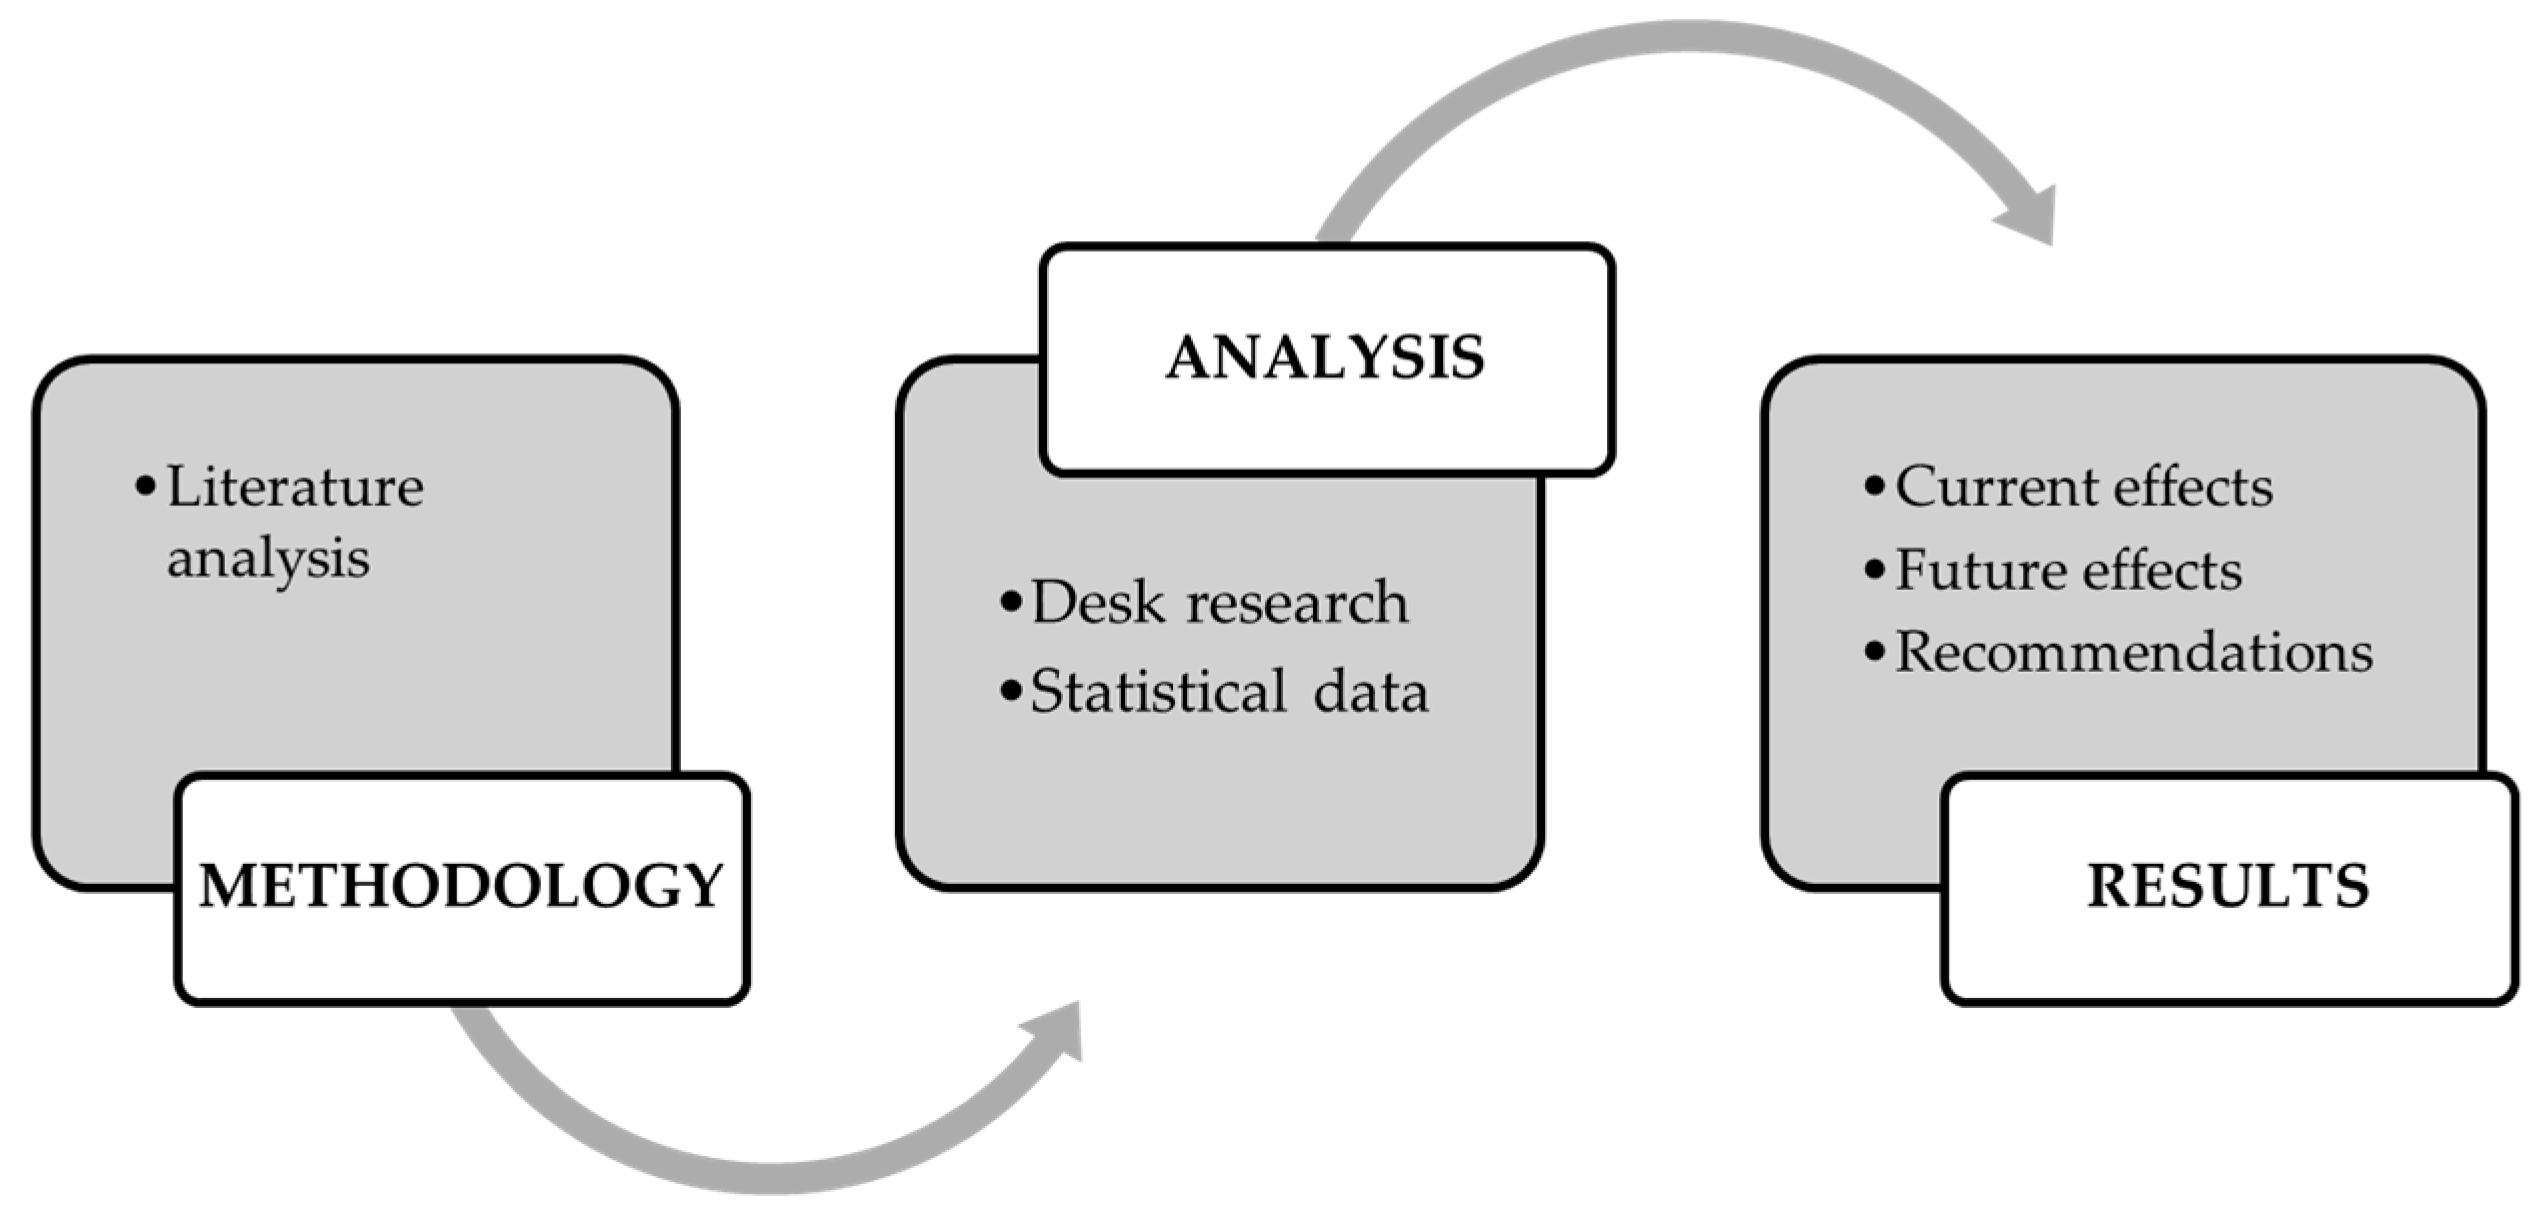
Finally, the fourth step employed qualitative content analysis as an appropriate method for developing and interpreting textual data focusing on relevance and influence for research execution. Thus, based on this documentary environment (Figure 5), a theoretical framework was established that promotes a holistic understanding of the importance and impact of climate change on cities from a scientifically grounded perspective. Therefore, the categories guiding this study correspond to urban areas, climate change scenarios, current regulations, and current and future impacts.
The quantitative connotation of the research was also developed using DesInventar [50], a conceptual and methodological platform that addresses disasters of various magnitudes and contexts, from local to regional scales. Its focus lies in the dispersed effects of catastrophic events on vulnerable communities at the local level, encompassing losses from natural, technological, or anthropogenic phenomena. A flexible methodology enables the geographical representation of variables via data collection from local to national scales, and it facilitates spatial and temporal integration of information.
As a disaster inventory system, it provides a unified and homogeneous vision for measuring effects and classifying events to aid collaboration and risk management at different administrative levels. This contributes to a more comprehensive understanding of the subject, particularly in developing countries where institutions lack resources for data collection. It is important to note that the precision and completeness of the data in the tool are not universally measurable, as they vary depending on the quality and availability of reported information, potentially introducing a level of uncertainty into analyses.
It is important to note that the extraction of these publications made it possible to identify the current and future situation of Panama’s urban areas. Furthermore, recommendations are provided based on the critical analysis of existing definitions and typologies of action against climate change in the dynamics of urban areas to increase their resilience and sustainability.

3. Results and Discussion

In the case of Panama, historically, according to Panama’s First Nationally Determined Contribution [51], the country’s contribution to global greenhouse gas emissions has represented 0.02% of the total recorded worldwide. So, the country does not contribute significantly to global warming. However, Panama is highly vulnerable to the adverse effects of climate change.
In this context, following its entry into the United Nations Framework Convention on Climate Change [9], the state of Panama has developed studies that gather data on climate variability and climate prediction scenarios that involve areas such as human health, agriculture, water resources, marine–coastal resources, and forest resources. This is an attempt to integrate the issue of climate change into the national framework of sustainable development. Similarly, other governmental and non-governmental organizations have updated and expanded similar studies over time to determine and assess the implications of these changes across the country.
The findings of this study at the national level regarding the current and future effects of climate change in Panama are detailed below.

3.1. Current Effects of Climate Change in Panama

The first national study on climate change was within the framework of the Central American Climate Change Project [52], considered one of the first exhaustive analyses of the effects of climate change in the country and which included the vulnerability of various natural resources, particularly those related to water, agricultural, and marine–coastal resources. Data that were later used in the First National Communication to the United Nations Framework Convention on Climate Change [52] exposed how the country is highly vulnerable to climate change due to factors such as its extensive coastline, the lack of human and institutional capacity to deal with natural disasters, and high poverty rates [53]. Likewise, in so-called Panama’s National Communications [46,52,54], the effects of climate change at the global level were considered, and those that currently affect Panama were identified: sea level rise, temperature increase, and variations in precipitation.
With the effects described above, Panama is also potentially vulnerable to the occurrence of natural disasters, as stated in the study of urbanization in Central America: Opportunities of an urban Central America [55], where the country ranks 14th among the countries with the highest exposure to multiple natural hazards, with 15% of its area and 12.5% of its total population exposed to two or more hazards.
This fact is corroborated by statistical and meteorological records, which indicate an increase in the frequency of extreme events in the country, with the hydro-meteorological events having the most impact on different ecosystems and the most vulnerable population [46]. Climate variability data evidence changes in weather patterns that directly affect natural systems, resulting in a significant number of people affected and deaths, mainly in the provinces of Panama and Chiriquí [56]. These impacts have sometimes been exacerbated by phenomena such as El Niño and La Niña.
Going deeper into these extreme events, especially El Niño and La Niña, it should be remembered that their impacts range from an increase in temperatures and strong winds from the northwest to a decrease of 50% or more in precipitation and absolute and relative humidity (in the case of El Niño). In the case of La Niña, there is a considerable increase in precipitation and relative and absolute humidity, and the predominant winds are from the southeast, together with a slight decrease in temperature [52]. These phenomena considerably increase heat or cold waves, floods, landslides, and droughts; for example, the crises resulting from extreme precipitation events that have occurred in recent years: La Purísima 2010, El Niño 2015, and Storm Otto 2016 [46].
In Panama, information related to the climate risk of some areas to adverse natural events typical of the region, such as floods and landslides, has not been well documented and is dispersed. Therefore, in order to present more recent historical data that are representative at the national level, it was proposed to analyze the occurrence of extreme events through data obtained in DesInventar [50], a conceptual and methodological tool developed for the construction of databases regarding losses, damages, or effects caused by emergencies or disasters. In the case of Panama, the DesInventar data are strengthened by data from the National Civil Protection System (SINAPROC, by its Spanish initials).
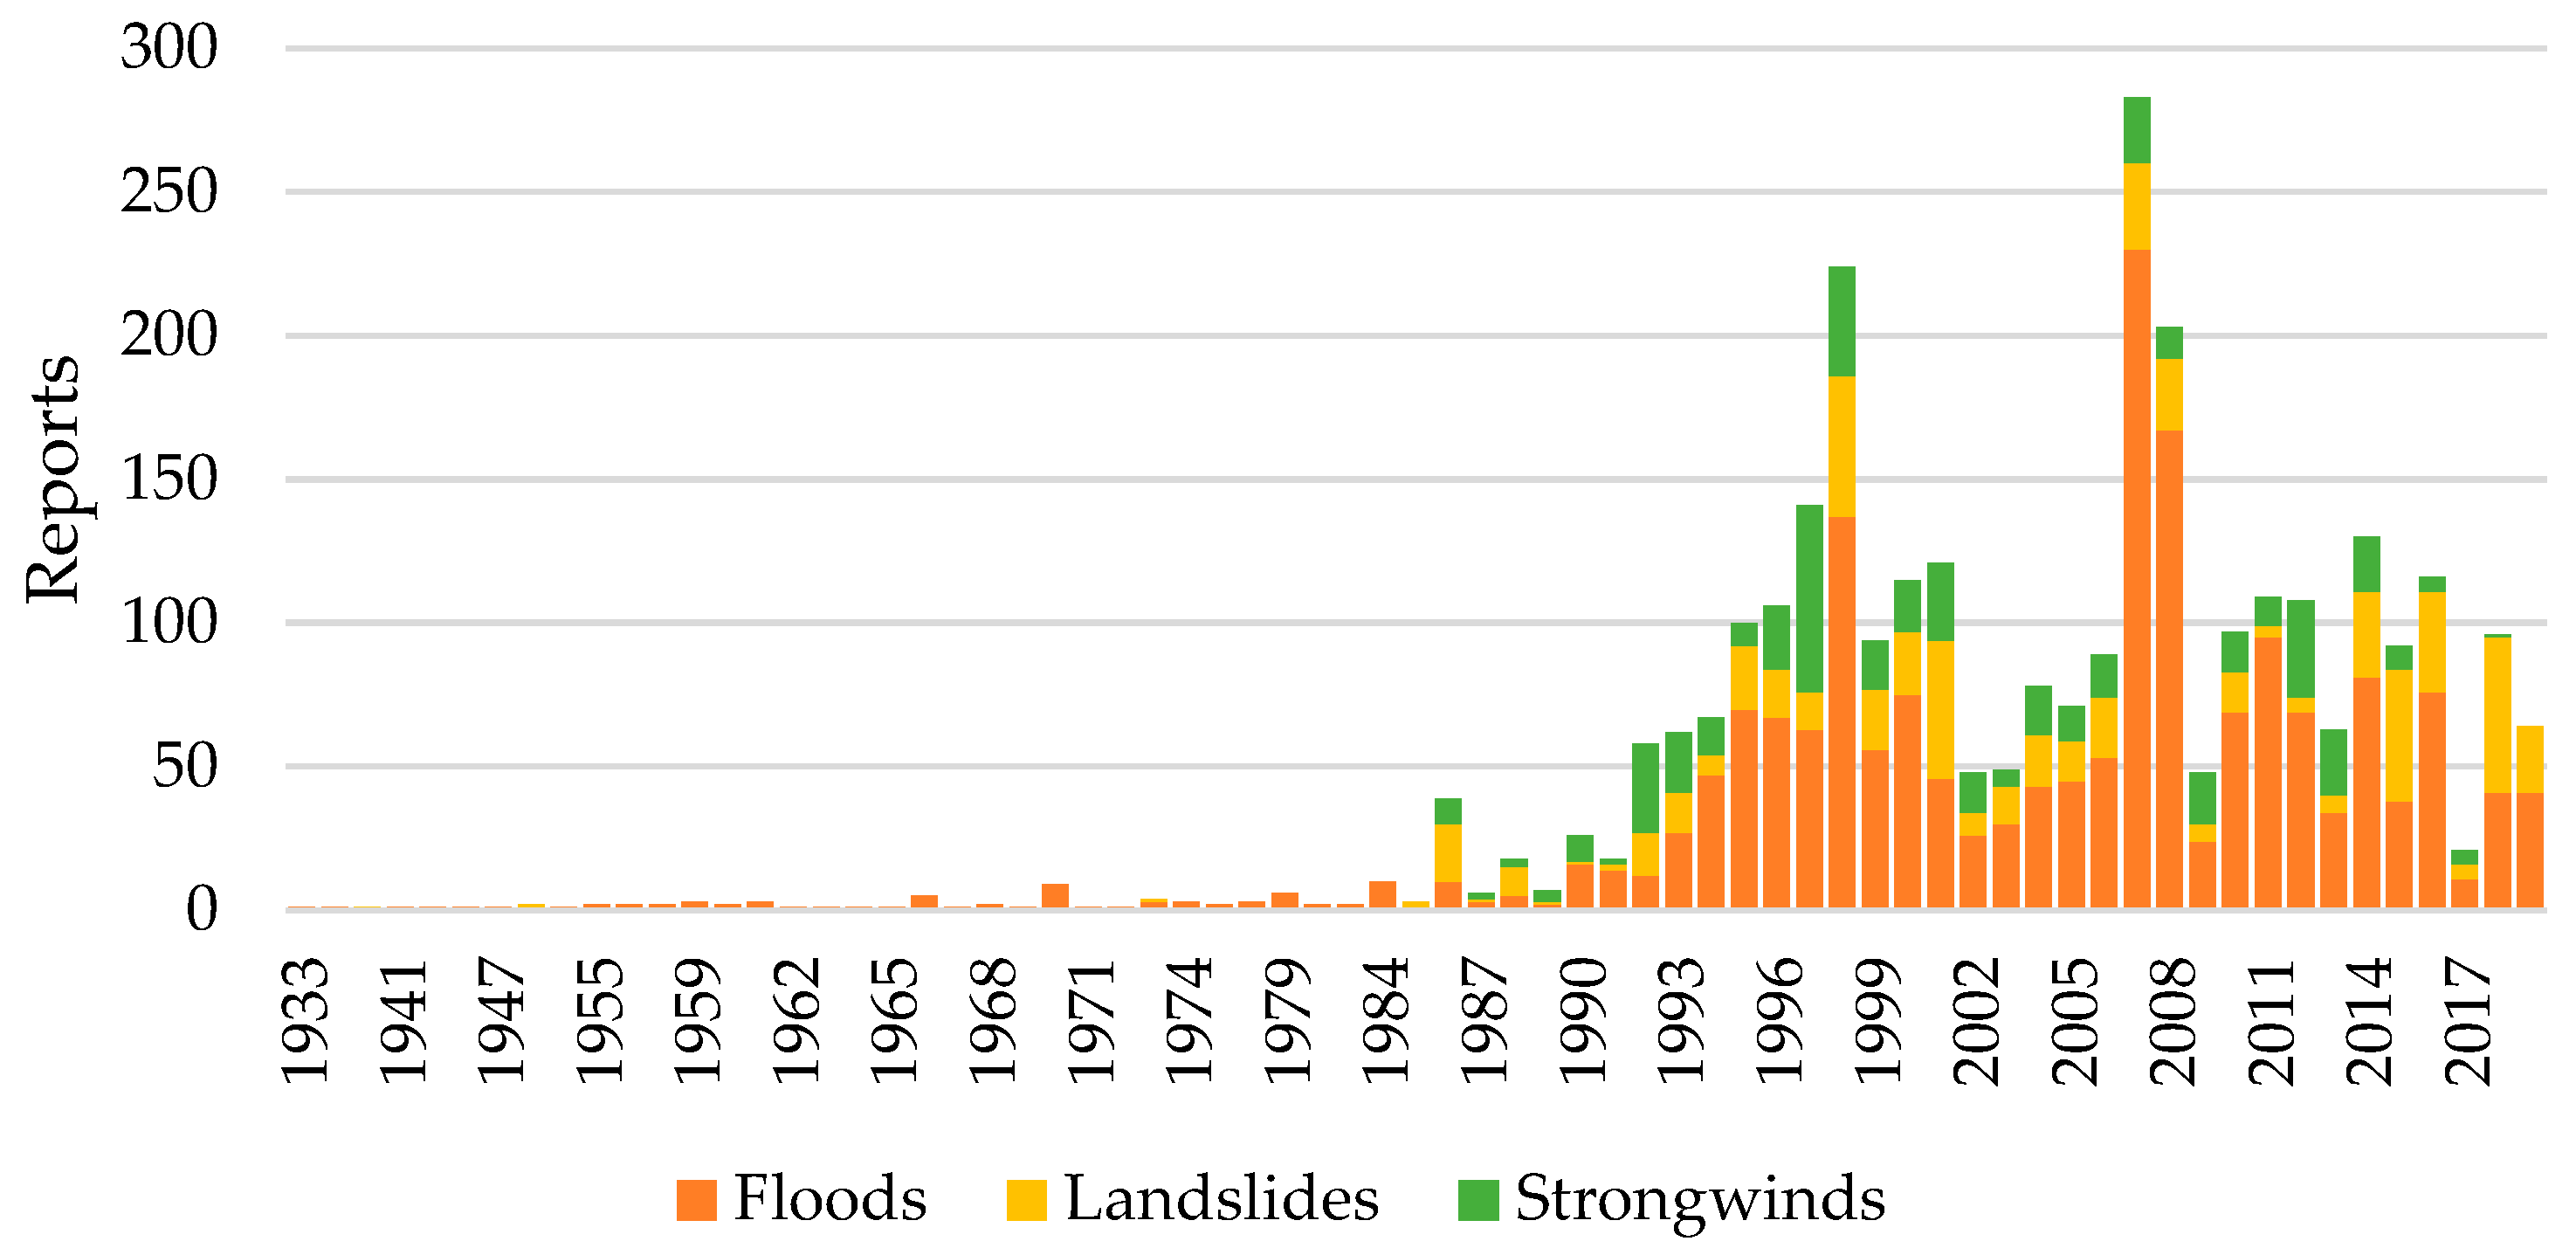
In this context, Figure 6. shows the records or reports of floods, extreme winds, and landslides obtained in this research throughout the national territory from 1933 to 2019.
According to the analysis of historical and statistical data collected, a total of 1903 flood reports were registered nationwide. Likewise, it is observed that throughout this period, there were only two variations in increase: in 1998 coinciding with the El Niño phenomenon and in 2007 with the La Niña event. Additionally, landslides and extreme winds are observed in the same periods of time as floods, so it could be said that there is a relationship between them.
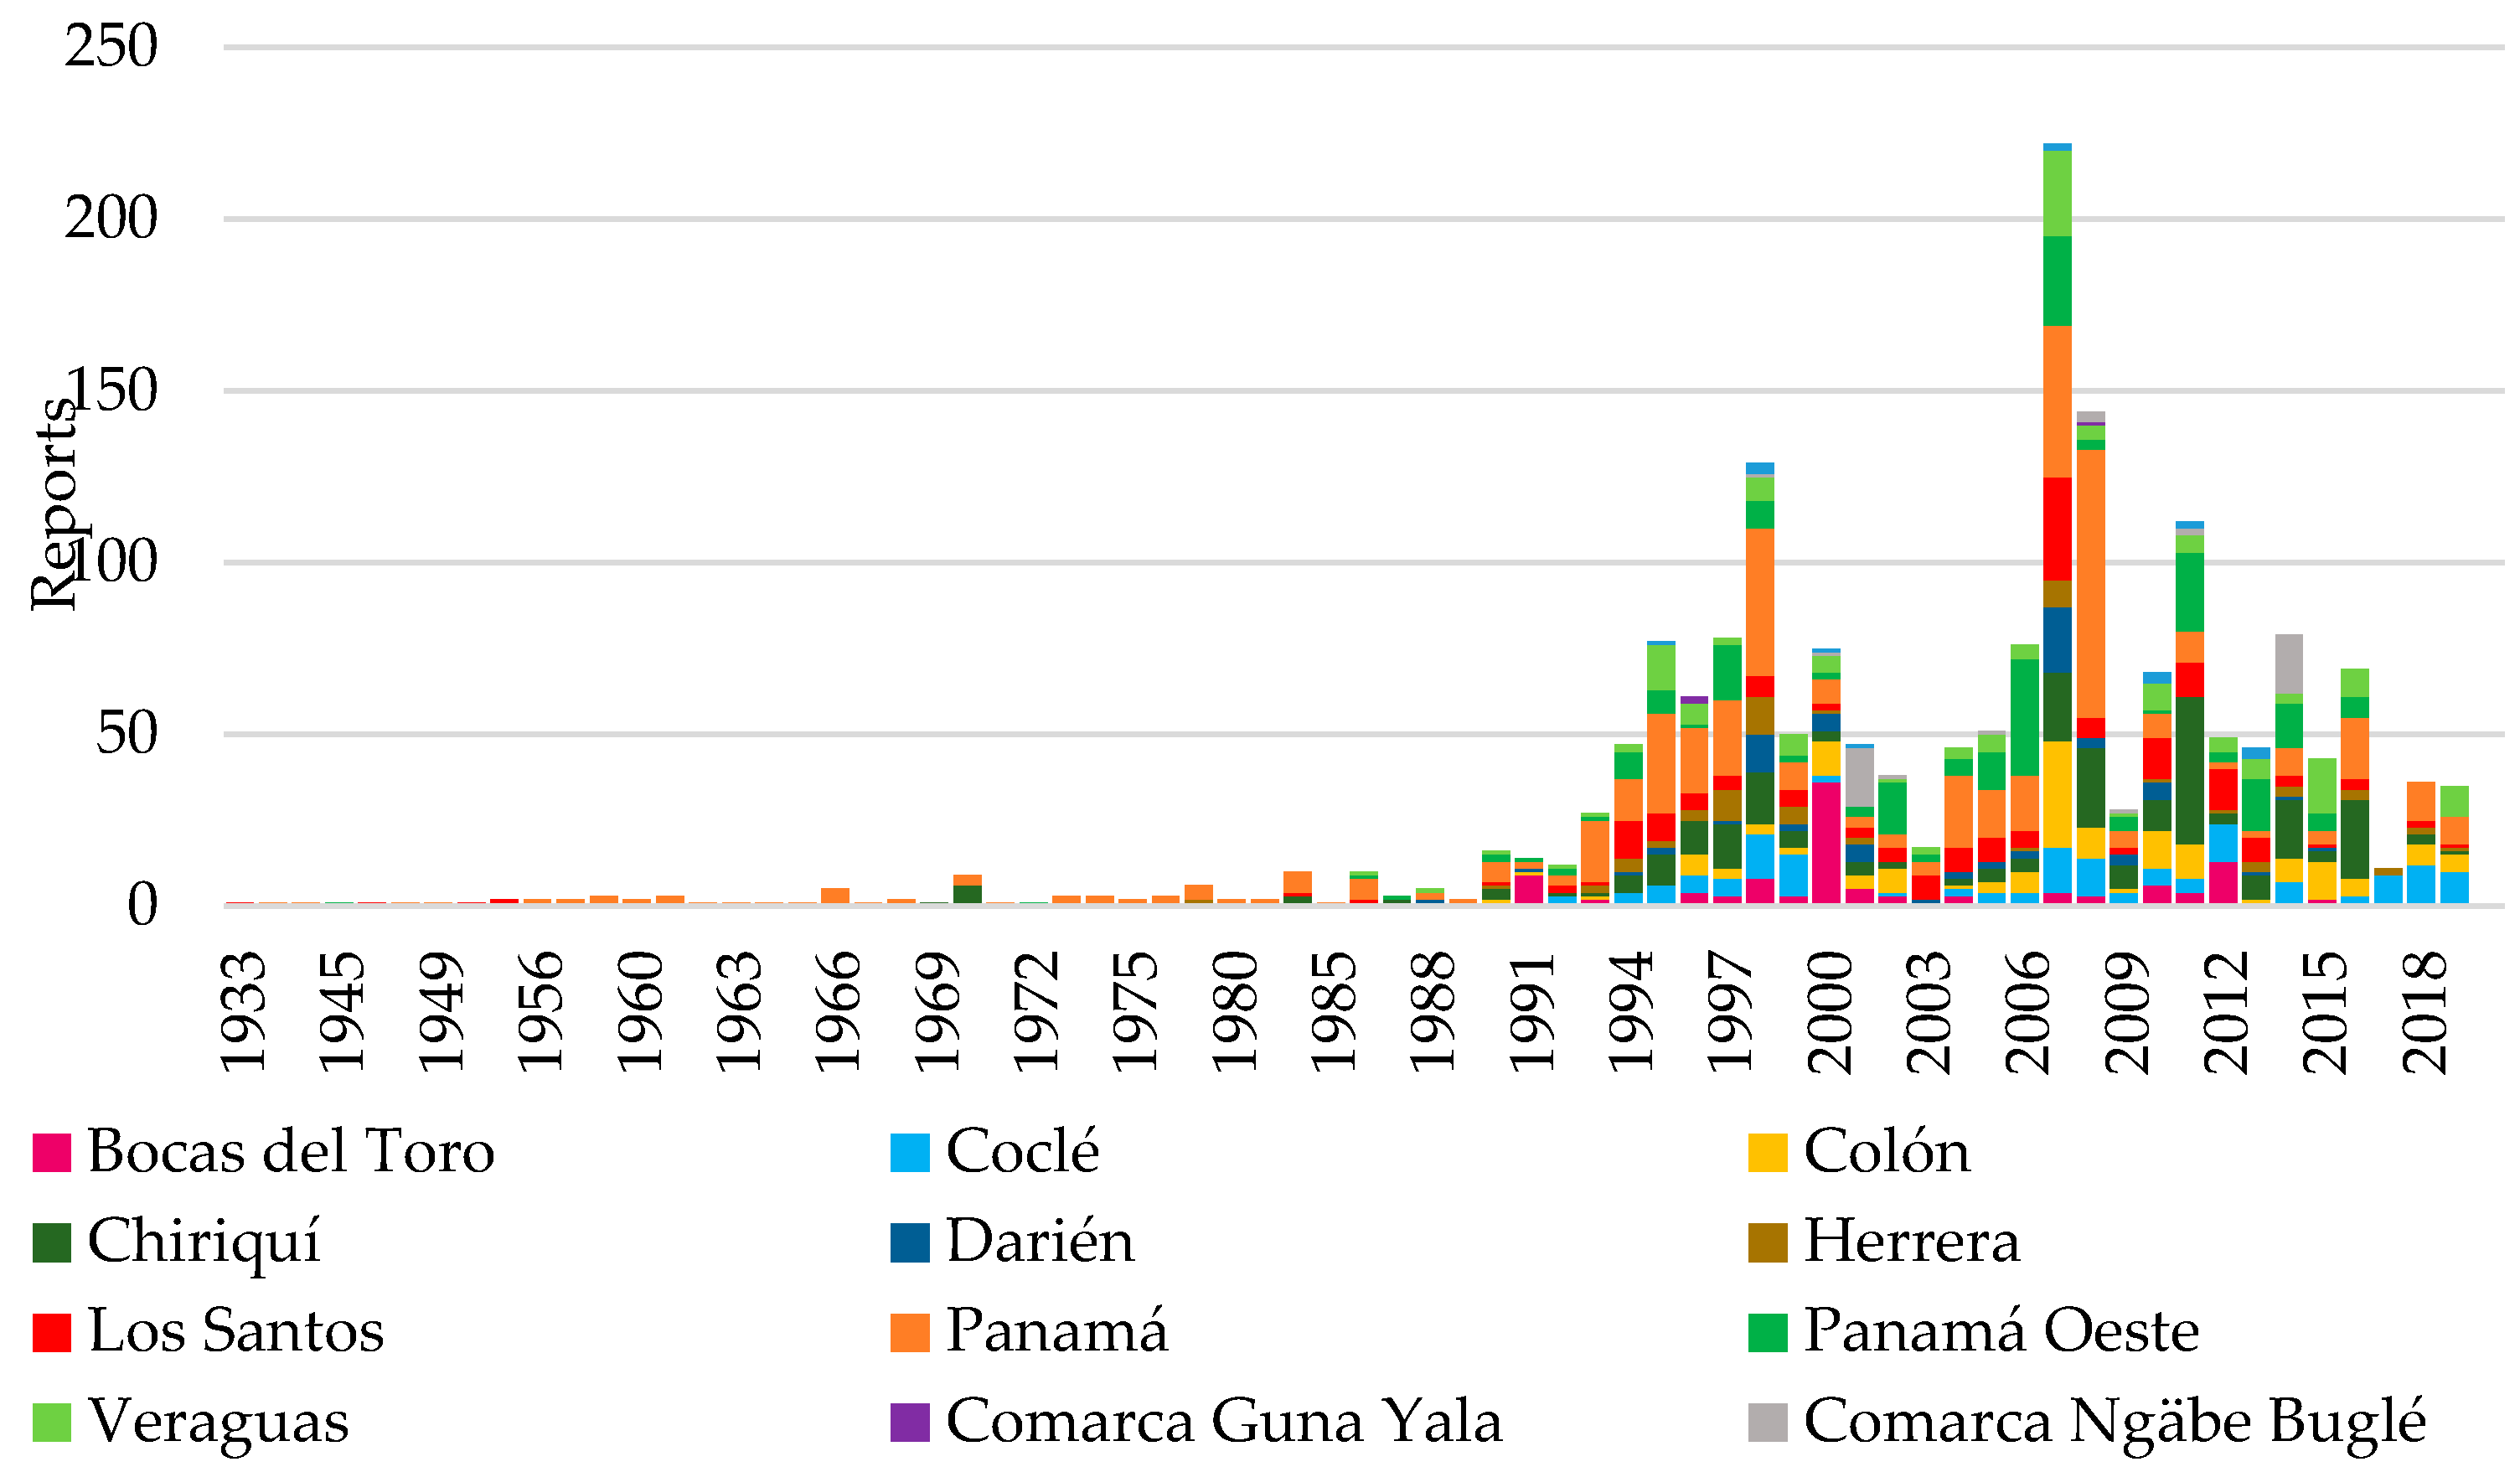
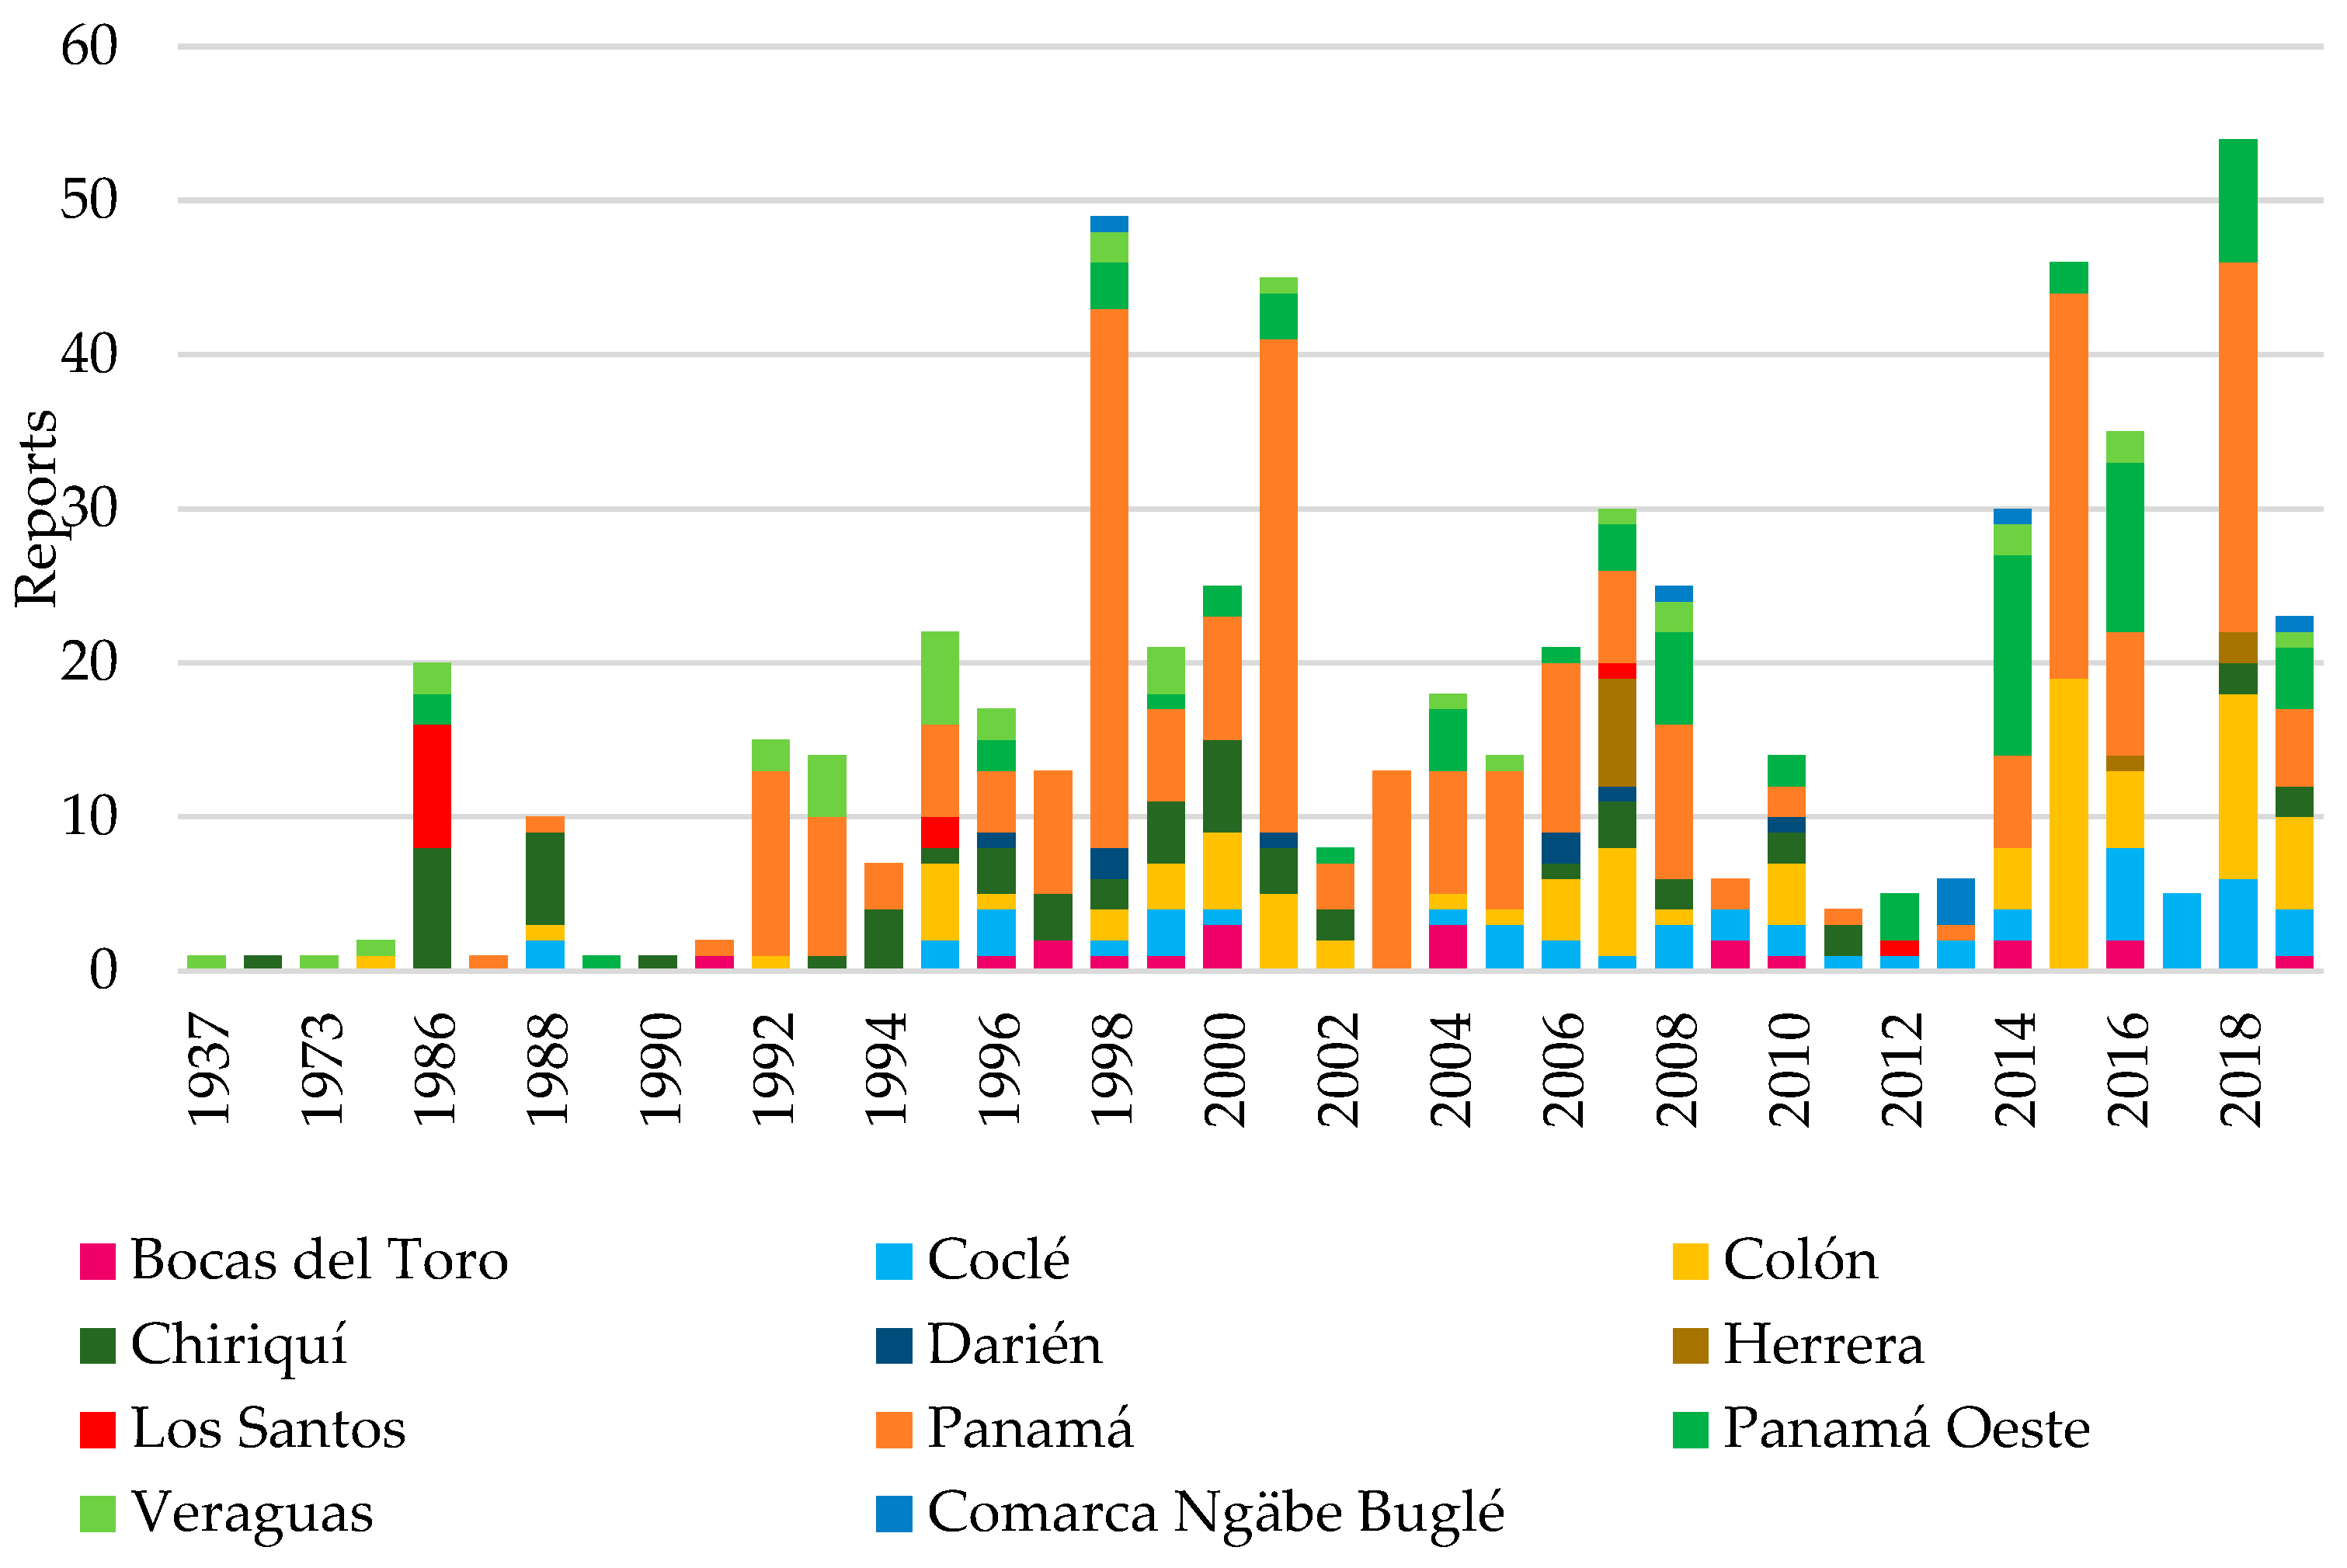
Subsequently, when delving into these events, it was obtained that the provinces that presented a greater number of reports vary according to the type of phenomenon, as shown in Figure 7, Figure 8, and Figure 9, which present floods, landslides, and extreme winds reports, respectively.
With this inventory system, data can be obtained to indicate the number of people and homes reported as affected as a result of the occurrence of the events in the period from 1933 to 2019, where the total amounts of 527,394 people and 101,738 homes were affected. However, when cross-referencing these data with the number of reports by province, these vary.
In summary, in the case of floods, the provinces with the highest number of reports are Panama at 25.67%, Panama Oeste at 11.73%, and Chiriquí at 13.31%. However, when compared with the number of people reported as affected, they do not coincide with those with the highest report since the incidence falls on the province of Bocas del Toro with 28.72% (135,884 people), followed by the province of Panama with 27.42% (129,744 people), while the rest of the provinces showed percentages below 10%. Likewise, it was reported that the highest incidence of housing damage occurred in the province of Panama, with 30% (27,303 homes), and Bocas del Toro, with 25.47% (23,181 homes), compared to the rest of the provinces that accumulated less than 10%.
Following these extreme events are landslides that involve material displacements and frequently occur as a secondary consequence of floods, storms, and other weather events [57]. According to data from DesInventar [50], between 1937 and 2019, a total of 625 reports of landslides were registered, with the provinces with the highest incidence being Panama (41.60%), Colón (14.40%), and Panama Oeste (11.52%). These, in turn, are the provinces with the highest reports of damage in terms of people and homes.
As indicated, these provinces were greatly affected in the period 1937–2019, such that Panama accumulated 32.78% and 37.17% of people and homes reported as affected, respectively, followed by Colón with 14.86% and 15.51% and Panama Oeste with 11.54% and 11.92%. During this period, a significant increase in the occurrence of landslides was observed in the years 1998–2001 and 2015–2018.
Finally, extreme winds present the highest number of reports in the provinces of Panama, with 22.14%, followed by Panama Oeste with 13.36% and Coclé along with Veraguas with 12.21%. However, the greatest effects fall outside these provinces. Such is the case of Bocas del Toro, which presents the highest percentage of damages, 31.97% of the total reports of homes and 32.35% of people reported as affected, followed by the Ngäbe Buglé Region with 14.89% and 19.98% in homes and people reported as affected, and Panama with 15.85% in homes and 11.76% in people reported as affected, compared to the other provinces that have less than 10% in affectations.
It has been demonstrated how, in developing countries such as Panama, the threats linked to climate change and the sum of socioeconomic factors such as the disorderly growth of the population, the overexploitation of resources, the unequal distribution of wealth, and the limitations of infrastructure to face extreme climate changes, have generated negative impacts on the areas that are currently among the most populated in the country.

3.2. Future Effects of Climate Change in Panama

Panama recognizes that climate change is a major global threat that affects the population, ecosystems, and all productive sectors of the economy [51], which is why it has generated climate change scenarios for three climate impacts at the national level: temperature variation, precipitation, and sea-level rise. These scenarios are published and updated in each of the National Communications [46,47,52,54], taking into account the information from Climate Models used in the Intergovernmental Panel on Climate Change [46] to identify and assess the impact on particular areas: human health, agriculture, water resources, marine–coastal resources, and forestry resources.
Climate change scenarios have made it possible to visualize the potential increase in temperature, and they mostly coincide in indicating a significant reduction in precipitation over different time horizons. However, Annex III: Glossary: Physical Basis [12] indicates that external factors called forces of change can cause some uncertainty. In general, they can be considered versatile and extremely useful tools since their information and results allow their application in the analysis of impacts on human and natural systems under various projections [58].
In this sense, Panama has obtained a simplified representation of the future climate, which is based on a set of climatological relationships and their possible consequences in a region. Initially, in the First National Communication [52], climate change patterns for 2010, 2050, and 2100 were obtained, which indicated moderate warming and reduced rainfall.
In this last parameter, the information showed that the Caribbean slope and the area of eastern Panama and Darién presented the greatest differences in rainfall behavior due to the low concentration of meteorological stations and, in turn, the lack of records necessary to be included in the generation of climate change scenarios; a fact that would be reinforced in future communications. With regard to sea-level rise, this First National Communication [52] did not explicitly make future projections. However, it is mentioned that this may increase by an order of magnitude within the next 50 to 100 years.
Subsequently, in the Second National Communication [46], it is observed that the scenarios projected for the climatology of 2020, 2050, and 2080 foresee an increase in temperature of between 1 °C and 4 °C and with a greater trend of between 2 °C and 3 °C, with a differential distribution in the territory. Likewise, it is indicated that, with the climatology observed in the central region of the isthmus, increases in the minimum temperature are projected in the order of 0.5 °C in 100 years.
Regarding rainfall, the projections indicated that by 2020, the rainfall pattern would increase in a range of 0 mm/day to 2.5 mm/day, mainly in the central provinces, the province of Panama, and the eastern region of the country. By 2050, there will be a smaller decrease of 5% in winter precipitation towards the western provinces. But for the central provinces, the province of Panama, and the eastern provinces, the increase is of the same magnitude range.
Likewise, in response to the recommendation of the Intergovernmental Panel on Climate Change to foresee scenarios for sea level rise, it has been projected that the current rate of sea level rise will increase by an order of magnitude within the next 50 to 100 years. This has been the case for the last ten years in the islands of Guna Yala, located in the San Blas archipelago, where it is estimated that approximately 28,000 people will eventually have to move from the islands to the mainland as a result of rising sea levels [59].
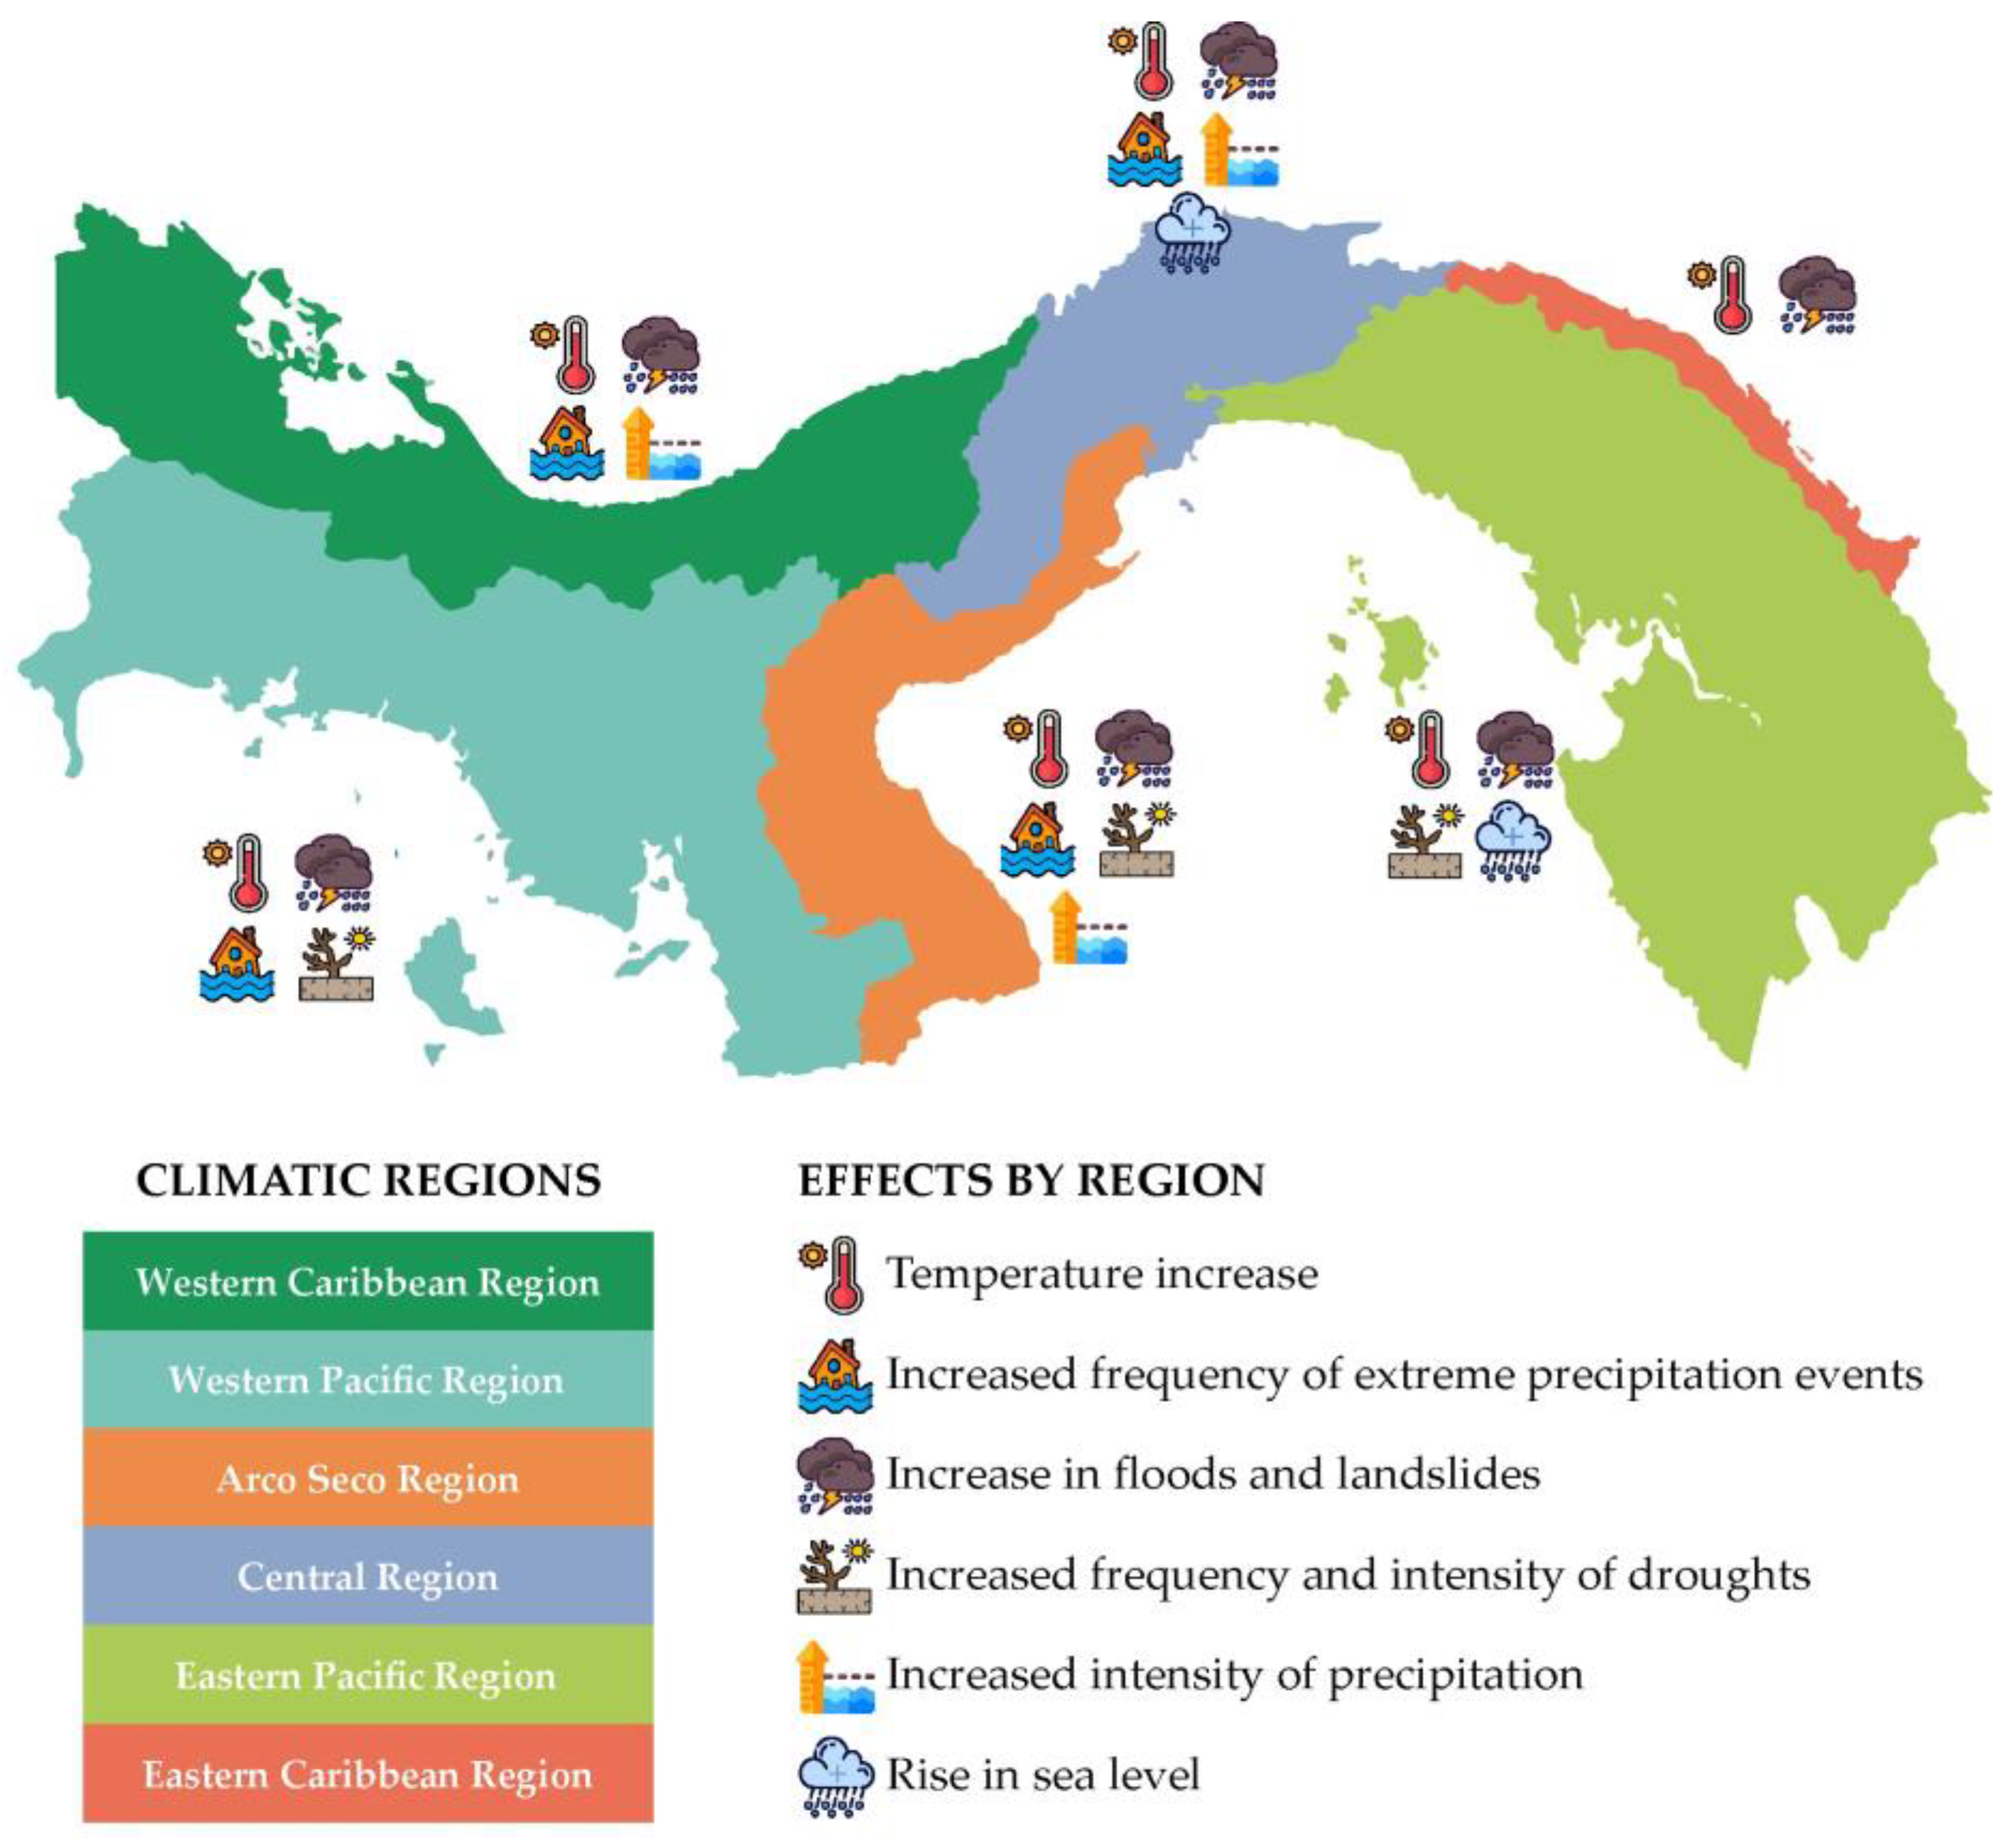
With the above, Panama has been improving its scenarios and expanding the data to predict the effects in the future. In its Third National Communication [46], Panama conducted a study of the country’s Climate Regionalization as a contribution to water security [60]. Thus, identifying future effects in six climatic regions is a result that is detailed in Figure 10, which shows the climatic regions of Panama and its main climate scenarios for 2050.
From Figure 10, it can be seen that the modeling projects that the temperature will be warmer in various regions of the country. According to the models used by the National Communication Agency [46], provinces such as Veraguas, located in the Arco Seco region, will have changes in average temperatures of 1 °C to 3 °C. Likewise, it is indicated that there will be more areas with wetter conditions towards the east of the national territory and a certain western portion of Panama, particularly in regions of the Western Pacific and, to a lesser extent, towards regions of the Panamanian Eastern Atlantic.
Regarding the scenarios for precipitation, more accentuated conditions are indicated, where, in general, positive changes or increases in rainfall are indicated in the vast majority of the national territory. However, there are particular regions in the provinces of Darién and Bocas del Toro, for example, that could exhibit negative changes or decreases in precipitation.
However, these future effects vary by region. Therefore, Table 1 details the main effects according to the scenarios for 2050–2070 [46].
More recently, the Fourth National Communication [47] projects future major impacts on Panama’s water and food security. Reduced rainfall and rising temperatures for the Pacific and western Caribbean regions could lead to a deficit in the country’s energy production, as the country’s largest hydroelectric plants are in those regions. Negative impacts are also expected in the central region of the country, where the Panama Canal basin is located, which represents an important economic gateway to Panama.
Additionally, Panama has prioritized management tools that correspond to instruments that provide national climate information, with the aim of providing up-to-date scientific information that allows decision-makers to create adaptation measures and plans according to the country’s reality. Therefore, it currently has the Community Technical Guide, a tool for the collection of information and assessment of vulnerability, climate risk, and resilience [61]; the Climate Change Vulnerability Index [45]; the Diagnosis on the Coverage of Forests and Other Forested Lands of Panama [62]; and others.
Following this line, it is pertinent to highlight that Panama has a Risk Analysis tool, which is its Climate Change Vulnerability Index [45] (Figure 11). This tool utilized the discussions from the Fourth Report and represented vulnerability as the relationship between potential impacts and adaptive capacity. Geo-processed and normalized indicators were used in this, each with an equal level of influence, meaning each indicator holds equal relevance. Their range is from 0 to 1, where 0 represents low vulnerability, and 1 represents high vulnerability [47].
Figure 11 shows that vulnerable areas are primarily located in the comarcal areas. However, the uncertainty associated with these studies leads us to suggest the development of the tool at a local scale to more precisely and effectively understand the various risks faced by the social and environmental systems of a territory [47]. Furthermore, it is important to note that since the Fifth Assessment Report [39], the IPCC suggests a more explicit risk framework that involves vulnerability, hazard, and exposure.
Although future risks have a high level of uncertainty, all these efforts have made it possible to establish the strategic lines that will be developed and also to consolidate and expand the proposal for mitigation and adaptation measures. Informed, reliable, and transparent decisions can be made that allow for the further development of sustainable development planning and implementation at the national level.

3.3. Strategies Based on the Current and Future Effects of Climate Change in Panama

Events such as floods, landslides, and extreme winds, as well as future effects like temperature variation, precipitation, and sea level rise, have been identified as the main hazards associated with climate change in Panama. These events pose significant threats to infrastructure, agriculture, and human life. Therefore, considering strategies based on the current and future effects of climate change is essential to ensure the resilience of communities and society [63]. In this regard, decision-making can be based on a wide range of analytical methods to assess the risks and expected benefits, taking into account the importance of governance, ethical dimensions, equity, value judgments, economic assessments, and various perceptions and responses to risk and uncertainty [64].
However, it is important to consider opting to apply a framework to identify and categorize influential policies in decision-making, thus facilitating the development of a comprehensive map of current policy, which in turn translates into the inclusion of tools that place greater emphasis on social welfare policies to reduce the risk of vulnerable groups, ensuring appropriate budgets are allocated in risk areas in order of priority.
Although Panama, through its Nationally Determined Contribution [51,56] and Climate Change Strategy 2050 [58], has identified some potential adaptation measures, it is important for the country to develop actions, such as improving early warning systems [65,66,67]; implementing nature-based solutions [68], such as reforestation and wetland restoration [69,70]; investing in climate-resilient infrastructure [71,72]; and promoting sustainable agricultural practices [73,74], as well as the development of public policies, such as incentives for renewable energy and sustainable transportation to reduce dependence on fossil fuels. Additionally, Panama should continue efforts to preserve and restore ecosystems such as mangroves and tropical forests, which serve as important carbon sinks and maintain the country as carbon-negative.
In this context, it is important to highlight what was agreed at the last Conference of the Parties (COP 28) held in Dubai, where a historic agreement was reached on the implementation of the loss and damage fund and financing mechanisms [75]. However, these financial pledges fall far short of what is needed to support developing countries, especially in the absence of a financial architecture to facilitate and/or accelerate the establishment of new and innovative sources of financing.
Continuing these efforts, it is worth highlighting Panama’s work in providing tools such as the Panama Sustainable Finance Taxonomy [76], launched in March 2024. This classification system defines clear, science-based criteria to identify economic activities that contribute to the transition to a sustainable, resilient, and inclusive economy in the country, making it easier for actors in the real economy and the financial sector to identify economic activities and investments that support the fulfillment of national environmental and social objectives.
It is necessary to combine efforts to establish coherence between applied policies and develop coordination and cooperation instances, both among government agencies and in the relationship between the public sector and private actors. In this way, differentiated and focused adaptive capacity will become a reality in the face of the challenges posed by climate change.

4. Conclusions

This study analyzes the risks, vulnerability, capacity, degree of exposure, and characteristics of the threats to Panama’s urban areas as a function of climate change toward urban resilience and sustainability.
With the above, it was identified that Panama presents a high vulnerability to climate change due to its geographical position, such that impacts such as sea level rise, temperature increase, variations in rainfall, and increase in the occurrence of extreme weather events (floods, landslides, and extreme winds) are currently evident.
By delving into the particular case of extreme weather events, since it is the effect with the greatest impact, based on the DesInvetar data, it was possible to know the frequency of floods, landslides, and extreme winds throughout the national territory over a period of more than 30 years, accounting for a total of 3052 incident reports, of which 62.35% correspond to floods, thus denoting a clear trend of the greatest impact perceived by society. By 2019, the number of homes and people reported as affected amounted to 101,738 and 527,394, respectively, concentrated in provinces such as Panamá, Panamá Oeste, Colón, and Chiriquí, coinciding with the most populated territories according to data from the 2023 Population Census.
Although it should be noted that all these events will significantly affect the health and well-being of the population in general, studies indicate that these will vary by region. Therefore, the measures must respond to the needs of each area and promote the incorporation of actions that are based on urban resilience and sustainability so that the country’s efforts to meet the Sustainable Development Goals are continued while allowing for the incorporation of science-based actions.
In reviewing the literature on climate change in urban areas, significant uncertainties persist due to variations in contextual factors, such as geographical differences. Different methodologies used across studies lead to inconsistent findings regarding climate risks. Additionally, data limitations in this research highlight the need for more robust data collection methods. These uncertainties underscore the importance of caution in interpreting the results. Further research with standardized methodologies and larger, more diverse samples is essential for drawing more definitive conclusions.

Author Contributions

Conceptualization, Y.L.M.-V. and M.A.R.; methodology, Y.L.M.-V. and M.A.R.; validation, Y.L.M.-V.; formal analysis, M.A.R.; investigation, M.A.R.; data curation, M.A.R.; writing—original draft preparation, M.A.R.; writing—review and editing, Y.L.M.-V.; visualization, Y.L.M.-V.; supervision, Y.L.M.-V.; project administration, Y.L.M.-V.; funding acquisition, Y.L.M.-V. All authors have read and agreed to the published version of the manuscript.

Funding

The APC was funded by the Sistema Nacional de Investigación (SNI) of Panama: 036-2023.

Data Availability Statement

All the data in this manuscript could be found using the cited references.

Acknowledgments

The authors acknowledge the support of the Secretaria Nacional de Ciencia, Tecnología e Innovación (SENACYT).

Conflicts of Interest

The authors declare no conflict of interest.

References

  1. Ayanlade, A.; Smucker, T.A.; Nyasimi, M.; Sterly, H.; Weldemariam, L.F.; Simpson, N.P. Complex climate change risk and emerging directions for vulnerability research in Africa. Clim. Risk Manag. 2023, 40, 100497. [Google Scholar] [CrossRef]
  2. Ray Biswas, R.; Rahman, A. Adaptation to climate change: A study on regional climate change adaptation policy and practice framework. J. Environ. Manag. 2023, 336, 117666. [Google Scholar] [CrossRef] [PubMed]
  3. Monteiro, A.; Ankrah, J.; Madureira, H.; Pacheco, M.O. Climate Risk Mitigation and Adaptation Concerns in Urban Areas: A Systematic Review of the Impact of IPCC Assessment Reports. Climate 2022, 10, 115. [Google Scholar] [CrossRef]
  4. Rezvani, S.M.; Falcão, M.J.; Komljenovic, D.; de Almeida, N.M. A Systematic Literature Review on Urban Resilience Enabled with Asset and Disaster Risk Management Approaches and GIS-Based Decision Support Tools. Appl. Sci. 2023, 13, 2223. [Google Scholar] [CrossRef]
  5. Mabrouk, M.; Haoying, H. Urban resilience assessment: A multicriteria approach for identifying urban flood-exposed risky districts using multiple-criteria decision-making tools (MCDM). Int. J. Disaster Risk Reduct. 2023, 91, 103684. [Google Scholar] [CrossRef]
  6. Tsai, M.-T.; Chang, H.-W. Contribution of Accessibility to Urban Resilience and Evacuation Planning Using Spatial Analysis. Int. J. Environ. Res. Public Health 2023, 20, 2913. [Google Scholar] [CrossRef] [PubMed]
  7. Almeida, M.D.C.; Telhado, M.J.; Morais, M.; Barreiro, J. Multisector Risk Identification to Assess Resilience to Flooding. Climate 2021, 9, 73. [Google Scholar] [CrossRef]
  8. Nunes, L.J.R. Analysis of the Temporal Evolution of Climate Variables Such as Air Temperature and Precipitation at a Local Level: Impacts on the Definition of Strategies for Adaptation to Climate Change. Climate 2022, 10, 154. [Google Scholar] [CrossRef]
  9. Naciones Unidas. Convención Marco de las Naciones Unidas sobre el Cambio Climático; Naciones Unidas: New York, NY, USA, 1992; Available online: https://www.acnur.org/fileadmin/Documentos/BDL/2009/6907.pdf (accessed on 13 September 2020).
  10. United Nations Framework Convention on Climate Change. Qué es la Convención Marco de las Naciones Unidas sobre el Cambio Climático|CMNUCC; UNFCC: Bonn, Germany, 2021; Available online: https://unfccc.int/es/process-and-meetings/the-convention/que-es-la-convencion-marco-de-las-naciones-unidas-sobre-el-cambio-climatico (accessed on 27 August 2021).
  11. ISO Guide 84:2020(en); Guidelines for Addressing Climate Change in Standards. International Organization for Standardization: Geneva, Switzerland, 2020. Available online: https://www.iso.org/obp/ui#iso:std:iso:guide:84:ed-1:v1:en (accessed on 13 September 2020).
  12. Intergovernmental Panel on Climate Change. Cambio Climático 2013. Bases físicas. Contribución del Grupo de Trabajo I al Quinto Informe de Evaluación del Grupo Intergubernamental de Expertos sobre el Cambio Climático. 2013. Available online: https://www.ipcc.ch/site/assets/uploads/2018/08/WGI_AR5_glossary_ES.pdf (accessed on 27 August 2021).
  13. UN-HABITAT. State of the World’s Cities 2010/2011—Cities for All: Bridging the Urban Divide. 2011. Available online: https://unhabitat.org/state-of-the-worlds-cities-20102011-cities-for-all-bridging-the-urban-divide (accessed on 22 May 2024).
  14. UN-HABITAT. World Cities Report 2016: Urbanization and Development—Emerging Futures. 2016. Available online: https://unhabitat.org/sites/default/files/download-manager-files/WCR-2016-WEB.pdf (accessed on 22 May 2024).
  15. Das, S.; Ghosh, A.; Hazra, S.; Ghosh, T.; Safra de Campos, R.; Samanta, S. Linking IPCC AR4 & AR5 frameworks for assessing vulnerability and risk to climate change in the Indian Bengal Delta. Prog. Disaster Sci. 2020, 7, 100110. [Google Scholar] [CrossRef]
  16. Mac Gregor-Gaona, M.F.; Anglés-Hernández, M.; Guibrunet, L.; Zambrano-González, L. Assessing climate change risk: An index proposal for Mexico City. Int. J. Disaster Risk Reduct. 2021, 65, 102549. [Google Scholar] [CrossRef]
  17. Landman, W. Climate change 2007: The physical science basis. S. Afr. Geogr. J. 2010, 92, 86–87. [Google Scholar] [CrossRef]
  18. National Geographic Society. Climate Change; National Geographic Society: Washington, DC, USA, 2020; Available online: http://www.nationalgeographic.org/encyclopedia/climate-change/ (accessed on 13 October 2020).
  19. Intergovernmental Panel on Climate Change: Cambio Climático 2007: Informe de Síntesis. Contribución de los Grupos de Trabajo I, II y III al Cuarto Informe de Evaluación del Grupo Intergubernamental de Expertos sobre el Cambio Climático; Intergovernmental Panel on Climate Change: Geneva, Switzerland, 2007; Available online: https://www.ipcc.ch/site/assets/uploads/2018/02/ar4_syr_sp.pdf (accessed on 27 August 2021).
  20. UN-HABITAT. State of Latin American and Caribbean Cities 2012: Towards a New Urban Transition. 2012. Available online: https://unhabitat.org/sites/default/files/download-manager-files/State%20of%20Latin%20American%20and%20Caribbean%20cities.pdf (accessed on 22 May 2024).
  21. World Meteorological Organization (WMO). State of the Global Climate 2022; World Meteorological Organization: Geneva, Switzerland, 2023; Available online: https://library.wmo.int/records/item/66214-state-of-the-global-climate-2022 (accessed on 27 December 2023).
  22. Ayala García, E.T. La ciudad como espacio habitado y fuente de socialización. Ánfora Rev. Científica Univ. Autónoma Manizales 2017, 24, 189–216. [Google Scholar]
  23. Fenollós, J.-L.M. De Mari a Babilonia: Ciudades fortificadas en la antigua Mesopotamia. Vínculos Hist. Rev. Dep. Hist. Univ. Castilla-La Mancha 2022, 11, 15–32. [Google Scholar] [CrossRef]
  24. Márquez Pulido, U.B. Valor de uso y espacio urbano: La ciudad como eje central de la conformación política, cultural y simbólica de las sociedades. Rev. Mex. Cienc. Políticas Soc. 2014, 59, 187–208. [Google Scholar] [CrossRef]
  25. UN-HABITAT. World Cities Report 2022: Envisaging the Future of Cities; UN-Habitat: New Delhi, India, 2022; Available online: https://unhabitat.org/sites/default/files/2022/06/wcr_2022.pdf (accessed on 30 October 2022).
  26. Ruíz, M.A.; Mack-Vergara, Y.L. Resilient and Sustainable Housing Models against Climate Change: A Review. Sustainability 2023, 15, 13544. [Google Scholar] [CrossRef]
  27. Comisión Económica para América Latina y el Caribe. Plan de Acción Regional Para la Implementación de la Nueva Agenda Urbana en América Latina y el Caribe, 2016–2036; CEPAL: Santiago, Chile, 2018; Available online: https://www.cepal.org/es/publicaciones/42144-plan-accion-regional-la-implementacion-la-nueva-agenda-urbana-america-latina (accessed on 10 November 2022).
  28. CAF. Índice de Vulnerabilidad y Adaptación al Cambio Climático en la Región de América Latina y el Caribe; CAF: Giza, Egypt, 2014; Available online: https://scioteca.caf.com/handle/123456789/517 (accessed on 20 December 2023).
  29. Huang, Y.; Wu, W.; Xue, Y.; Harder, M.K. Perceptions of climate change impacts on city life in Shanghai: Through the lens of shared values. Clean. Prod. Lett. 2022, 3, 100018. [Google Scholar] [CrossRef]
  30. Ministerio Público; Procuraduría General de la Nación. Constitución Política de la República de Panamá; Procuraduría General de la Nación: Bogotá, Colombia, 2017; Available online: https://ministeriopublico.gob.pa/wp-content/uploads/2016/09/constitucion-politica-con-indice-analitico.pdf (accessed on 2 February 2024).
  31. UNFCCC. Paris Agreement. 2015. Available online: https://unfccc.int/documents/37107 (accessed on 21 December 2023).
  32. United Nations General Assembly. A/RES/70/1. Transforming Our World: The 2030 Agenda for Sustainable Development. 2015. Available online: https://sustainabledevelopment.un.org/content/documents/21252030%20Agenda%20for%20Sustainable%20Development%20web.pdf (accessed on 27 August 2021).
  33. United Nations General Assembly. A/RES/69/283. Sendai Framework for Disaster Risk Reduction 2015–2030. 2015. Available online: http://www.undrr.org/publication/sendai-framework-disaster-risk-reduction-2015-2030 (accessed on 22 May 2024).
  34. United Nations General Assembly. A/RES/71/256: Nueva Agenda Urbana. Available online: https://habitat3.org/wp-content/uploads/New-Urban-Agenda-GA-Adopted-68th-Plenary-N1646660-S.pdf (accessed on 25 November 2023).
  35. United Nations General Assembly. A/RES/69/313: Agenda de Acción de Addis Abeba. Available online: https://unctad.org/system/files/official-document/ares69d313_es.pdf (accessed on 15 November 2023).
  36. United Nations General Assembly. A/70/709: Report of the Secretary-General for the World Humanitarian Summit. 9 February 2016. Available online: https://reliefweb.int/report/world/one-humanity-shared-responsibility-report-secretary-general-world-humanitarian-summit (accessed on 21 December 2023).
  37. Intergovernmental Panel on Climate Change. Annex II: Glossary. In Climate Change 2014: Impacts, Adaptation, and Vulnerability. Part B: Regional Aspects. Contribution of Working Group II to the Fifth Assessment Report of the Intergovernmental Panel on Climate Change. 2014. Available online: https://www.ipcc.ch/site/assets/uploads/2018/02/WGIIAR5-AnnexII_FINAL.pdf (accessed on 27 August 2021).
  38. Dow, K.; Berkhout, F.; Preston, B.L. Limits to adaptation to climate change: A risk approach. Curr. Opin. Environ. Sustain. 2013, 5, 384–391. [Google Scholar] [CrossRef]
  39. Intergovernmental Panel on Climate Change. Informe de Síntesis AR5: Cambio Climático 2014. 2014. Available online: https://www.ipcc.ch/report/ar5/syr/ (accessed on 11 December 2022).
  40. Intergovernmental Panel on Climate Change. Climate Change 2001: Impacts, Adaptation, and Vulnerability, Cambridge, United Kingdom and New York, NY, USA. Available online: https://www.ipcc.ch/site/assets/uploads/2018/03/WGII_TAR_full_report-2.pdf (accessed on 23 March 2024).
  41. Field, C.B.; Barros, V.R.; Mach, K.J.; Mastrandrea, M.D. Technical Summary; Cambridge University Press: Cambridge, UK; New York, NY, USA, 2018; Available online: https://www.ipcc.ch/site/assets/uploads/2018/02/WGIIAR5-TS_FINAL.pdf (accessed on 23 March 2024).
  42. Pörtner, H.-O.; Roberts, D.C.; Adams, H.; Adelekan, I.; Adler, C.; Adrian, R.; Aldunce, P.; Ali, E.; Begum, R.A.; Bednar-Friedl, B.; et al. Technical summary. In Climate Change 2022: Impacts, Adaptation and Vulnerability. Contribution of Working Group II to the Sixth Assessment Report of the Intergovernmental Panel on Climate Change; Pörtner, H.-O., Roberts, D.C., Tignor, M.M.B., Poloczanska, E.S., Mintenbeck, K., Alegría, A., Craig, M., Langsdorf, S., Löschke, S., Möller, V., et al., Eds.; Cambridge University Press: Cambridge, UK; New York, NY, USA, 2022. [Google Scholar]
  43. Instituto Nacional de Estadística y Censo. Definiciones y Explicaciones. 2010. Available online: https://www.inec.gob.pa/Aplicaciones/POBLACION_VIVIENDA/notas/def_vol1.htm (accessed on 19 March 2021).
  44. Instituto Nacional de Estadística y Censo. Distribución Territorial y Migración Interna en Panamá: Censo 2010; Instituto Nacional de Estadística y Censo: Panama City, Panama, 2014; Available online: https://www.inec.gob.pa/archivos/P6691Distribuci%C3%B3n%20Territorial%20y%20Migraci%C3%B3n%20Interna%20en%20Panam%C3%A1-Censo2010_F.pdf (accessed on 27 August 2021).
  45. Ministerio de Ambiente de Panamá. Indice de Vulnerabilidad al Cambio Climático. 2021. Available online: https://transparencia-climatica.miambiente.gob.pa/wp-content/uploads/2021/10/03-Indice-de-Vulnerabilidad-al-Cambio-Climatico.pdf (accessed on 23 December 2023).
  46. Ministerio de Ambiente de Panamá. Tercera Comunicación Nacional ante la Convención Marco de las Naciones Unidas sobre Cambio Climático; Ministerio de Ambiente de Panamá: Panama City, Panama, 2019; Available online: https://unfccc.int/sites/default/files/resource/Tercera%20Comunicacion%20Nacional%20Panama.pdf (accessed on 5 November 2020).
  47. Ministerio de Ambiente de Panamá. Cuarta Comunicación Nacional sobre Cambio Climático de Panamá. 2023. Available online: https://transparencia-climatica.miambiente.gob.pa/wp-content/uploads/2023/08/4CNCC_2023_L.pdf (accessed on 20 December 2023).
  48. Instituto Nacional de Estadística y Censo. Panamá en Cifras: 2017–2021. 2023. Available online: https://www.inec.gob.pa/archivos/P0705547520230823110143pcifras2017-21.pdf (accessed on 2 February 2024).
  49. Ministerio de Desarrollo Agropecuario. Plan Nacional de Cambio Climático para el sector Agropecuario de Panamá. 2021. Available online: https://chm.cbd.int/api/v2013/documents/05B386D2-5BCD-A52D-6097-F853803CC619/attachments/205301/Plan%20Nacional%20de%20CC%20para%20sector%20agropecuadrio%20-%20CATIE.pdf (accessed on 2 February 2024).
  50. United Nations Office for Disaster Risk Reduction. DesInventar. Available online: https://db.desinventar.org/DesInventar/profiletab.jsp?countrycode=pan&continue=y (accessed on 26 December 2023).
  51. Gobierno de la República de Panamá (Ed.) Contribución Nacionalmente Determinada a la Mitigación del Cambio Climático (NDC) de la Republica Panamá ante la Convención Marco de Naciones Unidas sobre Cambio Climático (CMNUCC); Gobierno de la República de Panamá: Panama City, Panama, 2016; Available online: https://www4.unfccc.int/sites/ndcstaging/PublishedDocuments/Panama%20First/PANAMA%20NDC.pdf (accessed on 18 April 2020).
  52. Autoridad Nacional del Ambiente (ANAM). Primera Comunicación Nacional ante la Convención Marco de las Naciones Unidas sobre Cambio Climático; Autoridad Nacional del Ambiente (ANAM): Panama City, Panama, 2000; Available online: http://www.cac.int/node/884 (accessed on 5 November 2020).
  53. Sumarse. Guía sobre El Cambio Climático; Sumarse: Panama City, Panama, 2015; Available online: https://www.sumarse.org.pa/wp-content/uploads/2020/Recursos/GU%c3%8dAS/El%20Cambio%20Clima%cc%81tico%202015.pdf (accessed on 1 July 2024).
  54. Autoridad Nacional del Ambiente (ANAM). Segunda Comunicación Nacional ante la Convención Marco de las Naciones Unidas sobre Cambio Climático; Autoridad Nacional del Ambiente (ANAM): Panama City, Panama, 2011; Available online: https://www.pa.undp.org/content/panama/es/home/library/environment_energy/segunda_comunicacion_nacional.html (accessed on 5 November 2020).
  55. Maria, A.; Acero, J.; Aguilera, A.; Lozano, M. Estudio de la Urbanización en Centroamérica: Oportunidades de una Centroamérica Urbana; Banco Mundial: Washington, DC, USA, 2018; Available online: https://openknowledge.worldbank.org/bitstream/handle/10986/26271/9781464812200.pdf?sequence (accessed on 1 July 2024).
  56. Comité consultivo de Alto Nivel del Gobierno de la República de Panamá. Contribución Nacionalmente Determinada a la Mitigación del Cambio Climático (NDC): Primera Actualización. 2020. Available online: https://unfccc.int/sites/default/files/NDC/2022-06/CDN1%20Actualizada%20Rep%C3%BAblica%20de%20Panam%C3%A1.pdf (accessed on 1 July 2024).
  57. Autoridad Nacional del Ambiente (ANAM). Atlas Ambiental de la Republica de Panama 2010 (Primera Versión); Autoridad Nacional del Ambiente: Panama City, Panama, 2010; Available online: https://www.oceandocs.org/handle/1834/7995 (accessed on 22 December 2020).
  58. Ministerio de Ambiente. Estrategia Nacional de Cambio Climático 2050; Ministerio de Ambiente: Panama City, Panama, 2019; Available online: https://www.pa.undp.org/content/panama/es/home/library/environment_energy/estrategia-nacional-de-cambio-climatico-2050.html (accessed on 1 July 2024).
  59. Marilyn, T.; Sally, E.; Hacia la salud universal en Panamá. Organización Panamericana de la Salud. 2019. Available online: https://www.researchgate.net/publication/330618214_Hacia_la_Salud_Universal_en_Panama (accessed on 1 July 2024).
  60. Centro del Agua del Trópico Húmedo Para América Latina y el Caribe. Una Nueva Regionalización Climática de Panamá Como Aporte a la Seguridad Hídrica. 2016. Available online: https://www.cathalac.int/document/CATHALAC_regiones_%20climaticas_de_panama.pdf (accessed on 1 July 2024).
  61. Ministerio de Ambiente de Panamá. Guía Técnica Comunitaria: Herramienta para la Recopilación de Información y Evaluación de la Vulnerabilidad, Riesgo Climático y Resiliencia, 1st ed.; Ministerio de Ambiente: Panama City, Panama, 2023; Available online: https://transparencia-climatica.miambiente.gob.pa/wp-content/uploads/2022/10/Guia-Tecnica-Comunitario-para-MyE.pdf (accessed on 21 December 2023).
  62. Ministerio de Ambiente de Panamá. Diagnóstico sobre la Cobertura de Bosques y otras Tierras Boscosas de Panamá. 2019. Available online: https://www.gacetaoficial.gob.pa/pdfTemp/29131_A/81297.pdf (accessed on 26 December 2023).
  63. Rezvani, S.M.H.S.; de Almeida, N.M.; Falcão, M.J. Climate Adaptation Measures for Enhancing Urban Resilience. Buildings 2023, 13, 2163. [Google Scholar] [CrossRef]
  64. Intergovernmental Panel on Climate Change. Cambio Climático 2014—Impactos, Adaptación y Vulnerabilidad. Resúmenes, Preguntas Frecuentes. 2015. Available online: https://policycommons.net/artifacts/1624791/cambio-climatico-2014/2314715/ (accessed on 28 March 2024).
  65. Hayder, I.M.; Al-Amiedy, T.A.; Ghaban, W.; Saeed, F.; Nasser, M.; Al-Ali, G.A.; Younis, H.A. An Intelligent Early Flood Forecasting and Prediction Leveraging Machine and Deep Learning Algorithms with Advanced Alert System. Processes 2023, 11, 481. [Google Scholar] [CrossRef]
  66. Starzec, M.; Kordana-Obuch, S.; Słyś, D. Assessment of the Feasibility of Implementing a Flash Flood Early Warning System in a Small Catchment Area. Sustainability 2023, 15, 8316. [Google Scholar] [CrossRef]
  67. Sturiale, L.; Scuderi, A. The Role of Green Infrastructures in Urban Planning for Climate Change Adaptation. Climate 2019, 7, 119. [Google Scholar] [CrossRef]
  68. Goodwin, S.; Olazabal, M.; Castro, A.J.; Pascual, U. Global mapping of urban nature-based solutions for climate change adaptation. Nat. Sustain. 2023, 6, 458–469. [Google Scholar] [CrossRef]
  69. Zhai, H.; Gu, B.; Wang, Y. Evaluation of policies and actions for nature-based solutions in nationally determined contributions. Land Use Policy 2023, 131, 106710. [Google Scholar] [CrossRef]
  70. Song, S.; Ding, Y.; Li, W.; Meng, Y.; Zhou, J.; Gou, R.; Zhang, C.; Ye, S.; Saintilan, N.; Krauss, K.W.; et al. Mangrove reforestation provides greater blue carbon benefit than afforestation for mitigating global climate change. Nat. Commun. 2023, 14, 756. [Google Scholar] [CrossRef] [PubMed]
  71. Wang, J.; Foley, K. Promoting climate-resilient cities: Developing an attitudinal analytical framework for understanding the relationship between humans and blue-green infrastructure. Environ. Sci. Policy 2023, 146, 133–143. [Google Scholar] [CrossRef]
  72. Martello, M.V.; Whittle, A.J. 5—Climate-resilient transportation infrastructure in coastal cities. In Adapting the Built Environment for Climate Change; Pacheco-Torgal, F., Granqvist, C.-G., Eds.; Woodhead Publishing Series in Civil and Structural Engineering; Woodhead Publishing: Cambridge, UK, 2023; pp. 73–108. ISBN 978-0-323-95336-8. [Google Scholar]
  73. Quandt, A.; Neufeldt, H.; Gorman, K. Climate change adaptation through agroforestry: Opportunities and gaps. Curr. Opin. Environ. Sustain. 2023, 60, 101244. [Google Scholar] [CrossRef]
  74. Grigorieva, E.; Livenets, A.; Stelmakh, E. Adaptation of Agriculture to Climate Change: A Scoping Review. Climate 2023, 11, 202. [Google Scholar] [CrossRef]
  75. UNFCCC. FCCC/PA/CMA/2023/L.17. Outcome of the First Global Stocktake. Available online: https://unfccc.int/sites/default/files/resource/cma2023_L17E.pdf (accessed on 26 May 2024).
  76. Superintendencia de Bancos de Panamá, Superintendencia del Mercado de Valores, Grupo de Trabajo de Finanzas Sostenibles de Panamá, and Superintendencia de Seguros y Reaseguros de Panamá, “Taxonomía de Finanzas Sostenibles del Panamá”. 2024. Available online: https://www.unepfi.org/publications/la-taxonomia-de-finanzas-sostenibles-de-panama/ (accessed on 12 July 2024).
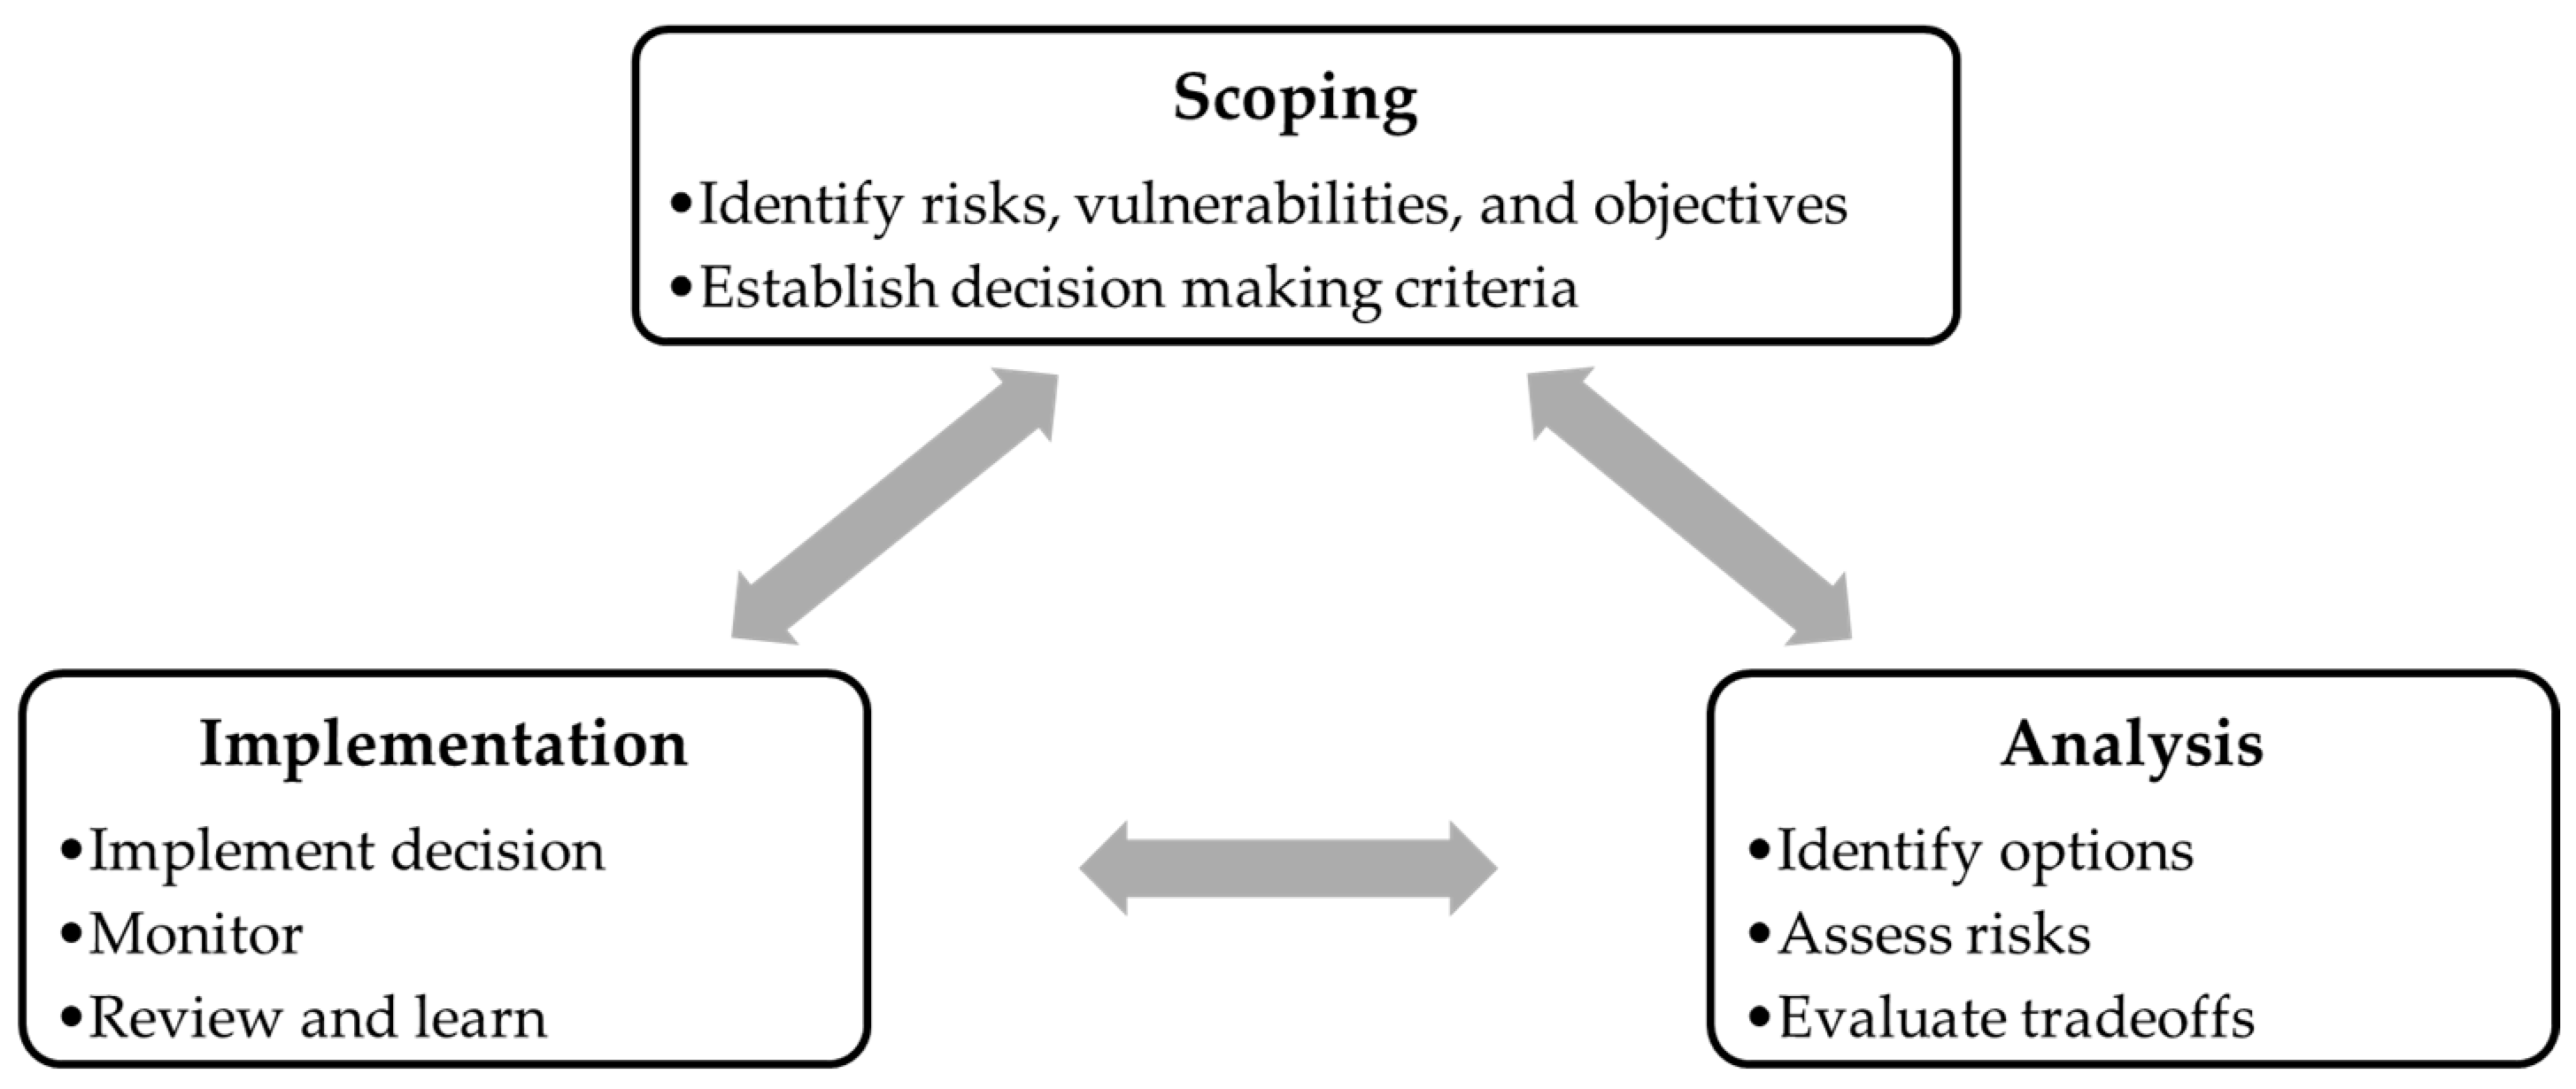
Figure 1. Iterative risk management framework representing the assessment process. Source: Authors’ own elaboration based on the Technical Summary [41].
Climate 12 00104 g001
Figure 2. Risk Assessment Methods. Source: Authors’ own elaboration based on the Fifth Assessment Report [39].
Climate 12 00104 g002
Figure 3. Panama location map. Source: Authors’ own elaboration.
Climate 12 00104 g003
Figure 4. Literature review process. Source: Authors’ own elaboration.
Climate 12 00104 g004
Figure 5. Research methodology diagram. Source: Authors’ own elaboration.
Climate 12 00104 g005
Figure 6. Number of reports of floods, landslides, and strong winds in Panama for the period 1933–2019. Source: Authors’ own elaboration with data from DesInventar [50].
Climate 12 00104 g006
Figure 7. Number of flood reports by province in the period 1933–2019. Source: Authors’ own elaboration with data from DesInventar [50].
Climate 12 00104 g007
Figure 8. Number of landslide reports by province in the period 1937–2019. Source: Authors’ own elaboration with data from DesInventar [50].
Climate 12 00104 g008
Figure 9. Number of extreme wind reports by province in the period 1986–2019. Source: Authors’ own elaboration with data from DesInventar [50].
Climate 12 00104 g009
Figure 10. Main effects of climate change by climate region. Source: Authors’ own elaboration based on Panama’s National Climate Change Strategy 2020–2050 [58].
Climate 12 00104 g010
Figure 11. Climate Change Vulnerability Map of the Republic of Panama. Source: Climate Change Vulnerability Index [45].
Climate 12 00104 g011
Table 1. Main impacts of climate change in Panama by climate regions.
Climatic Regions Main Impacts
Water ResourcesCoastal ZonesTowns
Western Caribbean RegionIncrease in the frequency of extreme precipitation events.
Increase in floods/landslides.
Sea Level Rise.
Shoreline erosion.
Exposure to marine intrusion.
Affectation of mangrove areas.
Loss of coastal land.
Prolonged flooding.
Affected by floods.
Increased susceptibility to flooding.
Western Pacific RegionIncrease in the frequency of extreme precipitation events.Exposure to marine intrusion.
Flooding from high tide events.
Increased susceptibility to flooding.
Arco Seco RegionIncrease in the frequency of extreme precipitation events.
Warmer temperatures in the summer.
Increased occurrence of dry riverbeds.
Increase in the frequency, intensity, and duration of droughts.
Flooding from high tide events.
Sea Level Rise.
Contamination of aquifers by saline intrusion.
Affectation of mangrove areas.
Affected by windstorms.
They were affected by storm surges.
They were affected by landslides.
Affected by floods.
Increased susceptibility to flooding.
Central RegionIncrease in the frequency of extreme precipitation events.
Increase in floods/landslides.
Increase in precipitation intensity.
Impact on water systems.
Impact on the operation of the Panama Canal.
Sea Level Rise.
Presence of strong winds.
Loss of coastal land.
Prolonged flooding.
Impact on the rainwater and wastewater system.
Damage to port facilities.
No impacts were identified.
Eastern Pacific RegionIncrease in the frequency of extreme precipitation events.No impacts were identified.No impacts were identified.
Eastern Caribbean RegionIncrease in the frequency of extreme precipitation events.Impact on wetlands.
Effects on ecosystems and vegetation.
No impacts were identified.
Source: Panama’s Third National Communication 2050 [46].
Disclaimer/Publisher’s Note: The statements, opinions and data contained in all publications are solely those of the individual author(s) and contributor(s) and not of MDPI and/or the editor(s). MDPI and/or the editor(s) disclaim responsibility for any injury to people or property resulting from any ideas, methods, instructions or products referred to in the content.