Article

Assessing Future Precipitation Patterns, Extremes and Variability in Major Nile Basin Cities: An Ensemble Approach with CORDEX CORE Regional Climate Models

1
Department of Natural Resources, Faculty of African Postgraduate Studies, Cairo University, Giza 12613, Egypt
2
Earth Science Institute v.v.i. of the Slovak Academy of Sciences, 840 05 Bratislava, Slovakia
3
Instituto Pirenaico de Ecologia, CSIC, Campus de Aula Dei, 1005, 50059 Zaragoza, Spain
*
Author to whom correspondence should be addressed.
Climate 2024, 12(1), 9; https://doi.org/10.3390/cli12010009
Submission received: 20 December 2023 / Revised: 5 January 2024 / Accepted: 11 January 2024 / Published: 14 January 2024

Abstract

:
Understanding long-term variations in precipitation is crucial for identifying the effects of climate change and addressing hydrological and water management issues. This study examined the trends of the mean and four extreme precipitation indices, which are the max 1-day precipitation amount, the max 5-day precipitation amount, the consecutive wet days, and the consecutive dry days, for historical observations (1971–2000) and two future periods (2041–2060/2081–2100) under RCP2.6 and RCP8.5 emission scenarios over the Nile River Basin (NRB) at 11 major stations. Firstly, the empirical quantile mapping procedure significantly improved the performance of all RCMs, particularly those with lower performance, decreasing inter-model variability and enhanced seasonal precipitation variability. The Mann–Kendall test was used to detect the trends in climate extreme indices. This study reveals that precipitation changes vary across stations, scenarios, and time periods. Addis Ababa and Kigali anticipated a significant increase in precipitation across all periods and scenarios, ranging between 8–15% and 13–27%, respectively, while Cairo and Kinshasa exhibited a significant decrease in precipitation at around 90% and 38%, respectively. Wet (dry) spells were expected to significantly decrease (increase) over most parts of the NRB, especially during the second period (2081–2100). Thereby, the increase (decrease) in dry (wet) spells could have a direct impact on water resource availability in the NRB. This study also highlights that increased greenhouse gas emissions have a greater impact on precipitation patterns. This study’s findings might be useful to decision makers as they create NRB-wide mitigation and adaptation strategies to deal with the effects of climate change.

1. Introduction

Climate change is an ongoing global phenomenon that has significant impacts on various aspects of our planet, including weather patterns, ecosystems, and human societies. Observations of the global climate system over the past century have revealed numerous changes, many of which are consistent with the effects of greenhouse gas emissions and other human activities [1]. Climate change is expected to have significant impacts on extreme climate indices as it is already affecting the frequency, intensity, and duration of extreme weather and climate events. Rising global temperatures are causing more frequent and intense heat waves, while changes in precipitation patterns are leading to more frequent and intense droughts and heavy precipitation events [2,3]. Extensive research and analysis have been devoted to historical precipitation trends at both the global and local levels, resulting in significant insights regarding climate patterns and potential temporal changes. Changes in precipitation levels have been observed in numerous regions. As an illustration, annual precipitation in the United States has increased by 4% since 1901 [4]. Within the African continent, the Sahel and southern regions have witnessed a consistent annual increase in precipitation of around 36 mm per decade [5]. Conversely, drought conditions have been observed in other regions like East Africa [5], Pakistan [6], and Italy [7]. In the same context, a considerable body of research has been dedicated to examining rainfall changes in different major cities across the globe. Depending on the objectives of these studies, these investigations are frequently carried out at the local or basin scale [8,9,10,11]. In addition, global river basins like the Amazon, Congo, and Mississippi have seen changes in precipitation levels. For instance, the results demonstrate that the highest rainfall events have increased in frequency over the Mississippi and Yangtze River basins in recent decades, whereas the lightest precipitation has decreased. Also, it is expected under the RCP8.5 emission scenario that flooding from the Mississippi and Yangtze River basins will worsen in the central and eastern areas of the United States and China, respectively [12]. Furthermore, in the Amazon Basin, the world’s largest rainforest, modeling studies suggest that land cover changes in the Amazon basin could lead to a reduction in precipitation and an increase in temperature [13,14]. Significant precipitation variability has recently had an impact on Africa, with severe droughts and floods in arid nations like Algeria, Tunisia, Egypt, and Somalia occurring in the 1970s and 1980s in the Horn of Africa and West Africa, a multi-year drought in South Africa’s winter rainfall region, and more [15,16].
Global climate models (GCMs) are frequently insufficient in the representation of fine-scale regional processes, particularly those influenced by complex topography, land use heterogeneity, coastal lines, and mesoscale convection, due to their coarse horizontal spatial resolution [17]; therefore, GCM climate projections should be downscaled to regional or local scales using statistical [18], or dynamic downscaling techniques with regional climate models (RCMs), which have been used to generate a high resolution [19]. Numerous studies, such as [20,21,22], have examined the COordinated Regional-Climate Downscaling Experiment’s (CORDEX’s) future climate projections for Africa. Additionally, based on the observational or reanalysis dataset, the historical trend of extreme climate indices over the upper Blue Nile basin investigated by [23,24], over the Nile River basin [25], and over the Jemma sub-basin, Ethiopia [26], also employed the Weather Research and Forecasting (WRF) model [27]. Due to the complexity of the African climate and the constraints of RCMs and GCMs, climate projections across Africa are characterized by significant levels of uncertainty [28]. Therefore, in this study, we used an ensemble of CORDEX CORE with horizontal resolution (0.22°, nearly 25 km) to estimate the future projections of extreme precipitation indices for the Nile Basin’s main cities and to address uncertainties associated with long-term climate projections.
The Nile River Basin (NRB) is threatened by anthropogenic factors, such as population growth, water demands, and hydroelectric power water usage, and natural factors due to climate variability and change, which encourage extremes like drought factors. Many climate-sensitive industries, including agriculture, cattle, water resources, and health, are impacted by climate change [29]. Because rain-fed agriculture predominates over irrigated agriculture for food production, there is a limited supply of water available, and water demand is rising, making the NRB sensitive to the effects of climate change [30]. Understanding the potential effects of climate change on the NRB’s future water resources is urgently needed since they may decline or rise due to rising temperatures that increase evaporation loss, reduce precipitation, and alter precipitation patterns. Precipitation extremes at the city level are crucial for understanding the vulnerability of cities in the Nile Basin to flooding and droughts. These extremes can have localized impacts, as cities often have unique geographical features, land use patterns, and infrastructure systems that can amplify or mitigate the impacts of extreme precipitation events [31]. The main cities of the Nile Basin are densely populated and have critical infrastructure systems, making them particularly vulnerable to flooding and drought. Therefore, assessing precipitation extremes helps identify areas at higher risk, enabling better urban planning, resilient infrastructure, disaster preparedness, and climate change adaptation, while research on extreme precipitation in metropolitan capital cities is crucial. It gives communities the information they need to make wise choices and take preventative action to safeguard locals, infrastructure, and the environment from the effects of extreme weather events.
As a significant hydrological system in northeastern Africa, the Nile River Basin has been a focal point of scientific investigation into precipitation trends and patterns. Numerous studies have added to our understanding of the basin’s historical fluctuations in precipitation, giving light to the complex interconnections between climatic conditions and hydrological systems [32]. The Nile Basin’s climate is characterized by a strong latitudinal wetness gradient [33], with 28% receiving less than 100 mm annually. Some parts experience hyper-arid conditions from northern Sudan across Egypt, while others exhibit subhumid conditions. Rainfall exceeding 1000 mm is mainly in the equatorial region and Ethiopia [34].
In addition, precipitation patterns in the Nile River Basin are diverse, with some studies showing a rise in water flow during the extended rainy season and others showing a decline in yearly rainfall at specific locations [35]. This is consistent with a decline in yearly precipitation in 69% of monitoring stations in Sudan, Ethiopia, and Egypt [34]. However, there is disagreement on the spatial pattern of these trends, with some studies observing a rise in yearly precipitation in specific areas [36]. Climate change is also a factor with forecasted increases in rainfall in the upper Blue Nile River Basin [37,38]. So, this study contributes significantly to the understanding of long-term precipitation variations in the Nile River Basin (NRB) by employing a comprehensive approach that incorporates historical observations, future projections under different emission scenarios, and a range of extreme precipitation indices. Notably, our research introduces the novel application of the empirical quantile mapping procedure to enhance the performance of regional climate models (RCMs). Therefore, this study aims to (1) investigate the projected changes in the mean and extreme precipitation for the NRB’s major capitals, (2) examine historical and future trends of precipitation, providing insights into past climate patterns and helping to establish a baseline to compare future changes, (3) explore the historical and future spatiotemporal trends in extreme precipitation indices under RCP2.6 and RCP8.5 scenarios for the mid-future 2041–2060 and far future 2081–2100 periods.

2. Materials and Methods
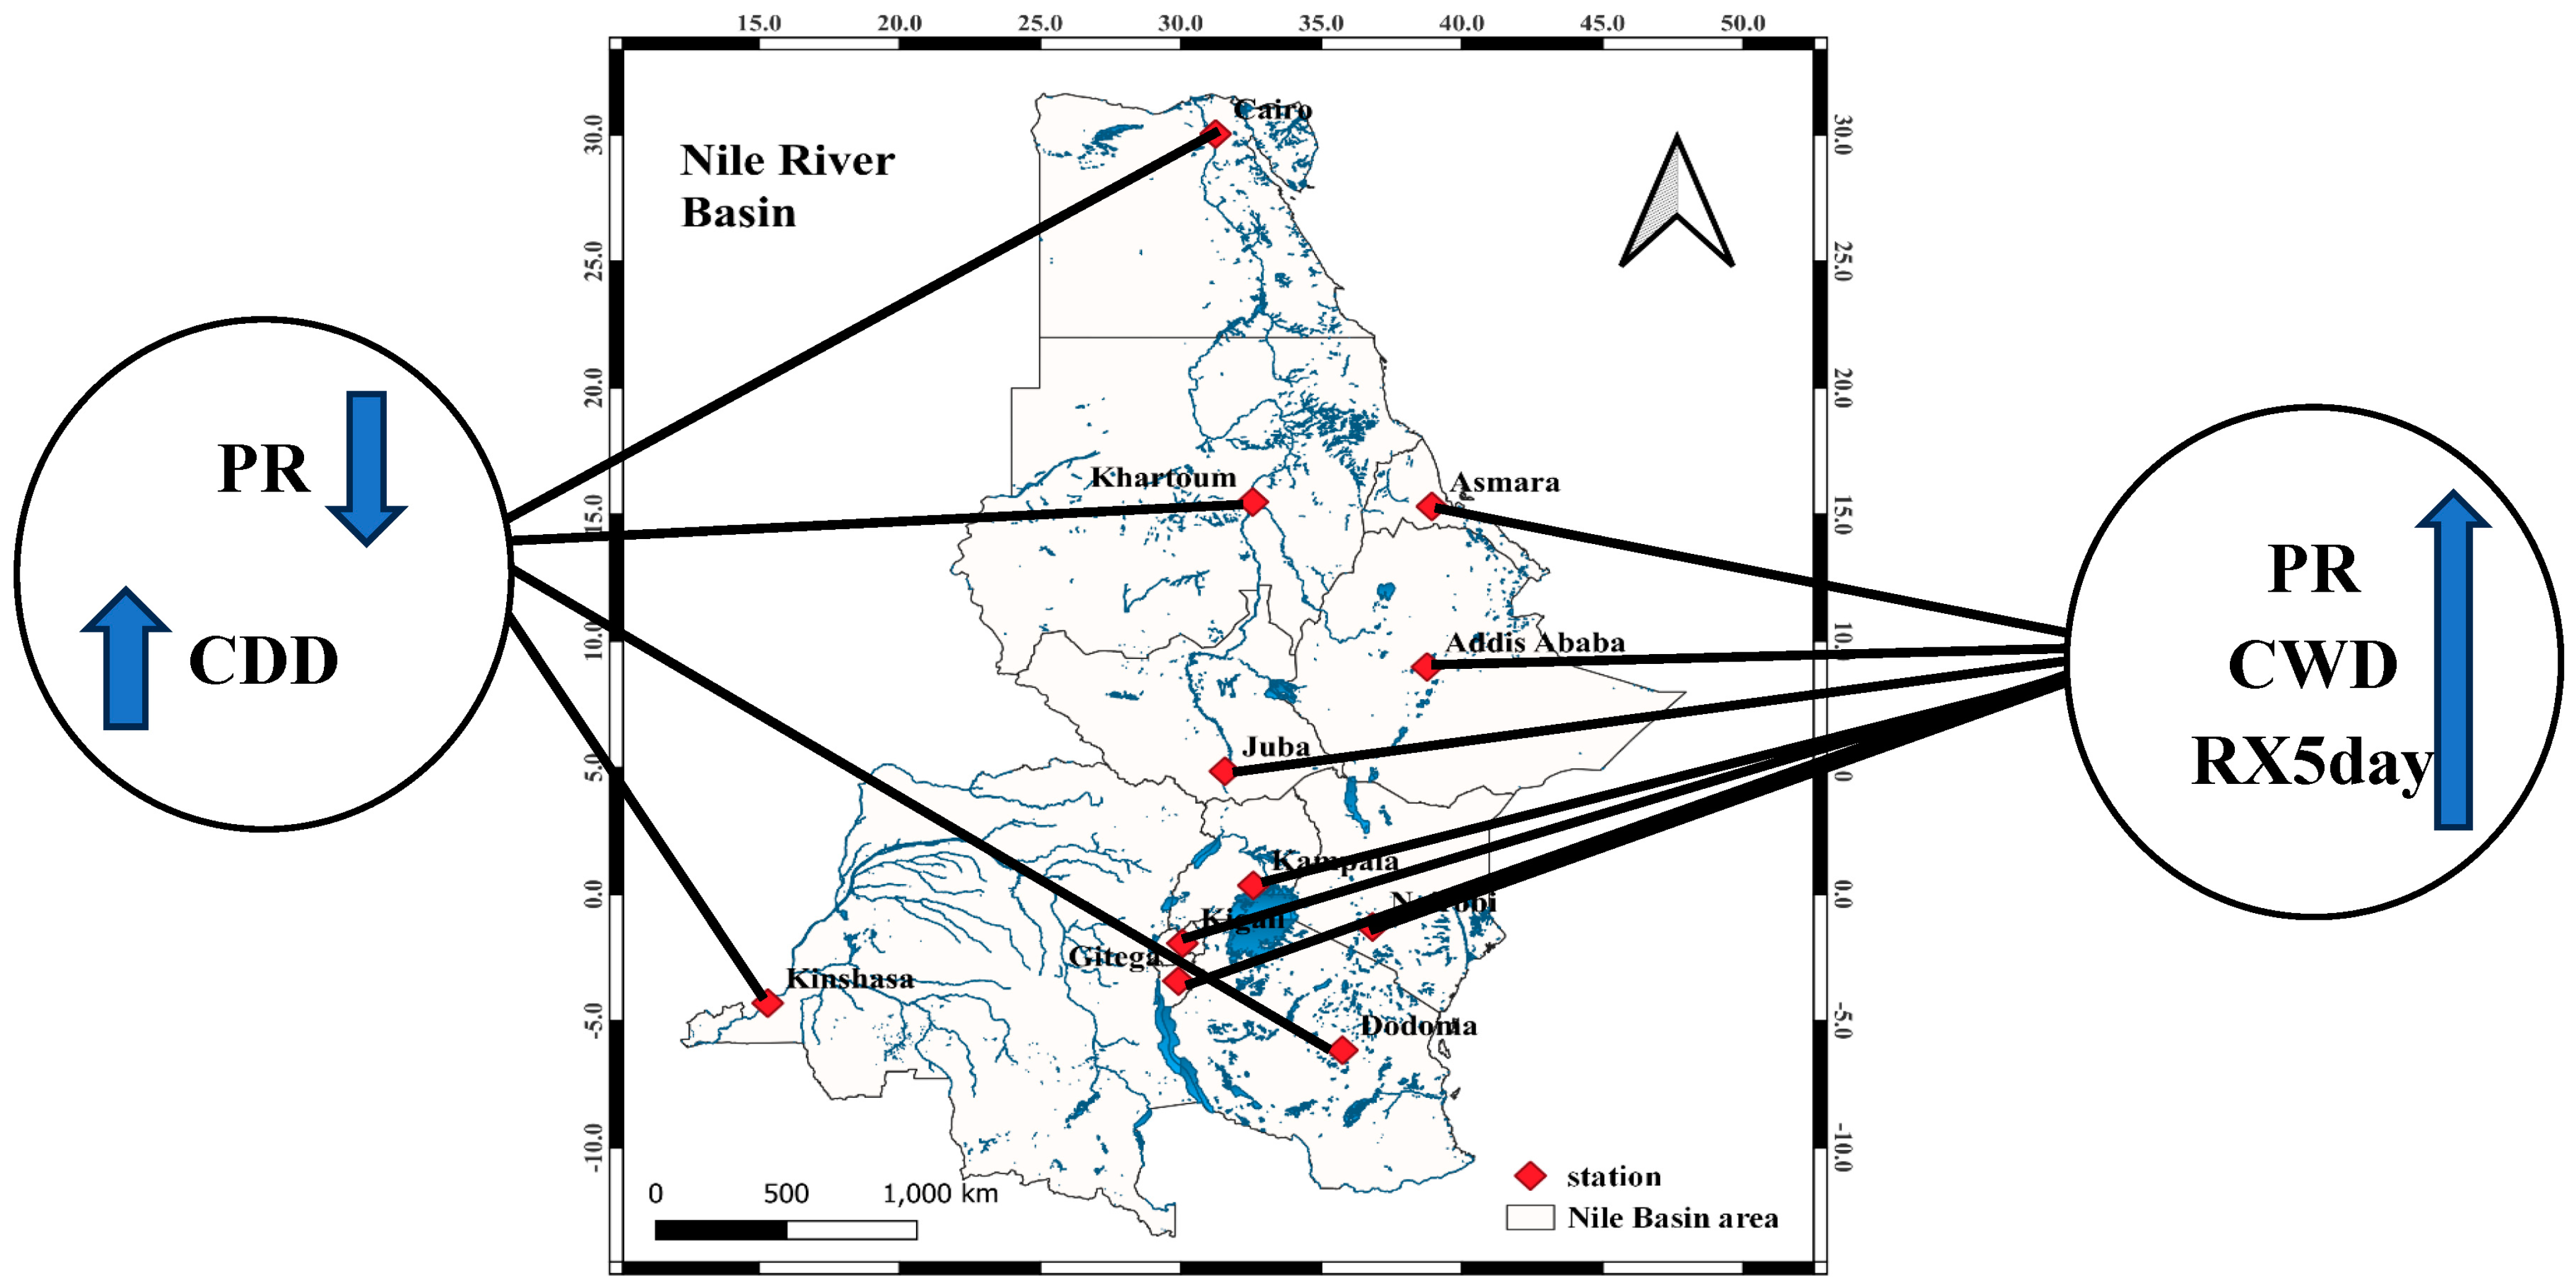
2.1. Study Area

The catchment area of the NRB is approximately 3 × 10⁶ km2 (Figure 1). The NRB has 11 riparian nations, including Burundi, Rwanda, Uganda, Kenya, Tanzania, South Sudan, the Democratic Republic of the Congo, Sudan, Eritrea, Ethiopia, and Egypt. It is the longest river in the world under desert conditions. One-fifth of Africa’s population depends on the Nile River for survival [39]. The water of the NRB is essential to the economies and way of life of 300 million people in the 11 riparian nations [40]. Most of these riparian nations’ economies depend heavily on the Nile, particularly Egypt and Sudan at its downstream end. Within the next 25 years, it is anticipated that the population of the NRB will double [41]. The rising temperature and changes in the pattern of precipitation in the NRB, when combined with these human-induced effects, may have negative effects on the region’s population [42]. Therefore, assessing future projections of extreme precipitation indices over the main Nile River Basin cities is important. These cities include Addis Ababa, Asmara, Cairo, Dodoma, Gitega, Juba, Kampala, Khartoum, Kinshasa, and Nairobi, as listed in Table S1. The selected cities are good representations of the dominant climatic conditions in the whole basin. Moreover, these cities are highly populated and have vital infrastructure systems, such as structures, roadways, and drainage systems. Due to the concentration of people and resources, these urban regions are particularly susceptible to flooding and droughts. Understanding how extreme events are projected to change in the future can help stakeholders make informed decisions about adapting to changing climate conditions and managing the risks posed by climate change.

2.2. Observed Dataset

Rainfall data from the Climate Hazards Group Infrared Precipitation with Stations (CHIRPS) version 2 developed by the Climate Hazards Group of the University of California was used because many satellite-based rainfall products with a long-time series have coarse spatial and temporal resolutions and are not homogeneous. The CHIRPS dataset is a quasi-global rainfall dataset that spans from 1981 to almost the present and covers 50° S to 50° N. To construct a gridded rainfall time series, it combines in situ station data with 0.05° × 0.05° resolution satellite imagery, and it can be downloaded free from http://chg.geog.ucsb.edu/data/chirps (accessed on 10 July 2023). [43].

2.3. CORDEX-CORE Africa Dataset

Climate models are essential tools for understanding the Earth’s climate system, providing long-term projections, global and regional insights, and integrating multiple components [44]. They enable the exploration of different emission scenarios and contribute to the development of climate change mitigation and adaptation strategies [45]. However, they also have inherent uncertainties due to the complexity of the climate system and limitations in representing certain processes. Models operate at grid resolutions, and they may have biases or inaccuracies. They also require substantial computational resources, which can limit the number of scenarios explored. Some models are sensitive to initial conditions, causing divergent outcomes. Limited process understanding and increased model complexity can also pose challenges [46].
To determine and examine precipitation variability, trends, and its distributions in the NRB’s main stations, the daily data of precipitation were simulated using CORDEX-CORE for historical (1971–2000) and two different forthcoming periods (2041–2060 and 2081–2100). The Coordinated Regional Climate Downscaling Experiment (CORDEX) is an international initiative that aims to provide high-resolution regional climate projections for different parts of the world [44]. The CORDEX initiative focuses on developing RCMs that are based on global climate models (GCMs), which are downscaled to provide higher-resolution climate projections at the regional scale. The Earth System Grid Federation (ESGF) nodes, such as http://esgf-node.dkrz.de/ (accessed on 1 July 2023), allow users to obtain the list of CORDEX climate models that is shown in Table 1. These simulation outputs are accessible on the CORDEX-Africa domain and have a spatial resolution of 0.22° per grid increment. In addition, Representative Concentration Pathways (RCPs) are a collection of hypothetical situations used by climate models to predict future climate change [47]. These RCPs cover a wide range of emission levels, from very low (RCP2.6) to very high (RCP8.5). They offer a consistent framework for contrasting various climatic scenarios and determining the probability of various outcomes [48]. A multi-model ensemble approach is a straightforward and widely used method for processing the simulations of several climate models [49]. By minimizing the influence of any one model’s biases or uncertainties, this method is frequently used to raise confidence in the projections [50]. As a result, in this study, the ensemble mean of six model RCMs (hereinafter ENSEM) was used in the studies to generate probable future climate change scenarios.

2.4. Calculation of Extreme Events

Extreme climate indices are a set of climate variables and statistical measures that describe extreme weather and climate events [57]. These indices are designed to capture the frequency, intensity, and duration of extreme events, such as heatwaves [58], cold spells [59], heavy precipitation [60], and droughts [61]. Extreme climate indices are widely used in climate research, impact assessments, and adaptation planning, as they provide valuable information on the changing frequency and intensity of extreme events under climate change [62,63]. Precipitation indices describe the frequency, intensity, and duration of extreme precipitation events, such as the number of heavy precipitation days, the total amount of precipitation in each period, and the duration of dry spells [64]. The Expert Team on Climate Change, Detection, and Indices (ETCCDI) were created to sample a wide range of climates and were derived using a method that has been thoroughly developed [65]. The list of four extreme precipitation indices used in this paper is listed in (Table 2).

2.5. The Mann–Kendall (MK) Trend Test

The goal of this research’s methodological approach was to identify trends in a time series of rainfall indices derived from a daily rainfall series over NRB capitals. The non-parametric Mann–Kendall (MK) test statistic [66,67] was used, with a 5% level of significance. The MK test statistic is independent of both space–time monitoring and the size of missing data values. The standard MK trend statistic (S) was computed using the mathematical formula in Equation (1).
S = k = 1 n - 1 j = k + 1 n sgn ( X j X k )
where X j and X k are the data values at time j and k respectively, and sgn() is the sign function that returns 1 if X j >   X k , −1 if X j < X k , and 0 if X j = X k . The null hypothesis (H0) stated that there was no trend, while the alternative hypothesis (H1) suggested that there was a trend—either an increasing or decreasing monotonic trend. Equation (2) is used to compute S’s variance.
V a r ( S ) = n ( n 1 ) ( 2 n + 5 ) 18
To determine the significance of this trend, the sample size, n, and the related probability, S, are determined. A (Z) value is used to evaluate the trend’s importance; a negative (positive) Z value indicates an uphill (downward) trend. H1 is approved for a two-tailed test at a specific level of significance if |Z| > Z 1/2, where Z 1/2 is calculated from the common normal distribution tables. For statistically determining the significance of the trend, the probability related to MK and the sample size n are determined. Using Equation (3), the normalized test statistic Z is calculated.
Z = S 1 V a r ( S )   if   S > 0 = 0   if   S = 0 = S + 1 V a r ( S )   if   S < 0
If Z is negative and computed, the probability exceeds the level of significance, and the trend is thought to be diminishing. In related studies [68,69], this methodology has been successfully applied.

2.6. The Empirical Quantile Mapping Bias Method

Empirical quantile mapping (EQM) is a bias elimination method that adds mean and individual delta changes to observed precipitation distribution quantiles to calibrate a model’s cumulative distribution function [70]. By combining both the probability distribution function (PDF) to the cumulative distribution function (CDF) and building a transfer function, such quantile-to-quantile matching aligns all moments of the model (PDF). The raw model precipitation is converted into corrected model precipitation using this function [71,72], as shown in Equation (4).
P c o r , m , d = E C D F o b s , m 1 ( E C D F r a w , m P r a w , m , d )
where P c o r , m , d and P r a w , m , d are the corrected and uncorrected forms of model precipitation, respectively. E C D F r a w , m is the direct function of P r a w , m , d while the inverse function corresponding to the observed precipitation distribution is E C D F o b s , m 1 .

3. Results

Understanding the severity and frequency of extreme climate events is crucial since they have an impact on a variety of socioeconomic activities [73]. Extreme occurrences can have disastrous effects; thus, it is crucial to look at how they develop in the coming years and at the end of the century to make the best planning decisions. The precipitation for each dataset (observation and simulation) was averaged over the grid points within the neighborhood of each city (Figure 1). The simulated indices were calculated over the CORDEX common grid (0.22° × 0.22°). However, both observed and simulated precipitation indices analyses were performed over the CORDEX common grid.

3.1. CORDEX-CORE Evaluation over the NRB Stations

The EQM bias correction method was evaluated in terms of its capacity to bias-correct RCM simulations over time. The bias-corrected (BC) and raw RCM precipitation outputs were compared to the observed precipitation over a 30-year period (1971–2000). The root mean square error (RMSE) between models and observations at the 11 stations before BC are presented in Figure S1a. The results show that the models have moderate to high RMSE values, indicating a significant difference between the model outputs and the observed data. The multi-model ensemble mean (ENSEM) had the lowest RMSE value for almost all stations, suggesting its better performance. For example, in Addis Ababa, RMSE ranged between (7 and 11 mm/day), indicating that the models had moderate-to-high RMSE values, with ENSEM having the lowest RMSE. Also, in Juba, Kampala, Khartoum, Kigali, and Kinshasa, the RMSE values were (5.7 to 13.5 mm/day), with ENSEM having the lowest RMSE at Juba, Kampala, and Kigali, while HADGEM_CLM had the lowest RMSE at Khartoum and Kinshasa.
The correlation coefficients between different models and observations for each station before bias correction are displayed in Figure S1b. The results indicate that most models have a weak or negligible relationship with the observations. HADGEM_CLM shows a slightly stronger positive correlation in Addis Ababa. Similar results were found in Asmara, Cairo, Dodoma, and Gitega. In Juba, Kampala, Khartoum, Kigali, and Kinshasa, most models have correlation coefficients close to zero or slightly negative, with no strong evidence of a significant relationship between the models and observations. However, the correlation coefficients between models and observations show weak or negligible relationships, with some models showing stronger positive or negative correlations. The root mean square error (RMSE) values indicate the magnitude of the difference between the model outputs and observed data. In general, models show moderate-to-high RMSE values, indicating a notable discrepancy between the model results and the observations.
The root mean square error (RMSE) between models and observations at various stations in the NB after bias correction is presented in Figure S2a. The results show that the EQM method largely reduces the biases in RCMs. For instance, wet biases in the MPI_CLM model were reduced from ∼7 to 11 mm/day (raw biases) to ∼1–8 mm/day (corrected biases) over most of the stations. In general, the RMSE values in all bias-corrected RCM models were lowered and considerably closer to the observed values.
The correlation between models and observations at various stations of the Nile River Basin after BC is exhibited in Figure S2b. The results demonstrate improvements in the correlations from 0.01 to 0.2 in raw RCM simulations to over 0.8 after bias correction for all stations. The results show strong positive correlations between the models and the observed data at Addis Ababa, Asmara, Cairo, Dodoma, Gitega, and Nairobi. The correlation coefficients ranged from 0.97 to 1, indicating a relatively strong relationship between the models and the observed data. In Juba, Kampala, Khartoum, Kigali, Nairobi, and Kinshasa, the correlation coefficients ranged from 0.8 to 0.99, indicating a relatively good relationship between the models and the observed data.
However, the performance of RCMs differed, revealing considerable inter-model variances in regional climate simulation performances (Figures S4–S6). For instance, the MPI_CLM and HadGEM_CLM models showed a poorer performance that was less effective at reproducing and simulating seasonal mean precipitation compared to other models (Figures S3–S5). Overall, the EQM procedure was able to improve the performance of all RCMs, particularly those with lower performance, such as the MPI_CLM and HadGEM_CLM models. After the EQM bias correction, inter-model variability decreased, and all models were similar to one another. Similarly, significant improvements in seasonal precipitation variability were obtained after using EQM bias correction (Figures S3–S5).

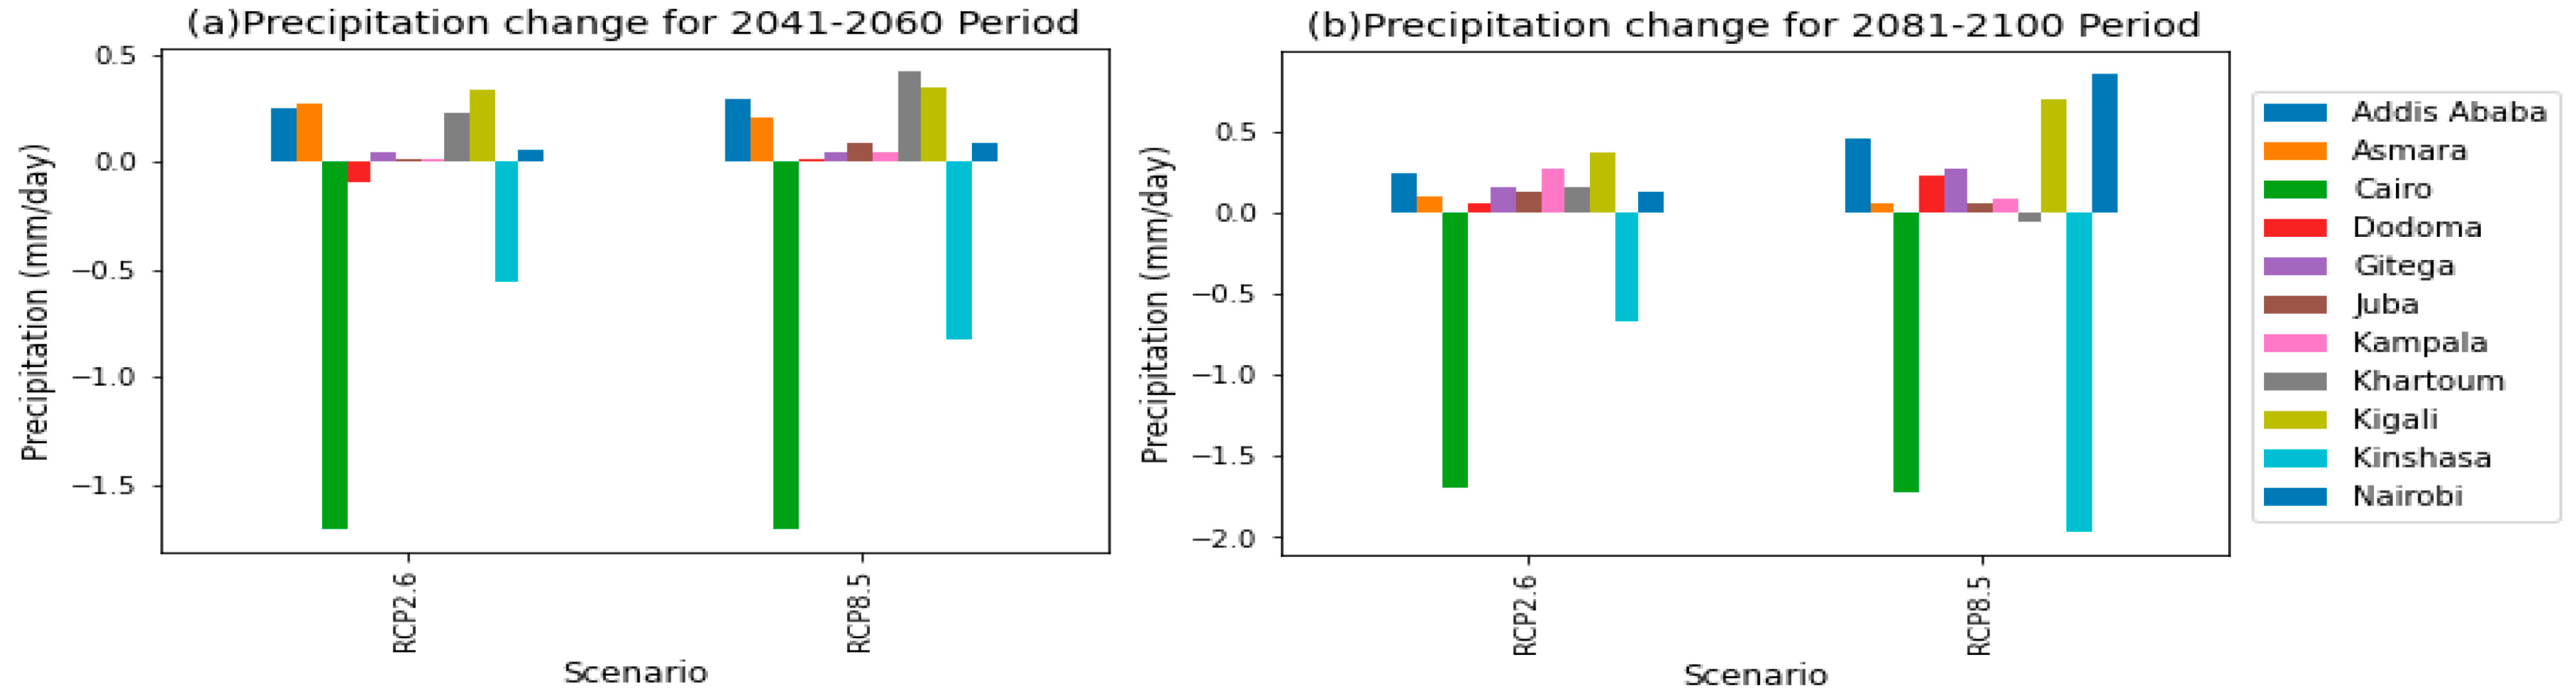
3.2. The Projected Changes in Precipitation

Figure 2 represents the changes in precipitation for different stations under two climate scenarios (RCP2.6 and RCP8.5) for two future time periods (2041–2060 and 2081–2100). The relative changes are expressed as percentages, representing how much precipitation is expected to change compared to the historical baseline period (1971–2000); also, a t-test was used to assess the significance of these changes (Table S2). In the projected periods, most of the locations experience a significant rise in precipitation (based on the RCP2.6 and RCP8.5 predictions). Stations Addis Ababa, Gitega, Juba, Kampala, Kigali, and Nairobi generally experience an increase in precipitation across all scenarios and time periods, with varying magnitudes and significance, while stations Cairo and Kinshasa see a drastic significant reduction in precipitation by 90% and 38% respectively, potentially leading to much drier conditions.
As shown in Figure 2 and Table S2, the Addis Ababa station has an increase in rainfall over the coming future periods, and this increase ranges between 8 and 15% under RCP2.6 and RCP8.5, respectively, while for the Kigali station, the increase ranges between 13 and 27%. As for Nairobi station, the increase in precipitation ranges from 4 to 11%, and there is a large unconfirmed increase in the second period (2081–2100), up to 80%, according to the RCP8.5 scenario. Some stations witness a confirmed increase in rainfall in the first period (2041–2060), such as Asmara station, where the increase reaches 14% and 11%, according to the RCP2.6 and RCP8.5 scenarios, respectively. By contrast, station Gitega is predicted to see a confirmed increase in rainfall during the second period (2081–2100), ranging between 4 and 9% compared to the current period. Additionally, there is a general tendency for increasing precipitation in Juba and Kampala stations, but in different periods, as we found an increase in the first period at Juba station by about 5% according to the RCP8.5 scenario, and it is also expected that this increase will reach about 7% in both stations according to the RCP2.6 scenario. In addition, the Dodoma station will observe a significant decrease in rainfall during the first future period, according to the RCP2.6 scenario, but after that, a significant increase in the proportion of precipitation will occur, reaching 15%, according to the RCP8.5 scenario. On the contrary, in Khartoum station, which will see a confirmed increase in rainfall in the first period, ranging from 25 to 50%, the second period will experience an uncertain decline of about 7% compared to the historical period.

3.3. Historical and Future Precipitation Trend

The annual rainfall trend over the 11 NRB capitals varies from station to station, as presented in Figures S6 and S7. Overall, the results indicate that there is no significant trend in historical data during the first period (2041–2060), with only slight increases in the annual mean precipitation, with no significant trends observed for all the stations. However, during the second period (2081–2100), minor changes in annual mean precipitation, with no statistically significant trends, were observed for almost all stations except Dodoma, Kampala, and Kinshasa. Stations Dodoma and Kampala examined a significant positive MK test, while Kinshasa identified a significant trend for this period.
In particular, the Mann–Kendall test (MK) was conducted to assess annual precipitation trends in various locations, including Addis Ababa, Asmara, Cairo, Dodoma, Gitega, Juba, Kampala, Khartoum, Kigali, Kinshasa, Nairobi. The Addis Ababa station had an insignificant Mann–Kendall test of 0.04, and Cairo had a positive MK of 0.14, while Dodoma had a negative Mann–Kendall test of −0.24, suggesting a potential decreasing trend, though this was not statistically significant. Gitega had a negative test statistic of −0.1, Juba had a negative test statistic of −0.14, Kampala had a positive test statistic of 0.02, Kigali had a negative test statistic of −0.01, and Kinshasa had a positive test statistic of 0.14. The results indicate a significant negative trend in future precipitation compared to historical data.

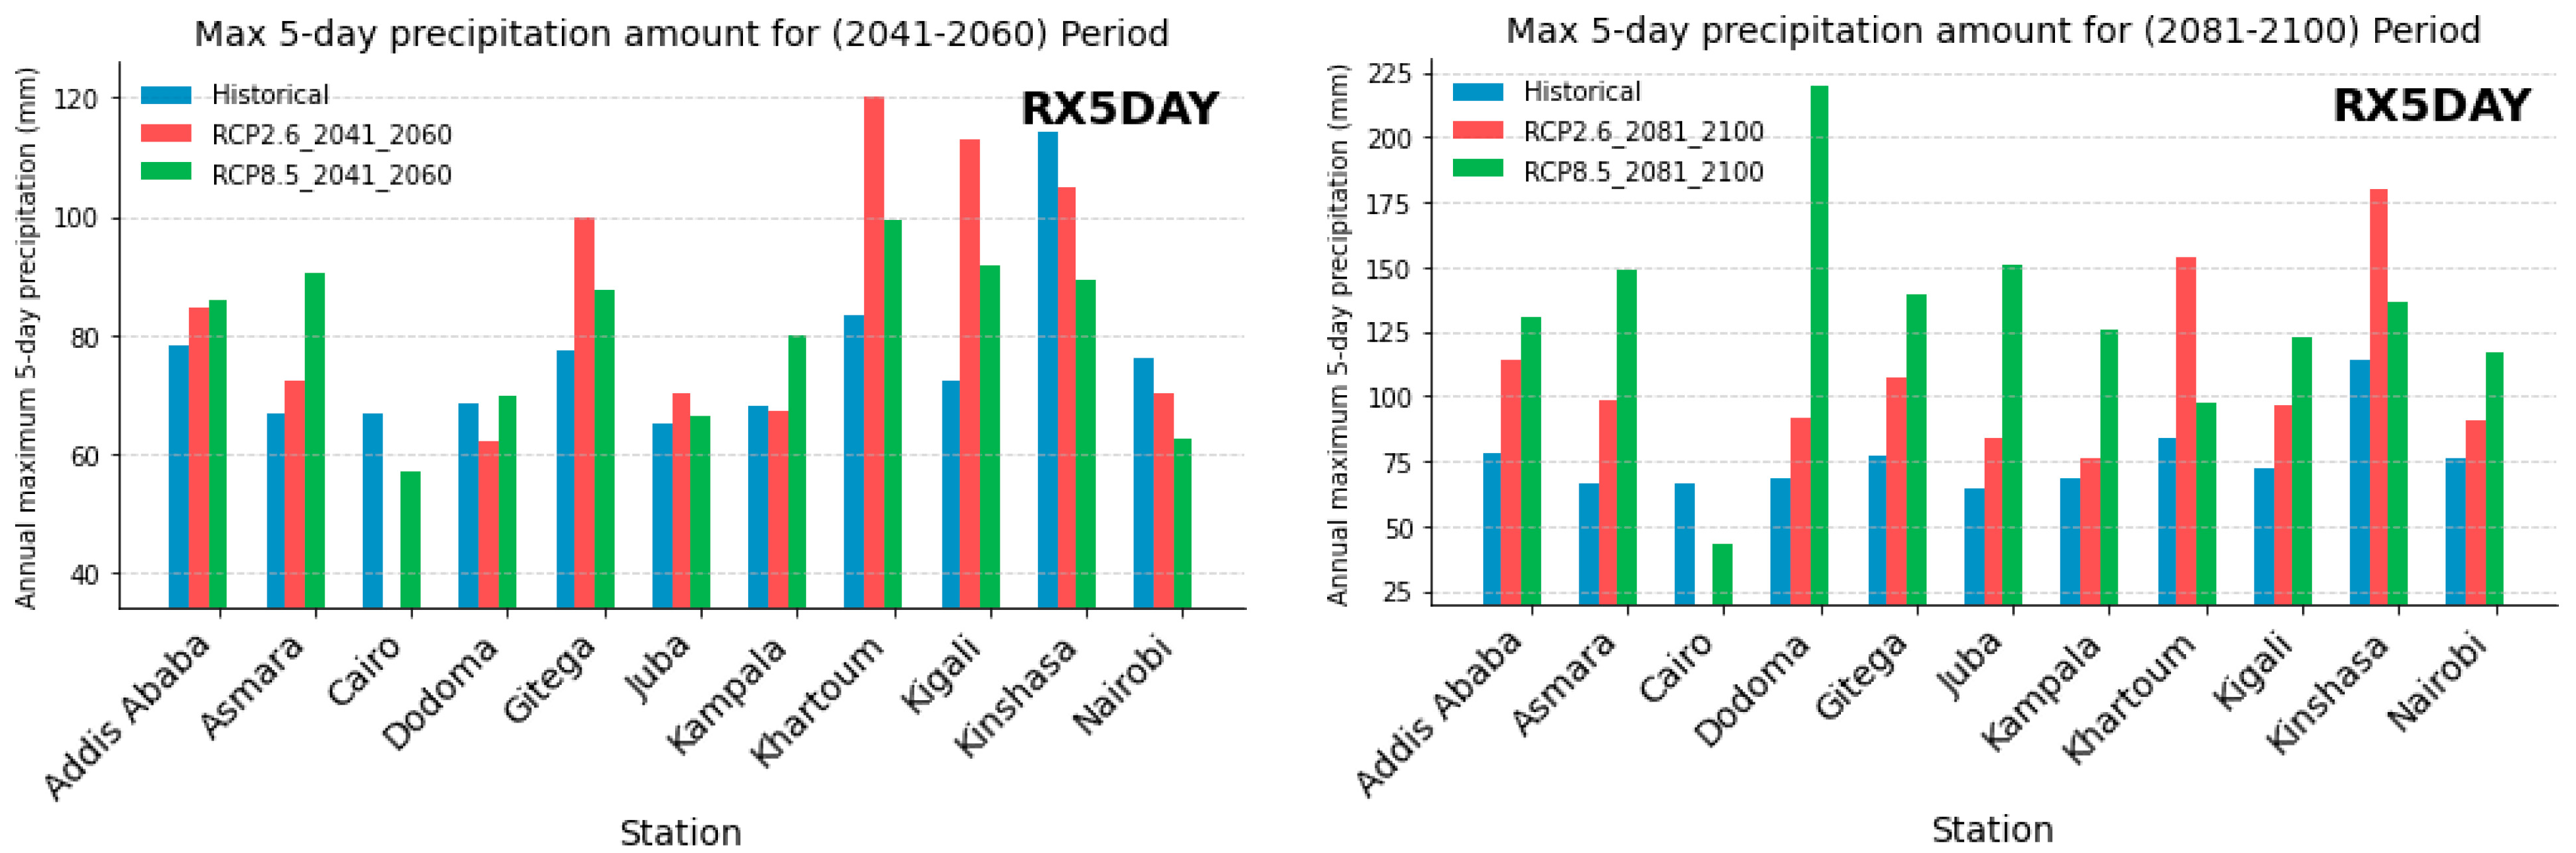
3.4. The Relative Change in RX1Day and RX5Day Indices

When identifying the areas at high risk from changes to the frequency and length of climatic extremes, the projection of the precipitation ETCCDI indicators is crucial. Figure 3 and Figure 4 present the projected relative changes in the RX1Day and RX5Day, respectively, for the periods 2041–2060 and 2081–2100 with respect to the baseline period (1971–2000). The projected relative change in RX1Day is generally like that of RX5Day.
Under RCP2.6, the projected relative changes in the precipitation ETCCDI indices that measure the annual maximum 1-day and 5-day precipitation (RX1Day and RX5Day, individually) indicated a significant increase in nearly all NRB stations up to 94.05 and 56.12%, respectively, for 2041–2061 and 80.54 and 70.05%, respectively, and for 2081–2100. In a similar vein, under RCP8.5, RX1Day, and RX5Day were anticipated to grow in the NRB stations that spanned 77.02 and 35.45%, respectively, for the period 2041–2060 and 268.05 and 221.17%, respectively, for the period 2081–2100 (Table S3).
As presented in Figure 3, most of the stations have an increase in the RX1Day index, but with different percentages and also the extent of confidence, except for the Cairo station, which examined a definite decrease in that index, ranging from 24 to 65% in the first period, but it could face an increase of about 25% in the second period according to the RCP8.5 scenario which indicates the possibility of exposure of the region to cases of sudden heavy precipitation. Also, the increase in the RX1Day index in the second period (2081–2100) is greater than in the first period (2041–2060) when compared to the historical period.
Figure 4 illustrates the projected relative change in the RX5Day index at all the stations under RCP2.6 and RCP8.5 for the two forthcoming periods. An observed increase in RX5Day for more than 70% of stations revealed an increase from RCP2.6 to RCP8.5. Most of the stations have a general increase in the RX5Day index, except for the Cairo, Kinshasa, and Nairobi stations. Cairo station is expected to undergo a definite reduction in the RX5Day index, ranging between 48 and 70% according to RCP2.6 scenario, and about 14–35% according to the RCP8.5 scenario, while stations Kinshasa and Nairobi will have a decrease in the RX5Day index in the first period (2041–2060) ranging between 8–21% and 7–17%, respectively, but this decrease is significant only in the Kinshasa station. During the period (2081–2100), stations will experience a significant rise in the RX5Day index, reaching 57% for Kinshasa and 54% for Nairobi.

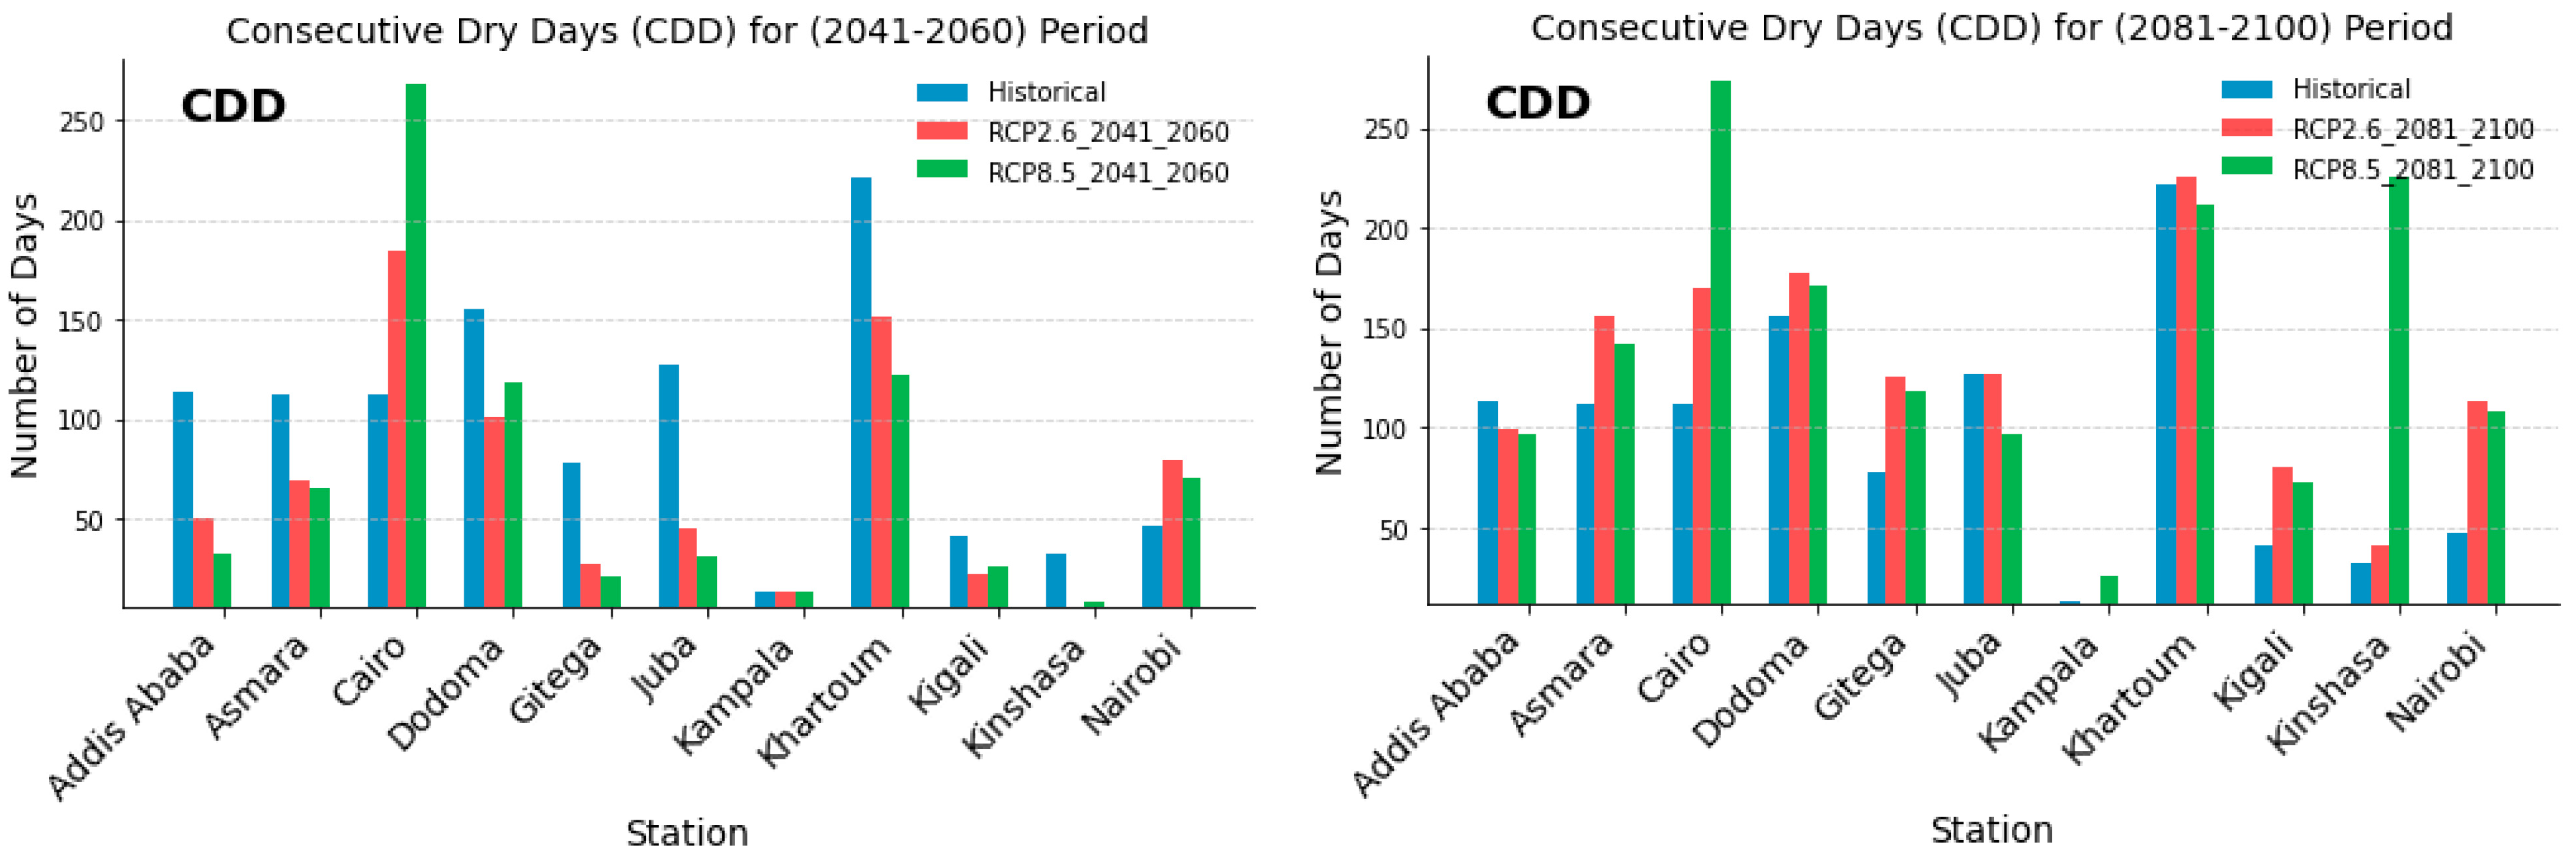
3.5. The Relative Change in the CWD and CDD Index

According to RCP2.6, most of the study area is expected to have a significant drop in the predicted relative changes in consecutive wet days (CWD), with around 72.7 and 45.5% of the study area experiencing a decline in CWD in the 2041s and 2081s, respectively. Likewise, according to RCP8.5 predictions, CWD could fall in the study areas that cover 81 and 72% of the population in the 2041s and 2081s, respectively. Contrarily, the projected relative changes in consecutive dry days (CDD) showed a significant increase in most study areas, with increases in CDD projected for about 27 and 81% of the study region under RCP2.6 and for 27 and 72% of the study region under RCP8.5 in the years 2041 and 2081, respectively (Table S4).
Figure 5 shows the percentage change in consecutive wet days (CWD) compared to the reference period, where most of the stations have a general trend of reduction in the CWD index. The Addis Ababa station will experience a significant increase in CWD for the second period (2081–2100) under RCP2.6, while the rest of the period showed a negative trend. Asmara experienced an insignificant decrease in CWD for all periods and scenarios. Cairo experienced a significant decrease in CWD, ranging from 90% to 94% under RCP2.6. Dodoma experienced a 27% decrease in CWD during the second period (2081–2100), while Gitega experienced a 25% and 35% decrease. Juba experienced a 12% decrease during the first period (2041–2060) and a 78% increase during the second period. Kampala station could experience a 5% increase during the second period (2081–2100), while Khartoum could experience a 27% and 22% increase. Kigali experiences a 10–20% increase in CWD during the first and second periods, while Kinshasa experiences a 15% decrease. In addition, Nairobi could experience a 32% increase in CWD during the second period (2081–2100) under RCP8.5, while under RCP2.6, it could decrease to 34%.
Figure 6 displays the relative change in consecutive dry days (CDD) with relative change values compared to the reference period under RCP2.6 and RCP8.5 scenarios. The Addis Ababa station will experience a significant decrease in CDD for all periods and scenarios, ranging from 55 to 70% during the first period and from 12 to 15% during the second period. Asmara experienced a significant decrease in CDD during the first period, with a 40% decrease, while Cairo experienced a significant increase between 65 and 139% in the first period and 51 to 143% in the second period. Dodoma experienced a 9% increase in CDD during the second period, while Gitega experienced a 61% and 51% increase. Juba experienced a 75% decrease, Kampala experienced a 7% decrease, Khartoum experienced a 31% and 44% decrease, Kigali experienced a 46% and 36% decrease, Kinshasa experienced an 81% and 71% decrease, and Nairobi experienced a general increase in CDD for all periods, but was significant during the second period, with a 140% increase under RCP2.6 and 129% under RCP2.6.

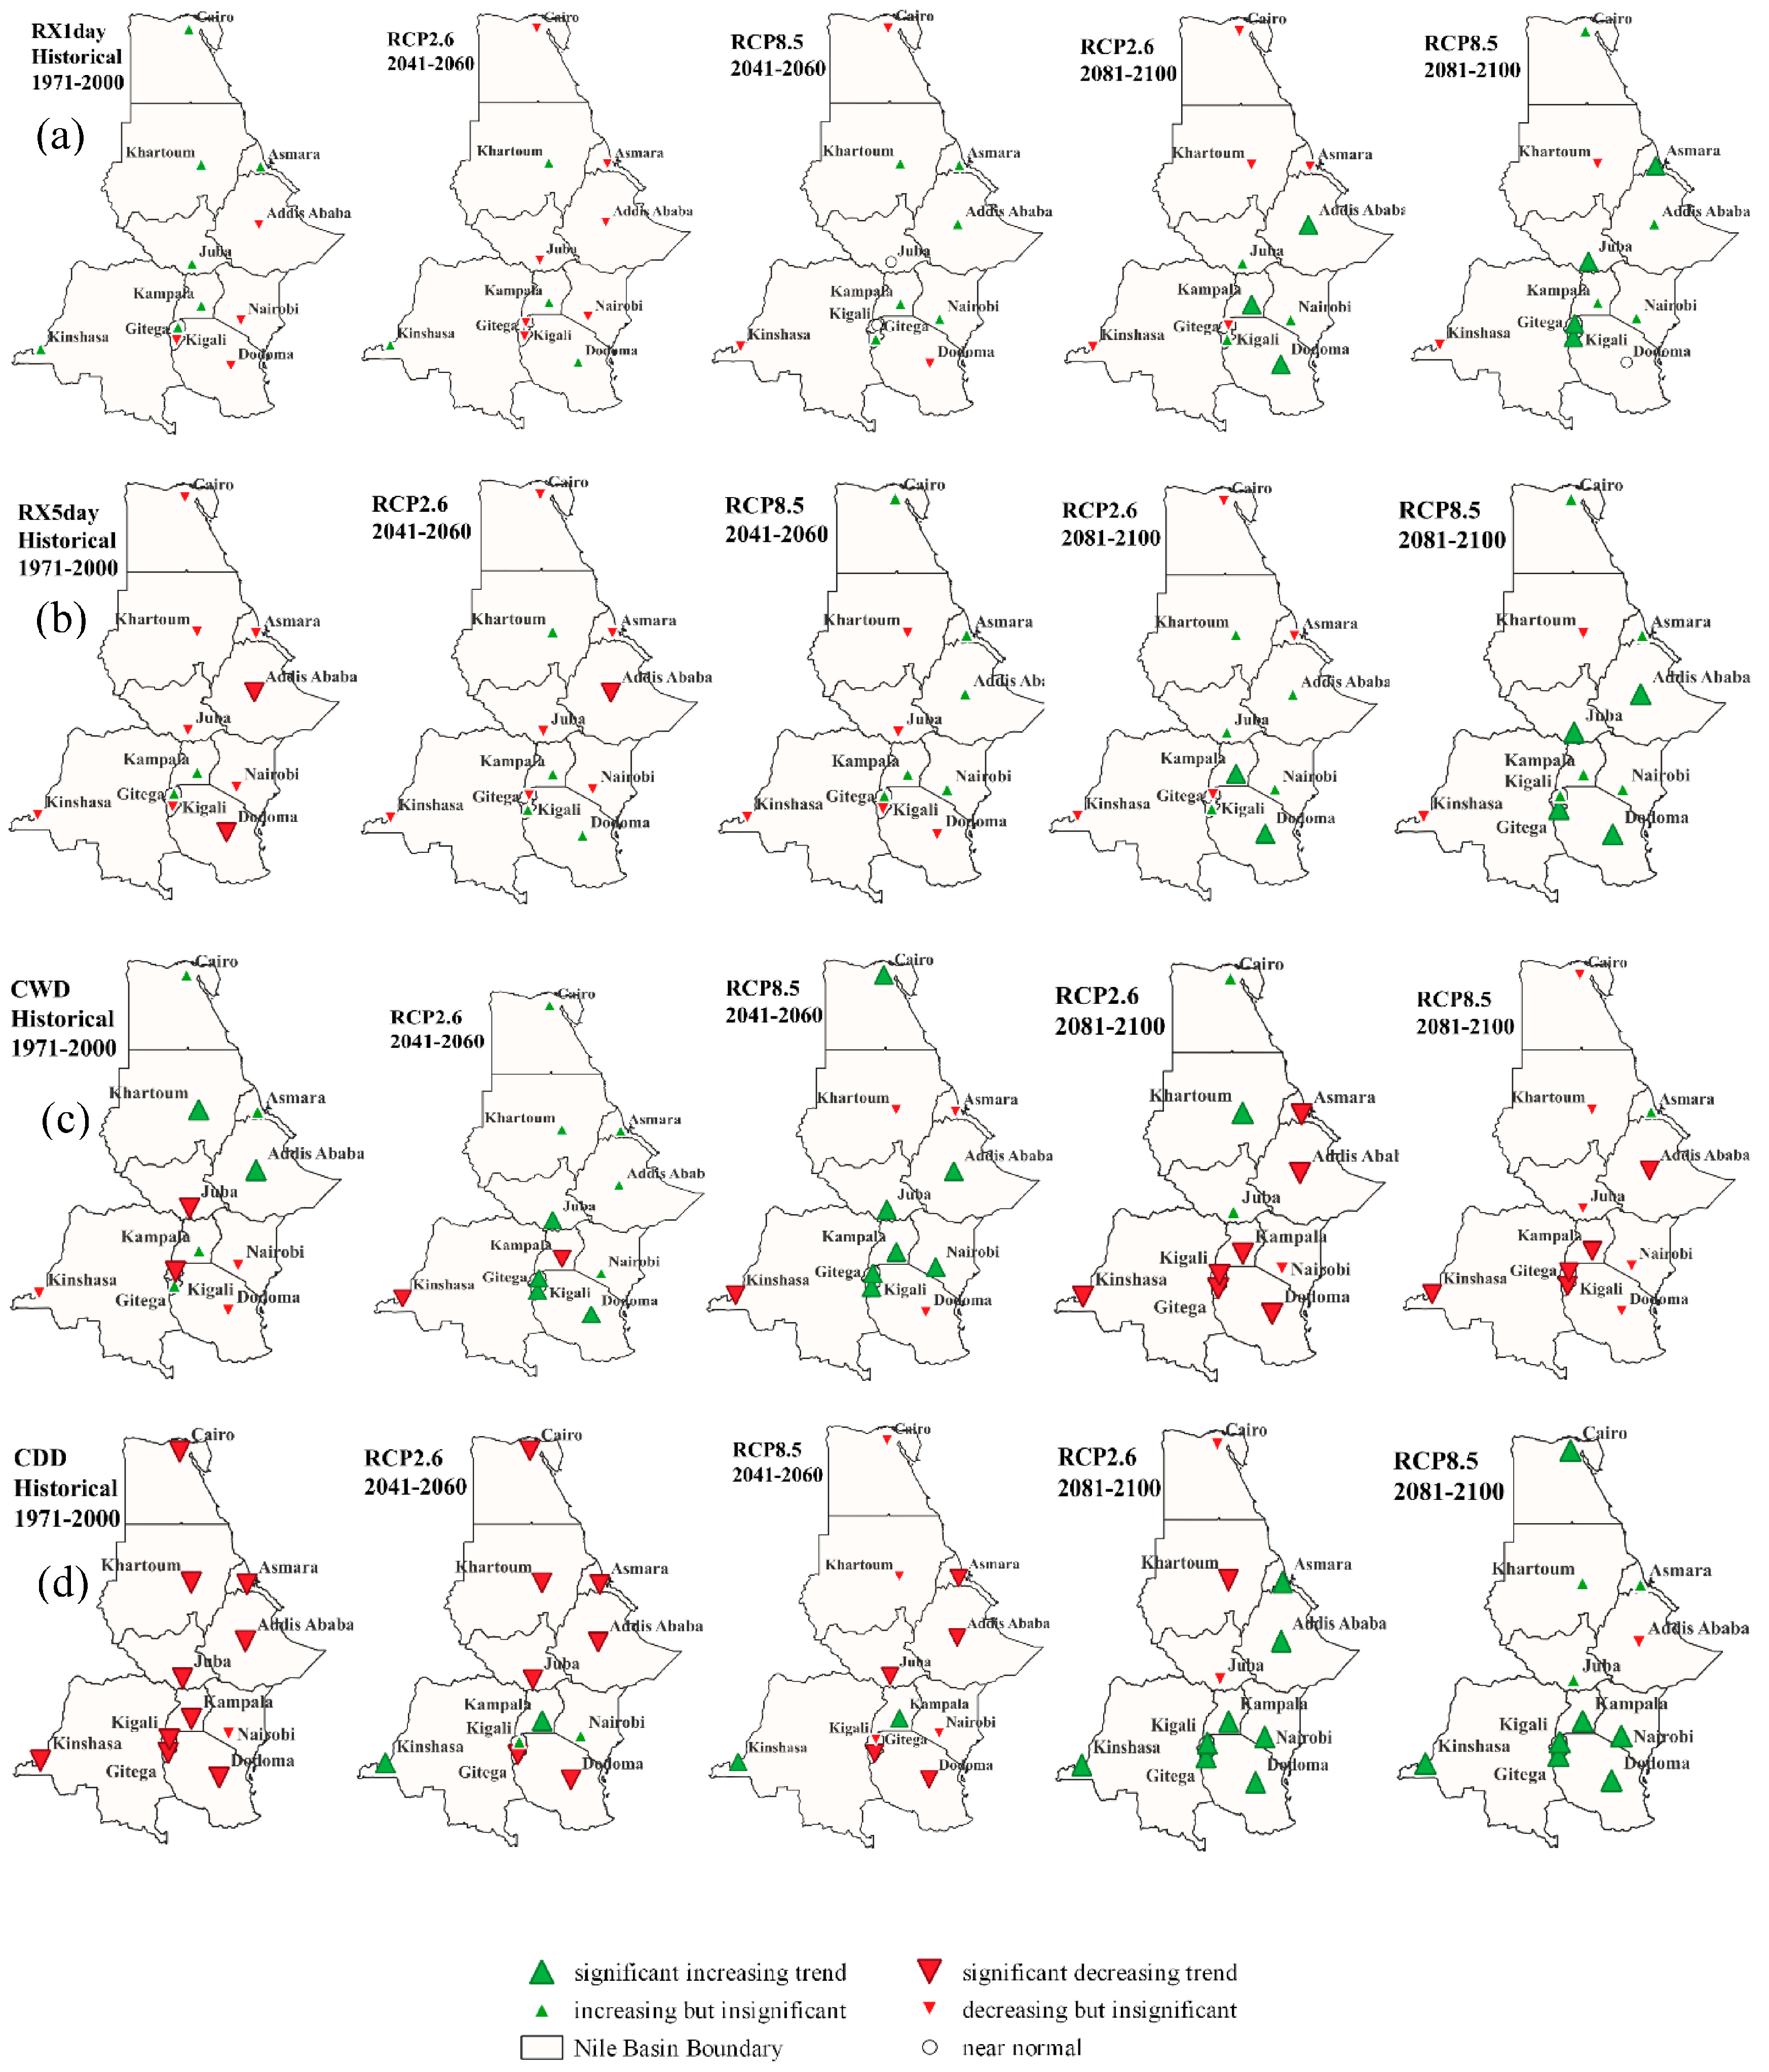
3.6. Spatial Trends of Precipitation Extreme Indices

Even though there is a lot of variation in rainfall events in the Nile River Basin, it is critical to periodically monitor extreme weather and climatic occurrences. Periodic droughts and floods that have an impact on several socioeconomic activities, particularly in the agricultural and water resource sectors, are produced by extremes in the variability, intensity, and frequency of precipitation [74]. Figure 7 represents the results of the Mann–Kendall (MK) test for the four extreme precipitation indices (RX1Day, RX5Day, CWD, and CDD) for each station under different time periods and scenarios.
During the 1971–2000 period, RX1Day in various stations experienced a slight increase. Under RCP2.6, which represents a lower greenhouse gas emissions scenario, the RX1Day index tends to increase or remain relatively stable. However, under RCP8.5, which represents a high emissions scenario, the precipitation shows more variability, with some locations experiencing significant increases and others experiencing decreases. Stations Addis Ababa, Asmara, Dodoma, Juba, Kampala, and Kigali examined a significant positive MK test found during the second period 2081–2100, as presented in Figure 7a.
From Figure 7b, we can observe varying patterns of RX5Day changes across different locations, time periods, and climate scenarios. In the 1971–2000 period, several locations experienced a decrease in RX5Day, like Addis Ababa (−0.34) and Dodoma (−0.49), while others showed stable or slight increases. During 2041–2060, under RCP2.6 and RCP8.5, RX5Day generally increased or remained stable, except for Addis Ababa, which is predicted to undergo a significant reduction in RX5Day (−0.33). In addition, in the far future period (2081–2100), under RCP2.6 and RCP8.5, RX5Day showed more varied changes, with some locations experiencing significant increases, such as Addis Ababa, Dodoma, Gitega, Juba, and Kampala, and others remaining stable or showing slight decreases.
Additionally, Figure 7c presents the results of the MK test of the consecutive wet days (CWD) index for different stations across different climate scenarios (RCP2.6 and RCP8.5) and time periods (1971–2000, 2041–2060, and 2081–2100). The CWD index measures the number of consecutive days with precipitation exceeding a certain threshold (which, in this case, is 1 mm). Looking at the MK test values for the historical period (1971–2000), the CWD values are generally positive or near zero, suggesting that there are typically more consecutive wet days during this time. There was an increase in the CWD index in the stations of Addis Ababa and Khartoum, while the stations of Juba and Kampala exhibited a definite decrease in this index. Both periods (2041–2060) and (2081–2100) show mixed results, with some stations indicating an increase in CWD values (more consecutive wet days) under the RCP2.6 scenario, while others showed decreases in CWD values under RCP8.5. Under both scenarios of RCP2.6 and RCP8.5, stations Addis Ababa, Dodoma, Gitega, Kampala, Kigali, and Nairobi demonstrated a significant increase in RX5Day in the first future period, but in the second future period there could be a definite reduction at these stations. Also, Juba station examined a significant increase in RX5Day, mainly in the first period. In addition, only the Kinshasa station had a significant decrease in RX5Day in all periods and under both scenarios.
Figure 7d shows the distribution of MK test results for the results of the consecutive dry days (CDD) index for different stations under various climate scenarios (RCP2.6 and RCP8.5) and time periods (1971–2000, 2041–2060, and 2081–2100). The CDD index represents the count of consecutive days with precipitation being less than a specific threshold (in this case, 1 mm). The values of the MK test for the historical period (1971–2000) indicate that most stations show negative CDD values, indicating a decrease in consecutive dry days. This might suggest a historical trend toward wetter conditions or fewer prolonged dry periods. Comparing the different climate scenarios (RCP2.6 and RCP8.5), there were variations in the results; some stations under the RCP8.5 scenario showed increases in CDD values, indicating a potential increase in consecutive dry days in the future. In the first future period from 2041–2060, most of the stations had a definite decrease in the successive dry days index, except for Kampala and Kinshasa stations, which had a definite increase in the CDD index. As for the future period 2081–2100, most of the stations exhibited a significant increase in the successive dry day’s index, except for the Khartoum station, where there was a decrease in this indicator according to the scenario RCP2.6.

4. Discussion

Understanding the intensity and frequency of climate extremes like drought and flood is crucial for assessing socioeconomic activities and addressing their impact on various sectors [74]. In this study, we investigated changes in daily rainfall and extreme rainfall indices over the last 30 years (1971–2000) and the forthcoming periods (2041–2060/2081–2100) in the Nile River Basin’s main cities.
However, this study’s results are not representative of the entire Nile River Basin due to practical limitations, but rather is an example of the long-term trend of precipitation extremes among different eco-environments, as not all relief features and geographic areas are covered. This study reveals significant variations in climate extreme trends and varied responses to global warming in diverse regions due to physio-geographical differences. Therefore, the varied topography and relief features of the basin may be responsible for the observed spatial heterogeneity of trends for rainfall extremes [75].
These results support the findings of earlier studies on the severe rainfall indices in various regions of Africa. Positive trends in RX1Day, RX5Day, and CDD, and negative trends on consecutive wet days (CWD) are like those reported in East Africa and Ethiopia by [24], Central Africa [76], West Africa [77], Southern Africa [78], and over the Mediterranean and Sahara regions [79].
On a continental scale, a predicted change in monthly precipitation over the Tana River Basin (Northern Europe) of 2.46% and 2.06%, respectively, from 2071 to 2100, is based on SSP1-2.6 and SSP5-8.5 [80]. Also, the summer precipitation in East Asia would grow and alter dramatically between 2010 and 2099, with a minor increase (1%) before the end of the 2040s and a big increase (9%) afterward [81]. In addition, the future projections for the Mediterranean basin show a strong north/south gradient, with decreasing trends in daily precipitation extremes in the south and Maghreb region and increasing trends in the north. However, 50-year daily precipitation extremes are projected to increase up to 100%, and the contribution of the wettest day to the annual total precipitation is expected to increase [82].
The decrease (increase) in CWD (CDD) at the end of the century was based on the correlations between the East African precipitation Indian Ocean dipole. Thus, the rising of the Indian Ocean’s Sea surface temperature is causing a decline in rainfall [83], which is expected to persist throughout the rest of this century. These existing conditions, in combination with rising CDD, offer considerable difficulties for future rainfed crop output [84]. Also, the Intertropical Convergence Zone (ITCZ) movement governs the intra-annual rainfall distribution in the Upper Blue Nile Basin [85] and the equatorial East Pacific region [34]. In addition, the Gulf of Guinea, the Mediterranean area, and the Arabian Peninsula have an impact on the basin’s rainfall [86]. Similarly, localized climatic factors may have a significant role in determining changes in severe rainfall in this area [87].
Therefore, continuous monitoring of extreme weather and climate events in the Nile River Basin is crucial due to the variability, intensity, and frequency of precipitation extremes during the main rainy season, affecting various socioeconomic activities, primarily in agricultural and water resource sectors. Local climate studies, like the current one, offer valuable fine-scale climate information for impact assessment and adaptation due to their ability to account for diverse climate impacts in different locations [88]. Our analysis of long-term rainfall and extreme events offers valuable insights into local changes in rainfall characteristics that are crucial for developing effective climate risk management strategies at the community level.

5. Conclusions

In this study, the predicted spatiotemporal nature of four precipitation ETCCDI indexes was examined over the 11 main capitals of the Nile River Basin to determine the locations that are most vulnerable to the effects of climate change. The analysis employed the two RCM and three GCM-driven CORDEX-CORE experiments for Africa. Under the two GHG emission scenarios, RCP2.6 and RCP8.5, future changes in four rainfall indices were evaluated by comparing the mid- and late-twentieth century (2041–2060 and 2081–2100, respectively) with the historical era (1971–2000). The main conclusions presented are summarized in Figure 8 and listed as follows:
  • The magnitudes of the changes in precipitation vary across stations, scenarios, and time periods.
  • Stations that exhibited a positive change in precipitation included Addis Ababa, Asmara, Gitega, Juba, Kampala, Kigali, and Nairobi in at least one scenario and period.
  • Stations like Cairo, Dodoma, Kinshasa, and Khartoum showed a decrease in precipitation in at least one scenario and time.
  • Addis Ababa and Kigali anticipated a significant increase in precipitation across all periods and scenarios ranging between 8–15% and 13–27%, respectively, while stations Cairo and Kinshasa exhibited a significant decrease in precipitation at around 90% and 38%, respectively.
  • The results also indicated that the trends in precipitation varied among stations in each of the selected zones. In fact, RX1Day and RX5Day are projected to consistently increase across the studied domain. For instance, we can notice that the increase in RX5Day is likely to multiply the probability of flood risks over Addis Ababa, Asmara, Khartoum, and Kigali.
  • Wet (dry) spells are projected to significantly decrease (increase) over most parts of the NRB, especially during the second period (2081–2100). Therefore, the increase (decrease) in dry (wet) spells could have a direct impact on water resource availability in the NRB.
  • A significant decrease in CWD coupled with an increase in CDD is generally observed over the NRB stations, which is consistent with similar studies [89,90,91].
  • CDD increased significantly over many stations, and those like Cairo and Kinshasa could likely experience high drought risk in the future, mainly caused by the combined effect of the extended periods of dry periods and rainfall shortages while decreasing in Addis Ababa and Juba.
  • In general, RCP8.5 exhibits more notable variations in precipitation than RCP2.6 when comparing the two RCPs. This indicates that increased greenhouse gas emissions have a greater impact on precipitation patterns; furthermore, the expected increases or declines are larger in magnitude for the late 21st century than the mid-21st century, which might be due to the varied GHG concentration rate sensitivities and related feedback processes.
  • The expected increases in the severity and frequency of climatic extremes (droughts and floods) have a significant impact on the region’s food, water security status, and natural environment, so it is crucial to evaluate the socio-economic effects that might arise from increasing precipitation extremes and a projected tendency toward longer (shorter) maximal dry (wet) periods.
The results of this study are consistent with the results obtained by [92] over Niger and by [93] for some major metropolitan cities like Tokyo (9.8 mm/year), New York (4.6 mm/year), London (0.25 mm/year), Sao Paulo (−14.6 mm/year), Cairo (−0.5 mm/year), Kinshasa (−5.2 mm/year), and Bogota (−5.8 mm/year).
The Nile River Basin’s economic activities, such as agriculture and hydropower management, are influenced by rainfall variability. Accurate climate information, understanding climate dynamics, and developing adaptation and mitigation techniques are crucial. The NRB’s policymakers should define adaptation strategies and implement measures like water harvesting, soil erosion mitigation, the capacity building of farmers, improved land use, and natural resource management policies, and share experiences to avoid food insecurity. Building an adaptive capacity for smallholder farmers could boost agricultural productivity and socio-economic development. This study on rainfall variations and extreme precipitation in the Nile River Basin main stations using regional climate models (RCMs) has some limitations, such as model uncertainties, coarse spatial and temporal resolutions, uncertainties in downscaling techniques, future emission scenarios, limited observational data, and non-climatic factors. However, these limitations offer opportunities for future research to improve an understanding of rainfall patterns and extreme precipitation in cities, leading to more reliable projections and better-informed decision making in climate adaptation and planning efforts.
Figure 8. A simple conceptual diagram for the existing conclusions of this study.
Climate 12 00009 g008

Supplementary Materials

The following supporting information can be downloaded at: https://www.mdpi.com/article/10.3390/cli12010009/s1, Table S1. The location of each station and their attributes in the NRB; Figure S1. (a) The Root mean square error (RMSE), and (b) The correlation coefficient for the six models and ENSEM before bias correction; Figure S2. (a) The Root mean square error (RMSE), and (b) The correlation coefficient for the six models and ENSEM after bias correction; Figure S3. The seasonal variation in precipitation for stations (Addis Ababa, Asmara, Cairo, and Dodoma), before BC (left) and after BC (right); Figure S4. as S3 but for stations (Gitega, Juba, Kampala, and Khartoum), before BC (left) and after BC (right); Figure S5. as S3 but for stations (Kigali, Kinshasa, and Nairobi), before BC (left) and after BC (right); Table S2. The relative change in precipitation for the first period (2041–2060) and the second period (2081–2100) under RCP2.6 and RCP8.5 scenarios; Figure S6, Time-series plot of precipitation for (a) Addis Ababa, (b) Asmara, (C) Cairo, (d) Dodoma, (e) Gitega, (f) Juba, and (g) Kampala; Figure S7, Time-series plot of precipitation for (h) Khartoum, (i) Kigali, (j) Kinshasa, and (k) Nairobi; Table S3. The relative change in RX1Day and RX5Day for each station under RCP2.6 and RCP8.5 scenarios for mid-future (2041–2060) and far-future (2081–2100); Table S4. The relative change in CWD and CDD for each station under RCP2.6 and RCP8.5 scenarios for mid-future (2041–2060) and far-future (2081–2100).

Author Contributions

Conceptualization, G.G.; Formal analysis, G.G.; Investigation, A.M.E.K.; Methodology, G.G.; Supervision, P.N.; Visualization, G.G.; Writing—original draft, G.G.; Writing—review and editing, P.N. and A.M.E.K. All authors have read and agreed to the published version of the manuscript.

Funding

This research was funded by the Postdoctoral Joint Program between the Academy of Scientific Research and Technology (ASRT)/The Bibliotheca of Alexandria (BA), grant number 1270. “The APC was funded by Earth Science Institute v.v.i. of Slovak Academy of Science”.

Data Availability Statement

The two CORDEX-CORE datasets driven by three global climate models from CMIP5 were obtained using The Earth System Grid Federation (ESGF) nodes, such as http://esgf-node.dkrz.de/, (accessed on 1 July 2023).

Acknowledgments

The first author would like to acknowledge the generous support provided by the Slovak Academic Information Agency (SAIA) and the Slovak Academy of Sciences.

Conflicts of Interest

The authors declare no conflicts of interest.

References

  1. Allan, R.P.; Hawkins, E.; Bellouin, N.; Collins, B. IPCC, 2021: Summary for Policymakers. In Climate Change 2021; Cambridge University Press: Cambridge, UK, 2021. [Google Scholar]
  2. Sajjad, H.; Ghaffar, A. Observed, simulated and projected extreme climate indices over Pakistan in changing climate. Theor. Appl. Climatol. 2019, 137, 255–281. [Google Scholar] [CrossRef]
  3. Salah, M.; Moursy, F.; Soliman, E.; Gamal, G. Assessing the potential impacts of climate change on droughts in East Africa using CORDEX-CORE regional climate models’ simulations: A focus on Tanzania. Contrib. Geophys. Geod. 2023, 53, 271–300. [Google Scholar]
  4. Easterling, D.R.; Arnold, J.R.; Knutson, T.; Kunkel, K.E.; LeGrande, A.N.; Leung, L.R.; Vose, R.S.; Waliser, D.E.; Wehner, M.F. Precipitation change in the United States. In Climate Science Special Report: Fourth National Climate Assessment, Volume I; U.S. Global Change Research Program: Washington, DC, USA, 2017. [Google Scholar]
  5. Maidment, R.I.; Allan, R.P.; Black, E. Recent observed and simulated changes in precipitation over Africa. Geophys. Res. Lett. 2015, 42, 8155–8164. [Google Scholar] [CrossRef]
  6. Safdar, F.; Khokhar, M.F.; Mahmood, F.; Khan, M.Z.A.; Arshad, M. Observed and predicted precipitation variability across Pakistan with special focus on winter and pre-monsoon precipitation. Environ. Sci. Pollut. Res. 2023, 30, 4510–4530. [Google Scholar] [CrossRef] [PubMed]
  7. Caporali, E.; Lompi, M.; Pacetti, T.; Chiarello, V.; Fatichi, S. A review of studies on observed precipitation trends in Italy. Int. J. Climatol. 2021, 41, E1–E25. [Google Scholar] [CrossRef]
  8. Ozer, P.; Mahamoud, A. Recent extreme precipitation and temperature changes in Djibouti City (1966–2011). J. Climatol. 2013, 2013, 928501. [Google Scholar] [CrossRef]
  9. Keuser, A.P. Precipitation patterns and trends in the metropolitan area of Milwaukee, Wisconsin. Int. J. Geospat. Environ. Res. 2014, 1, 6. [Google Scholar]
  10. Khoi, D.N.; Trang, H.T. Analysis of changes in precipitation and extremes events in Ho Chi Minh City, Vietnam. Procedia Eng. 2016, 142, 229–235. [Google Scholar] [CrossRef]
  11. Toros, H.; Abbasnia, M.; Sagdic, M.; Tayanç, M. Long-term variations of temperature and precipitation in the megacity of Istanbul for the development of adaptation strategies to climate change. Adv. Meteorol. 2017, 2017, 6519856. [Google Scholar] [CrossRef]
  12. Pan, Z.; Zhang, Y.; Liu, X.; Gao, Z. Current and future precipitation extremes over Mississippi and Yangtze River basins as simulated in CMIP5 models. J. Earth Sci. 2016, 27, 22–36. [Google Scholar] [CrossRef]
  13. Oliveira, G.S.; Nobre, C.; Costa, M.H.; Satyamurty, P.; Soares Filho, B.S.; Cardoso, M. Regional climate change over eastern Amazônia caused by pasture and soybean cropland expansion. Geophys. Res. Lett. 2007, 34, LI7709. [Google Scholar] [CrossRef]
  14. Satyamurty, P.; de Castro, A.A.; Tota, J.; da Silva Gularte, L.E.; Manzi, A.O. Rainfall trends in the Brazilian Amazon Basin in the past eight decades. Theor. Appl. Climatol. 2010, 99, 139–148. [Google Scholar] [CrossRef]
  15. Niang, I.; Ruppel, O.C.; Abdrabo, M.A.; Essel, A.; Lennard, C.; Padgham, J.; Urquhart, P. Africa. In Climate Change 2014: Impacts, Adaptation, and Vulnerability. Part B: Regional Aspects: Contribution of Working Group II to the Fifth Assessment Report of the Intergovernmental Panel on Climate Change; Barros, V.R., Field, C.B., Dokken, D.J., Mastrandrea, M.D., Mach, K.J., Bilir, T.E., Chatterjee, M., Ebi, K.L., Estrada, Y.O., Genova, R.C., et al., Eds.; Cambridge University Press: Cambridge, UK, 2014; pp. 1199–1265. [Google Scholar]
  16. Burls, N.J.; Blamey, R.C.; Cash, B.A.; Swenson, E.T.; al Abdullah, F.; Bopape, M.-J.M.; Straus, D.M.; Reason, C.J.C. The Cape Town “day zero” drought and Hadley cell expansion. Clim. Atmos. Sci. 2019, 2, 27. [Google Scholar] [CrossRef]
  17. Dosio, A.; Jury, M.W.; Almazroui, M.; Ashfaq, M.; Diallo, I.; Engelbrecht, F.A.; Klutse, N.A.B.; Lennard, C.; Pinto, I.; Sylla, M.B.; et al. Projected future daily characteristics of African precipitation based on global (CMIP5, CMIP6) and regional (CORDEX, CORDEX-CORE) climate models. Clim. Dyn. 2021, 57, 3135–3158. [Google Scholar] [CrossRef]
  18. Elshamy, M.E.; Seierstad, I.A.; Sorteberg, A. Impacts of climate change on Blue Nile flows using bias-corrected GCM scenarios. Hydrol. Earth Syst. Sci. 2009, 13, 551–565. [Google Scholar] [CrossRef]
  19. Giorgi, F.; Gutowski, W.J. Regional dynamical downscaling and the cordex initiative. Annu. Rev. Environ. Resour. 2015, 40, 467–490. [Google Scholar] [CrossRef]
  20. Bichet, A.; Diedhiou, A.; Hingray, B.; Evin, G.; Touré, N.E.; Browne, K.N.A.; Kouadio, K. Assessing uncertainties in the regional projections of precipitation in CORDEX-AFRICA. Clim. Chang. 2020, 162, 583–601. [Google Scholar] [CrossRef]
  21. Tamoffo, A.T.; Nikulin, G.; Vondou, D.A.; Dosio, A.; Nouayou, R.; Wu, M.; Igri, P.M. Process-based assessment of the impact of reduced turbulent mixing on Congo Basin precipitation in the RCA4 Regional Climate Model. Clim. Dyn. 2021, 56, 1951–1965. [Google Scholar] [CrossRef]
  22. Mengistu, D.; Bewket, W.; Dosio, A.; Panitz, H.-J. Climate change impacts on water resources in the upper blue nile (Abay) river basin, ethiopia. J. Hydrol. 2021, 592, 125614. [Google Scholar] [CrossRef]
  23. Woldesenbet, T.A.; Elagib, N.A.; Ribbe, L.; Heinrich, J. Catchment response to climate and land use changes in the Upper Blue Nile sub-basins, Ethiopia. Sci. Total Environ. 2018, 644, 193–206. [Google Scholar] [CrossRef]
  24. Mohammed, J.A.; Gashaw, T.; Tefera, G.W.; Dile, Y.T.; Worqlul, A.W.; Addisu, S. Changes in observed rainfall and temperature extremes in the Upper Blue Nile Basin of Ethiopia. Weather Clim. Extrem. 2022, 37, 100468. [Google Scholar] [CrossRef]
  25. Nashwan, M.S.; Shahid, S. Spatial distribution of unidirectional trends in climate and weather extremes in Nile River basin. Theor. Appl. Climatol. 2019, 137, 1181–1199. [Google Scholar] [CrossRef]
  26. Worku, G.; Teferi, E.; Bantider, A.; Dile, Y.T. Observed changes in extremes of daily rainfall and temperature in Jemma Sub-Basin, Upper Blue Nile Basin, Ethiopia. Theor. Appl. Climatol. 2019, 135, 839–854. [Google Scholar] [CrossRef]
  27. Tariku, T.B.; Gan, T.Y. Regional climate change impact on extreme precipitation and temperature of the Nile river basin. Clim. Dyn. 2018, 51, 3487–3506. [Google Scholar] [CrossRef]
  28. Mariotti, L.; Diallo, I.; Coppola, E.; Giorgi, F. Seasonal and intraseasonal changes of African monsoon climates in 21st century CORDEX projections. Clim. Chang. 2014, 125, 53–65. [Google Scholar] [CrossRef]
  29. Pachauri, R.K.; Allen, M.R.; Barros, V.R.; Broome, J.; Cramer, W.; Christ, R.; van Ypserle, J.P. Climate Change 2014: Synthesis Report. Contribution of Working Groups I, II and III to the Fifth Assessment Report of the Intergovernmental Panel on Climate Change; IPCC: Geneva, Switzerland, 2014; p. 151. [Google Scholar]
  30. Swain, A. Challenges for water sharing in the Nile basin: Changing geo-politics and changing climate. Hydrol. Sci. J. 2011, 56, 687–702. [Google Scholar] [CrossRef]
  31. Marelle, L.; Myhre, G.; Steensen, B.M.; Hodnebrog, Ø.; Alterskjær, K.; Sillmann, J. Urbanization in megacities increases the frequency of extreme precipitation events far more than their intensity. Environ. Res. Lett. 2020, 15, 124072. [Google Scholar] [CrossRef]
  32. Onyutha, C.; Willems, P. Spatial and temporal variability of rainfall in the Nile Basin. Hydrol. Earth Syst. Sci. 2015, 19, 2227–2246. [Google Scholar] [CrossRef]
  33. Onyutha, C.; Tabari, H.; Taye, M.T.; Nyandwaro, G.N.; Willems, P. Analyses of rainfall trends in the Nile River Basin. J. Hydro-Environ. Res. 2016, 13, 36–51. [Google Scholar] [CrossRef]
  34. Camberlin, P. Rainfall anomalies in the source region of the Nile and their connection with the Indian summer monsoon. J. Clim. 1997, 10, 1380–1392. [Google Scholar] [CrossRef]
  35. Tesemma, Z.K.; Mohamed, Y.A.; Steenhuis, T.S. Trends in rainfall and runoff in the Blue Nile Basin: 1964–2003. Hydrol. Process. 2010, 24, 3747–3758. [Google Scholar] [CrossRef]
  36. Tabari, H.; Taye, M.T.; Willems, P. Statistical assessment of precipitation trends in the upper Blue Nile River basin. Stoch. Environ. Res. Risk Assess. 2015, 29, 1751–1761. [Google Scholar] [CrossRef]
  37. Kim, U.; Kaluarachchi, J.J.; Smakhtin, V.U. Generation of monthly precipitation under climate change for the upper blue nile river basin, Ethiopia 1. JAWRA J. Am. Water Resour. Assoc. 2008, 44, 1231–1247. [Google Scholar] [CrossRef]
  38. Taye, M.T.; Willems, P. Temporal variability of hydroclimatic extremes in the Blue Nile basin. Water Resour. Res. 2012, 48, 1–13. [Google Scholar] [CrossRef]
  39. Awulachew, S.B. (Ed.) The Nile River Basin: Water, Agriculture, Governance and Livelihoods; Routledge: Abingdon, UK, 2012. [Google Scholar]
  40. Nile Basin Water Resource Atlas, 2022: Estimated and Projected Total Population in Nile Basin Countries. Available online: https://atlas.nilebasin.org/treatise/estimated-and-projected-total-population-in-nile-basin-countries/ (accessed on 22 July 2022).
  41. United Nations Environmental Programme (UNEP). 2006: Environment, Sustainable Development and the Nile River Basin. Education for Sustainable Development Innovations. MESA University Partnership. Available online: https://docplayer.net/2630438-Education-for-sustainable-development-innovations-mesa-universities-partnership-environment-sustainable-development-and-the-nile-river-basin.html (accessed on 14 November 2014).
  42. Abtew, W.; Melesse, A.M. The Nile River Basin. In Nile River Basin: Ecohydrological Challenges, Climate Change and Hydropolitics; Springer International Publishing: Cham, Switzerland, 2014; pp. 7–21. [Google Scholar]
  43. Funk, C.; Peterson, P.; Landsfeld, M.; Pedreros, D.; Verdin, J.; Shukla, S.; Husak, G.; Rowland, J.; Harrison, L.; Hoell, A.; et al. The climate hazards infrared precipitation with stations—A new environmental record for monitoring extremes. Sci. Data 2015, 2, 1–21. [Google Scholar] [CrossRef] [PubMed]
  44. Giorgi, F.; Jones, C.; Asrar, G.R. Addressing climate information needs at the regional level: The CORDEX framework. World Meteorol. Organ. Bull. 2009, 58, 175. [Google Scholar]
  45. Stéfanon, M.; Martin-StPaul, N.K.; Leadley, P.; Bastin, S.; Dell’Aquila, A.; Drobinski, P.; Gallardo, C. Testing climate models using an impact model: What are the advantages? Clim. Chang. 2015, 131, 649–661. [Google Scholar] [CrossRef]
  46. Flato, G.; Marotzke, J.; Abiodun, B.; Braconnot, P.; Chou, S.C.; Collins, W.; Cox, P.; Driouech, F.; Emori, S.; Eyring, V.; et al. 2013: Evaluation of Climate Models. In Climate Change 2013: The Physical Science Basis; Contribution of Working Group I to the Fifth Assessment Report of the Intergovernmental Panel on Climate Change; Stocker, T.F., Qin, D., Plattner, G.-K., Tignor, M., Allen, S.K., Boschung, J., Nauels, A., Xia, Y., Bex, V., Midgley, P.M., Eds.; Cambridge University Press: Cambridge, UK; New York, NY, USA, 2013. [Google Scholar]
  47. Moss, R.H.; Edmonds, J.A.; Hibbard, K.A.; Manning, M.R.; Rose, S.K.; Van Vuuren, D.P.; Carter, T.R.; Emori, S.; Kainuma, M.; Kram, T. The next generation of scenarios for climate change research and assessment. Nature 2010, 463, 747–756. [Google Scholar] [CrossRef]
  48. Field, C.B.; Barros, V.R. (Eds.) Climate Change 2014–Impacts, Adaptation and Vulnerability: Regional Aspects; Cambridge University Press: Cambridge, UK, 2014. [Google Scholar]
  49. Valle, D.; Staudhammer, C.L.; Cropper Jr, W.P.; Gardingen, P.R. The importance of multimodel projections to assess uncertainty in projections from simulation models. Ecol. Appl. 2009, 19, 1680–1692. [Google Scholar] [CrossRef]
  50. Hawkins, E.; Sutton, R. The potential to narrow uncertainty in projections of regional precipitation change. Clim. Dyn. 2011, 37, 407–418. [Google Scholar] [CrossRef]
  51. Rockel, B.; Will, A.; Hense, A. The regional climate model COSMO-CLM (CCLM). Meteorol. Zeitschr. 2008, 17, 347–348. [Google Scholar] [CrossRef]
  52. Stevens, B.; Giorgetta, M.; Esch, M.; Mauritsen, T.; Crueger, T.; Rast, S.; Salzmann, M.; Schmidt, H.; Bader, J.; Roeckner, E.; et al. Atmospheric component of the MPI-M earth system model: ECHAM6. J. Adv. Model. Earth Syst. 2013, 5, 146–172. [Google Scholar] [CrossRef]
  53. Bentsen, M.; Bethke, I.; Debernard, J.B.; Iversen, T.; Kirkevåg, A.; Seland, Ø.; Drange, H.; Roelandt, C.; Seierstad, I.A.; Hoose, C.; et al. The Norwegian Earth System Model, NorESM1-M—Part 1: Description and basic evaluation of the physical climate. Geosci. Model Dev. 2013, 6, 687–720. [Google Scholar] [CrossRef]
  54. Teichmann, C.; Eggert, B.; Elizalde, A.; Haensler, A.; Jacob, D.; Kumar, P.; Moseley, C.; Pfeifer, S.; Rechid, D.; Remedio, A.; et al. How Does a Regional Climate Model Modify the Projected Climate Change Signal of the Driving GCM: A Study over Different CORDEX Regions Using REMO. Atmosphere 2013, 4, 214–236. [Google Scholar] [CrossRef]
  55. Collins, W.J.; Bellouin, N.; Doutriaux-Boucher, M.; Gedney, N.; Halloran, P.; Hinton, T.; Jones, H.C.D.; Joshi, J.M.; Liddicoat, S.; Woodward, S.; et al. Development and evaluation of an earth-system model—HadGEM2. Geosci. Model. Dev. 2011, 4, 1051–1075. [Google Scholar] [CrossRef]
  56. Martin, G.M.; Collins, W.J.; Culverwell, I.D.; Halloran, P.R.; Hardiman, S.C.; Hinton, T.J.; Jones, C.D.; McDonald, R.E.; McLaren, A.J.; Wiltshire, A.; et al. The HadGEM2 family of MET office unified model climate configurations. Geosci. Model. Dev. 2011, 4, 723–757. [Google Scholar]
  57. Seneviratne, S.; Nicholls, N.; Easterling, D.; Goodess, C.; Kanae, S.; Kossin, J.; Luo, Y.; Marengo, J.; McInnes, K.; Zwiers, F.W. Changes in Climate Extremes and Their Impacts on the Natural Physical Environment; Columbia, University: New York, NY, USA, 2012. [Google Scholar]
  58. Perkins-Kirkpatrick, S.E.; Lewis, S.C. Increasing trends in regional heatwaves. Nat. Commun. 2020, 11, 3357. [Google Scholar] [CrossRef]
  59. De Vries, H.; Haarsma, R.J.; Hazeleger, W. Western European cold spells in current and future climate. Geophys. Res. Lett. 2012, 39. [Google Scholar] [CrossRef]
  60. Breugem, A.J.; Wesseling, J.G.; Oostindie, K.; Ritsema, C.J. Meteorological aspects of heavy precipitation in relation to floods–an overview. Earth-Sci. Rev. 2020, 204, 103171. [Google Scholar] [CrossRef]
  61. Haile, G.G.; Tang, Q.; Sun, S.; Huang, Z.; Zhang, X.; Liu, X. Droughts in East Africa: Causes, impacts and resilience. Earth-Sci. Rev. 2019, 193, 146–161. [Google Scholar] [CrossRef]
  62. Saeed, F.; Almazroui, M.; Islam, N.; Khan, M.S. Intensification of future heat waves in Pakistan: A study using CORDEX regional climate models ensemble. Nat. Hazards 2017, 87, 1635–1647. [Google Scholar] [CrossRef]
  63. Ozturk, T. Projected Future Changes in Extreme Climate Indices over Central Asia Using RegCM4. 3.5. Atmosphere 2023, 14, 939. [Google Scholar] [CrossRef]
  64. Han, F.; Cook, K.H.; Vizy, E.K. Changes in intense rainfall events and dry periods across Africa in the twenty-first century. Clim. Dyn. 2019, 53, 2757–2777. [Google Scholar] [CrossRef]
  65. Sillmann, J.; Kharin, V.V.; Zhang, X.; Zwiers, F.W.; Bronaugh, D. Climate extremes indices in the CMIP5 multimodel ensemble: Part 1. Model evaluation in the present climate. J. Geophys. Res. Atmos. 2013, 118, 1716–1733. [Google Scholar] [CrossRef]
  66. Mann, H.B. Non-parametric tests against trend. Econometrica 1945, 13, 245–259. [Google Scholar] [CrossRef]
  67. Kendall, M.G. Rank Correlation Methods, 4th ed.; Griffin: London, UK, 1975. [Google Scholar]
  68. Ahmad, I.; Tang, D.; Wang, T.; Wang, M.; Wagan, B. Precipitation trends over time using Mann-Kendall and spearman’s rho tests in swat river basin, Pakistan. Adv. Meteorol. 2015, 2015, 431860. [Google Scholar] [CrossRef]
  69. Ongoma, V.; Chen, H. Temporal and Spatial Variability of Temperature and Precipitation over East Africa from 1951 to 2010. Meteorol. Atmos. Phys. 2016, 129, 131–144. [Google Scholar] [CrossRef]
  70. Cannon, A.J.; Sobie, S.R.; Murdock, T.Q. Bias correction of GCM precipitation by quantile mapping: How well do methods preserve changes in quantiles and extremes? J. Clim. 2015, 28, 6938–6959. [Google Scholar] [CrossRef]
  71. Piani, C.; Haerter, J.O.; Coppola, E. Statistical bias correction for daily precipitation in regional climate models over Europe. Theor. Appl. Climatol. 2010, 99, 187–192. [Google Scholar] [CrossRef]
  72. Hagemann, S.; Chen, C.; Haerter, J.O.; Heinke, J.; Gerten, D.; Piani, C. Impact of a statistical bias correction on the projected hydrological changes obtained from three GCMs and two hydrology models. J. Hydrometeorol. 2011, 12, 556–578. [Google Scholar] [CrossRef]
  73. Watanabe, T. How Do Irrigation and Drainage Play an Important Role in Climate Change Adaptation? Irrig. Drain. 2016, 65, 189–196. [Google Scholar] [CrossRef]
  74. Teshome, A.; Zhang, J. Increase of extreme drought over Ethiopia under climate warming. Adv. Meteorol. 2019, 2019, 5235429. [Google Scholar] [CrossRef]
  75. Mekasha, A.; Duncan, A.J. Trends in daily observed temperature and precipitation extremes over three Ethiopian eco-environments. Int. J. Clim. 2013, 34, 1990–1999. [Google Scholar] [CrossRef]
  76. Sonkoué, D.; Monkam, D.; Fotso-Nguemo, T.C.; Yepdo, Z.D.; Vondou, D.A. Evaluation and projected changes in daily rainfall characteristics over Central Africa based on a multi-model ensemble mean of CMIP5 simulations. Theor. Appl. Climatol. 2019, 137, 2167–2186. [Google Scholar] [CrossRef]
  77. Tamoffo, A.T.; Weber, T.; Akinsanola, A.A.; Vondou, D.A. Projected changes in extreme rainfall and temperature events and possible implications for Cameroon’s socio-economic sectors. Meteorol. Appl. 2023, 30, e2119. [Google Scholar] [CrossRef]
  78. Samuel, S.; Dosio, A.; Mphale, K.; Faka, D.N.; Wiston, M. Comparison of multimodel ensembles of global and regional climate models projections for extreme precipitation over four major river basins in southern Africa—Assessment of the historical simulations. Clim. Chang. 2023, 176, 57. [Google Scholar] [CrossRef]
  79. Babaousmail, H.; Hou, R.; Ayugi, B.; Sian, K.T.C.L.K.; Ojara, M.; Mumo, R.; Ongoma, V. Future changes in mean and extreme precipitation over the Mediterranean and Sahara regions using bias-corrected CMIP6 models. Int. J. Climatol. 2022, 42, 7280–7297. [Google Scholar] [CrossRef]
  80. Moradian, S.; Torabi Haghighi, A.; Asadi, M.; Mirbagheri, S.A. Future changes in precipitation over northern europe based on a multi-model ensemble from CMIP6: Focus on Tana River Basin. Water Resour. Manag. 2023, 37, 2447–2463. [Google Scholar] [CrossRef]
  81. Sun, Y.; Ding, Y. A projection of future changes in summer precipitation and monsoon in East Asia. Sci. China Earth Sci. 2010, 53, 284–300. [Google Scholar] [CrossRef]
  82. Zittis, G.; Bruggeman, A.; Lelieveld, J. Revisiting future extreme precipitation trends in the Mediterranean. Weather Clim. Extrem. 2021, 34, 100380. [Google Scholar] [CrossRef]
  83. Lyon, B.; DeWitt, D.G. A recent and abrupt decline in the East African long rains. Geophys. Res. Lett. 2012, 39, 5. [Google Scholar] [CrossRef]
  84. Muluneh, A.; Bewket, W.; Keesstra, S.; Stroosnijder, L. Searching for evidence of changes in extreme rainfall indices in the Central Rift Valley of Ethiopia. Theor. Appl. Climatol. 2017, 128, 795–809. [Google Scholar] [CrossRef]
  85. Conway, D. The climate and hydrology of the Upper Blue Nile River. Geogr. J. 2000, 166, 49–62. [Google Scholar] [CrossRef]
  86. Viste, E.; Sorteberg, A. Moisture transport into the Ethiopian highlands. Int. J. Climatol. 2013, 33, 249–263. [Google Scholar] [CrossRef]
  87. Berhane, A.; Hadgu, G.; Worku, W.; Abrha, B. Trends in extreme temperature and rainfall indices in the semi-arid areas of Western Tigray, Ethiopia. Environ. Syst. Res. 2020, 9, 1–20. [Google Scholar]
  88. Medany, M.; Niang-Diop, I.; Nyong, T.; Tabo, R.; Vogel, C. Background paper on impacts, vulnerability and adaptation to climate change in Africa. In Proceedings of the UNFCCC Convention, Accra, Ghana, 21–23 September 2006; pp. 21–23. [Google Scholar]
  89. Osima, S.; Indasi, V.S.; Zaroug, M.; Endris, H.S.; Gudoshava, M.; Misiani, H.O.; Nimusiima, A.; Anayah, R.O.; Otieno, G.; Dosio, A.; et al. Projected climate over the Greater Horn of Africa under 1.5 C and 2 C global warming. Environ. Res. Lett. 2018, 13, 065004. [Google Scholar] [CrossRef]
  90. Wainwright, C.M.; Marsham, J.H.; Keane, R.J.; Rowell, D.P.; Finney, D.L.; Black, E.; Allan, R.P. ‘Eastern African Paradox’rainfall decline due to shorter not less intense Long Rains. Clim. Atmos. Sci. 2019, 2, 34. [Google Scholar] [CrossRef]
  91. Gudoshava, M.; Misiani, H.O.; Segele, Z.T.; Jain, S.; Ouma, J.O.; Otieno, G.; Anyah, R.; Indasi, V.S.; Endris, H.S.; Osima, S. Projected effects of 1.5 C and 2 C global warming levels on the intra-seasonal rainfall characteristics over the Greater Horn of Africa. Environ. Res. Lett. 2020, 15, 034037. [Google Scholar] [CrossRef]
  92. Bigi, V.; Pezzoli, A.; Rosso, M. Past and future precipitation trend analysis for the City of Niamey (Niger): An overview. Climate 2018, 6, 73. [Google Scholar] [CrossRef]
  93. Aldrees, A.; Hasan, M.S.U.; Rai, A.K.; Akhtar, M.N.; Khan, M.A.; Saif, M.M.; Ahmad, N.; Islam, S. On the Precipitation Trends in Global Major Metropolitan Cities under Extreme Climatic Conditions: An Analysis of Shifting Patterns. Water 2023, 15, 383. [Google Scholar] [CrossRef]
Figure 1. The Nile River Basin and the 11 main cities in the region.
Climate 12 00009 g001
Figure 2. The change in precipitation during 2041–2060 and 2081–2100 under RCP2.6 and RCP8.5 for all stations.
Climate 12 00009 g002
Figure 3. The relative change in the RX1Day index for all stations under RCP2.6 and RCP8.5 for 2041–2060 (left) and 2081–2100 (right).
Climate 12 00009 g003
Figure 4. The relative change in the RX5Day index for all stations under RCP2.6 and RCP8.5 2041–2060 (left) and 2081–2100 (right).
Climate 12 00009 g004
Figure 5. The relative change in the CWD index for all stations under RCP2.6 and RCP8.5 for 2041–2060 (left) and 2081–2100 (right).
Climate 12 00009 g005
Figure 6. The relative change in the CDD index for all stations under RCP2.6 and RCP8.5. for 2041–2060 (left) and 2081–2100 (right).
Climate 12 00009 g006
Figure 7. The spatial distribution of the MK trends of the extreme rainfall indices over the RNB for the historical period (1971–2000) and the future periods (2041–2060) and (2081–2100), of (a) RX1Day, (b) Rx5Day, (c) CWD, and (d) CDD. The large green and red triangles indicate significant increasing and decreasing trends, respectively. Insignificant increasing (decreasing) trends are marked by small triangles. Indices with no trends are marked by small white circles.
Climate 12 00009 g007
Table 1. CORDEX—CORE RCM and their driven GCM models.
RCMInstitute and ReferenceGCMGCM ResolutionReference
CLMcomClimate Limited-Area Modelling Community-KIT, Germany
[51]
MPI-M-MPI-ESM-LR1.9° × 1.9°[52]
NCC-NorESM1-M1.9° × 2.5°[53]
REMO2015Helmholtz-Zentrum Geesthacht, Climate Service Center Germany
[54]
MOHC-HadGEM2-ES1.3° × 1.9°[55,56]
Table 2. List of indicators considered for this study devised using the ETCCDI.
IDIndexDefinitionUnit
RX1DayMax 1-day precipitation amountAnnual maximum 1-day precipitationmm
RX5DayMax 5-day precipitation amountAnnual maximum consecutive 5-day precipitationmm
CWDConsecutive wet daysMaximum number of consecutive days when precipitation > 1 mmdays
CDDConsecutive dry daysMaximum number of consecutive days when precipitation < 1 mmdays
Disclaimer/Publisher’s Note: The statements, opinions and data contained in all publications are solely those of the individual author(s) and contributor(s) and not of MDPI and/or the editor(s). MDPI and/or the editor(s) disclaim responsibility for any injury to people or property resulting from any ideas, methods, instructions or products referred to in the content.

