
Analysis of Climate Variability and Its Implications on Rangelands in the Limpopo Province


Abstract
1. Introduction
2. Materials and Methods
2.1. Site Description
2.2. Climate and Agricultural Activities
3. Data and Methods
3.1. Data and Quality Control
3.2. Data Analysis
3.2.1. Coefficient of Variation (CV)
3.2.2. Trend Detection
4. Results
4.1. Inter-Annual Variability of Climatic Variables
4.2. Inter-Annual Variability of Seasonal Rainfall
4.3. Inter-Annual Variability of Minimum Temperatures
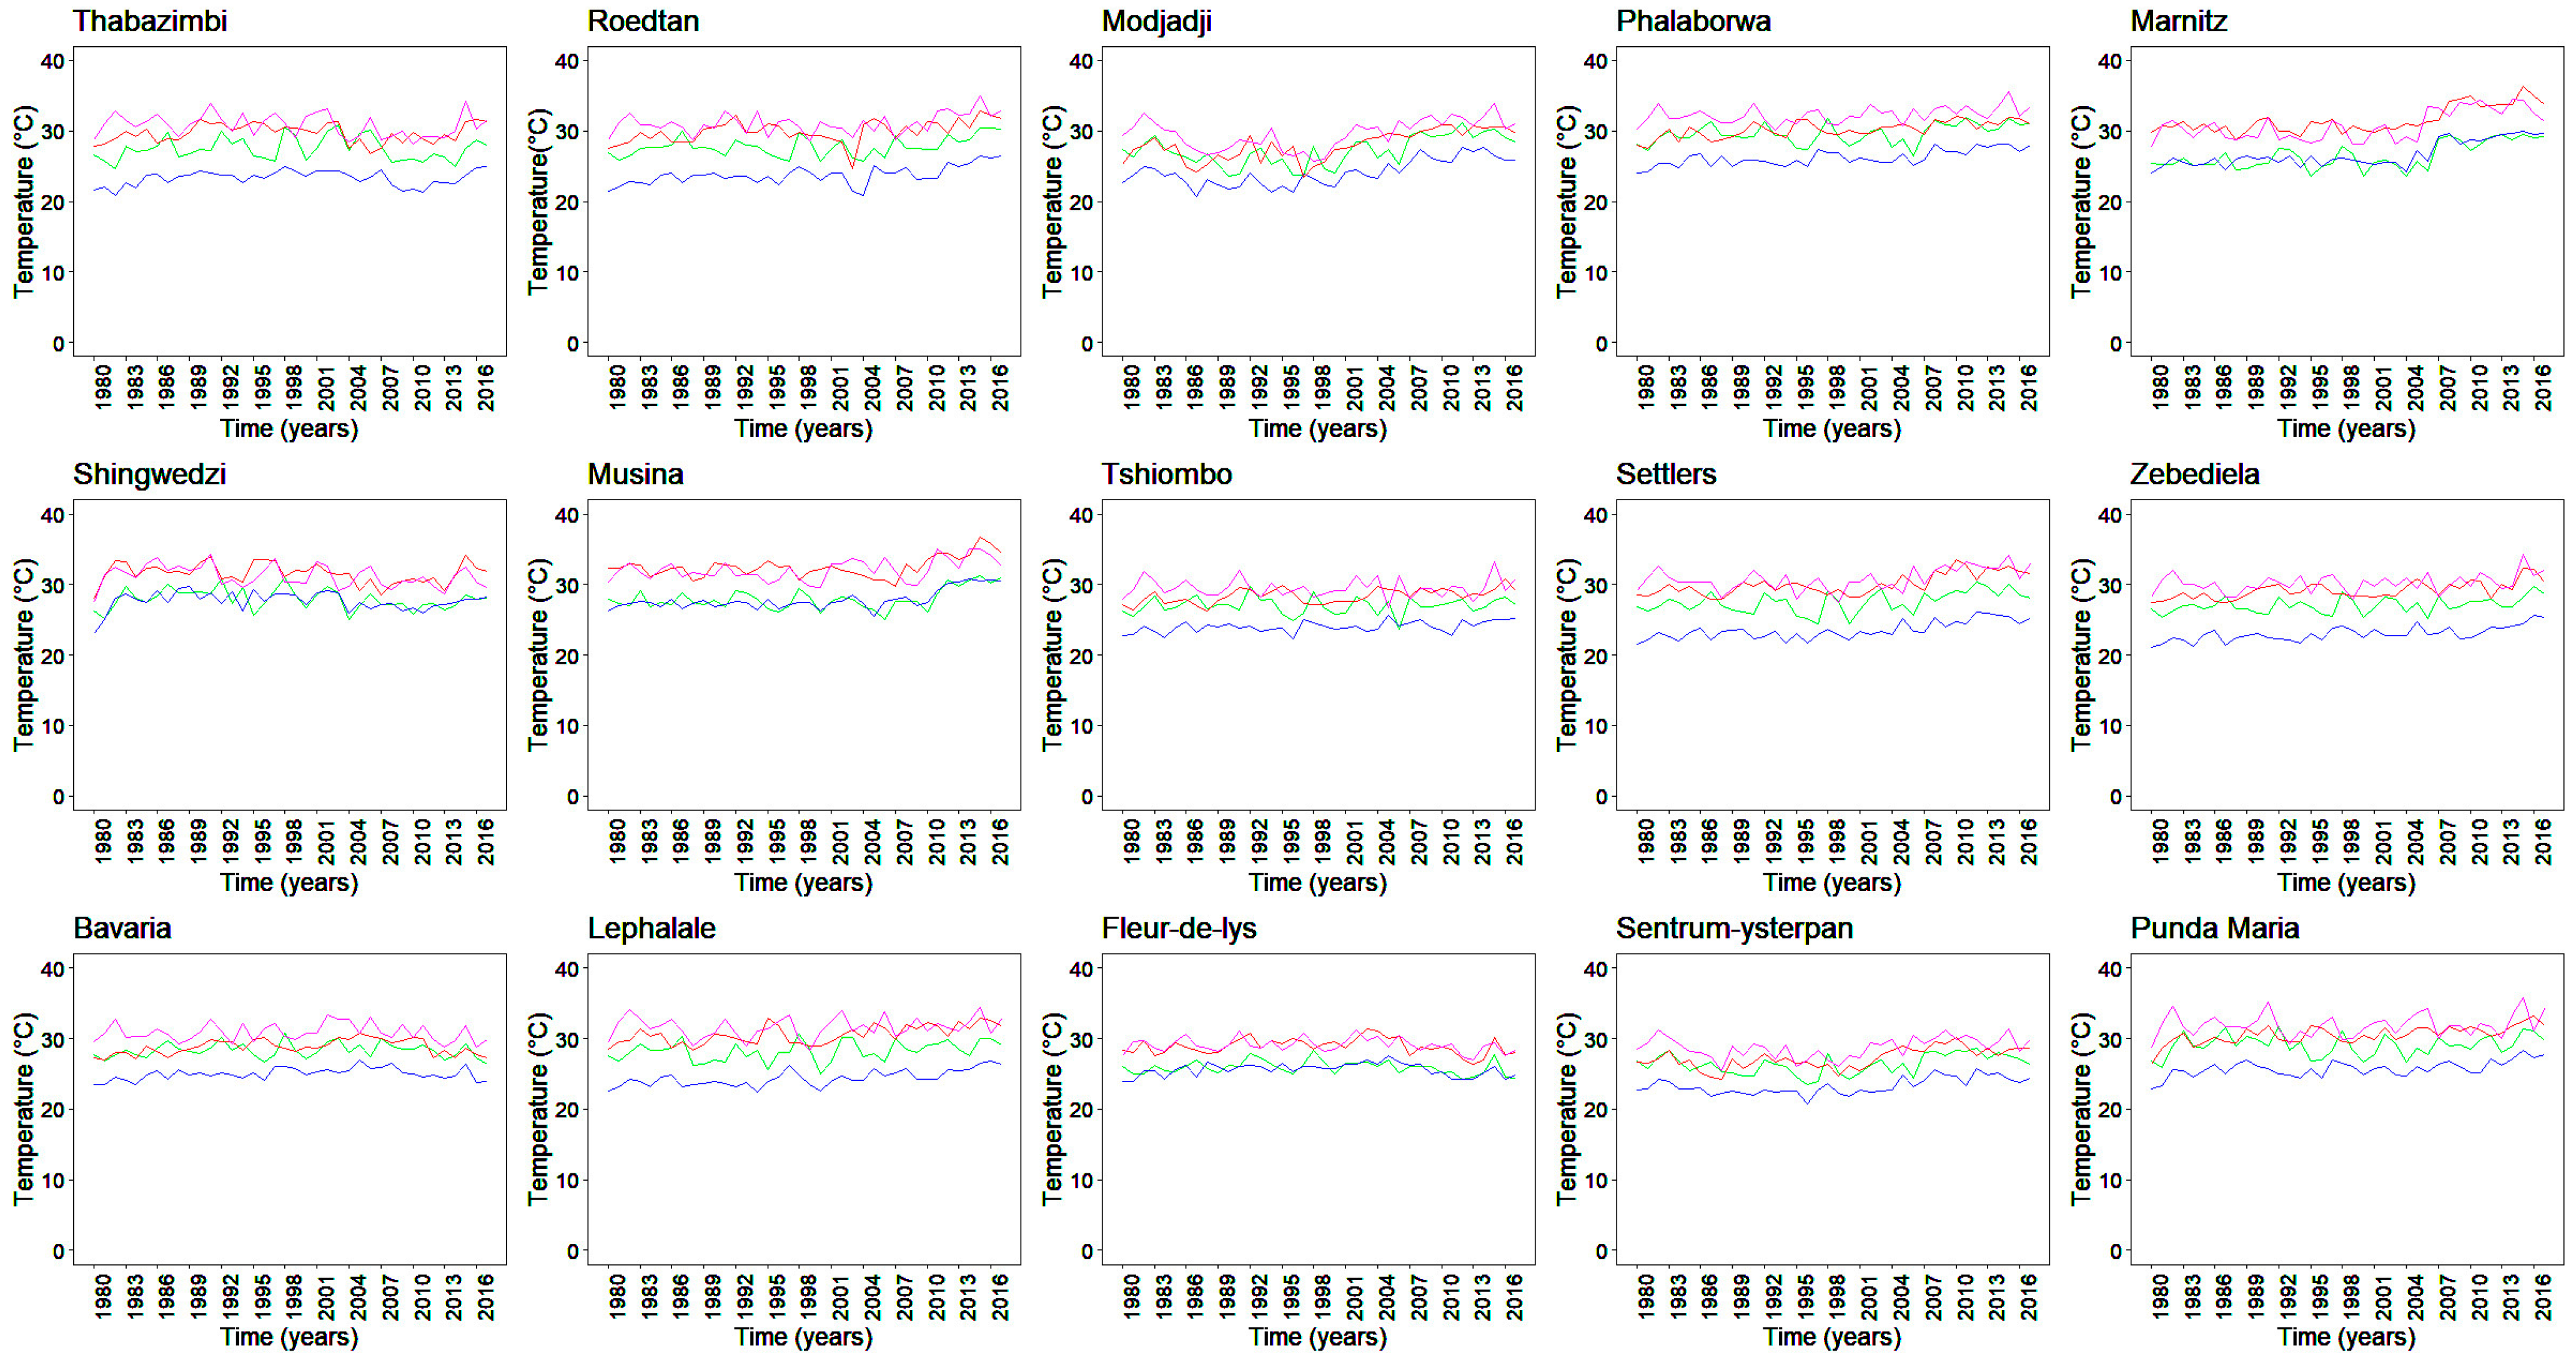
4.4. Inter-Annual Variability of Maximum Temperatures
4.5. Trend Analysis for Total Seasonal Rainfall
4.6. Trend Analysis for Mean Minimum Temperature
4.7. Trend Analysis for Mean Maximum Temperature
5. Discussion
6. Implications for Rangelands
6.1. Varying Rainfall
6.2. Varying Minimum Temperatures
6.3. Increasing Maximum Temperatures
7. Conclusions
Author Contributions
Funding
Data Availability Statement
Acknowledgments
Conflicts of Interest
Appendix A

| Station Name | Rainfall | Minimum Temperature | Maximum Temperature | |||||||||
|---|---|---|---|---|---|---|---|---|---|---|---|---|
| Mean (mm) | SD (mm) | CV (%) | CV Category | Mean (°C) | SD (°C) | CV (%) | CV Category | Mean (°C) | SD (°C) | CV (%) | CV Category | |
| Thabazimbi | 630.3 | 170.1 | 27.0 | Moderate | 11.5 | 0.7 | 6.1 | Low | 27.7 | 1.3 | 4.8 | Low |
| Roedtan | 530.6 | 156.2 | 29.4 | Moderate | 11.6 | 0.6 | 5.6 | Low | 28.2 | 1.2 | 4.2 | Low |
| Fleur-de-lys | 722.2 | 210.8 | 29.2 | Moderate | 14.4 | 0.7 | 4.8 | Low | 27.6 | 0.8 | 2.9 | Low |
| Sentrum-ysterpan | 561.7 | 145.5 | 25.9 | Moderate | 12.1 | 0.9 | 7.4 | Low | 26.4 | 1.2 | 4.5 | Low |
| Modjadji | 718.4 | 256.2 | 35.7 | High | 14.2 | 1.0 | 7.3 | Low | 27.2 | 1.8 | 6.6 | Low |
| Phalaborwa | 461.5 | 177.0 | 38.4 | High | 15.8 | 0.5 | 3.1 | Low | 29.6 | 1.0 | 3.3 | Low |
| Marnitz | 445.4 | 143.9 | 32.3 | High | 13.9 | 0.9 | 6.4 | Low | 29.2 | 1.8 | 6.1 | Low |
| Shingwedzi | 532.6 | 225.9 | 42.4 | High | 15.6 | 0.6 | 3.8 | Low | 29.7 | 1.4 | 4.7 | Low |
| Punda maria | 565.9 | 336.1 | 59.4 | High | 16.0 | 0.9 | 5.6 | Low | 29.1 | 1.4 | 4.8 | Low |
| Musina | 358.0 | 148.7 | 41.5 | High | 15.4 | 0.6 | 3.9 | Low | 30.4 | 1.3 | 4.3 | Low |
| Tshiombo | 1003.0 | 630.5 | 62.8 | High | 15.1 | 0.4 | 2.6 | Low | 27.3 | 0.7 | 2.6 | Low |
| Settlers | 648.3 | 135.3 | 20.9 | Moderate | 10.9 | 0.7 | 6.4 | Low | 28.0 | 1.2 | 4.2 | Low |
| Zebediela | 560.5 | 123.7 | 22.6 | Moderate | 13.1 | 0.8 | 6.1 | Low | 27.4 | 1.0 | 3.6 | Low |
| Bavaria | 576.7 | 169.9 | 29.5 | Moderate | 15.0 | 0.7 | 4.7 | Low | 28.2 | 0.8 | 2.8 | Low |
| Lephalale | 445.8 | 181.6 | 40.7 | High | 13.1 | 1.2 | 9.1 | Low | 28.7 | 1.0 | 3.5 | Low |
| Station Name | DJF | MAM | JJA | SON | ||||||||||||
|---|---|---|---|---|---|---|---|---|---|---|---|---|---|---|---|---|
| Mean (mm) | SD (mm) | CV (%) | CV Category | Mean (mm) | SD (mm) | CV (%) | CV Category | Mean (mm) | SD (mm) | CV (%) | CV Category | Mean (mm) | SD (mm) | CV (%) | CV Category | |
| Thabazimbi | 260.0 | 170.3 | 65.5 | High | 141.6 | 61.9 | 43.7 | High | 98.1 | 116.5 | 118.8 | High | 134.1 | 58.1 | 43.4 | High |
| Roedtan | 241.7 | 102.0 | 42.2 | High | 103.6 | 66.4 | 64.1 | High | 20.8 | 61.8 | 297.3 | High | 160.6 | 85.4 | 53.2 | High |
| Fleur-de-lys | 374.7 | 159.8 | 42.7 | High | 152.8 | 64.2 | 42.0 | High | 30.9 | 32.5 | 105.4 | High | 162.3 | 68.6 | 42.2 | High |
| Sentrum-ysterpan | 237.0 | 160.9 | 67.9 | High | 131.0 | 60.7 | 46.4 | High | 77.0 | 101.5 | 131.8 | High | 119.8 | 42.3 | 35.3 | High |
| Modjadji | 387.6 | 225.4 | 58.2 | High | 147.6 | 81.1 | 55.0 | High | 21.0 | 18.1 | 86.2 | High | 151.6 | 62.3 | 41.1 | High |
| Phalaborwa | 238.7 | 124.2 | 52.0 | High | 90.7 | 45.1 | 49.7 | High | 15.4 | 16.7 | 108.4 | High | 114.5 | 60.4 | 52.7 | High |
| Marnitz | 238.4 | 107.8 | 45.2 | High | 80.8 | 44.9 | 55.6 | High | 12.1 | 14.8 | 122.9 | High | 107.9 | 59.3 | 54.9 | High |
| Shingwedzi | 299.5 | 190.7 | 63.7 | High | 97.5 | 68.6 | 70.4 | High | 16.4 | 13.8 | 84.1 | High | 121.2 | 63.9 | 52.7 | High |
| Punda maria | 308.0 | 214.1 | 69.5 | High | 93.9 | 72.5 | 77.2 | High | 39.4 | 144.1 | 366.1 | High | 124.2 | 73.9 | 59.5 | High |
| Musina | 193.9 | 138.0 | 71.2 | High | 65.6 | 54.8 | 83.5 | High | 9.4 | 15.2 | 161.7 | High | 88.8 | 50.0 | 56.3 | High |
| Tshiombo | 505.9 | 290.1 | 57.3 | High | 199.4 | 154.1 | 77.3 | High | 78.5 | 248.1 | 316.1 | High | 216.1 | 190.7 | 88.2 | High |
| Settlers | 328.9 | 115.0 | 35.0 | High | 128.0 | 80.4 | 62.8 | High | 13.2 | 14.9 | 112.8 | High | 177.2 | 69.4 | 39.2 | High |
| Zebediela | 280.4 | 91.6 | 32.7 | High | 102.3 | 57.9 | 56.6 | High | 11.7 | 15.3 | 130.7 | High | 157.4 | 70.7 | 44.9 | High |
| Bavaria | 295.8 | 125.4 | 42.4 | High | 119.3 | 51.2 | 43.0 | High | 15.2 | 17.0 | 111.8 | High | 145.3 | 70.8 | 48.7 | High |
| Lephalale | 211.3 | 119.1 | 56.3 | High | 86.4 | 58.1 | 67.3 | High | 28.2 | 67.6 | 239.8 | High | 111.7 | 69.5 | 62.2 | High |
| Station Name | DJF | MAM | JJA | SON | ||||||||||||
|---|---|---|---|---|---|---|---|---|---|---|---|---|---|---|---|---|
| Mean (°C) | SD (°C) | CV (%) | CV Category | Mean (°C) | SD (°C) | CV (%) | CV Category | Mean (°C) | SD (°C) | CV (%) | CV Category | Mean (°C) | SD (°C) | CV (%) | CV Category | |
| Thabazimbi | 17.4 | 0.8 | 4.5 | Low | 11.2 | 1.0 | 9.1 | Low | 3.9 | 1.1 | 28.9 | Moderate | 13.4 | 1.0 | 7.8 | Low |
| Roedtan | 17.4 | 0.7 | 4.2 | Low | 11.4 | 0.9 | 8.0 | Low | 4.0 | 1.3 | 32.5 | High | 13.5 | 1.0 | 7.4 | Low |
| Fleur-de-lys | 18.9 | 1.0 | 5.3 | Low | 14.7 | 0.9 | 6.1 | Low | 8.8 | 0.9 | 10.2 | Low | 15.2 | 0.8 | 5.2 | Low |
| Sentrum-ysterpan | 17.6 | 0.8 | 4.5 | Low | 11.9 | 1.5 | 12.6 | Low | 5.0 | 1.2 | 24.0 | Moderate | 14.0 | 1.3 | 9.2 | Low |
| Modjadji | 18.0 | 2.0 | 11.2 | Low | 14.5 | 1.5 | 10.3 | Low | 9.5 | 1.4 | 14.7 | Low | 14.6 | 1.5 | 10.2 | Low |
| Phalaborwa | 20.5 | 0.7 | 3.4 | Low | 16.1 | 0.8 | 5.0 | Low | 9.8 | 0.9 | 9.2 | Low | 16.6 | 0.6 | 3.7 | Low |
| Marnitz | 18.9 | 1.0 | 5.3 | Low | 13.7 | 1.2 | 8.8 | Low | 7.3 | 1.2 | 16.4 | Low | 15.8 | 1.3 | 8.2 | Low |
| Shingwedzi | 20.6 | 1.1 | 5.3 | Low | 15.7 | 1.1 | 7.0 | Low | 9.2 | 0.9 | 9.8 | Low | 16.7 | 1.1 | 6.6 | Low |
| Punda maria | 20.5 | 0.8 | 3.9 | Low | 16.2 | 1.3 | 8.0 | Low | 10.4 | 1.6 | 15.3 | Low | 16.9 | 0.9 | 5.3 | Low |
| Musina | 21.1 | 0.8 | 3.8 | Low | 15.5 | 1.0 | 6.5 | Low | 8.0 | 0.9 | 11.3 | Low | 17.1 | 0.7 | 4.1 | Low |
| Tshiombo | 19.3 | 0.5 | 2.6 | Low | 15.3 | 0.8 | 5.2 | Low | 10.0 | 0.7 | 7.0 | Low | 15.8 | 0.6 | 3.8 | Low |
| Settlers | 16.7 | 0.6 | 3.6 | Low | 10.6 | 0.8 | 7.5 | Low | 3.5 | 1.0 | 28.6 | Moderate | 12.8 | 1.0 | 7.8 | Low |
| Zebediela | 18.0 | 0.6 | 3.3 | Low | 13.1 | 1.1 | 8.4 | Low | 6.6 | 1.5 | 23.0 | Moderate | 14.8 | 0.9 | 6.0 | Low |
| Bavaria | 19.4 | 1.0 | 5.2 | Low | 15.2 | 1.0 | 6.6 | Low | 9.4 | 1.2 | 13.1 | Low | 15.7 | 0.8 | 5.1 | Low |
| Lephalale | 18.7 | 1.5 | 8.0 | Low | 12.8 | 1.4 | 10.9 | Low | 5.8 | 1.2 | 20.8 | Low | 15.2 | 1.8 | 11.8 | Low |
| Station Name | DJF | MAM | JJA | SON | ||||||||||||
|---|---|---|---|---|---|---|---|---|---|---|---|---|---|---|---|---|
| Mean (°C) | SD (°C) | CV (%) | CV Category | Mean (°C) | SD (°C) | CV (%) | CV Category | Mean (°C) | SD (°C) | CV (%) | CV Category | Mean (°C) | SD (°C) | CV (%) | CV Category | |
| Thabazimbi | 30.7 | 1.7 | 5.7 | Low | 27.2 | 2.0 | 7.4 | Low | 23.1 | 1.3 | 5.8 | Low | 29.7 | 1.3 | 4.5 | Low |
| Roedtan | 31.1 | 1.4 | 4.6 | Low | 27.8 | 1.3 | 4.8 | Low | 23.7 | 1.3 | 5.5 | Low | 29.9 | 1.5 | 5.2 | Low |
| Fleur-de-lys | 29.1 | 1.0 | 3.3 | Low | 25.9 | 1.0 | 3.7 | Low | 25.6 | 0.9 | 3.4 | Low | 28.9 | 1.1 | 3.9 | Low |
| Sentrum-ysterpan | 28.7 | 1.4 | 5.0 | Low | 26.3 | 1.4 | 5.3 | Low | 23.3 | 1.2 | 5.0 | Low | 27.2 | 1.4 | 5.2 | Low |
| Modjadji | 29.6 | 2.1 | 7.0 | Low | 27.2 | 2.1 | 7.7 | Low | 24.1 | 1.9 | 7.8 | Low | 27.9 | 2.1 | 7.5 | Low |
| Phalaborwa | 32.3 | 1.1 | 3.5 | Low | 29.6 | 1.4 | 4.7 | Low | 26.2 | 1.1 | 4.3 | Low | 30.2 | 1.2 | 3.8 | Low |
| Marnitz | 30.8 | 2.1 | 6.8 | Low | 26.5 | 1.8 | 6.9 | Low | 26.7 | 1.8 | 6.7 | Low | 31.5 | 1.9 | 6.0 | Low |
| Shingwedzi | 30.9 | 1.9 | 6.1 | Low | 27.8 | 1.7 | 6.3 | Low | 27.7 | 1.3 | 4.7 | Low | 31.5 | 1.7 | 5.5 | Low |
| Punda maria | 31.4 | 2.8 | 9.0 | Low | 28.8 | 2.5 | 8.6 | Low | 25.7 | 1.1 | 4.4 | Low | 30.2 | 1.6 | 5.2 | Low |
| Musina | 31.7 | 1.9 | 5.9 | Low | 28.0 | 1.5 | 5.3 | Low | 27.9 | 1.3 | 4.6 | Low | 32.7 | 1.4 | 4.3 | Low |
| Tshiombo | 29.5 | 1.3 | 4.4 | Low | 27.0 | 1.2 | 4.4 | Low | 24.0 | 0.8 | 3.3 | Low | 28.4 | 1.0 | 3.5 | Low |
| Settlers | 30.8 | 1.6 | 5.2 | Low | 27.5 | 1.5 | 5.4 | Low | 23.5 | 1.2 | 5.1 | Low | 30.1 | 1.5 | 4.9 | Low |
| Zebediela | 30.2 | 1.3 | 4.3 | Low | 27.1 | 1.1 | 4.0 | Low | 23.0 | 1.1 | 4.8 | Low | 29.2 | 1.2 | 4.1 | Low |
| Bavaria | 30.9 | 1.2 | 3.8 | Low | 28.3 | 1.0 | 3.5 | Low | 25.0 | 0.9 | 3.6 | Low | 28.8 | 1.0 | 3.4 | Low |
| Lephalale | 31.6 | 1.4 | 4.4 | Low | 28.2 | 1.4 | 4.9 | Low | 24.4 | 1.1 | 4.5 | Low | 30.6 | 1.3 | 4.2 | Low |
Appendix B
| Station | DJF | MAM | JJA | SON | ||||||||||||||||
|---|---|---|---|---|---|---|---|---|---|---|---|---|---|---|---|---|---|---|---|---|
| S | Var(S) | p-Value | z | S | Var(S) | p-Value | z | S | Var(S) | p-Value | z | S | Var(S) | p-Value | z | |||||
| Thabazimbi | 283.000 | 6327.0 | 0.000392 *** | 3.545 | I | 39.000 | 6327.0 | 0.6328 | 0.4777 | I | −318.0 | 6324.0 | 0.000067 *** | −3.986 | D | 105.0 | 6327.0 | 0.1911 | 1.3075 | I |
| Roedtan | −221.000 | 6327.0 | 0.005678 *** | −2.7658 | D | 87.000 | 6327.0 | 0.2796 | 1.0812 | I | 121.0 | 6201.0 | 0.1275 | 1.5239 | I | −91.00 | 6327.0 | 0.2579 | −1.131 | D |
| Fleur-de-lys | 119.0000 | 6327.0 | 0.1379 | 1.4835 | I | 80.00000 | 6326.0 | 0.3206 | 0.9932 | I | −58.00 | 6326.0 | 0.4736 | −0.7166 | D | 49.00 | 6327.0 | 0.5462 | 0.6034 | I |
| Sentrum-ysterpan | 301.0000 | 6327.0 | 0.000162 *** | 3.7716 | I | 7.000000 | 6327.0 | 0.9399 | 0.0754 | I | −232.0 | 6298.6 | 0.0036 *** | −2.9106 | D | 89.00 | 6327.0 | 0.2686 | 1.1063 | I |
| Modjadji | −5.0000 | 6327.0 | 0.9599 | −0.0502 | D | −19.000 | 6327.0 | 0.821 | −0.2262 | D | −128.0 | 6326.0 | 0.1103 | −1.5968 | D | −163.0 | 6325.0 | 0.0416 ** | −2.037 | D |
| Phalaborwa | −2.00000 | 6326.0 | 0.99 | −0.0125 | D | 3.0000 | 6327.0 | 0.9799 | 0.0251 | I | −131.0 | 6325.0 | 0.1021 | −1.6346 | D | −56.00 | 6326.00 | 0.4892 | −0.6915 | D |
| Marnitz | 95.00000 | 6327.0 | 0.2373 | 1.1818 | I | −16.0000 | 6326.0 | 0.8504 | −0.1885 | D | 10.00 | 6294.0 | 0.9097 | 0.1134 | I | 30.00 | 6326.0 | 0.7154 | 0.364 | I |
| Shingwedzi | 157.0000 | 6327.0 | 0.04985 ** | 1.9612 | I | 99.00000 | 6327.0 | 0.2179 | 1.232 | I | 9.000 | 6325.0 | 0.9199 | 0.1005 | I | 98.00 | 6326.0 | 0.2226 | 1.2196 | I |
| Punda maria | 123.0000 | 6327.0 | 0.1251 | 1.5338 | I | 155.0000 | 6327.0 | 0.05286 * | 1.9361 | I | 93.00 | 6325.0 | 0.2474 | 1.1568 | I | −27.00 | 6327.0 | 0.7438 | −0.3268 | D |
| Musina | 149.0000 | 6327.0 | 0.06279 * | 1.8606 | I | 21.00000 | 6325.0 | 0.8014 | 0.2514 | I | −16.00 | 6258.6 | 0.8496 | −0.1896 | D | −31.00 | 6327.0 | 0.7061 | −0.3771 | D |
| Tshiombo | 85.00000 | 6327.0 | 0.2909 | 1.056 | I | 95.00000 | 6327.0 | 0.2373 | 1.1818 | I | −48.00 | 6326.0 | 0.5546 | −0.5909 | D | 7.000 | 6327.0 | 0.9399 | 0.0754 | I |
| Settlers | 17.00000 | 6327.0 | 0.8406 | 0.2011 | I | 91.00000 | 6327.0 | 0.2579 | 1.1315 | I | −44.00 | 6309.3 | 0.5883 | −0.5413 | D | 9.000 | 6327.0 | 0.9199 | 0.1005 | I |
| Zebediela | −47.0000 | 6327.0 | 0.5631 | −0.5783 | D | 67.00000 | 6327.0 | 0.4067 | 0.8297 | I | −34.00 | 6309.3 | 0.6778 | −0.4154 | D | 63.00 | 6327.0 | 0.4357 | 0.7794 | I |
| Bavaria | 71.0000 | 6327.0 | 0.3788 | 0.8800 | I | 76.0000 | 6326.0 | 0.3457 | 0.9429 | I | −39.00 | 6325.0 | 0.6328 | −0.4778 | D | 13.00 | 6327.0 | 0.8801 | 0.1508 | D |
| Lephalale | −200.000 | 6317.3 | 0.01229 * | −2.5037 | D | −120.000 | 6326.0 | 0.1346 | −1.4962 | D | −9.000 | 6295.6 | 0.9197 | −0.1008 | D | −84.00 | 6323.3 | 0.2966 | −1.0438 | D |
| Station | DJF | MAM | JJA | SON | ||||||||||||||||
|---|---|---|---|---|---|---|---|---|---|---|---|---|---|---|---|---|---|---|---|---|
| S | Var(S) | p-Value | z | S | Var(S) | p-Value | z | S | Var(S) | p-Value | z | S | Var(S) | p-Value | z | |||||
| Thabazimbi | −65.0000 | 6294.3 | 0.4198 | −0.8066 | D | 176.0000 | 6312.6 | 0.02762 ** | 2.2026 | I | 293.0 | 6319.0 | 0.000239 *** | 3.6733 | I | 58.00 | 6315.3 | 0.4732 | 0.7172 | I |
| Roedtan | −133.000 | 6297.0 | 0.09622 * | −1.6634 | D | −112.000 | 6295.3 | 0.1618 | −1.399 | D | −209.0 | 6314.3 | 0.008856 *** | −2.6176 | D | −131.0 | 6307.6 | 0.1017 | −1.6369 | D |
| Fleur-de-lys | −161.000 | 6311.6 | 0.04402 ** | −2.0139 | D | −80.0000 | 6296.0 | 0.3194 | −0.9956 | D | 102.0 | 6308.0 | 0.2035 | 1.2717 | I | −109.0 | 6300.3 | 0.1736 | −1.3606 | D |
| Sentrum-ysterpan | 74.000 | 6298.6 | 0.3577 | 0.9198 | I | 183.0000 | 6309.6 | 0.02195 ** | 2.2912 | I | 240.0 | 6312.0 | 0.002628 *** | 3.0083 | I | 149.0 | 6306.3 | 0.06237 * | 1.8637 | I |
| Modjadji | 116.0000 | 6317.3 | 0.1479 | 1.4469 | I | 56.00000 | 6307.3 | 0.4886 | 0.6925 | I | −74.00 | 6315.3 | 0.3583 | −0.9186 | D | 164.0 | 6314.6 | 0.04025 ** | 2.0512 | I |
| Phalaborwa | −10.0000 | 6299.3 | 0.9097 | −0.1134 | D | −112.000 | 6297.3 | 0.1619 | −1.3988 | D | −151.0 | 6289.6 | 0.05857 * | −1.8914 | D | 27.00 | 6283.6 | 0.7429 | 0.3279 | I |
| Marnitz | 125.0000 | 6299.0 | 0.1182 | 1.5624 | I | 2.000000 | 6312.6 | 0.99 | 0.0125 | I | −151.0 | 6312.3 | 0.05903 * | −1.888 | D | 68.00 | 6296.0 | 0.3985 | 0.8443 | I |
| Shingwedzi | −189.000 | 6305.0 | 0.0179 ** | −2.3676 | D | −197.000 | 6296.3 | 0.01351 ** | −2.4701 | D | −13.00 | 6303.0 | 0.8799 | −0.1511 | D | −75.00 | 6305.0 | 0.3514 | −0.9319 | D |
| Punda maria | −65.0000 | 6271.6 | 0.419 | 0.8081 | D | −223.000 | 6302.3 | 0.0051 *** | −2.7964 | D | −188.0 | 6298.0 | 0.01846 ** | −2.3564 | D | −125.0 | 6299.0 | 0.1182 | −1.5624 | D |
| Musina | −140.000 | 6294.6 | 0.07978 * | −1.752 | D | −141.000 | 6306.3 | 0.07791 * | −1.7629 | D | 7.000 | 6297.6 | 0.9397 | 0.0756 | I | −93.00 | 6297.6 | 0.2463 | −1.1593 | D |
| Tshiombo | −132.000 | 6284.0 | 0.09842 * | −1.6525 | D | −247.000 | 6284.3 | 0.0019 *** | −3.1032 | D | −78.00 | 6295.3 | 0.3318 | −0.9704 | D | −4.000 | 6261.3 | 0.9698 | −0.0379 | D |
| Settlers | 27.00000 | 6279.0 | 0.7428 | 0.3281 | I | 128.0000 | 6301.3 | 0.1096 | 1.5999 | I | 94.00 | 6298.6 | 0.2413 | 1.1718 | I | 68.00 | 6292.0 | 0.3983 | 0.8446 | I |
| Zebediela | −53.0000 | 6291.6 | 0.5121 | −0.6555 | D | −152.000 | 6302.0 | 0.05716 * | −1.9021 | D | −167.0 | 6315.6 | 0.03673 ** | −2.0888 | D | 9.000 | 6303.6 | 0.9197 | 0.1007 | I |
| Bavaria | −49.0000 | 6309.0 | 0.5456 | −0.6043 | D | −32.0000 | 6310.0 | 0.6963 | −0.390 | D | 125.0 | 6318.3 | 0.1188 | 1.56 | I | −68.00 | 6304.0 | 0.3988 | −0.8438 | D |
| Lephalale | 324.0000 | 6309.3 | 0.0000 *** | 4.0664 | I | 270.0000 | 6316.0 | 0.0007 *** | 3.3848 | I | 171.0 | 6305.0 | 0.03228 ** | 2.1409 | I | 334.0 | 6314.6 | 0.0000 *** | 4.1905 | I |
| Station | DJF | MAM | JJA | SON | ||||||||||||||||
|---|---|---|---|---|---|---|---|---|---|---|---|---|---|---|---|---|---|---|---|---|
| S | Var(S) | p-Value | z | S | Var(S) | p-Value | z | S | Var(S) | p-Value | Z | S | Var(S) | p-Value | z | |||||
| Thabazimbi | −99.0000 | 6314.3 | 0.2175 | −1.2333 | D | −11.0000 | 6319.0 | 0.8999 | −0.1258 | D | 74.00 | 6310.0 | 0.3581 | 0.9189 | I | 46.00 | 6308.6 | 0.571 | 0.5665 | I |
| Roedtan | 152.0000 | 6312.6 | 0.05737 * | 1.9005 | I | 155.0000 | 6305.0 | 0.05245 * | 1.9394 | I | 313.0 | 6309.6 | 0.0000 *** | 3.9278 | I | 280.0 | 6296.6 | 0.0004 *** | 3.516 | I |
| Fleur-de-lys | −68.0000 | 6302.0 | 0.3987 | −0.8439 | D | −85.0000 | 6293.6 | 0.2897 | −1.0588 | D | 29.00 | 6290.3 | 0.7241 | 0.3530 | I | −11.00 | 6308.3 | 0.8998 | −0.1259 | D |
| Sentrum-ysterpan | 148.0000 | 6313.3 | 0.0643 * | 1.8501 | I | 132.0000 | 6317.3 | 0.09932 * | 1.6482 | I | 238.0 | 6298.0 | 0.0028 *** | 2.9864 | I | 276.0 | 6314.6 | 0.0005 *** | 3.4606 | I |
| Modjadji | 213.0000 | 6323.0 | 0.0076 *** | 2.6661 | I | 229.0000 | 6316.3 | 0.0041 *** | 2.8688 | I | 317.0 | 6319.0 | 0.0000 *** | 3.9752 | I | 381.0 | 6321.0 | 0.0000 *** | 4.7796 | I |
| Phalaborwa | 179.0000 | 6308.3 | 0.02502 ** | 2.2411 | I | 214.0000 | 6310.0 | 0.0073 *** | 2.6814 | I | 353.0 | 6306.3 | 0.0000 *** | 4.4326 | I | 359.0 | 6305.6 | 0.0000 *** | 4.5083 | I |
| Marnitz | 234.0000 | 6314.6 | 0.0033 *** | 2.9321 | I | 297.000 | 6307.0 | 0.0001 *** | 3.7272 | I | 352.0 | 6310.0 | 0.0000 *** | 4.4187 | I | 334.0 | 6306.0 | 0.0000 *** | 4.1934 | I |
| Shingwedzi | −186.000 | 6310.6 | 0.01987 ** | −2.3288 | D | −111.000 | 6304.3 | 0.1659 | −1.3854 | D | −103.0 | 6298.3 | 0.1987 | −1.2852 | D | −113.0 | 6313.6 | 0.1587 | −1.4095 | D |
| Punda maria | 23.00000 | 6309.6 | 0.7818 | 0.2769 | I | 44.00000 | 6312.0 | 0.5883 | 0.5412 | I | 258.0 | 6303.3 | 0.0012 *** | 3.237 | I | 295.0 | 6296.3 | 0.0002 *** | 3.7051 | I |
| Musina | 88.00000 | 6308.6 | 0.2734 | 1.0953 | I | 172.0000 | 6317.3 | 0.03144 ** | 2.1514 | I | 345.0 | 6297.6 | 0.0000 *** | 4.3348 | I | 255.0 | 6317.0 | 0.0013 *** | 3.1958 | I |
| Tshiombo | 9.00000 | 6308.3 | 0.9198 | 0.1007 | I | 60.00000 | 6312.6 | 0.4577 | 0.7425 | I | 235.0 | 6307.0 | 0.0032 *** | 2.9465 | I | 249.0 | 6311.0 | 0.0017 *** | 3.1218 | I |
| Settlers | 211.0000 | 6309.6 | 0.0082 *** | 2.6437 | I | 216.0000 | 6310.6 | 0.0068 *** | 2.7065 | I | 350.0 | 6303.3 | 0.0000 *** | 4.3958 | I | 341.0 | 6316.3 | 0.0000 *** | 4.2781 | I |
| Zebediela | 145.0000 | 6292.3 | 0.06947 * | 1.8153 | I | 184.0000 | 6306.6 | 0.0212 ** | 2.3044 | I | 361.0 | 6309.6 | 0.0000 *** | 4.5321 | I | 298.0 | 6307.3 | 0.0001 *** | 3.7397 | I |
| Bavaria | −25.0000 | 6304.3 | 0.7624 | −0.3022 | D | 21.00000 | 6309.0 | 0.8012 | 0.2518 | I | 132.0 | 6310.6 | 0.09914 * | 1.649 | I | 160.0 | 6300.6 | 0.04517 ** | 2.0031 | I |
| Lephalale | 56.00000 | 6305.3 | 0.4885 | 0.6926 | I | 144.0000 | 6307.3 | 0.07177 * | 1.8006 | I | 359.0 | 6307.0 | 0.0000 *** | 4.5079 | I | 293.0 | 6313.6 | 0.0002 *** | 3.6749 | I |
References
- Li, Y.; Conway, D.; Xiong, W.; Gao, Q.; Wu, Y.; Wan, Y.; Li, Y.; Zhang, S. Effects of climate variability and change on Chinese agriculture: A review. Clim. Res. 2011, 50, 83–102. [Google Scholar] [CrossRef]
- Vermeulen, S.J.; Aggarwal, P.K.; Ainslie, A.; Angelone, C.; Campbell, B.M.; Challinor, A.J.; Hansen, J.W.; Ingram, J.S.; Jarvis, A.; Kristjanson, P.; et al. Options for support to agriculture and food security under climate change. Environ. Sci. Policy 2012, 15, 136–144. [Google Scholar] [CrossRef]
- Marshall, N.A.; Smajgl, A. Understanding variability in adaptive capacity on rangelands. Rangel. Ecol. Manag. 2013, 66, 88–94. [Google Scholar] [CrossRef]
- Anderson, K.E.; Glenn, N.F.; Spaete, L.P.; Shinneman, D.J.; Pilliod, D.S.; Arkle, R.S.; McIlroy, S.K.; Derryberry, D.R. Estimating vegetation biomass and cover across large plots in shrub and grass dominated drylands using terrestrial lidar and machine learning. Ecol. Indic. 2018, 84, 793–802. [Google Scholar] [CrossRef]
- Vogel, E.; Donat, M.G.; Alexander, L.V.; Meinshausen, M.; Ray, D.K.; Karoly, D.; Meinshausen, N.; Frieler, K. The effects of climate extremes on global agricultural yields. Environ. Res. Lett. 2019, 14, 054010. [Google Scholar] [CrossRef]
- Dingaan, M.N.; Tsubo, M. Improved assessment of pasture availability in semi-arid grassland of South Africa. Environ. Monit. Assess. 2019, 191, 1–12. [Google Scholar] [CrossRef]
- Asare-Nuamah, P.; Botchway, E. Understanding climate variability and change: Analysis of temperature and rainfall across agroecological zones in Ghana. Heliyon 2019, 5, e02654. [Google Scholar] [CrossRef]
- Belay, A.; Demissie, T.; Recha, J.W.; Oludhe, C.; Osano, P.M.; Olaka, L.A.; Solomon, D.; Berhane, Z. Analysis of climate variability and trends in Southern Ethiopia. Climate 2021, 9, 96. [Google Scholar] [CrossRef]
- Eden, C.; Willebrand, J. Mechanism of interannual to decadal variability of the North Atlantic circulation. J. Clim. 2001, 14, 2266–2280. [Google Scholar] [CrossRef]
- Malherbe, J.; Dieppois, B.; Maluleke, P.; Van Staden, M.; Pillay, D.L. South African droughts and decadal variability. Nat. Hazards 2016, 80, 657–681. [Google Scholar] [CrossRef]
- Zhao, Y.; Wang, C.; Wang, S.; Tibig, L.V. Impacts of present and future climate variability on agriculture and forestry in the humid and sub-humid tropics. Clim. Chang. 2005, 70, 73–116. [Google Scholar] [CrossRef]
- Homar, V.; Ramis, C.; Romero, R.; Alonso, S. Recent trends in temperature and precipitation over the Balearic Islands (Spain). Clim. Chang. 2010, 98, 199–211. [Google Scholar] [CrossRef]
- L’Heureux, M.L.; Takahashi, K.; Watkins, A.B.; Barnston, A.G.; Becker, E.J.; Di Liberto, T.E.; Gamble, F.; Gottschalck, J.; Halpert, M.S.; Huang, B.; et al. Observing and predicting the 2015/16 El Niño. Bull. Am. Meteorol. Soc. 2017, 98, 1363–1382. [Google Scholar] [CrossRef]
- Cayan, D.R. Interannual climate variability and snowpack in the western United States. J. Clim. 1996, 9, 928–948. [Google Scholar] [CrossRef]
- Usman, M.T.; Reason, C.J.C. Dry spell frequencies and their variability over southern Africa. Clim. Res. 2004, 26, 199–211. [Google Scholar] [CrossRef]
- Roudier, P.; Sultan, B.; Quirion, P.; Berg, A. The impact of future climate change on West African crop yields: What does the recent literature say? Glob. Environ. Chang. 2011, 21, 1073–1083. [Google Scholar] [CrossRef]
- Engelbrecht, F.; Adegoke, J.; Bopape, M.J.; Naidoo, M.; Garland, R.; Thatcher, M.; McGregor, J.; Katzfey, J.; Werner, M.; Ichoku, C.; et al. Projections of rapidly rising surface temperatures over Africa under low mitigation. Environ. Res. Lett. 2015, 10, 085004. [Google Scholar] [CrossRef]
- Intergovernmental Panel for Climate Change. Climate Change 2007: The Physical Science Basis. Contribution of Working Group I to the Fourth Assessment Report of the Intergovernmental Panel on Climate Change; Cambridge University Press: Cambridge, UK, 2007. [Google Scholar]
- Salinger, M.J. Climate variability and change: Past, present and future—An overview. Clim. Chang. 2005, 70, 9–29. [Google Scholar] [CrossRef]
- Ziervogel, G.; Bharwani, S.; Downing, T.E. Adapting to climate variability: Pumpkins, people and policy. In Natural Resources Forum; Blackwell Publishing Ltd.: Oxford, UK, 2006; Volume 30, pp. 294–305. [Google Scholar]
- Chambers, J.C.; Pellant, M. Climate change impacts on northwestern and intermountain United States rangelands. Rangelands 2008, 30, 29–33. [Google Scholar] [CrossRef]
- Aggarwal, P.K.; Baethegan, W.E.; Cooper, P.; Gommes, R.; Lee, B.; Meinke, H.; Rathore, L.S.; Sivakumar, M.V. Managing climatic risks to combat land degradation and enhance food security: Key information needs. Procedia Environ. Sci. 2010, 1, 305–312. [Google Scholar] [CrossRef]
- Mpandeli, N.S.; Maponya, P.I. Coping with climate variability in Limpopo province, South Africa. Peak J. Agric. Sci. 2013, 1, 54–64. [Google Scholar]
- Boansi, D.; Tambo, J.A.; Müller, M. Analysis of farmers’ adaptation to weather extremes in West African Sudan Savanna. Weather. Clim. Extrem. 2017, 16, 1–13. [Google Scholar] [CrossRef]
- Godde, C.; Dizyee, K.; Ash, A.; Thornton, P.; Sloat, L.; Roura, E.; Henderson, B.; Herrero, M. Climate change and variability impacts on grazing herds: Insights from a system dynamics approach for semi-arid Australian rangelands. Glob. Chang. Biol. 2019, 25, 3091–3109. [Google Scholar] [CrossRef] [PubMed]
- Vogel, C. “Seven fat years and seven lean years”? Climate change and agriculture in Africa. IDS Bull. 2005, 36, 30–35. [Google Scholar] [CrossRef][Green Version]
- Thomas, D.S.; Twyman, C.; Osbahr, H.; Hewitson, B. Adaptation to climate change and variability: Farmer responses to intra-seasonal precipitation trends in South Africa. Clim. Chang. 2007, 83, 301–322. [Google Scholar] [CrossRef]
- Hoffman, T.; Vogel, C. Climate change impacts on African rangelands. Rangelands 2008, 30, 12–17. [Google Scholar] [CrossRef]
- Funk, C.; Hoell, A.; Shukla, S.; Blade, I.; Liebmann, B.; Roberts, J.B.; Robertson, F.R.; Husak, G. Predicting East African spring droughts using Pacific and Indian Ocean sea surface temperature indices. Hydrol. Earth Syst. Sci. 2014, 18, 4965–4978. [Google Scholar] [CrossRef]
- Mbokodo, I.L.; Bopape, M.J.M.; Ndarana, T.; Mbatha, S.M.; Muofhe, T.P.; Singo, M.V.; Xulu, N.G.; Mohomi, T.; Ayisi, K.K.; Chikoore, H. Heatwave Variability and Structure in South Africa during Summer Drought. Climate 2023, 11, 38. [Google Scholar] [CrossRef]
- Mpandeli, S.; Nesamvuni, E.; Maponya, P. Adapting to the impacts of drought by smallholder farmers in Sekhukhune District in Limpopo Province, South Africa. J. Agric. Sci. 2015, 7, 115. [Google Scholar] [CrossRef]
- Conway, D.; Van Garderen, E.A.; Deryng, D.; Dorling, S.; Krueger, T.; Landman, W.; Lankford, B.; Lebek, K.; Osborn, T.; Ringler, C.; et al. Climate and southern Africa’s water–energy–food nexus. Nat. Clim. Chang. 2015, 5, 837–846. [Google Scholar] [CrossRef]
- Maponya, P.; Mpandeli, S. The role of extension services in climate change adaptation in Limpopo province, South Africa. J. Agric. Ext. Rural. Dev. 2013, 5, 137–142. [Google Scholar]
- McGeehin, M.A.; Mirabelli, M. The potential impacts of climate variability and change on temperature-related morbidity and mortality in the United States. Environ. Health Perspect. 2001, 109 (Suppl. S2), 185–189. [Google Scholar] [PubMed]
- West, J.W. Effects of heat-stress on production in dairy cattle. J. Dairy Sci. 2003, 86, 2131–2144. [Google Scholar] [CrossRef] [PubMed]
- Moeletsi, M.E.; Walker, S. Rainy season characteristics of the Free State Province of South Africa with reference to rain-fed maize production. Water SA 2012, 38, 775–782. [Google Scholar] [CrossRef]
- Mazibuko, S.M.; Mukwada, G.; Moeletsi, M.E. Assessing the frequency of drought/flood severity in the Luvuvhu River catchment, Limpopo Province, South Africa. Water SA 2021, 47, 172–184. [Google Scholar] [CrossRef]
- Archer, E.R.M.; Landman, W.A.; Malherbe, J.; Maluleke, P.; Weepener, H. Managing climate risk in livestock production in South Africa: How might improved tailored forecasting contribute? Clim. Risk Manag. 2021, 32, 100312. [Google Scholar] [CrossRef]
- Gbetibouo, G.A. Understanding Farmers’ Perceptions and Adaptations to Climate Change and Variability; The Case of the Limpopo Basin, South Africa: IFPRI Discussion Paper 00849; IFPRI: Washington, DC, USA, 2009; Available online: http://www.ifpri.org/publication/understanding-farmers-perceptions-and-adaptationsclimate-change-and-variability (accessed on 20 October 2023).
- Maluleke, P.; Landman, W.A.; Malherbe, J.; Archer, E. Seasonal forecasts for the Limpopo Province in estimating deviations from grazing capacity. Theor. Appl. Climatol. 2019, 137, 1693–1702. [Google Scholar] [CrossRef]
- Masupha, T.E.; Moeletsi, M.E.; Tsubo, M. Prospects of an agricultural drought early warning system in South Africa. Int. J. Disaster Risk Reduct. 2021, 66, 102615. [Google Scholar] [CrossRef]
- Moeletsi, M.E.; Mellaart, E.A.R.; Mpandeli, N.S.; Hamandawana, H. The use of rainfall forecasts as a decision guide for small-scale farming in Limpopo Province, South Africa. J. Agric. Educ. Ext. 2013, 19, 133–145. [Google Scholar] [CrossRef]
- Archer, E.; Landman, W.; Malherbe, J.; Tadross, M.; Pretorius, S. South Africa’s winter rainfall region drought: A region in transition? Clim. Risk Manag. 2019, 25, 100188. [Google Scholar] [CrossRef]
- Maponya, P.; Mpandeli, S. Climate change and agricultural production in South Africa: Impacts and adaptation options. J. Agric. Sci. 2012, 4, 48. [Google Scholar] [CrossRef]
- Hoffmann, M.P.; Odhiambo, J.J.; Koch, M.; Ayisi, K.K.; Zhao, G.; Soler, A.S.; Rötter, R.P. Exploring adaptations of groundnut cropping to prevailing climate variability and extremes in Limpopo Province, South Africa. Field Crops Res. 2018, 219, 1–13. [Google Scholar] [CrossRef]
- Olabanji, M.F.; Ndarana, T.; Davis, N. Impact of climate change on crop production and potential adaptive measures in the olifants catchment, South Africa. Climate 2021, 9, 6. [Google Scholar] [CrossRef]
- Tshiala, M.F.; Olwoch, J.M. Impact of climate variability on tomato production in Limpopo Province, South Africa. Afr. J. Agric. Res. 2010, 5, 2945–2951. [Google Scholar]
- Tshiala, F.M.; Mukarugwiza Olwoch, J.; Alwyn Engelbrecht, F. Analysis of temperature trends over Limpopo province, South Africa. J. Geogr. Geol. 2011, 3, 13–21. [Google Scholar] [CrossRef]
- Nenwiini, S.; Kabanda, T.A. Trends and variability assessment of rainfall in Vhembe South Africa. J. Hum. Ecol. 2013, 42, 171–176. [Google Scholar] [CrossRef]
- MacKellar, N.; New, M.; Jack, C. Observed and modelled trends in rainfall and temperature for South Africa: 1960–2010. S. Afr. J. Sci. 2014, 110, 1–13. [Google Scholar] [CrossRef]
- Archer, E.R. Beyond the “climate versus grazing” impasse: Using remote sensing to investigate the effects of grazing system choice on vegetation cover in the eastern Karoo. J. Arid. Environ. 2004, 57, 381–408. [Google Scholar] [CrossRef]
- Mucina, L.; Rutherford, M.C. The Vegetation of South Africa, Lesotho and Swaziland in Strelitzia 19; South African National Biodiversity Institute: Pretoria, South Africa, 2006. [Google Scholar]
- Hoffman, M.T.; Todd, S. A national review of land degradation in South Africa: The influence of biophysical and socio-economic factors. J. South. Afr. Stud. 2000, 26, 743–758. [Google Scholar] [CrossRef]
- Leonard, L.; Lebogang, T. Exploring the impacts of mining on tourism growth and local sustainability: The case of Mapungubwe Heritage Site, Limpopo, South Africa. Sustain. Dev. 2018, 26, 206–216. [Google Scholar] [CrossRef]
- Phooko-Rabodiba, D.A.; Tambe, B.A.; Nesamvuni, C.N.; Mbhenyane, X.G. Socioeconomic determinants influencing nutritional status of children in sekhukhune district of Limpopo province in South Africa. J. Nutr. Health 2019, 5, 7. [Google Scholar]
- Schulze, B.R. Climate of South Africa. Part 8, General Survey; Government Printer & Weather Bureau: Pretoria, South Africa, 1965.
- Rapolaki, R.S.; Reason, C.J. Tropical storm Chedza and associated floods over south-eastern Africa. Nat. Hazards 2018, 93, 189–217. [Google Scholar] [CrossRef]
- Wessels, K.J.; Prince, S.D.; Malherbe, J.; Small, J.; Frost, P.E.; VanZyl, D. Can human-induced land degradation be distinguished from the effects of rainfall variability? A case study in South Africa. J. Arid. Environ. 2007, 68, 271–297. [Google Scholar] [CrossRef]
- Palmer, A.R.; Bennett, J.E. Degradation of communal rangelands in South Africa: Towards an improved understanding to inform policy. Afr. J. Range Forage Sci. 2013, 30, 57–63. [Google Scholar] [CrossRef]
- Cobon, D.H.; Baethgen, W.E.; Landman, W.; Williams, A.; van Garderen, E.A.; Johnston, P.; Malherbe, J.; Maluleke, P.; Kgakatsi, I.B.; Davis, P. Agroclimatology in grasslands. Agroclimatol. Link. Agric. Clim. 2020, 60, 369–423. [Google Scholar]
- Gibson, D.J. Land Degradation in the Limpopo Province, South Africa. Ph.D. Thesis, University of the Witwatersrand, Johannesburg, South Africa, 2006. [Google Scholar]
- Odhiambo, J.J.; Magandini, V.N. An assessment of the use of mineral and organic fertilizers by smallholder farmers in Vhembe district, Limpopo province, South Africa. Afr. J. Agric. Res. 2008, 3, 357–362. [Google Scholar]
- Phethi, M.D.; Gumbo, J.R. Assessment of impact of land use change on the wetland in Makhitha village, Limpopo province, South Africa. Jàmbá J. Disaster Risk Stud. 2019, 11, 1–6. [Google Scholar] [CrossRef]
- Moeletsi, M.E.; Myeni, L.; Kaempffer, L.C.; Vermaak, D.; de Nysschen, G.; Henningse, C.; Nel, I.; Rowswell, D. Climate Dataset for South Africa by the Agricultural Research Council. Data 2022, 7, 117. [Google Scholar] [CrossRef]
- Abbas, S.; Dastgeer, G. November. Analysing the impacts of climate variability on the yield of Kharif rice over Punjab, Pakistan. In Natural Resources Forum; Blackwell Publishing Ltd.: Oxford, UK, 2021; Volume 45, pp. 329–349. [Google Scholar]
- Shabalala, Z.P.; Moeletsi, M.E.; Tongwane, M.I.; Mazibuko, S.M. Evaluation of infilling methods for time series of daily temperature data: Case study of Limpopo Province, South Africa. Climate 2019, 7, 86. [Google Scholar] [CrossRef]
- Mistry, M.N.; Schneider, R.; Masselot, P.; Royé, D.; Armstrong, B.; Kyselý, J. Comparison of weather station and climate reanalysis data for modelling temperature-related mortality. Sci. Rep. 2022, 12, 5178. [Google Scholar] [CrossRef]
- Kisaka, M.O.; Mucheru-Muna, M.; Ngetich, F.K.; Mugwe, J.N.; Mugendi, D.; Mairura, F. Rainfall variability, drought characterization, and efficacy of rainfall data reconstruction: Case of Eastern Kenya. Adv. Meteorol. 2015, 2015, 380404. [Google Scholar] [CrossRef]
- Vrsalović, A.; Andrić, I.; Bonacci, O.; Kovčić, O. Climate Variability and Trends in Imotski, Croatia: An Analysis of Temperature and Precipitation. Atmosphere 2023, 14, 861. [Google Scholar] [CrossRef]
- Hare, W. Assessment of knowledge on impacts of climate change-contribution. Arctic 2003, 100, 2–106. [Google Scholar]
- Silva, V.D.P.R. On climate variability in Northeast of Brazil. J. Arid. Environ. 2004, 58, 575–596. [Google Scholar] [CrossRef]
- Olefs, M.; Koch, R.; Schöner, W.; Marke, T. Changes in snow depth, snow cover duration, and potential snowmaking conditions in Austria, 1961–2020—A model based approach. Atmosphere 2020, 11, 1330. [Google Scholar] [CrossRef]
- Rehman, S.; Sajjad, H.; Masroor, M.; Rahaman, M.H.; Roshani Ahmed, R.; Sahana, M. Assessment of evidence-based climate variability in Bhagirathi sub-basin of India: A geostatistical analysis. Acta Geophys. 2022, 70, 445–463. [Google Scholar] [CrossRef]
- Stewart, J.I. Response Farming in Rainfed Agriculture; Foundation for World Hunger: Davis, CA, USA, 1988. [Google Scholar]
- Yu, P.S.; Yang, T.C.; Wu, C.K. Impact of climate change on water resources in southern Taiwan. J. Hydrol. 2002, 260, 161–175. [Google Scholar] [CrossRef]
- Kendall, M.G. Rank Correlation Methods; Griffin: London, UK, 1948. [Google Scholar]
- Matimolane, S.; Chikoore, H.; Mathivha, F.I.; Kori, E. Maize producers’ vulnerability to climate change: Evidence from Makhuduthamaga Local Municipality, South Africa. Jàmbá J. Disaster Risk Stud. 2022, 14, 1–10. [Google Scholar] [CrossRef]
- Kruger, A.C.; Shongwe, S. Temperature trends in South Africa: 1960–2003. Int. J. Climatol. A J. R. Meteorol. Soc. 2004, 24, 1929–1945. [Google Scholar] [CrossRef]
- Mupangwa, W.; Chipindu, L.; Ncube, B.; Mkuhlani, S.; Nhantumbo, N.; Masvaya, E.; Ngwira, A.; Moeletsi, M.; Nyagumbo, I.; Liben, F. Temporal changes in minimum and maximum temperatures at selected locations of southern Africa. Climate 2023, 11, 84. [Google Scholar] [CrossRef]
- van der Walt, A.J.; Fitchett, J.M. Exploring extreme warm temperature trends in South Africa: 1960–2016. Theor. Appl. Climatol. 2021, 143, 1341–1360. [Google Scholar] [CrossRef]
- van Wilgen, N.J.; Goodall, V.; Holness, S.; Chown, S.L.; McGeoch, M.A. Rising temperatures and changing rainfall patterns in South Africa’s national parks. Int. J. Climatol. 2016, 36, 706–721. [Google Scholar] [CrossRef]
- Sa’adi, Z.; Shahid, S.; Ismail, T.; Chung, E.S.; Wang, X.J. Trends analysis of rainfall and rainfall extremes in Sarawak, Malaysia using modified Mann–Kendall test. Meteorol. Atmos. Phys. 2019, 131, 263–277. [Google Scholar] [CrossRef]
- Rufino, M.C.; Dury, J.; Tittonell, P.; Van Wijk, M.T.; Herrero, M.; Zingore, S.; Mapfumo, P.; Giller, K.E. Competing use of organic resources, village-level interactions between farm types and climate variability in a communal area of NE Zimbabwe. Agric. Syst. 2011, 104, 175–190. [Google Scholar] [CrossRef]
- Lamega, S.A.; Komainda, M.; Hoffmann, M.P.; Ayisi, K.K.; Odhiambo, J.J.O.; Isselstein, J. It depends on the rain: Smallholder farmers’ perceptions on the seasonality of feed gaps and how it affects livestock in semi-arid and arid regions in Southern Africa. Clim. Risk Manag. 2021, 34, 100362. [Google Scholar] [CrossRef]
- Anyamba, A.; Tucker, C.J.; Eastman, J.R. NDVI anomaly patterns over Africa during the 1997/98 ENSO warm event. Int. J. Remote Sens. 2001, 22, 1847–1860. [Google Scholar]
- Davis, C.L.; Vincent, K. Climate Risk and Vulnerability: A Handbook for Southern Africa, 2nd ed.; CSIR: Pretoria, South Africa, 2017. [Google Scholar]
- Hatfield, J.L.; Prueger, J.H. Temperature extremes: Effect on plant growth and development. Weather Clim. Extrem. 2015, 10, 4–10. [Google Scholar] [CrossRef]
- Evans, J.; Geerken, R. Discrimination between climate and human-induced dryland degradation. J. Arid. Environ. 2004, 57, 535–554. [Google Scholar] [CrossRef]
- Pachavo, G.; Murwira, A. Land-use and land tenure explain spatial and temporal patterns in terrestrial net primary productivity (NPP) in Southern Africa. Geocarto Int. 2014, 29, 671–687. [Google Scholar] [CrossRef]
- Mbatha, K.R.; Ward, D. The effects of grazing, fire, nitrogen and water availability on nutritional quality of grass in semi-arid savanna, South Africa. J. Arid. Environ. 2010, 74, 1294–1301. [Google Scholar] [CrossRef]
- De Leeuw, P.N.; Tothill, J.C. The Concept of Rangeland Carrying Capacity in Sub-Saharan Africa: Myth or Reality; Overseas Development Institute, Pastoral Development Network: London, UK, 1990. [Google Scholar]
- Pickup, G.; Bastin, G.N.; Chewings, V.H. Remote-sensing-based condition assessment for nonequilibrium rangelands under large-scale commercial grazing. Ecol. Appl. 1994, 4, 497–517. [Google Scholar] [CrossRef]
- Calvao, T.; Palmeirim, J.M. Mapping Mediterranean scrub with satellite imagery: Biomass estimation and spectral behaviour. Int. J. Remote Sens. 2004, 25, 3113–3126. [Google Scholar] [CrossRef]
- Kurtz, D.B.; Schellberg, J.; Braun, M. Ground and satellite based assessment of rangeland management in sub-tropical Argentina. Appl. Geogr. 2010, 30, 210–220. [Google Scholar] [CrossRef]
- Hatfield, J.L.; Boote, K.J.; Kimball, B.A.; Ziska, L.H.; Izaurralde, R.C.; Ort, D.; Thomson, A.M.; Wolfe, D. Climate impacts on agriculture: Implications for crop production. Agron. J. 2011, 103, 351–370. [Google Scholar] [CrossRef]
- Schulze, R.E.; Taylor, M.A. Planted Pastures in South Africa and Climate Change: Kikuyu, Eragrostis curvula and Coastcross II. In Handbook for Farmers, Officials and Other Stakeholders on Adaptation to Climate Change in the Agriculture Sector within South Africa. Section D: Natural Grasslands and Pastures in South Africa and Climate Change, Chapter D2; Schulze, R.E., Ed.; Department of Agriculture, Forestry and Fisheries: Pretoria, South Africa, 2016. [Google Scholar]
- Phillips, C. Cattle Behaviour and Welfare; John Wiley & Sons: Hoboken, NJ, USA, 2008. [Google Scholar]


| Station | Years of Available Data | Latitude (° S) | Longitude (° E) | Altitude (m) |
|---|---|---|---|---|
| Thabazimbi | 83 | −24.6 | 27.4 | 1164 |
| Roedtan | 66 | −24.6 | 29.1 | 973 |
| Fleur-de-lys | 108 | −24.5 | 31.0 | 622 |
| Sentrum-ysterpan | 33 | −24.3 | 27.4 | 1005 |
| Modjadji | 32 | −23.6 | 30.4 | 977 |
| Phalaborwa | 51 | −23.9 | 31.2 | 433 |
| Marnitz | 58 | −23.2 | 28.2 | 932 |
| Shingwedzi | 61 | −23.1 | 31.4 | 215 |
| Punda maria | 94 | −22.7 | 31.0 | 462 |
| Musina | 42 | −22.2 | 29.9 | 505 |
| Tshiombo | 35 | −22.8 | 30.5 | 650 |
| Settlers | 39 | −24.9 | 28.6 | 1050 |
| Zebediela | 44 | −24.3 | 29.3 | 1250 |
| Bavaria fruit estates | 74 | −24.4 | 30.9 | 550 |
| Lephalale | 33 | −23.8 | 27.7 | 826 |
| Station Name | Rainfall | Minimum Temperature | Maximum Temperature | |||
|---|---|---|---|---|---|---|
| CV (%) | CV Category | CV (%) | CV Category | CV (%) | CV Category | |
| Thabazimbi | 27.0 | Moderate | 6.1 | Low | 4.8 | Low |
| Roedtan | 29.4 | Moderate | 5.6 | Low | 4.2 | Low |
| Fleur-de-lys | 29.2 | Moderate | 4.8 | Low | 2.9 | Low |
| Sentrum-ysterpan | 25.9 | Moderate | 7.4 | Low | 4.5 | Low |
| Modjadji | 35.7 | High | 7.3 | Low | 6.6 | Low |
| Phalaborwa | 38.4 | High | 3.1 | Low | 3.3 | Low |
| Marnitz | 32.3 | High | 6.4 | Low | 6.1 | Low |
| Shingwedzi | 42.4 | High | 3.8 | Low | 4.7 | Low |
| Punda maria | 59.4 | High | 5.6 | Low | 4.8 | Low |
| Musina | 41.5 | High | 3.9 | Low | 4.3 | Low |
| Tshiombo | 62.8 | High | 2.6 | Low | 2.6 | Low |
| Settlers | 20.9 | Moderate | 6.4 | Low | 4.2 | Low |
| Zebediela | 22.6 | Moderate | 6.1 | Low | 3.6 | Low |
| Bavaria | 29.5 | Moderate | 4.7 | Low | 2.8 | Low |
| Lephalale | 40.7 | High | 9.1 | Low | 3.5 | Low |
| Station Name | DJF | MAM | JJA | SON | ||||
|---|---|---|---|---|---|---|---|---|
| CV (%) | CV Category | CV (%) | CV Category | CV (%) | CV Category | CV (%) | CV Category | |
| Thabazimbi | 65.5 | High | 43.7 | High | 118.8 | High | 43.4 | High |
| Roedtan | 42.2 | High | 64.1 | High | 297.3 | High | 53.2 | High |
| Fleur-de-lys | 42.7 | High | 42.0 | High | 105.4 | High | 42.2 | High |
| Sentrum-ysterpan | 67.9 | High | 46.4 | High | 131.8 | High | 35.3 | High |
| Modjadji | 58.2 | High | 55.0 | High | 86.2 | High | 41.1 | High |
| Phalaborwa | 52.0 | High | 49.7 | High | 108.4 | High | 52.7 | High |
| Marnitz | 45.2 | High | 55.6 | High | 122.9 | High | 54.9 | High |
| Shingwedzi | 63.7 | High | 70.4 | High | 84.1 | High | 52.7 | High |
| Punda maria | 69.5 | High | 77.2 | High | 366.1 | High | 59.5 | High |
| Musina | 71.2 | High | 83.5 | High | 161.7 | High | 56.3 | High |
| Tshiombo | 57.3 | High | 77.3 | High | 316.1 | High | 88.2 | High |
| Settlers | 35.0 | High | 62.8 | High | 112.8 | High | 39.2 | High |
| Zebediela | 32.7 | High | 56.6 | High | 130.7 | High | 44.9 | High |
| Bavaria | 42.4 | High | 43.0 | High | 111.8 | High | 48.7 | High |
| Lephalale | 56.3 | High | 67.3 | High | 239.8 | High | 62.2 | High |
| Station Name | DJF | MAM | JJA | SON | ||||
|---|---|---|---|---|---|---|---|---|
| CV (%) | CV Category | CV (%) | CV Category | CV (%) | CV Category | CV (%) | CV Category | |
| Thabazimbi | 4.5 | Low | 9.1 | Low | 28.9 | Moderate | 7.8 | Low |
| Roedtan | 4.2 | Low | 8.0 | Low | 32.5 | High | 7.4 | Low |
| Fleur-de-lys | 5.3 | Low | 6.1 | Low | 10.2 | Low | 5.2 | Low |
| Sentrum-ysterpan | 4.5 | Low | 12.6 | Low | 24.0 | Moderate | 9.2 | Low |
| Modjadji | 11.2 | Low | 10.3 | Low | 14.7 | Low | 10.2 | Low |
| Phalaborwa | 3.4 | Low | 5.0 | Low | 9.2 | Low | 3.7 | Low |
| Marnitz | 5.3 | Low | 8.8 | Low | 16.4 | Low | 8.2 | Low |
| Shingwedzi | 5.3 | Low | 7.0 | Low | 9.8 | Low | 6.6 | Low |
| Punda maria | 3.9 | Low | 8.0 | Low | 15.3 | Low | 5.3 | Low |
| Musina | 3.8 | Low | 6.5 | Low | 11.3 | Low | 4.1 | Low |
| Tshiombo | 2.6 | Low | 5.2 | Low | 7.0 | Low | 3.8 | Low |
| Settlers | 3.6 | Low | 7.5 | Low | 28.6 | Moderate | 7.8 | Low |
| Zebediela | 3.3 | Low | 8.4 | Low | 23.0 | Moderate | 6.0 | Low |
| Bavaria | 5.2 | Low | 6.6 | Low | 13.1 | Low | 5.1 | Low |
| Lephalale | 8.0 | Low | 10.9 | Low | 20.8 | Low | 11.8 | Low |
| Station Name | DJF | MAM | JJA | SON | ||||
|---|---|---|---|---|---|---|---|---|
| CV (%) | CV Category | CV (%) | CV Category | CV (%) | CV Category | CV (%) | CV Category | |
| Thabazimbi | 5.7 | Low | 7.4 | Low | 5.8 | Low | 4.5 | Low |
| Roedtan | 4.6 | Low | 4.8 | Low | 5.5 | Low | 5.2 | Low |
| Fleur-de-lys | 3.3 | Low | 3.7 | Low | 3.4 | Low | 3.9 | Low |
| Sentrum-ysterpan | 5.0 | Low | 5.3 | Low | 5.0 | Low | 5.2 | Low |
| Modjadji | 7.0 | Low | 7.7 | Low | 7.8 | Low | 7.5 | Low |
| Phalaborwa | 3.5 | Low | 4.7 | Low | 4.3 | Low | 3.8 | Low |
| Marnitz | 6.8 | Low | 6.9 | Low | 6.7 | Low | 6.0 | Low |
| Shingwedzi | 6.1 | Low | 6.3 | Low | 4.7 | Low | 5.5 | Low |
| Punda maria | 9.0 | Low | 8.6 | Low | 4.4 | Low | 5.2 | Low |
| Musina | 5.9 | Low | 5.3 | Low | 4.6 | Low | 4.3 | Low |
| Tshiombo | 4.4 | Low | 4.4 | Low | 3.3 | Low | 3.5 | Low |
| Settlers | 5.2 | Low | 5.4 | Low | 5.1 | Low | 4.9 | Low |
| Zebediela | 4.3 | Low | 4.0 | Low | 4.8 | Low | 4.1 | Low |
| Bavaria | 3.8 | Low | 3.5 | Low | 3.6 | Low | 3.4 | Low |
| Lephalale | 4.4 | Low | 4.9 | Low | 4.5 | Low | 4.2 | Low |
| Station | DJF | MAM | JJA | SON | ||||
|---|---|---|---|---|---|---|---|---|
| p-Value | z | p-Value | z | p-Value | z | p-Value | z | |
| Thabazimbi | 0.00039 *** | 3.545 | 0.632 | 0.477 | 0.00006 *** | −3.986 | 0.191 | 1.307 |
| Roedtan | 0.00567 *** | −2.765 | 0.279 | 1.081 | 0.1275 | 1.5239 | 0.257 | −1.131 |
| Fleur-de-lys | 0.1379 | 1.483 | 0.320 | 0.993 | 0.4736 | −0.716 | 0.546 | 0.603 |
| Sentrum-ysterpan | 0.00016 *** | 3.771 | 0.939 | 0.075 | 0.0036 *** | −2.910 | 0.268 | 1.106 |
| Modjadji | 0.9599 | −0.050 | 0.821 | −0.226 | 0.1103 | −1.596 | 0.041 ** | −2.037 |
| Phalaborwa | 0.99 | −0.012 | 0.979 | 0.025 | 0.1021 | −1.634 | 0.489 | −0.691 |
| Marnitz | 0.2373 | 1.181 | 0.850 | −0.188 | 0.9097 | 0.1134 | 0.7154 | 0.364 |
| Shingwedzi | 0.0498 ** | 1.961 | 0.2179 | 1.232 | 0.9199 | 0.1005 | 0.2226 | 1.219 |
| Punda maria | 0.1251 | 1.533 | 0.0528 * | 1.936 | 0.2474 | 1.1568 | 0.743 | −0.326 |
| Musina | 0.0627 * | 1.860 | 0.8014 | 0.251 | 0.8496 | −0.189 | 0.7061 | −0.377 |
| Tshiombo | 0.2909 | 1.056 | 0.2373 | 1.181 | 0.5546 | −0.590 | 0.939 | 0.075 |
| Settlers | 0.8406 | 0.201 | 0.2579 | 1.131 | 0.5883 | −0.541 | 0.919 | 0.100 |
| Zebediela | 0.5631 | −0.578 | 0.4067 | 0.829 | 0.6778 | −0.415 | 0.435 | 0.779 |
| Bavaria | 0.3788 | 0.880 | 0.3457 | 0.942 | 0.6328 | −0.477 | 0.8801 | 0.150 |
| Lephalale | 0.0122 * | −2.503 | 0.1346 | −1.496 | 0.9197 | −0.100 | 0.296 | −1.043 |
| Station | DJF | MAM | JJA | SON | ||||
|---|---|---|---|---|---|---|---|---|
| p-Value | z | p-Value | z | p-Value | z | p-Value | z | |
| Thabazimbi | 0.419 | −0.806 | 0.0276 ** | 2.2026 | 0.00023 *** | 3.673 | 0.473 | 0.717 |
| Roedtan | 0.0962 * | −1.663 | 0.1618 | −1.399 | 0.00885 *** | −2.617 | 0.101 | −1.636 |
| Fleur-de-lys | 0.0440 ** | −2.013 | 0.3194 | −0.9956 | 0.2035 | 1.271 | 0.173 | −1.360 |
| Sentrum-ysterpan | 0.357 | 0.919 | 0.0219 ** | 2.2912 | 0.00262 *** | 3.008 | 0.0623 * | 1.863 |
| Modjadji | 0.147 | 1.446 | 0.488 | 0.6925 | 0.3583 | −0.918 | 0.0402 ** | 2.051 |
| Phalaborwa | 0.909 | −0.113 | 0.161 | −1.3988 | 0.0585 * | −1.891 | 0.742 | 0.327 |
| Marnitz | 0.118 | 1.562 | 0.99 | 0.0125 | 0.0590 * | −1.888 | 0.398 | 0.844 |
| Shingwedzi | 0.017 ** | −2.367 | 0.0135 ** | −2.4701 | 0.8799 | −0.151 | 0.351 | −0.931 |
| Punda maria | 0.419 | 0.808 | 0.005 *** | −2.7964 | 0.0184 ** | −2.356 | 0.118 | −1.562 |
| Musina | 0.0797 * | −1.752 | 0.0779 * | −1.7629 | 0.9397 | 0.075 | 0.246 | −1.159 |
| Tshiombo | 0.0984 * | −1.652 | 0.0019 *** | −3.1032 | 0.3318 | −0.970 | 0.969 | −0.037 |
| Settlers | 0.742 | 0.328 | 0.1096 | 1.5999 | 0.2413 | 1.171 | 0.398 | 0.844 |
| Zebediela | 0.512 | −0.655 | 0.0571 * | −1.9021 | 0.0367 ** | −2.088 | 0.919 | 0.100 |
| Bavaria | 0.545 | −0.604 | 0.6963 | −0.390 | 0.1188 | 1.560 | 0.398 | −0.843 |
| Lephalale | 0.000 *** | 4.066 | 0.0007 *** | 3.3848 | 0.0322 ** | 2.140 | 0.000 *** | 4.190 |
| Station | DJF | MAM | JJA | SON | ||||
|---|---|---|---|---|---|---|---|---|
| p-Value | z | p-Value | z | p-Value | z | p-Value | z | |
| Thabazimbi | 0.2175 | −1.233 | 0.899 | −0.1258 | 0.3581 | 0.9189 | 0.571 | 0.5665 |
| Roedtan | 0.057 * | 1.9005 | 0.0524 * | 1.9394 | 0.0000 *** | 3.9278 | 0.0004 *** | 3.516 |
| Fleur-de-lys | 0.3987 | −0.843 | 0.2897 | −1.0588 | 0.7241 | 0.3530 | 0.8998 | −0.125 |
| Sentrum-ysterpan | 0.064 * | 1.8501 | 0.0993 * | 1.6482 | 0.0028 *** | 2.9864 | 0.0005 *** | 3.4606 |
| Modjadji | 0.007 *** | 2.666 | 0.0041 *** | 2.8688 | 0.0000 *** | 3.9752 | 0.0000 *** | 4.7796 |
| Phalaborwa | 0.025 ** | 2.241 | 0.0073 *** | 2.6814 | 0.0000 *** | 4.4326 | 0.0000 *** | 4.5083 |
| Marnitz | 0.003 *** | 2.932 | 0.0001 *** | 3.7272 | 0.0000 *** | 4.4187 | 0.0000 *** | 4.1934 |
| Shingwedzi | 0.019 ** | −2.328 | 0.1659 | −1.3854 | 0.1987 | −1.285 | 0.1587 | −1.409 |
| Punda maria | 0.781 | 0.276 | 0.5883 | 0.5412 | 0.0012 *** | 3.237 | 0.0002 *** | 3.7051 |
| Musina | 0.273 | 1.095 | 0.0314 ** | 2.1514 | 0.0000 *** | 4.3348 | 0.0013 *** | 3.1958 |
| Tshiombo | 0.919 | 0.100 | 0.4577 | 0.7425 | 0.0032 *** | 2.9465 | 0.0017 *** | 3.1218 |
| Settlers | 0.008 *** | 2.643 | 0.006 *** | 2.7065 | 0.0000 *** | 4.3958 | 0.0000 *** | 4.2781 |
| Zebediela | 0.069 * | 1.815 | 0.0212 ** | 2.3044 | 0.0000 *** | 4.5321 | 0.0001 *** | 3.7397 |
| Bavaria | 0.762 | −0.302 | 0.8012 | 0.2518 | 0.0991 * | 1.649 | 0.04517 ** | 2.0031 |
| Lephalale | 0.488 | 0.692 | 0.0717 * | 1.8006 | 0.0000 *** | 4.5079 | 0.0002 *** | 3.6749 |
Disclaimer/Publisher’s Note: The statements, opinions and data contained in all publications are solely those of the individual author(s) and contributor(s) and not of MDPI and/or the editor(s). MDPI and/or the editor(s) disclaim responsibility for any injury to people or property resulting from any ideas, methods, instructions or products referred to in the content. |
© 2023 by the authors. Licensee MDPI, Basel, Switzerland. This article is an open access article distributed under the terms and conditions of the Creative Commons Attribution (CC BY) license (https://creativecommons.org/licenses/by/4.0/).
Share and Cite
Maluleke, P.; Moeletsi, M.E.; Tsubo, M. Analysis of Climate Variability and Its Implications on Rangelands in the Limpopo Province. Climate 2024, 12, 2. https://doi.org/10.3390/cli12010002
Maluleke P, Moeletsi ME, Tsubo M. Analysis of Climate Variability and Its Implications on Rangelands in the Limpopo Province. Climate. 2024; 12(1):2. https://doi.org/10.3390/cli12010002
Chicago/Turabian StyleMaluleke, Phumzile, Mokhele E. Moeletsi, and Mitsuru Tsubo. 2024. "Analysis of Climate Variability and Its Implications on Rangelands in the Limpopo Province" Climate 12, no. 1: 2. https://doi.org/10.3390/cli12010002
APA StyleMaluleke, P., Moeletsi, M. E., & Tsubo, M. (2024). Analysis of Climate Variability and Its Implications on Rangelands in the Limpopo Province. Climate, 12(1), 2. https://doi.org/10.3390/cli12010002