
Development of Inherent Vulnerability Index within Jammu Municipal Limits, India


 , ,
, ,  ,
,  ,
,  and
and 
Abstract
1. Introduction
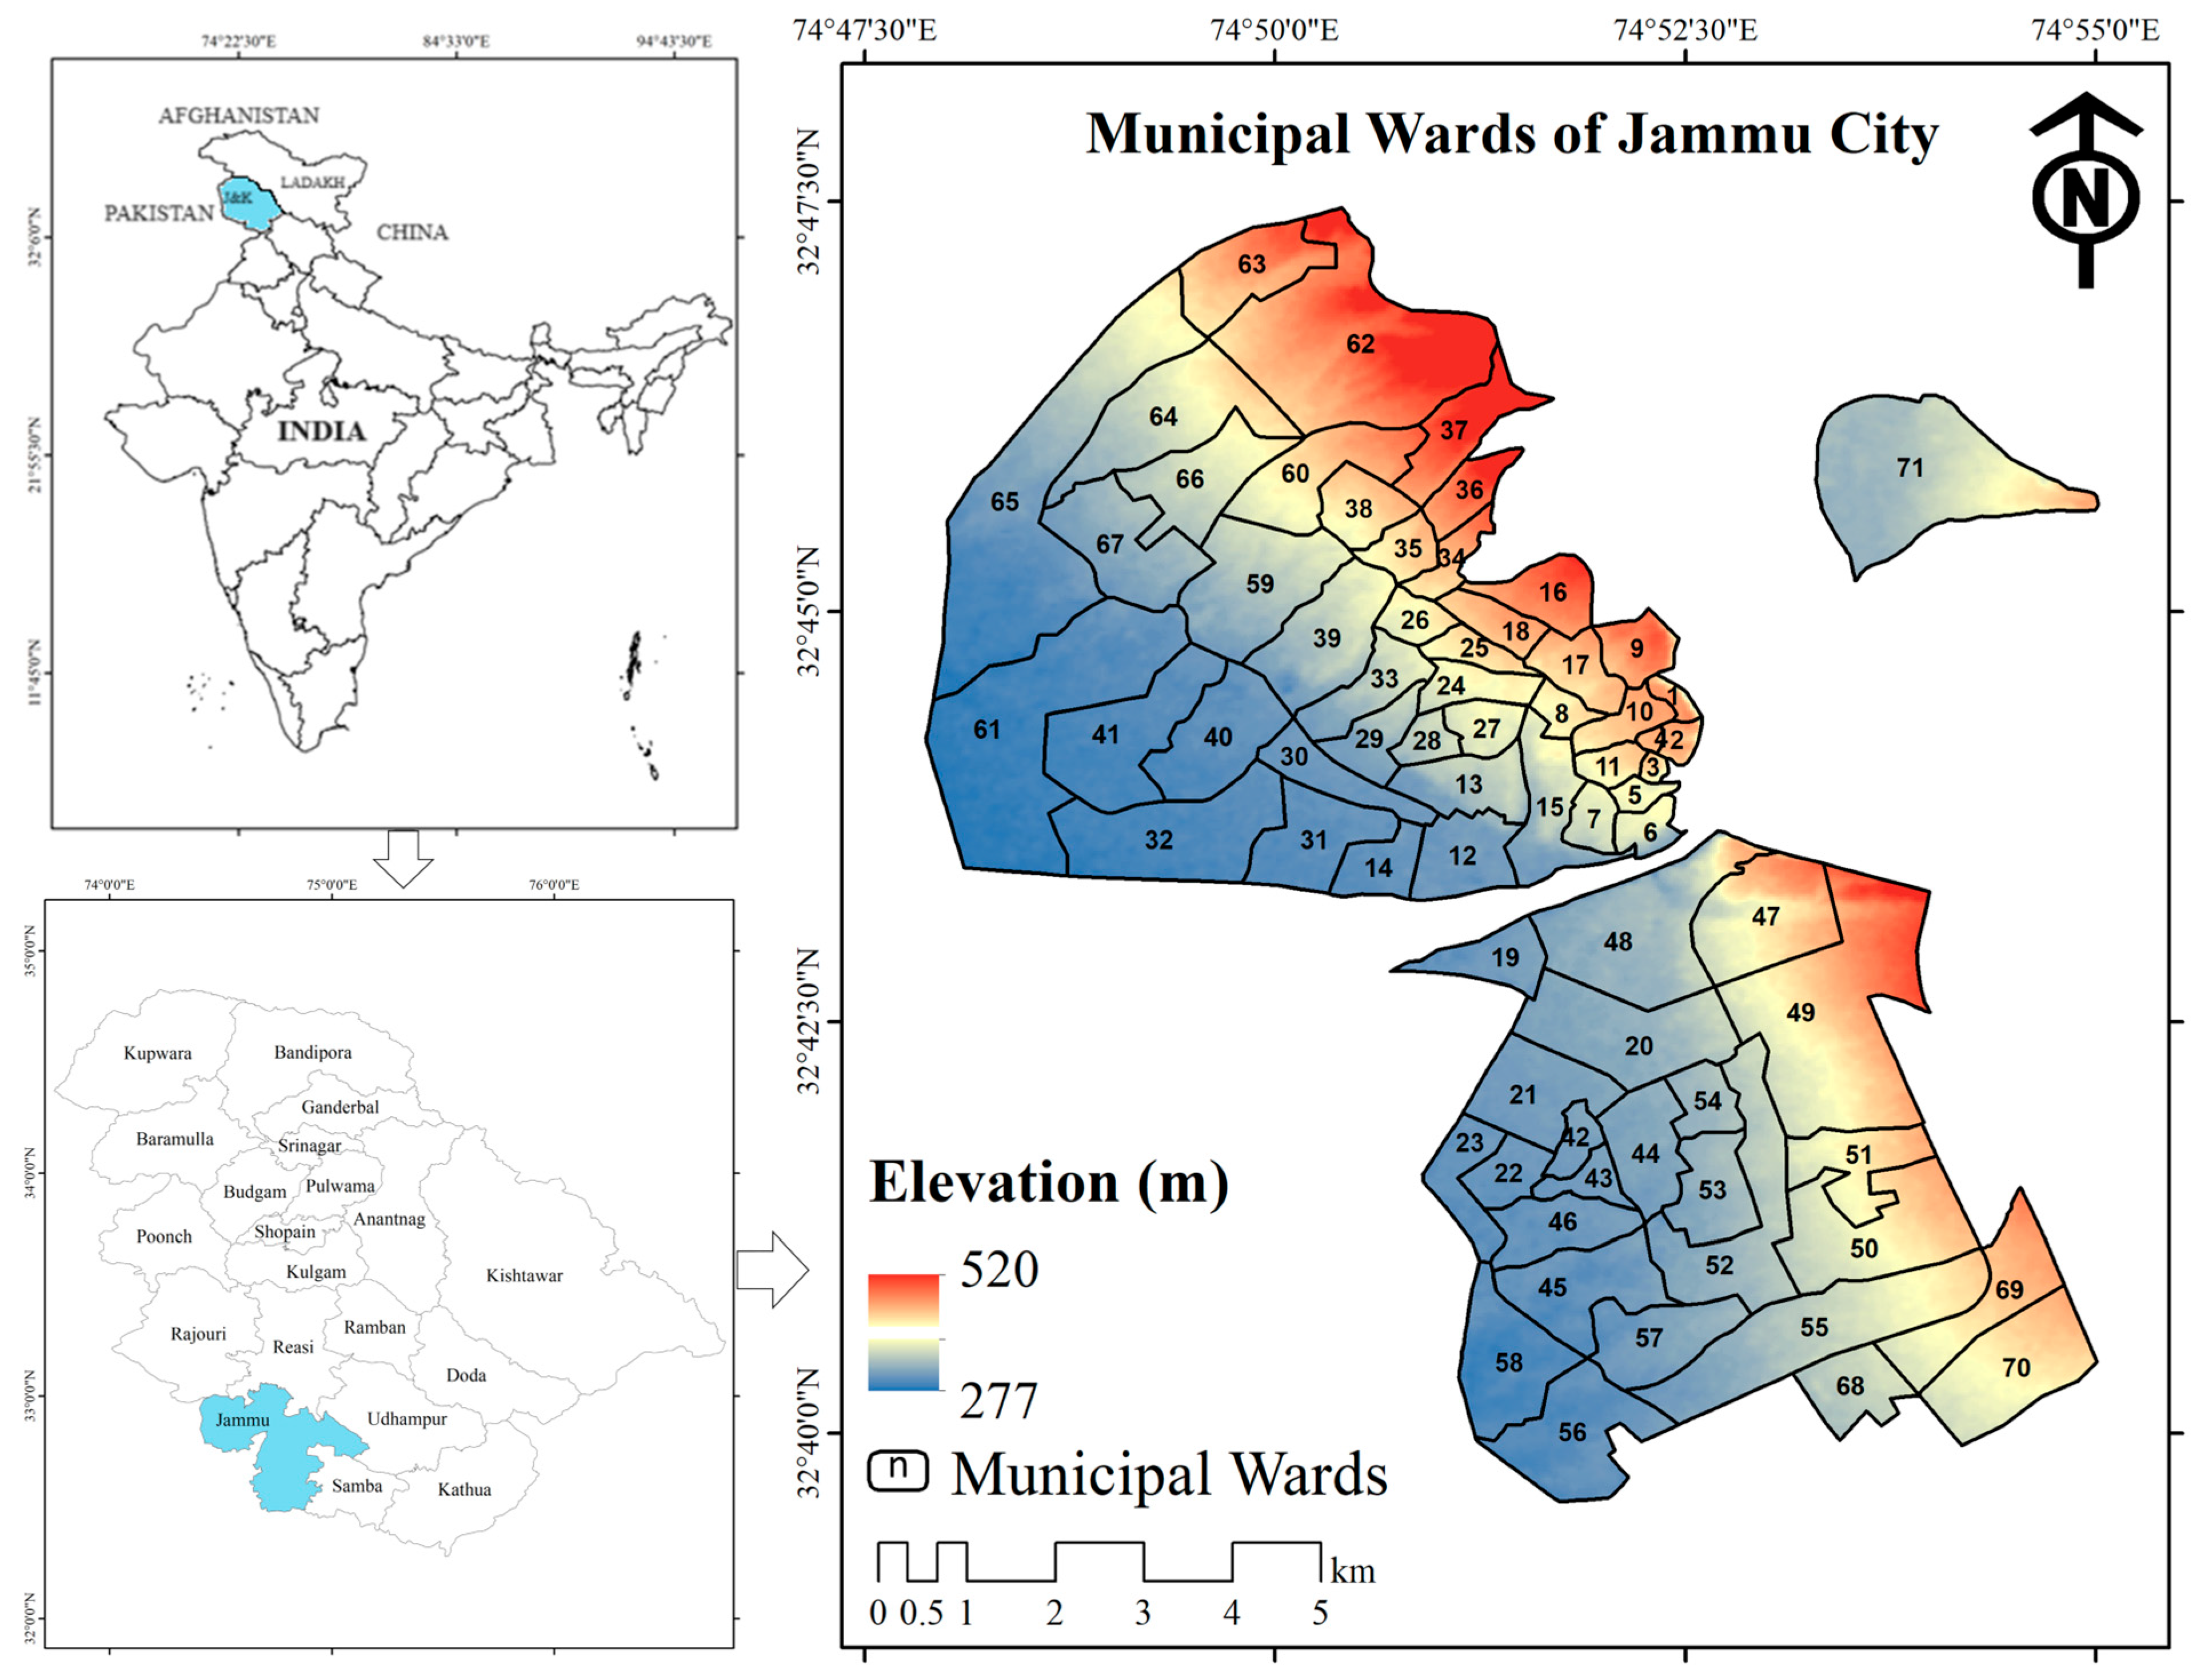
2. Study Area
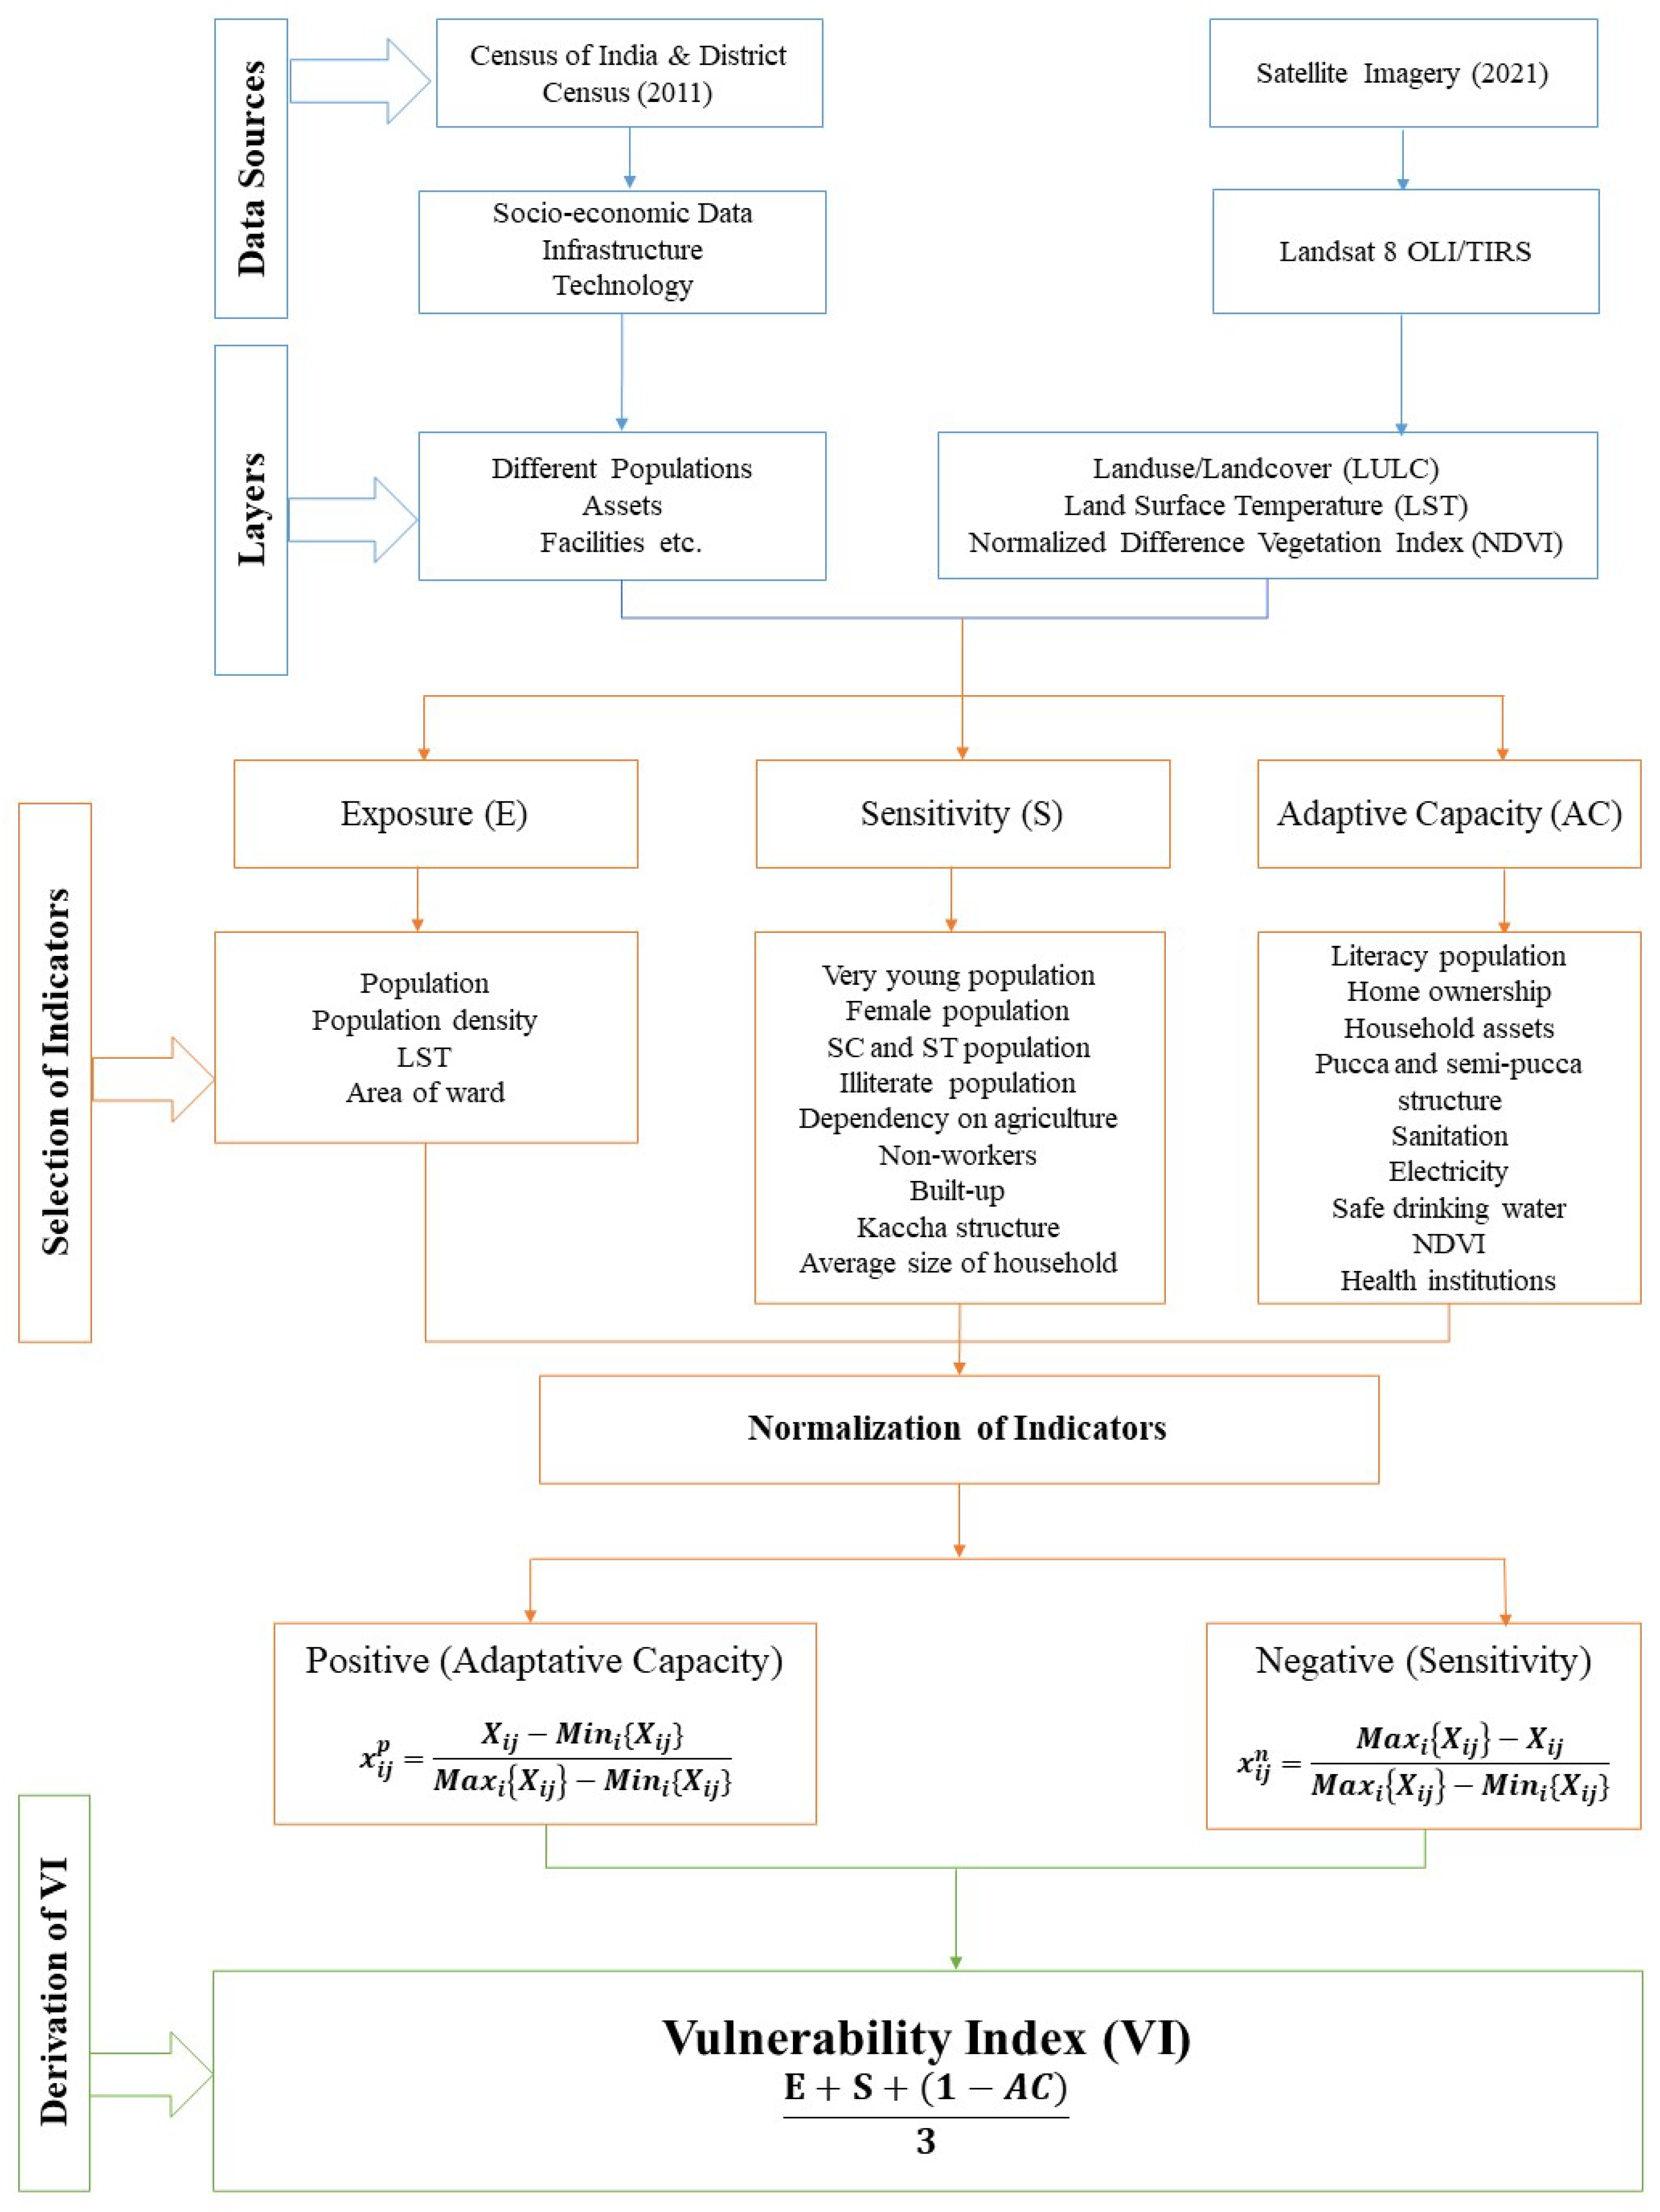
3. Materials and Methods
3.1. Materials
3.2. Methods
3.2.1. Derivation of Ecological Indicators
3.2.2. Selection of Indicators
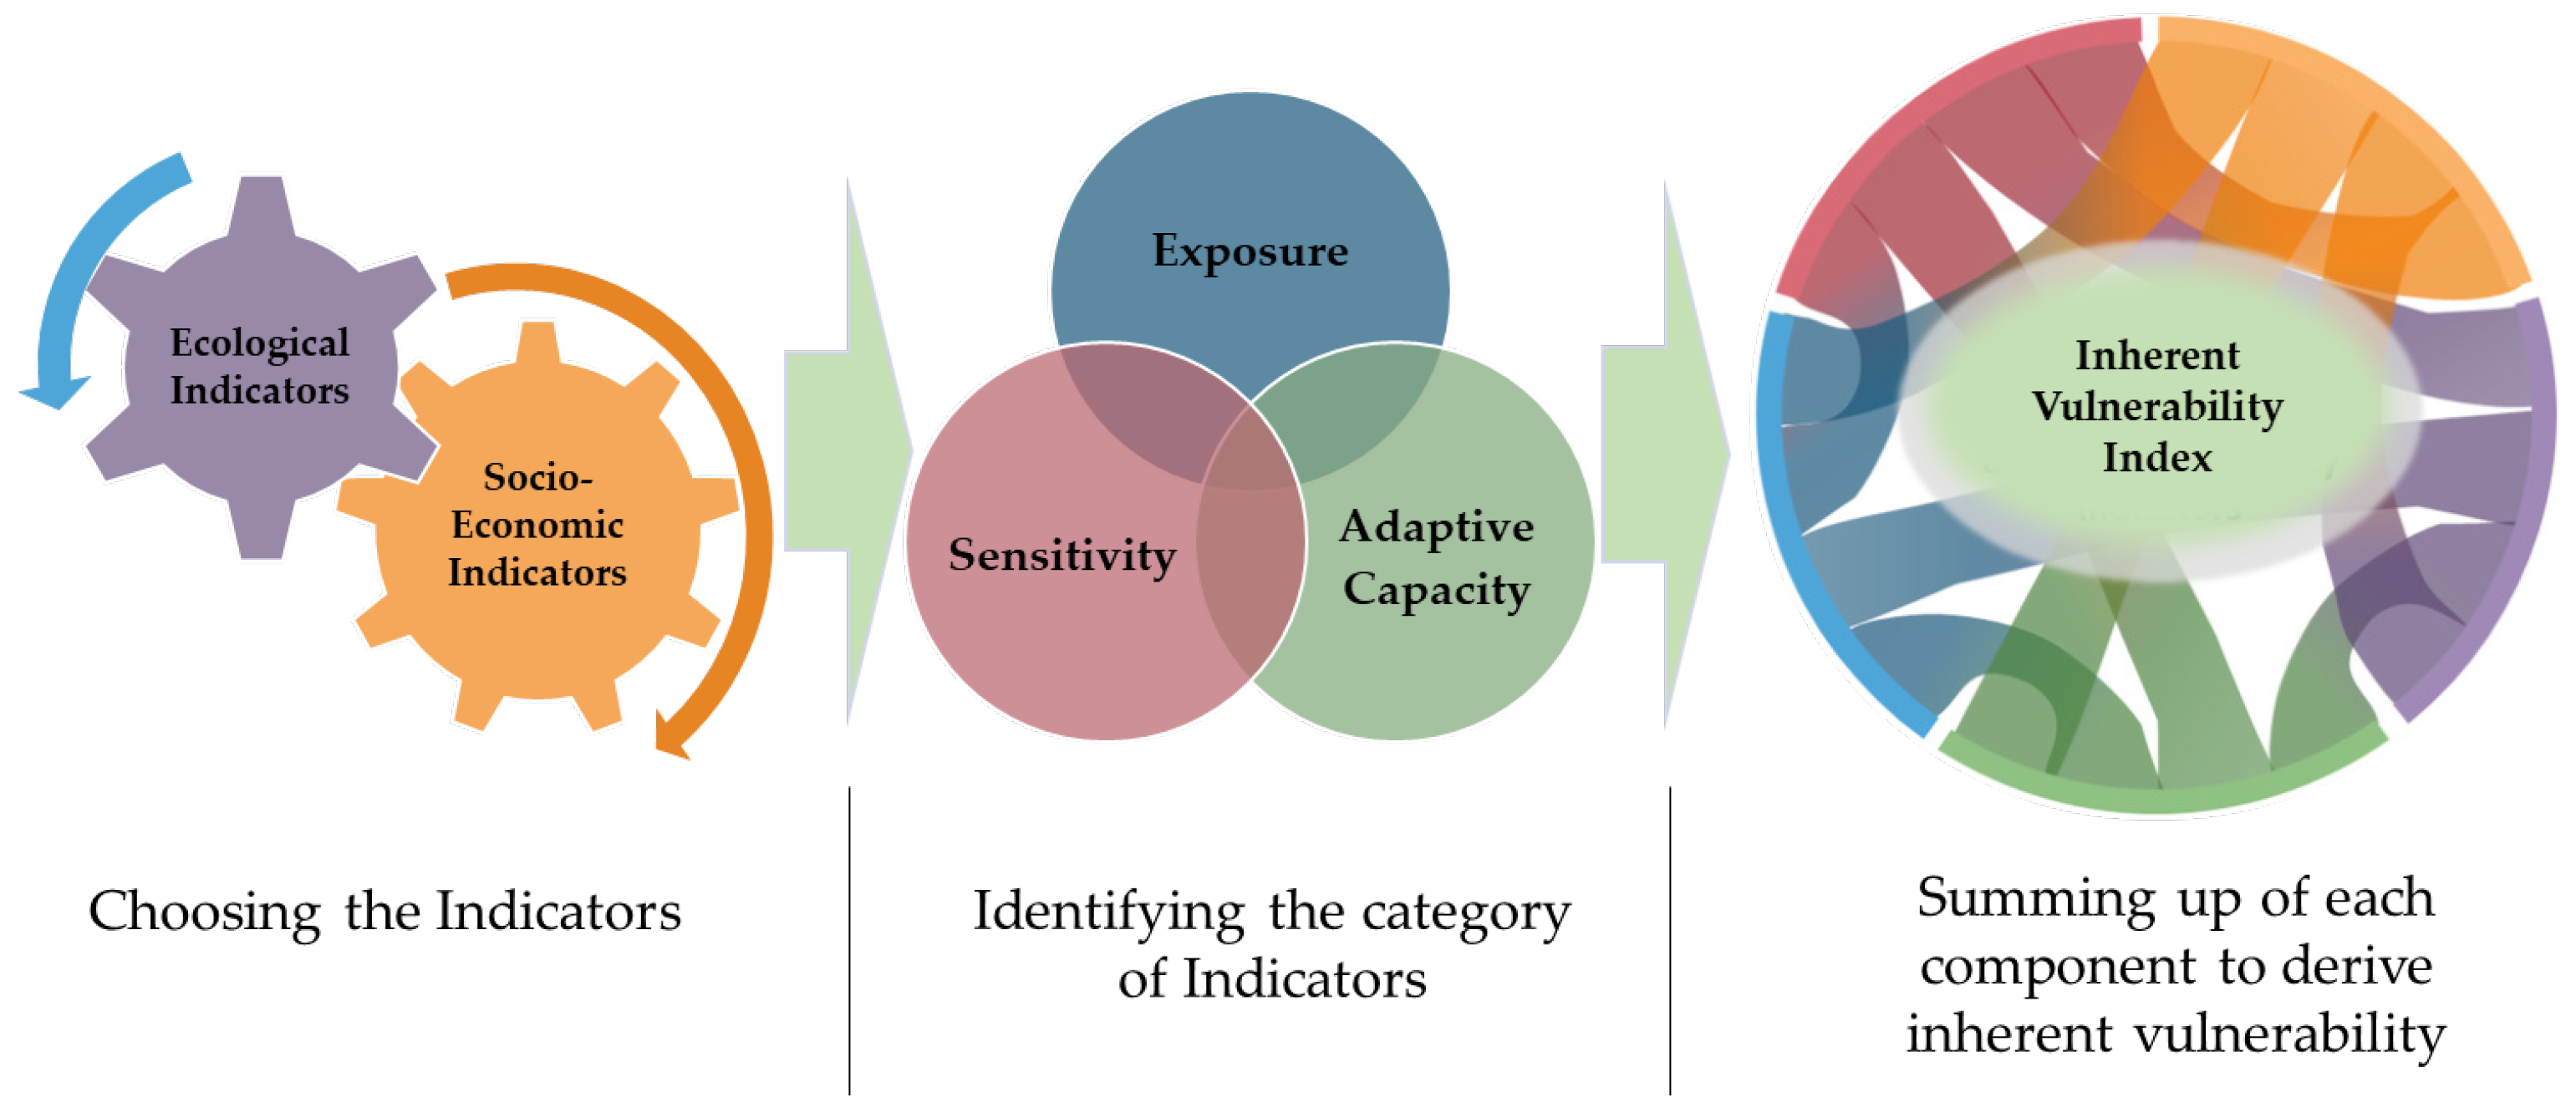
3.2.3. Calculation of the Vulnerability Index
4. Results & Discussion
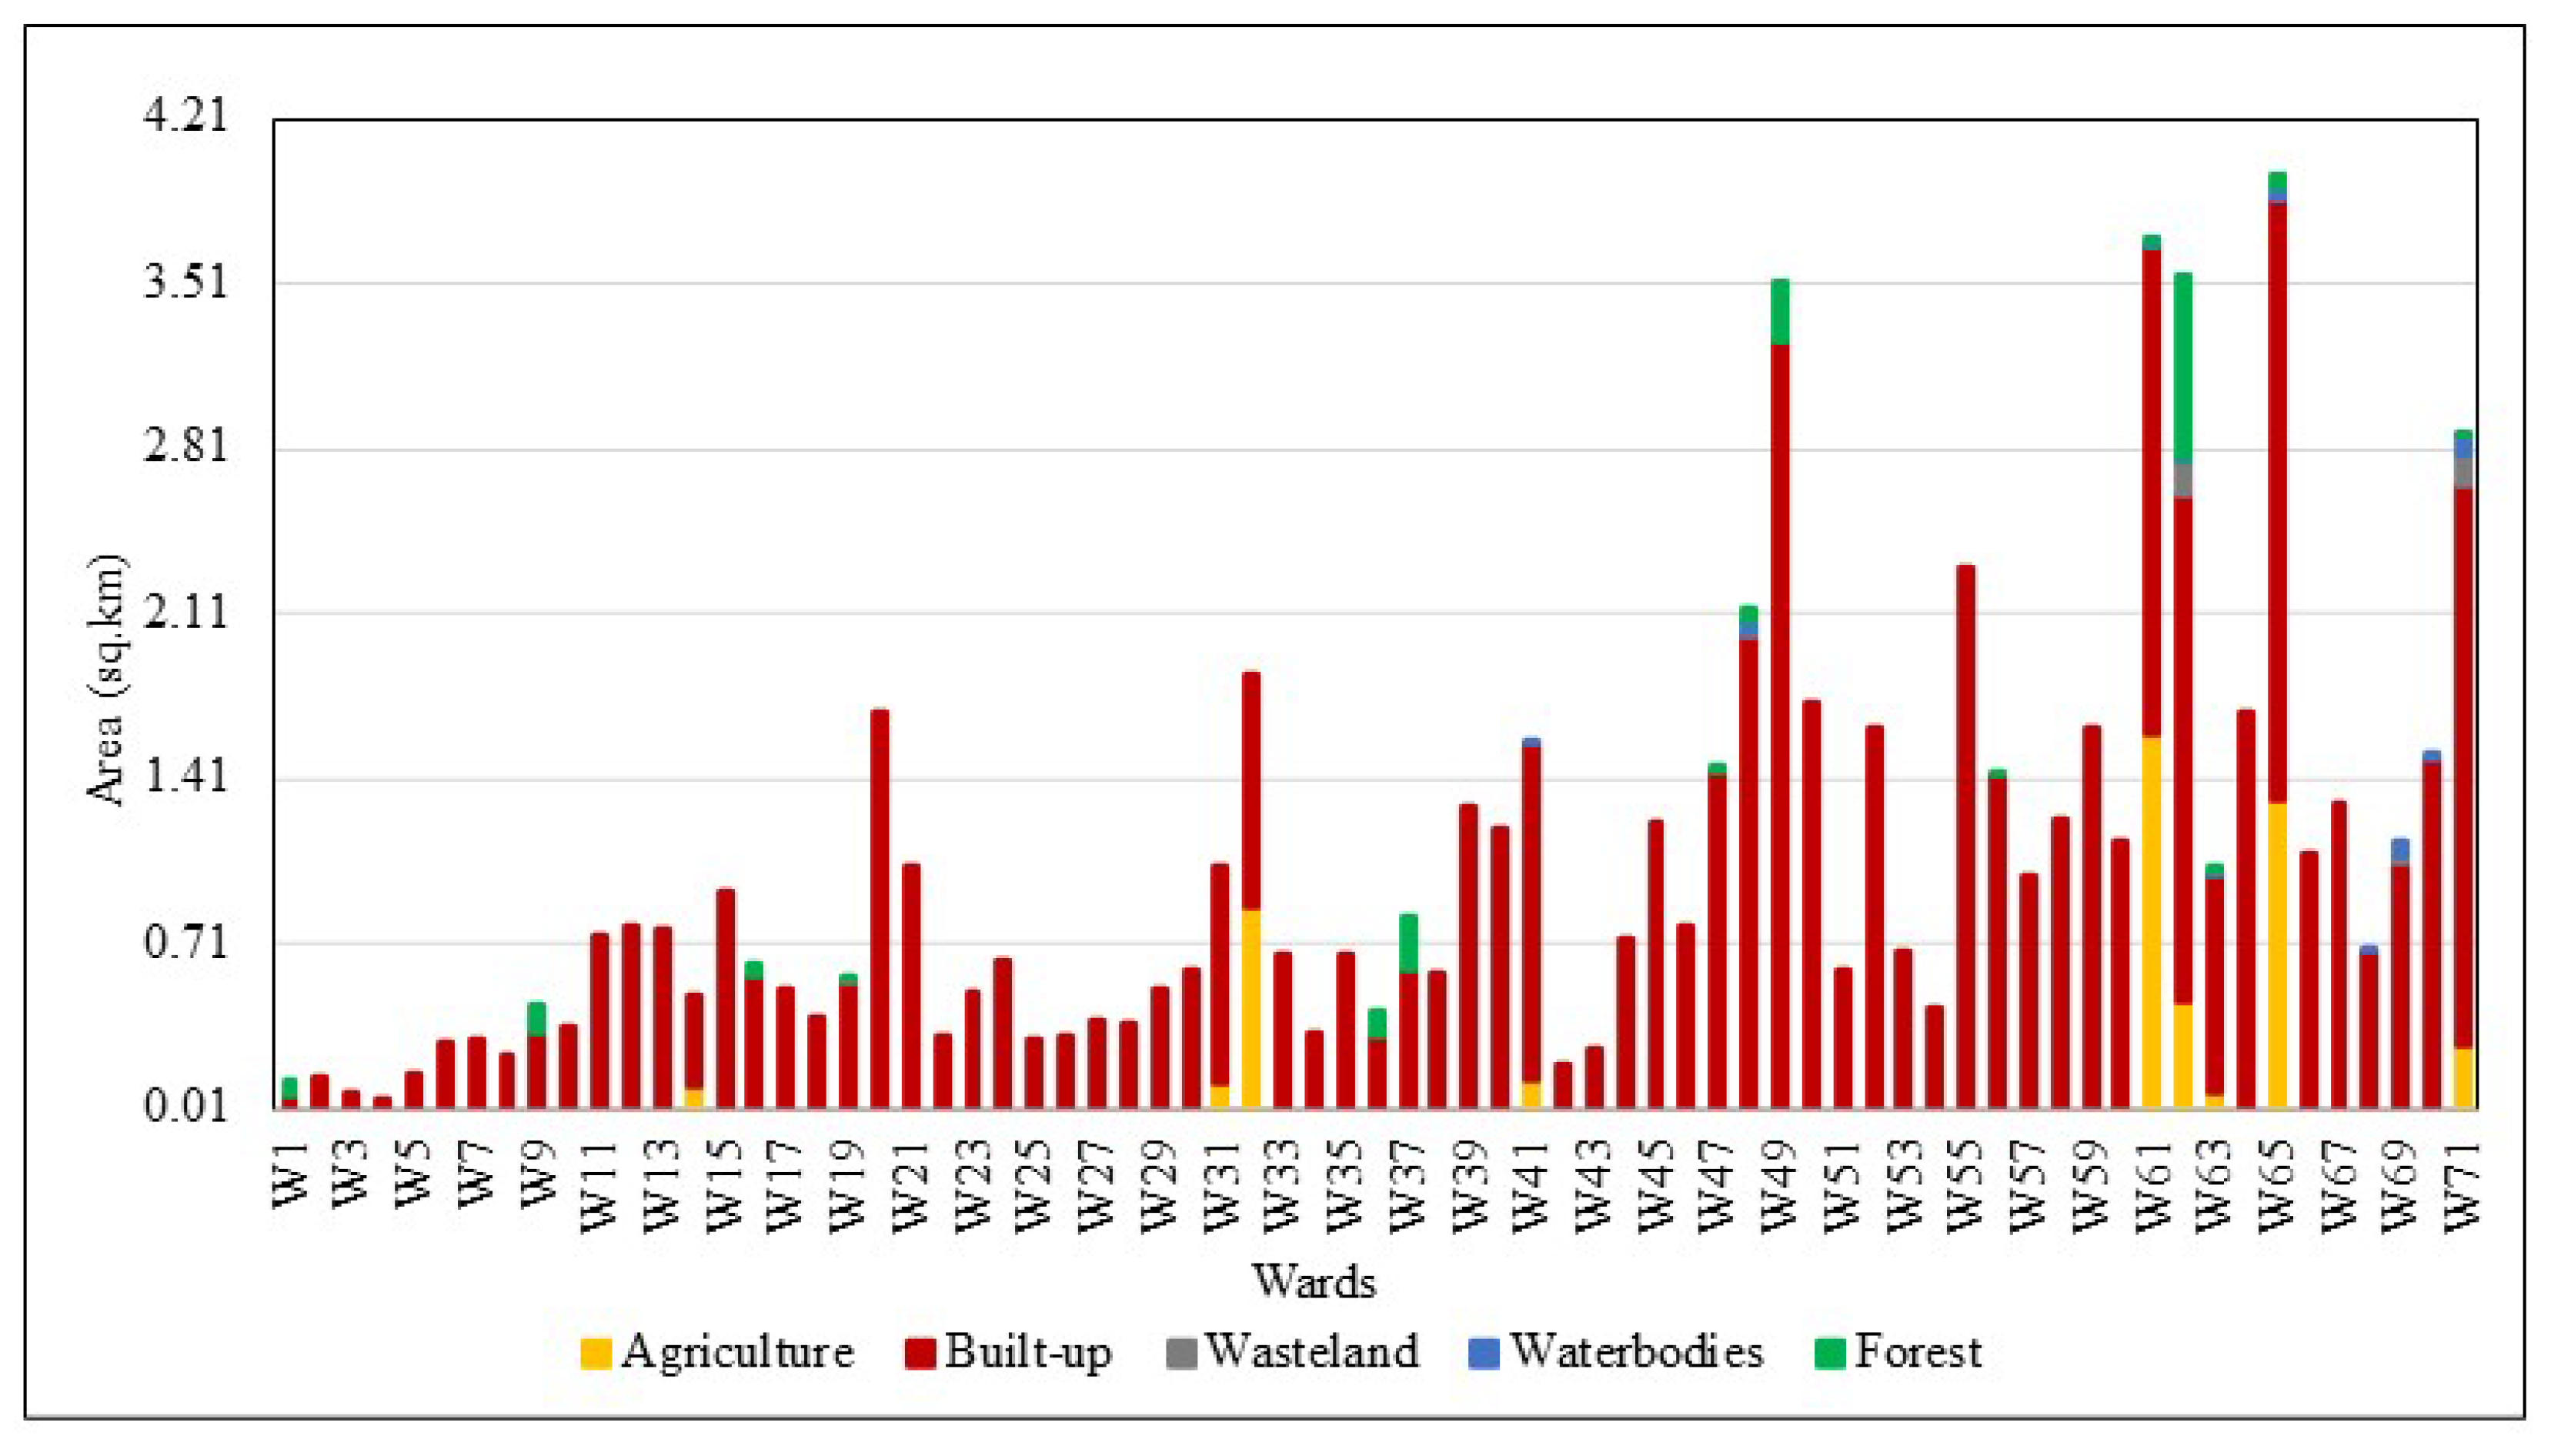
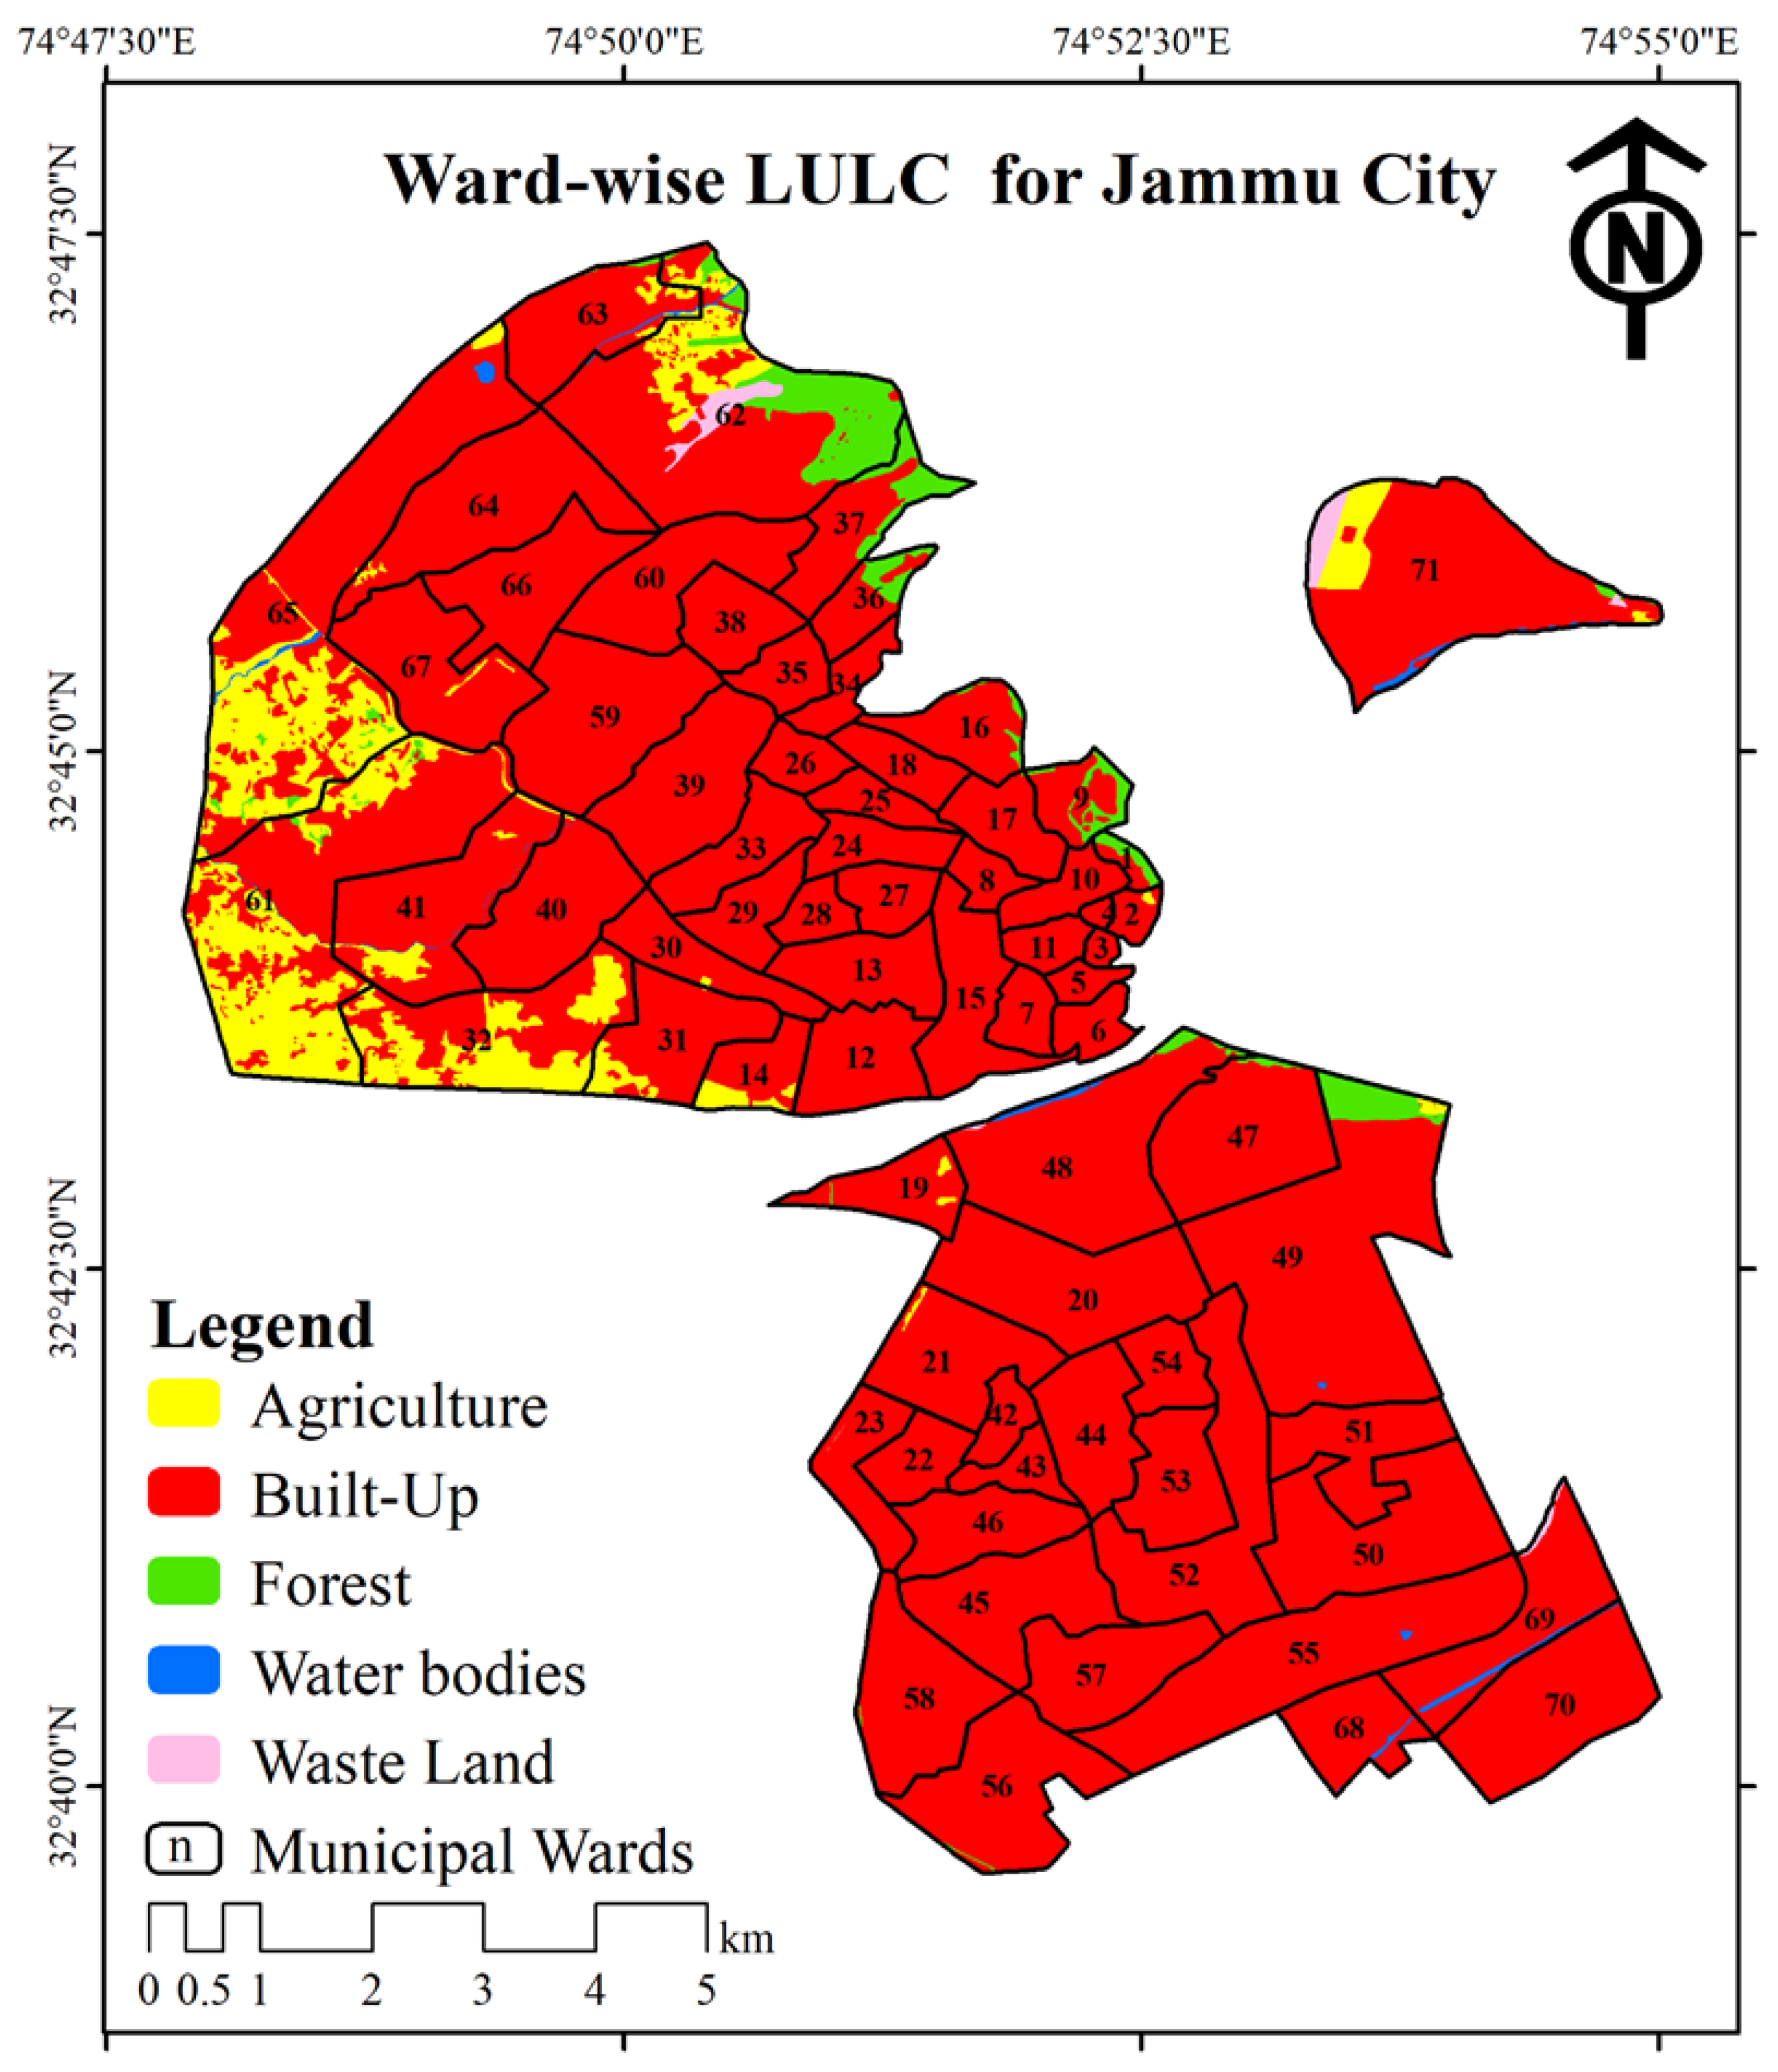
4.1. Land Use and Land Cover (LULC)
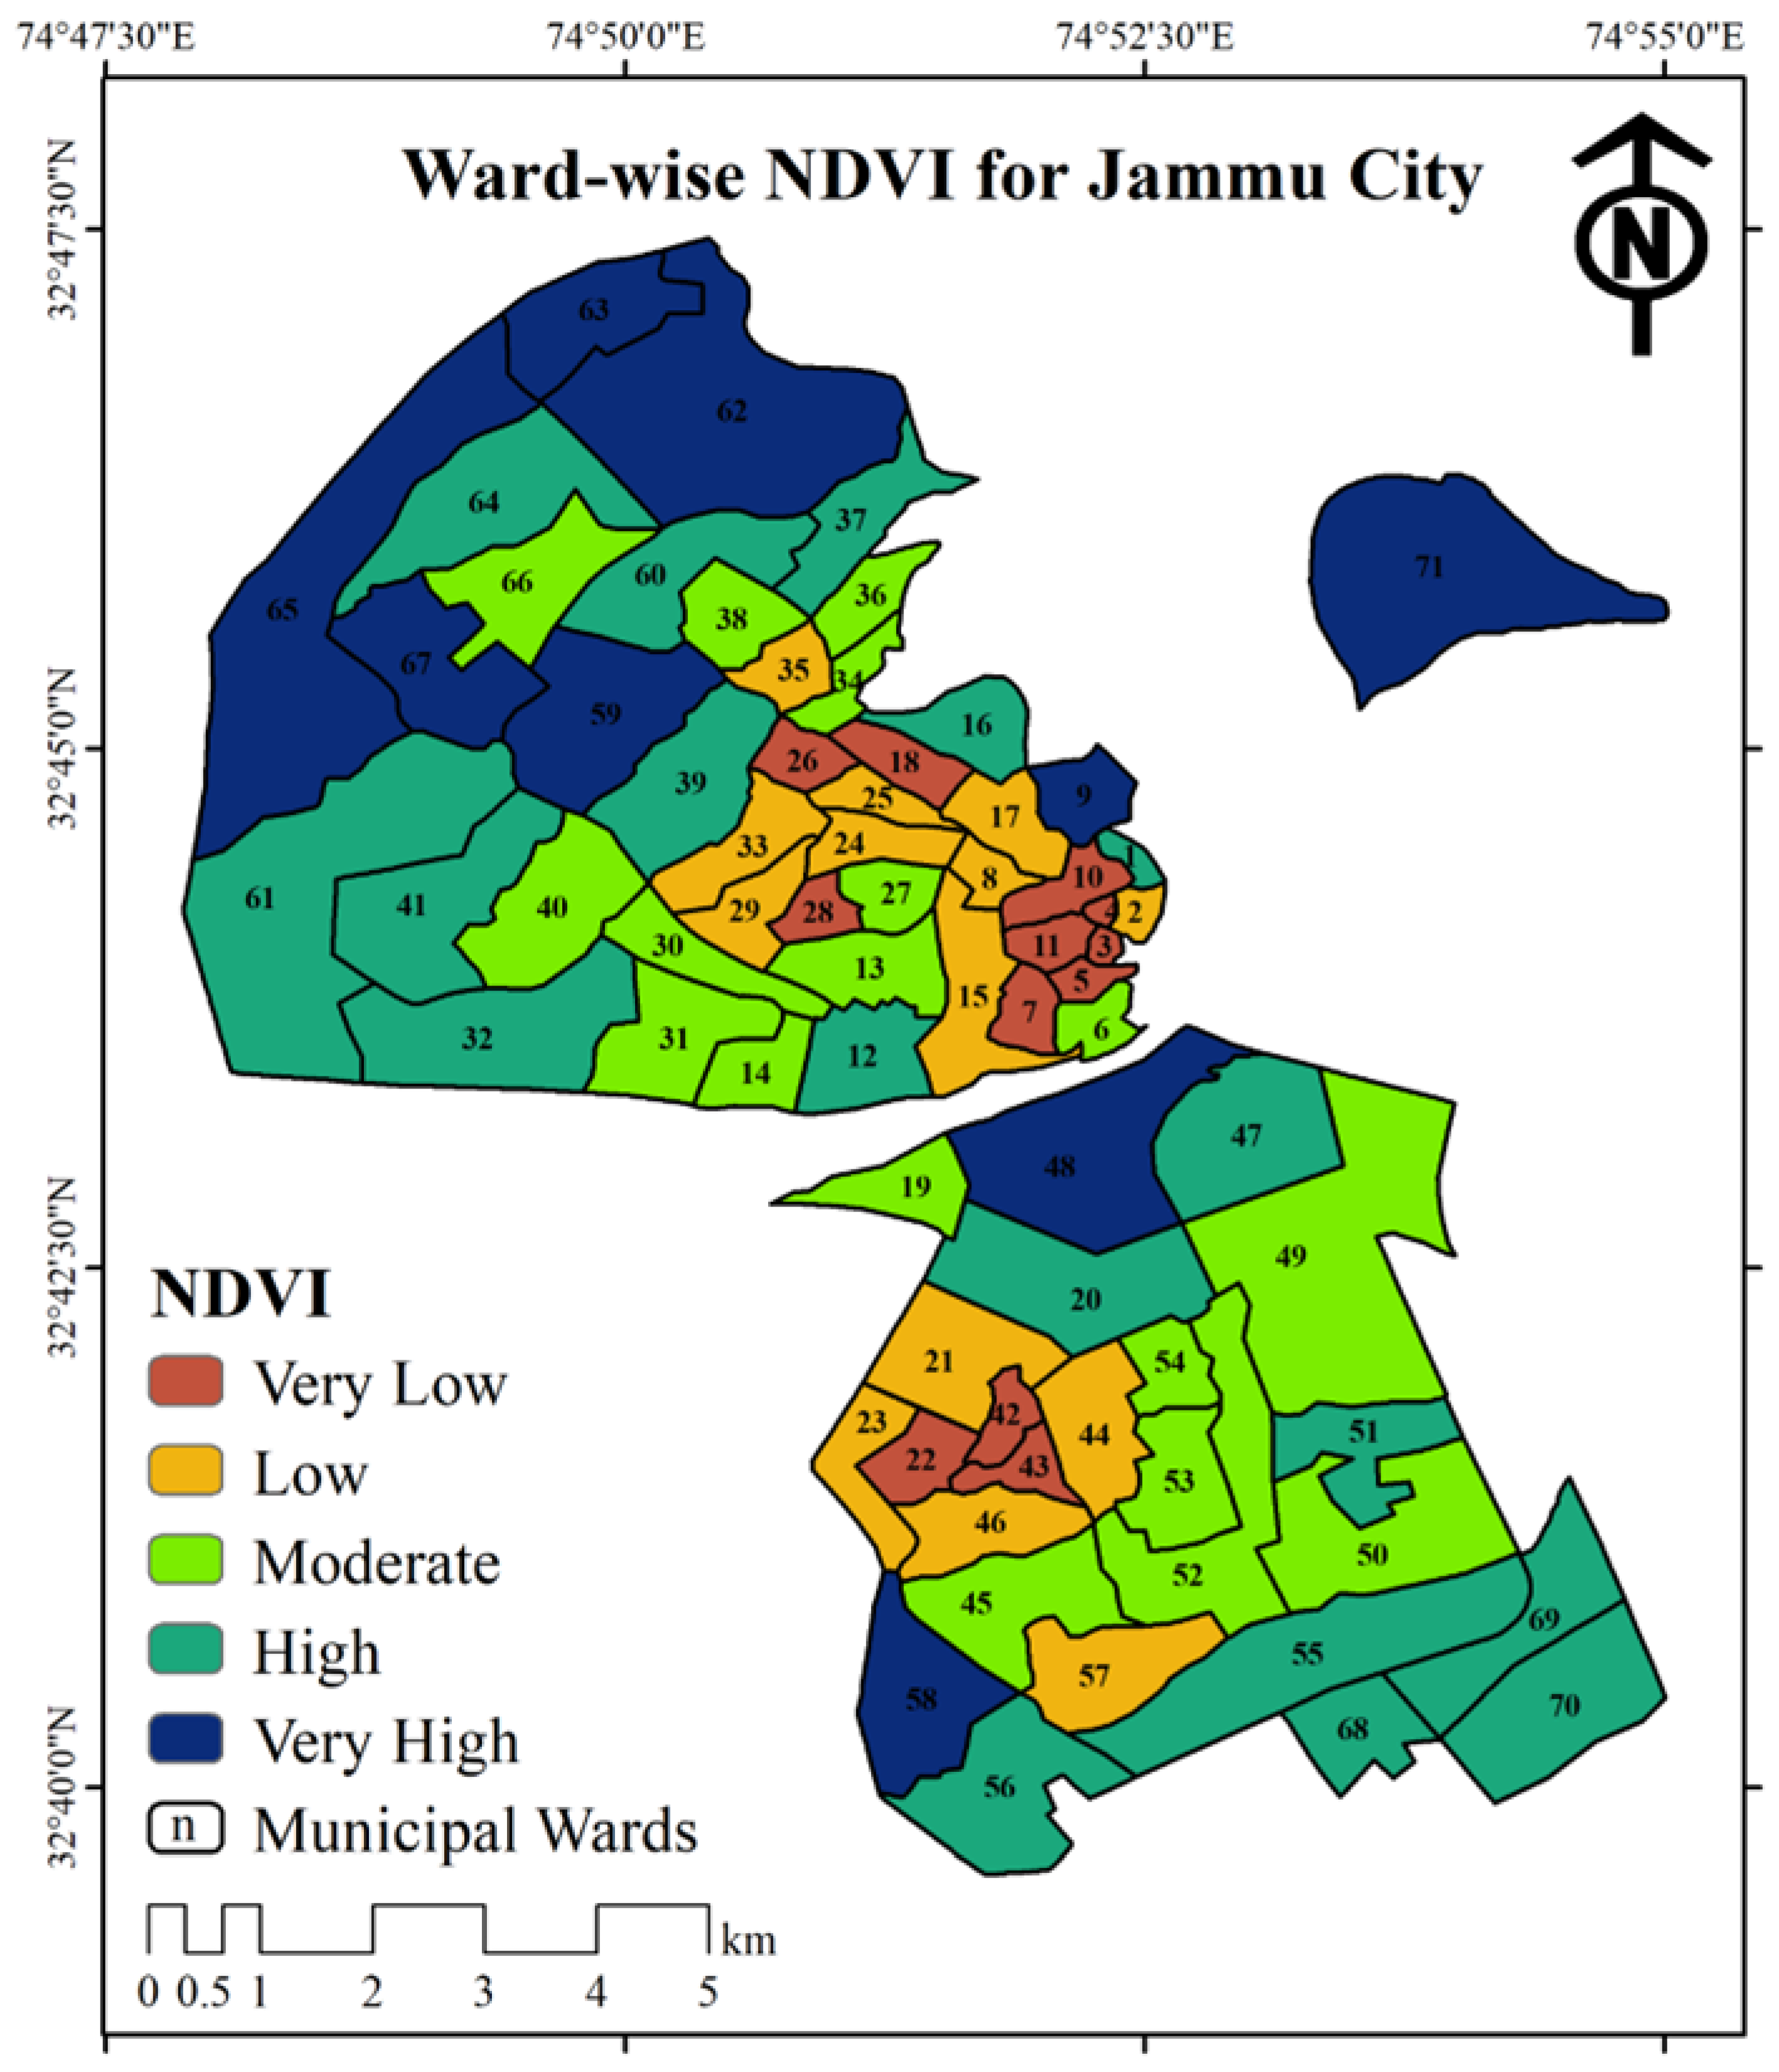
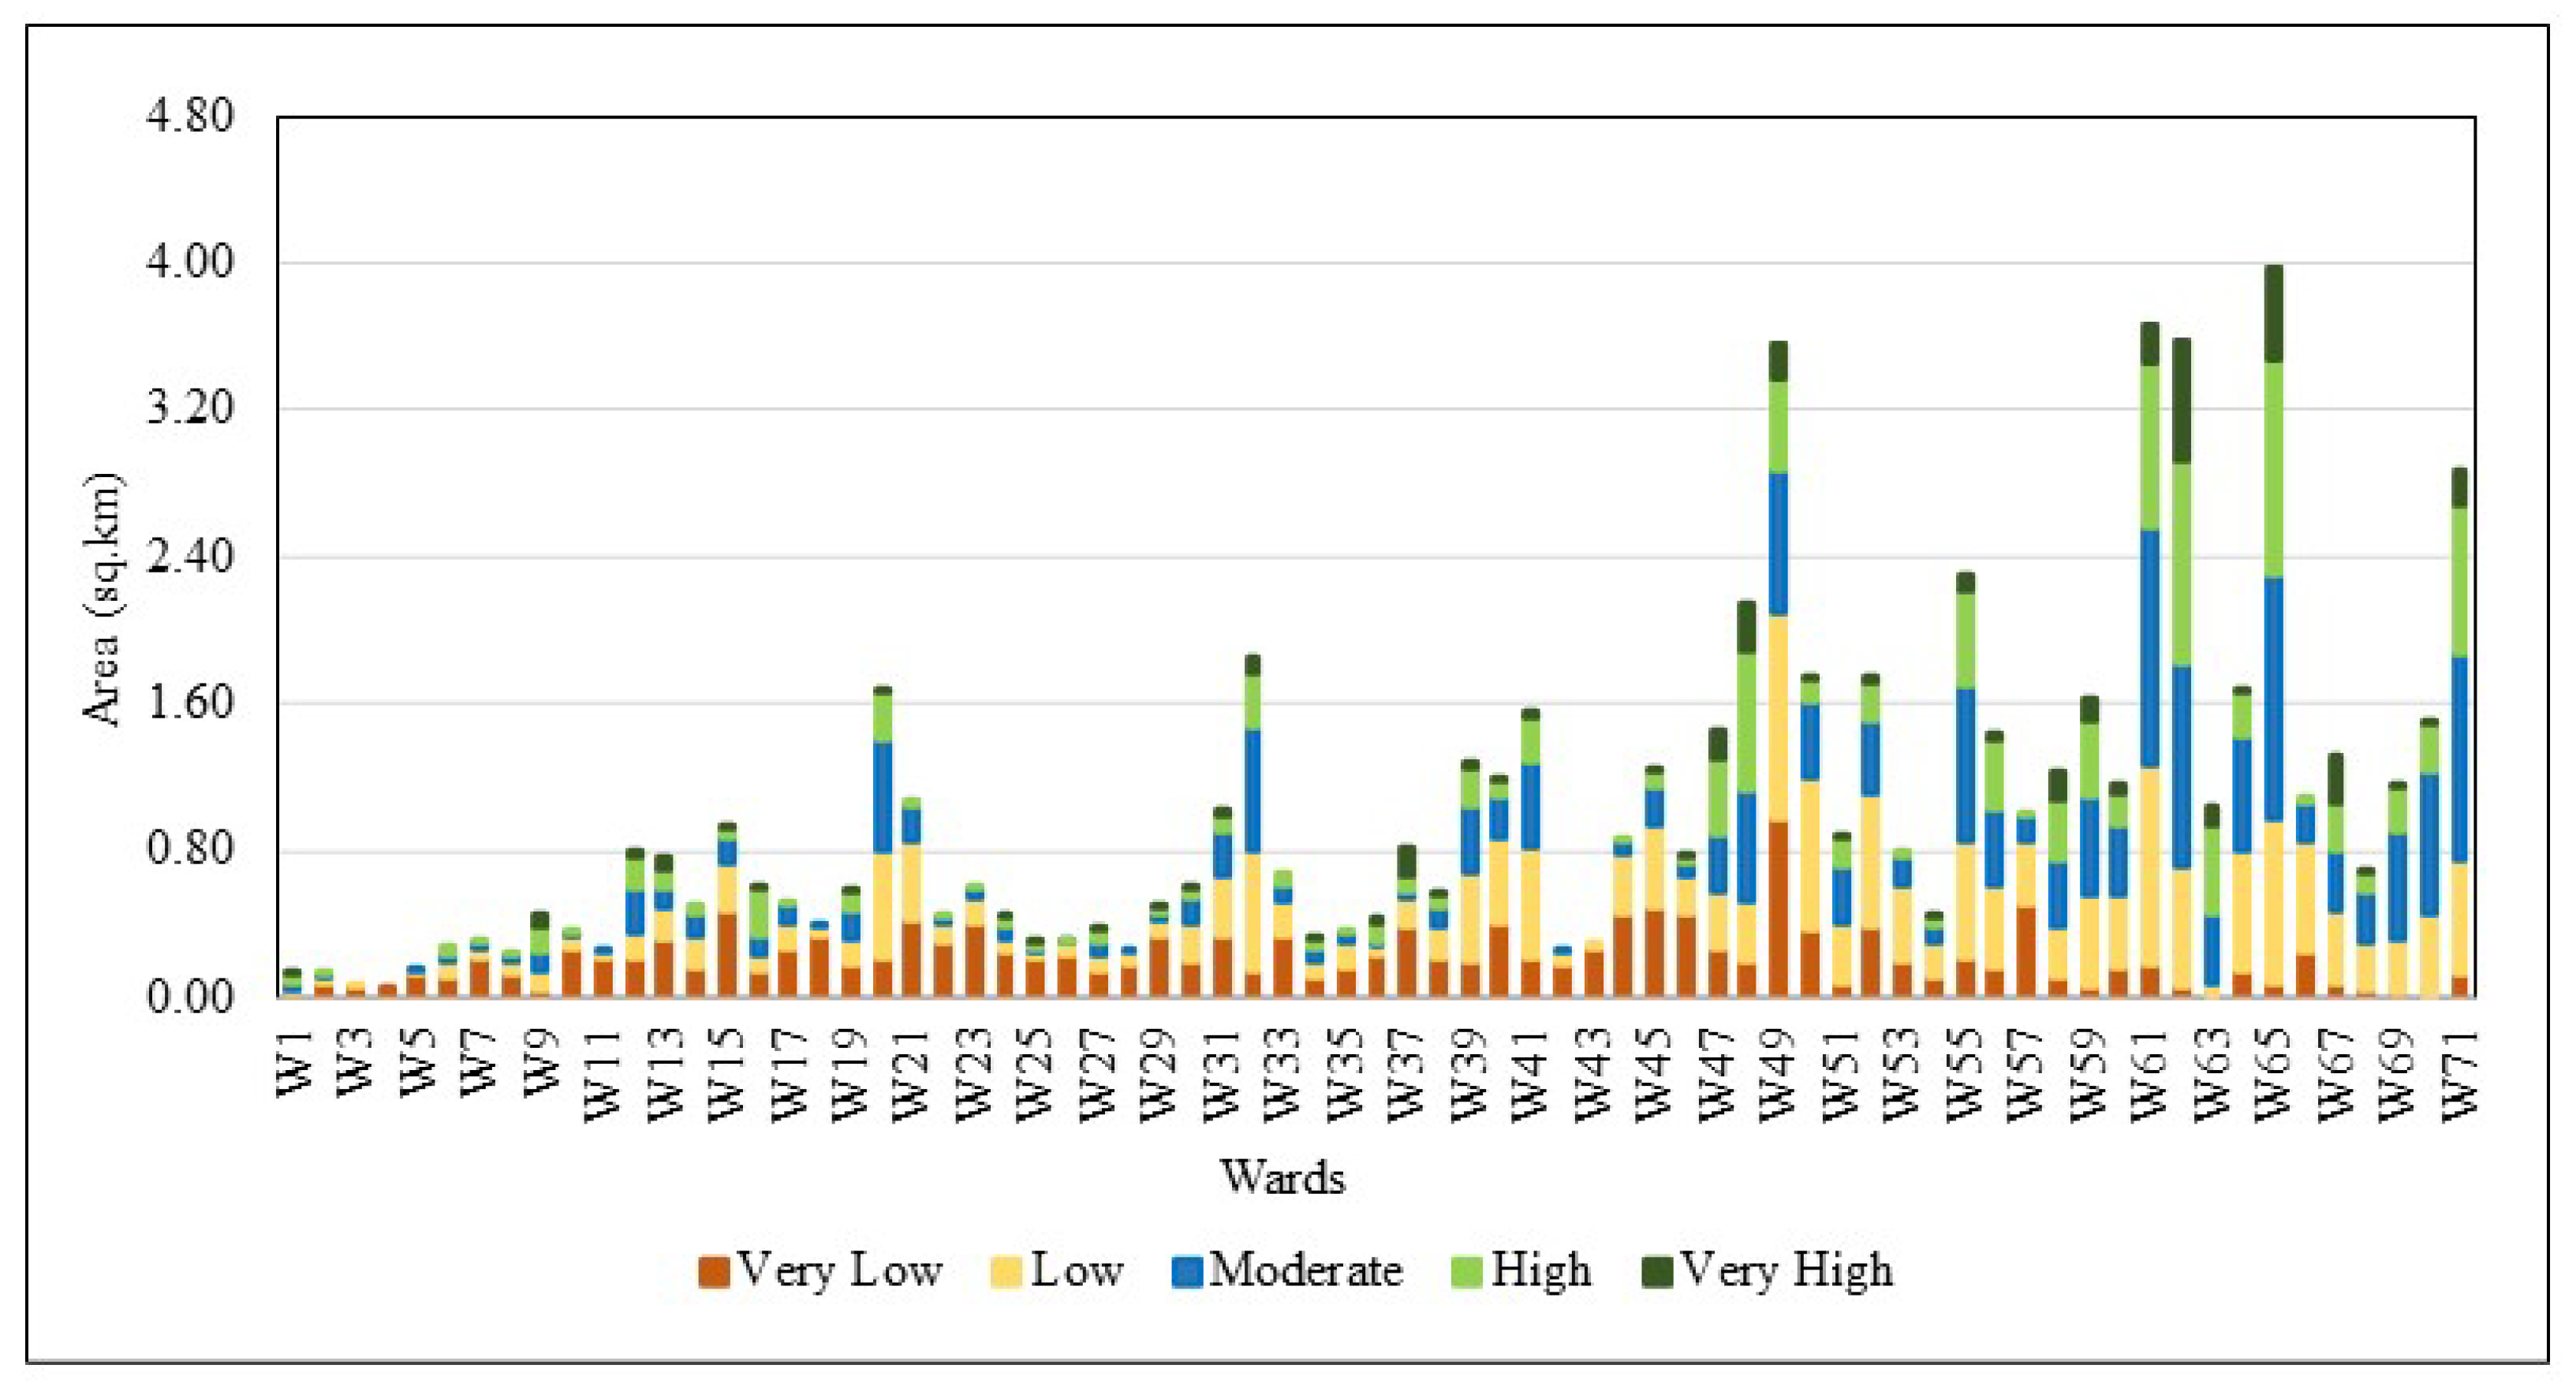
4.2. Normalized Difference Vegetation Index (NDVI)
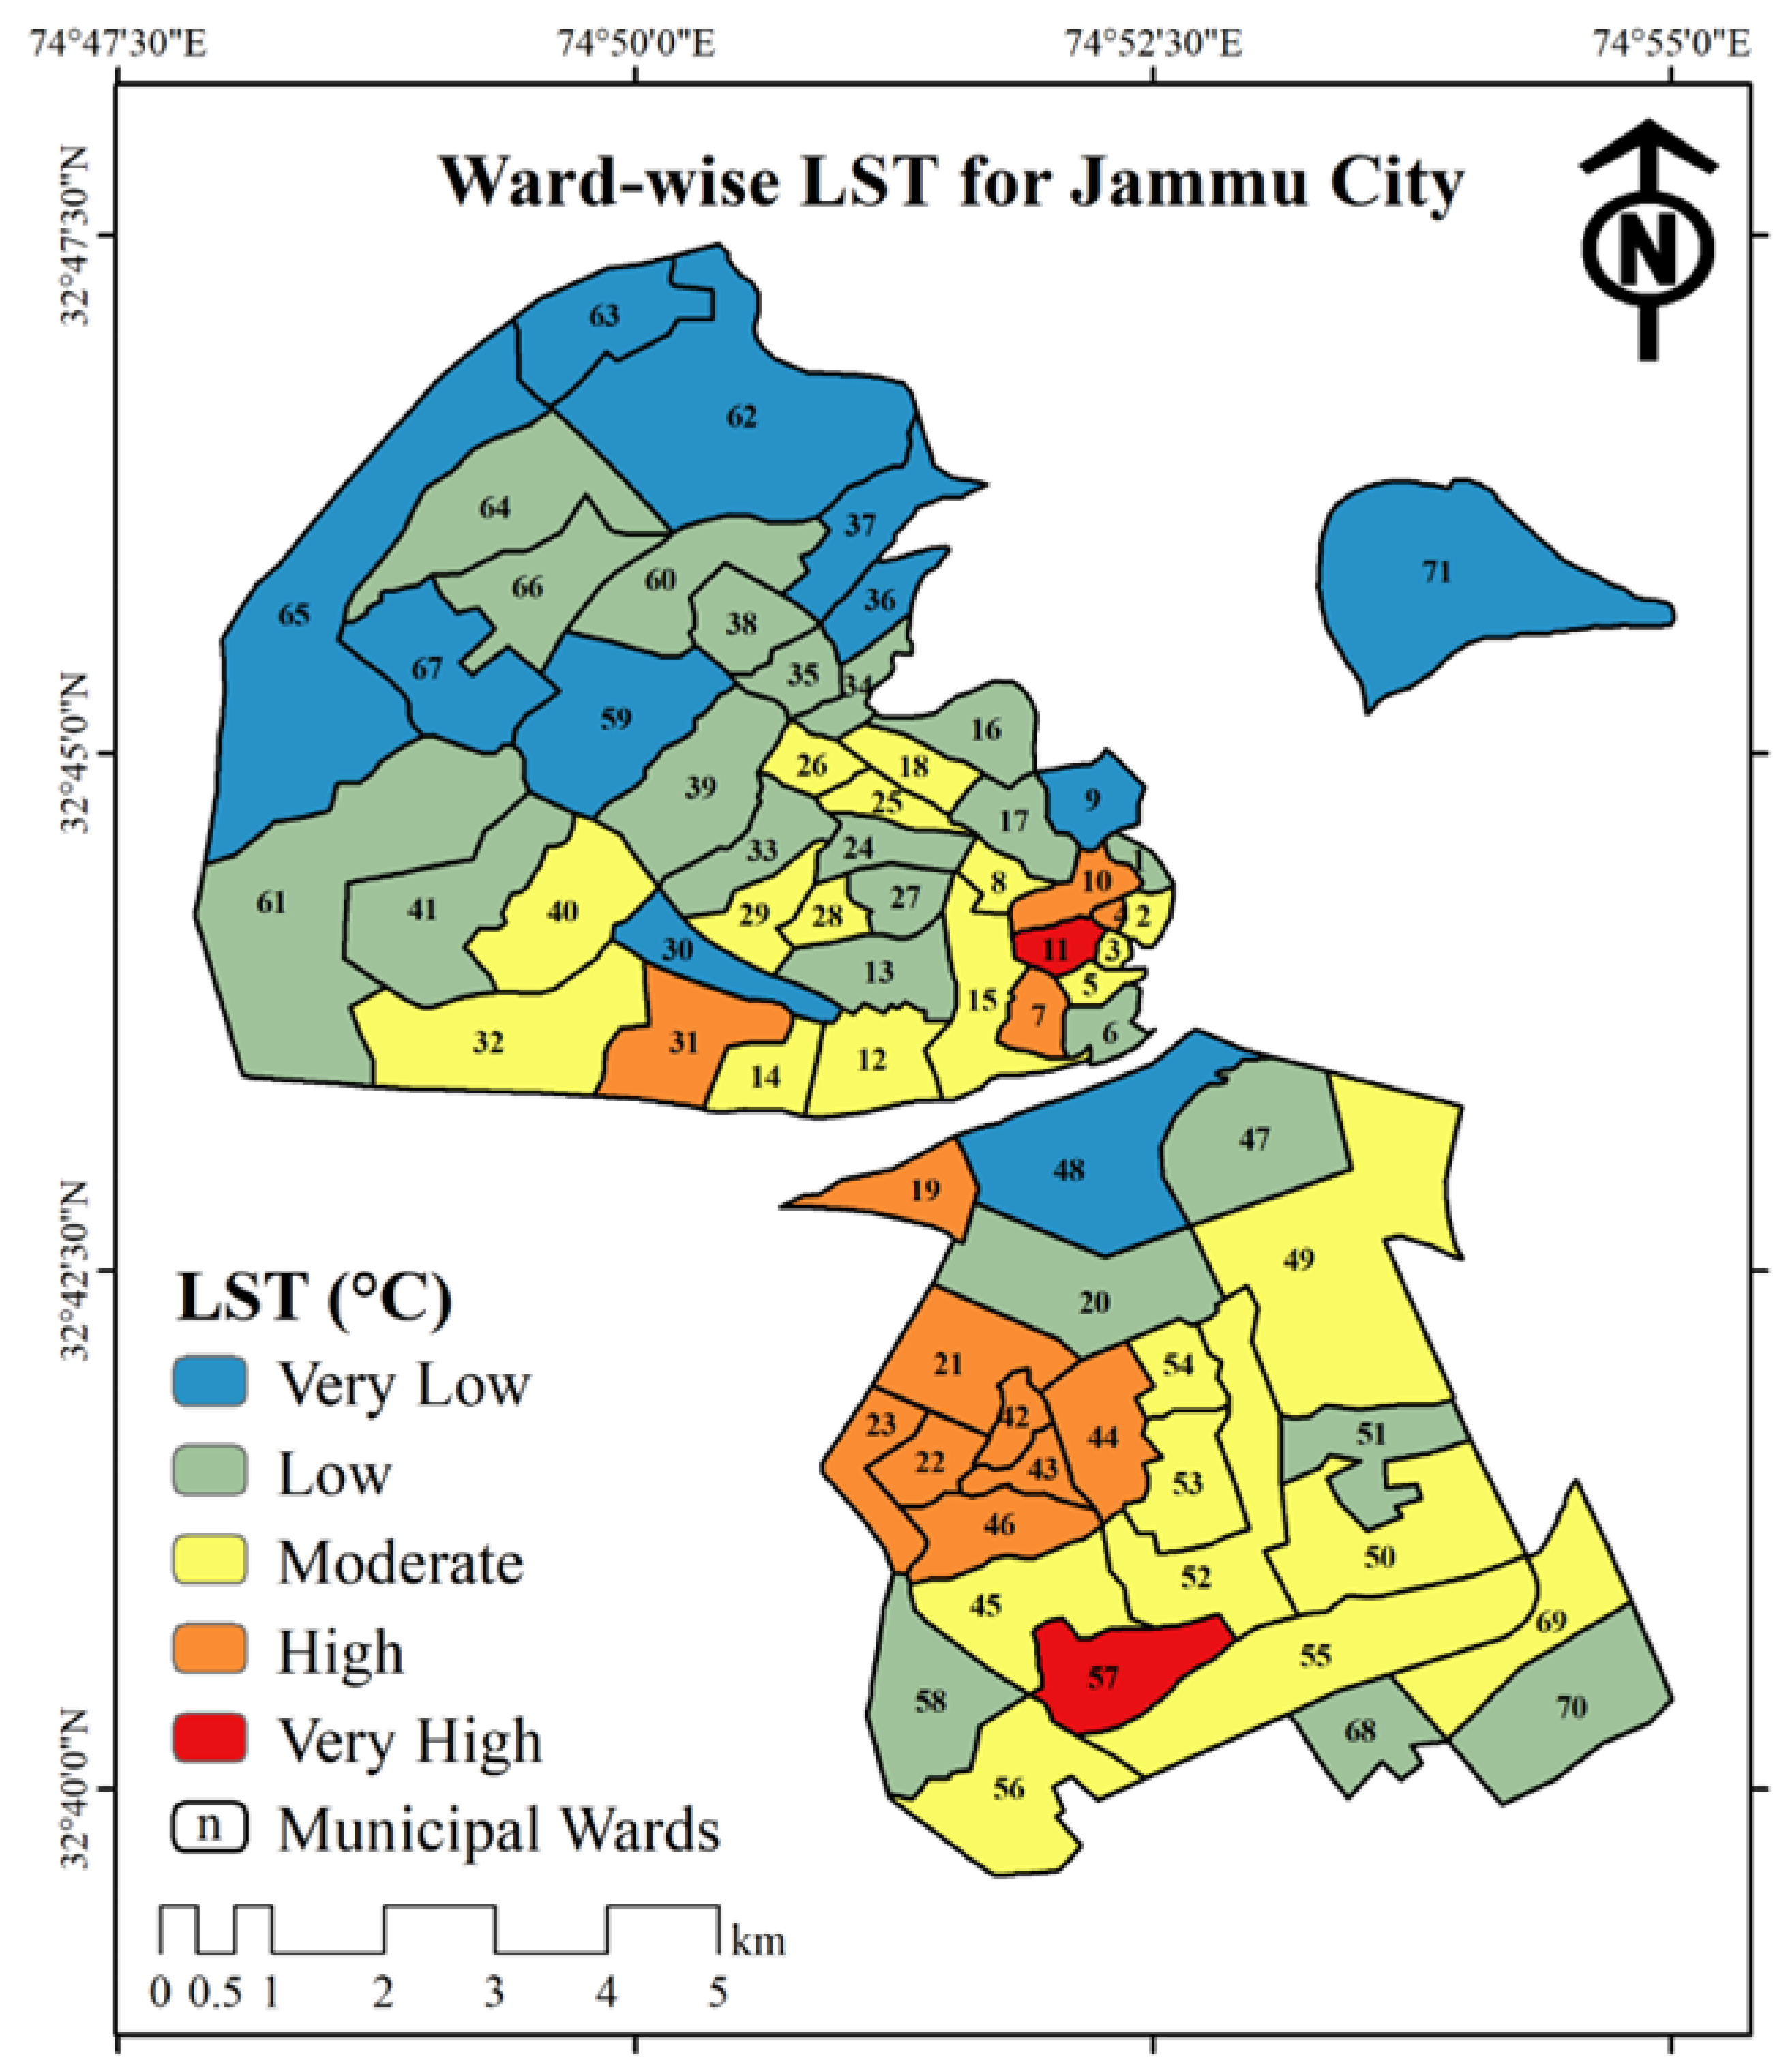
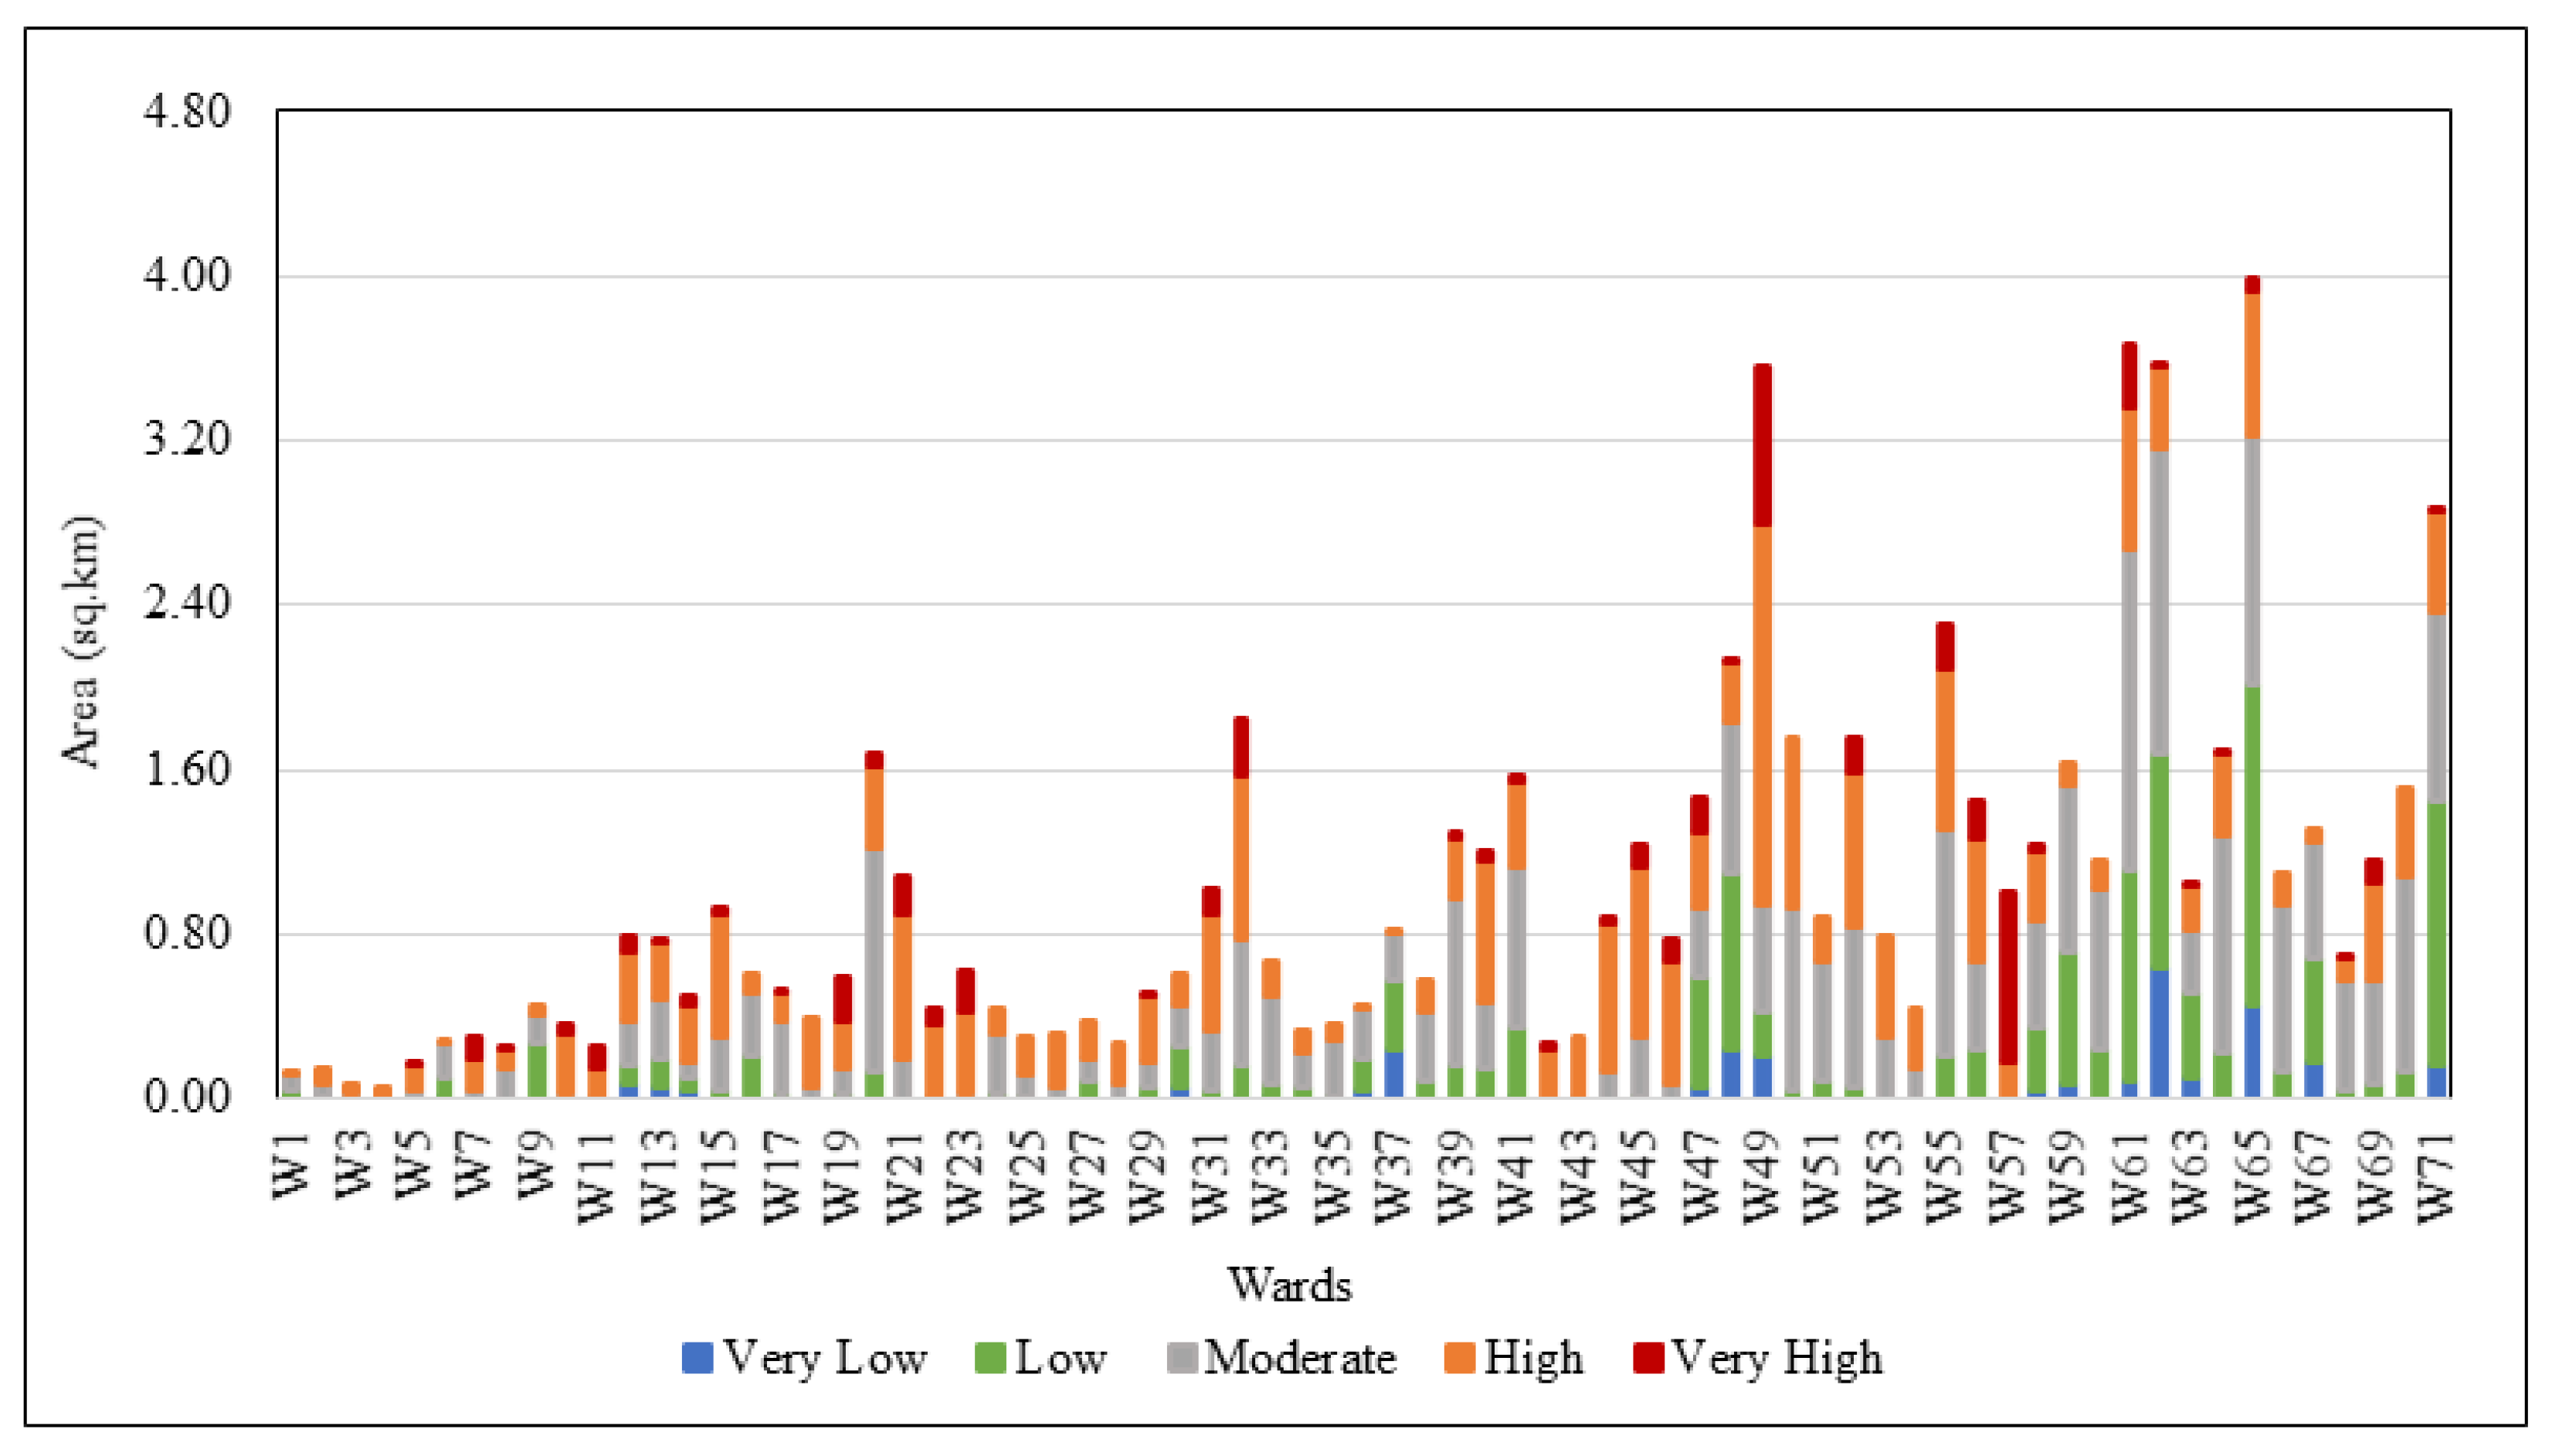
4.3. Land Surface Temperature (LST)
4.4. Spatial Distribution of Variables of Vulnerability
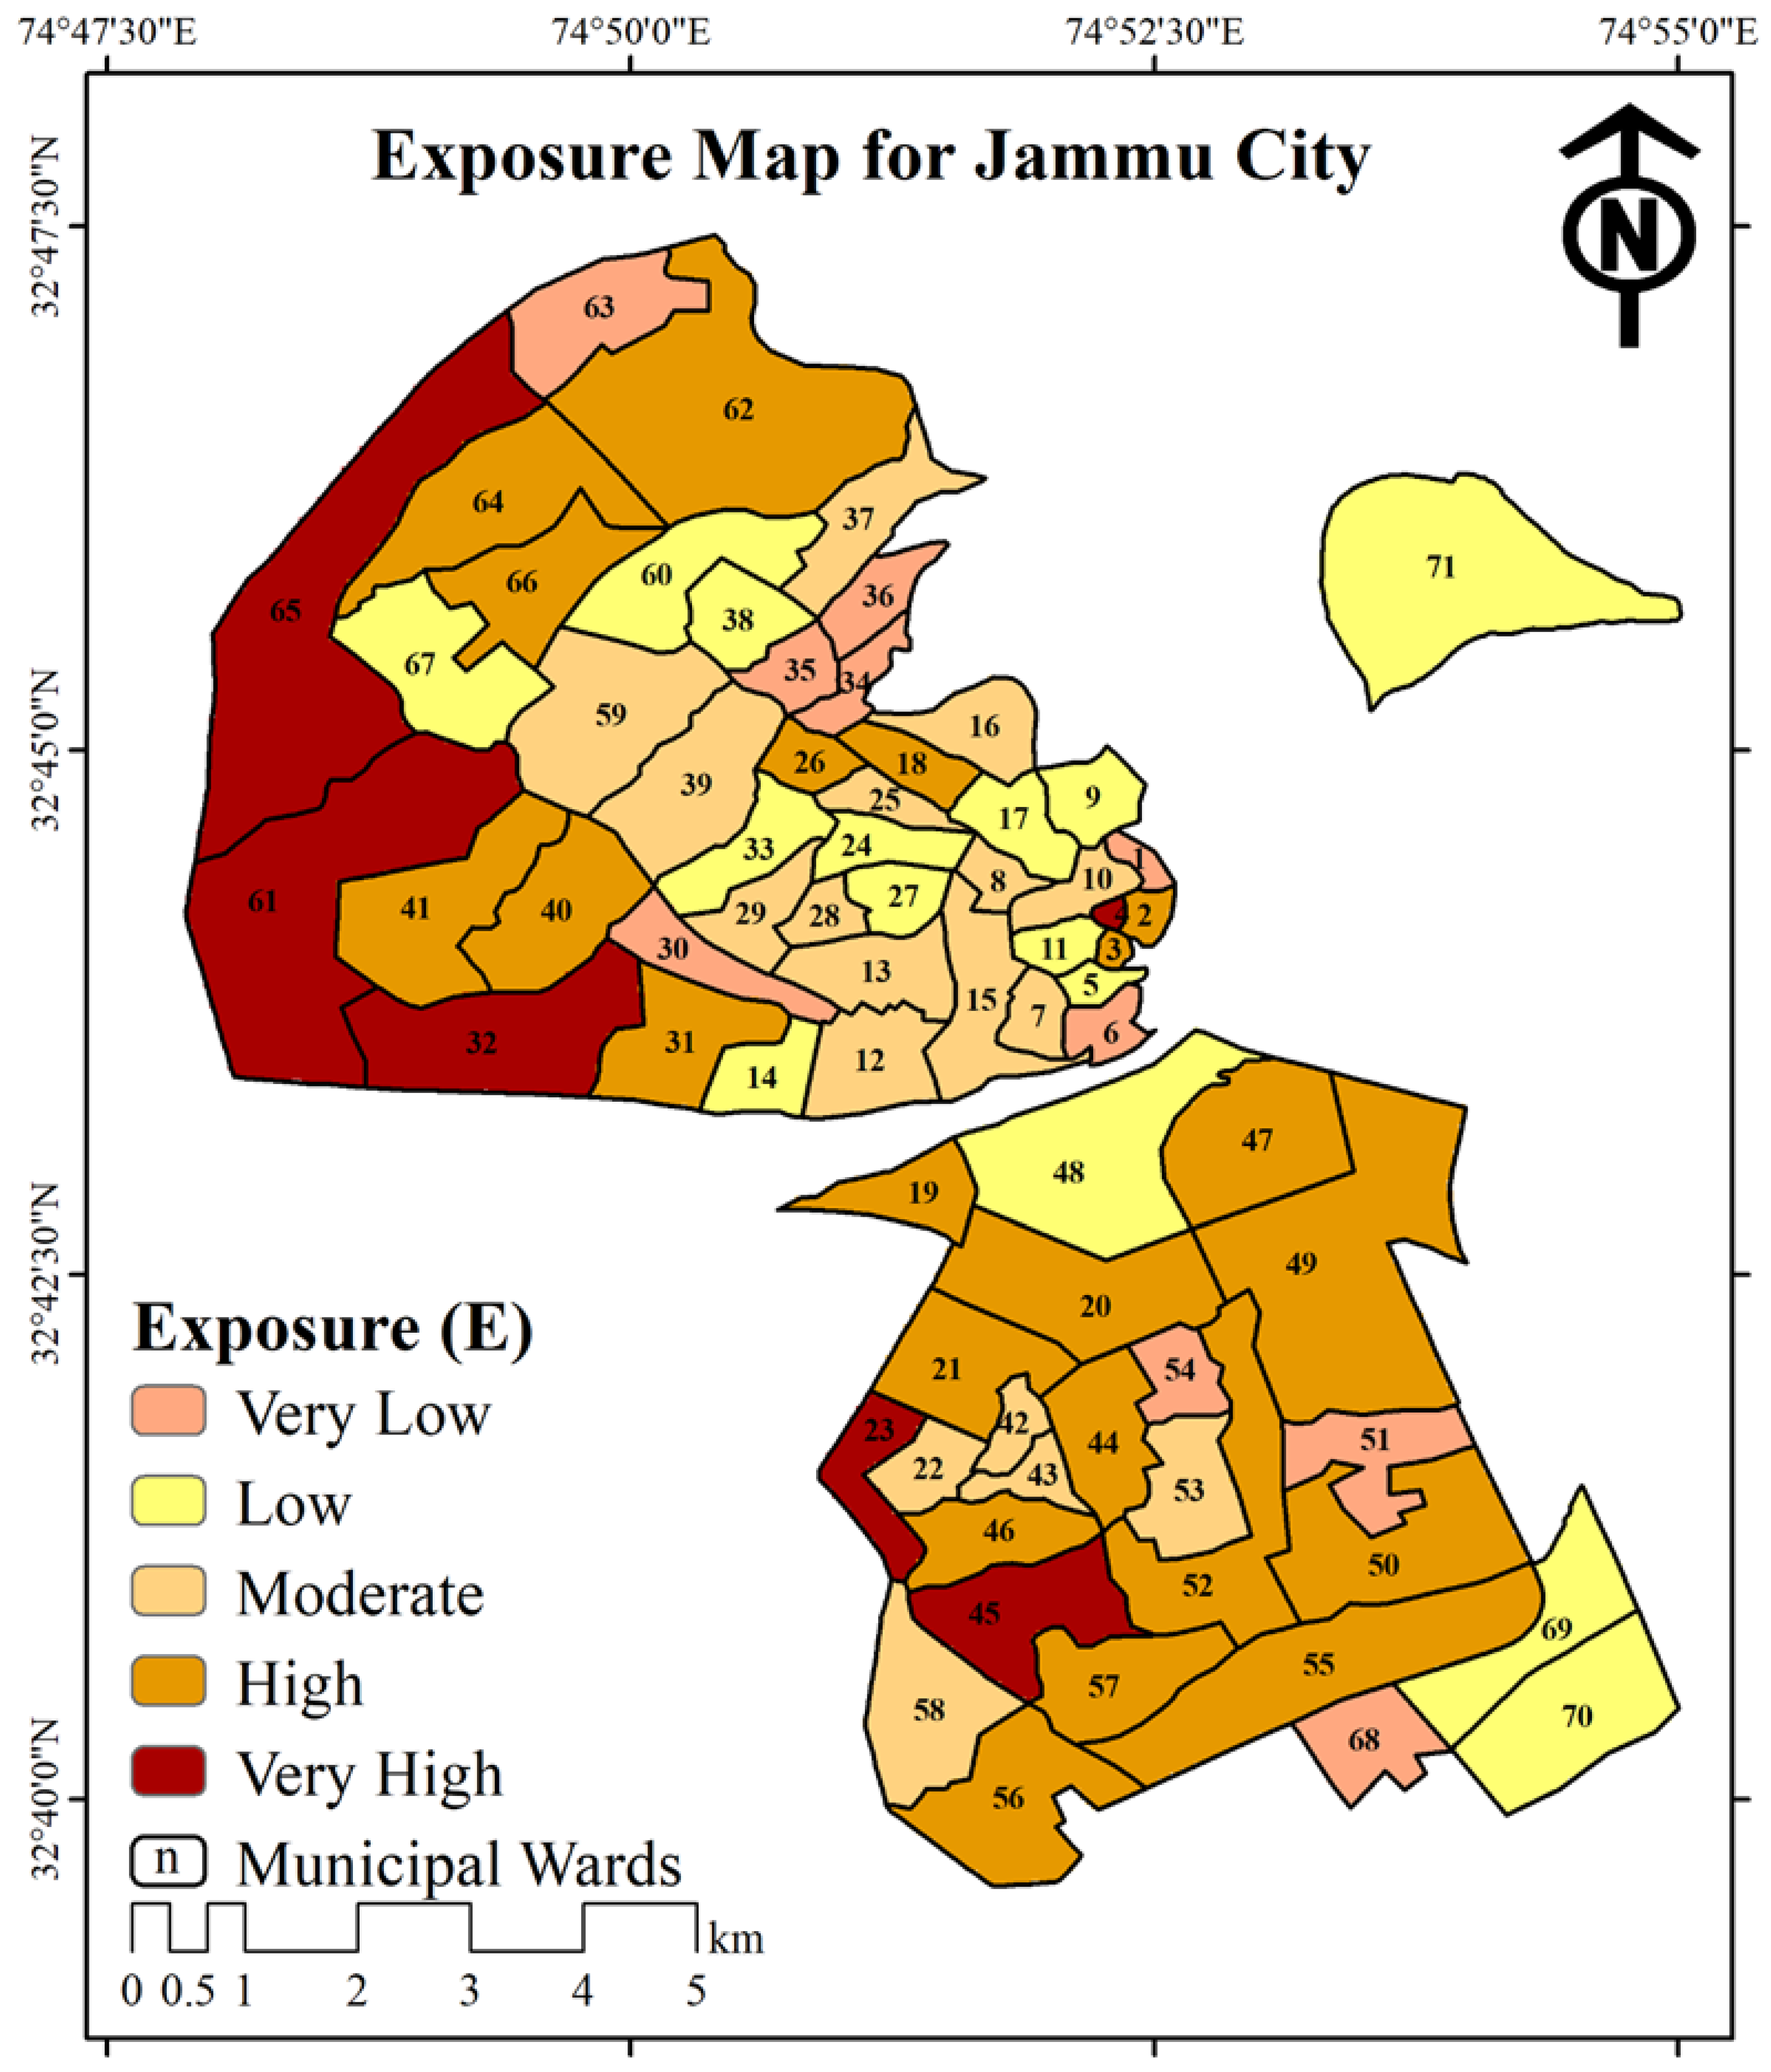
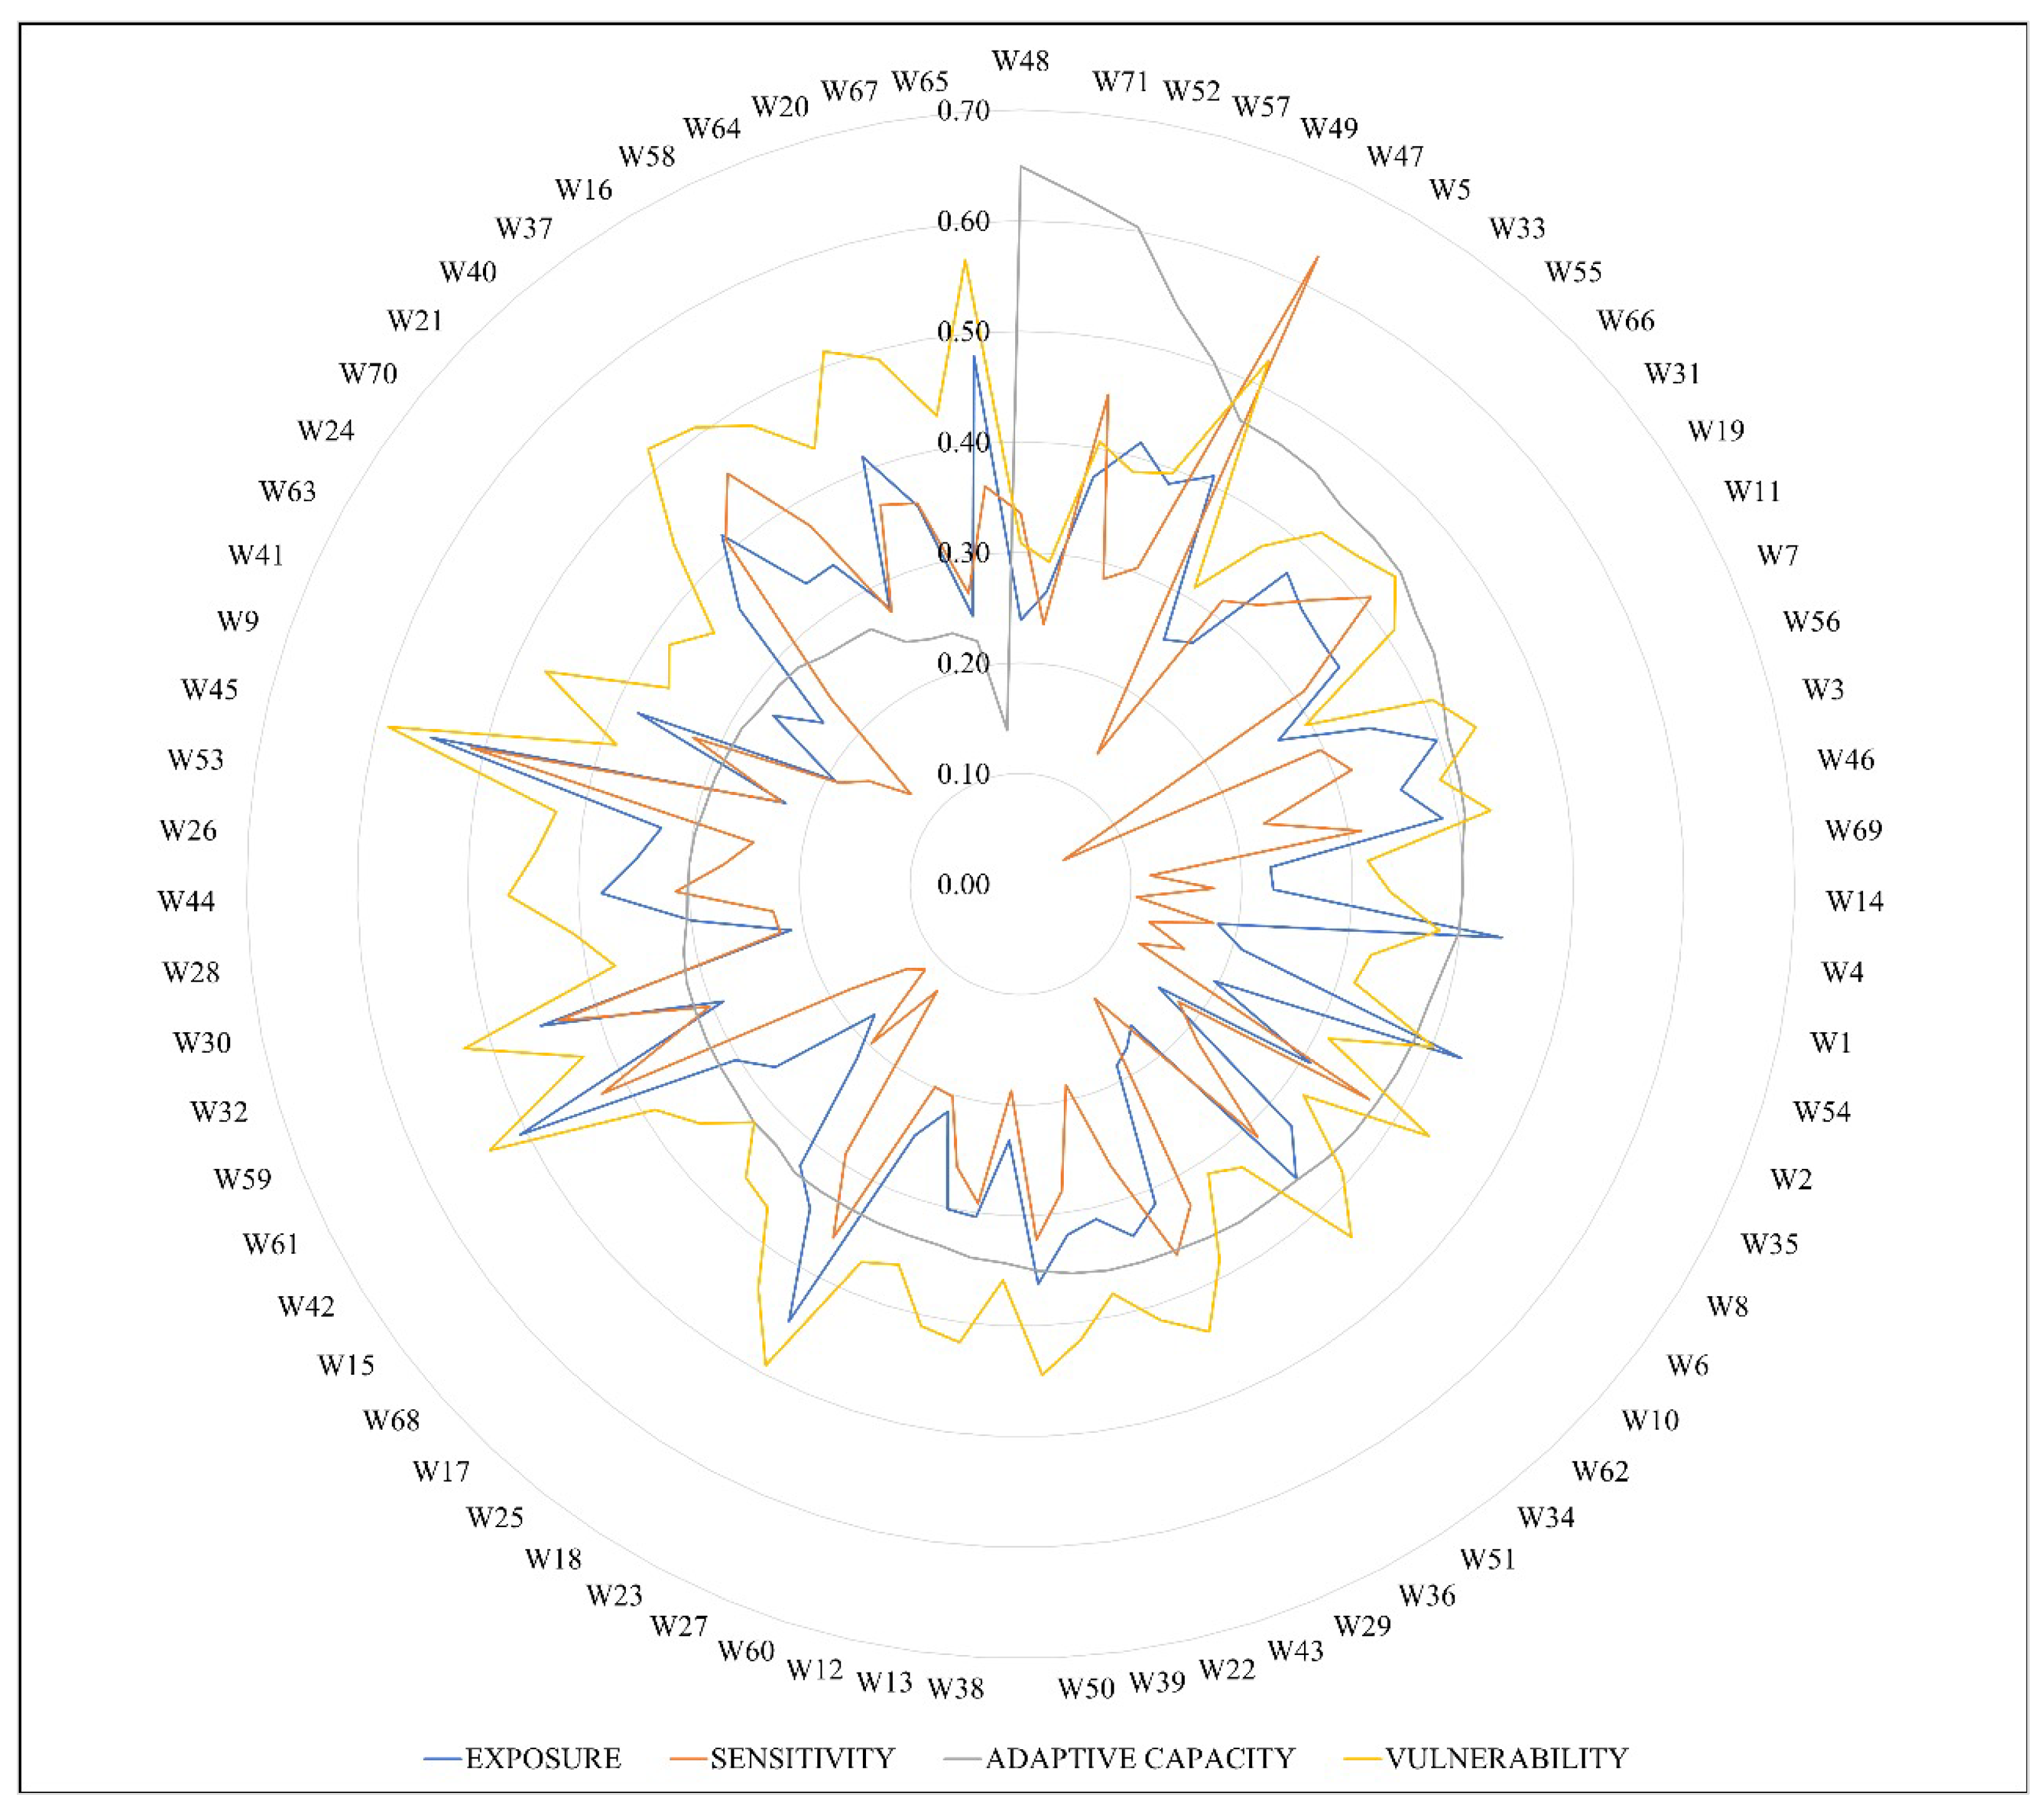
4.4.1. Exposure (E)
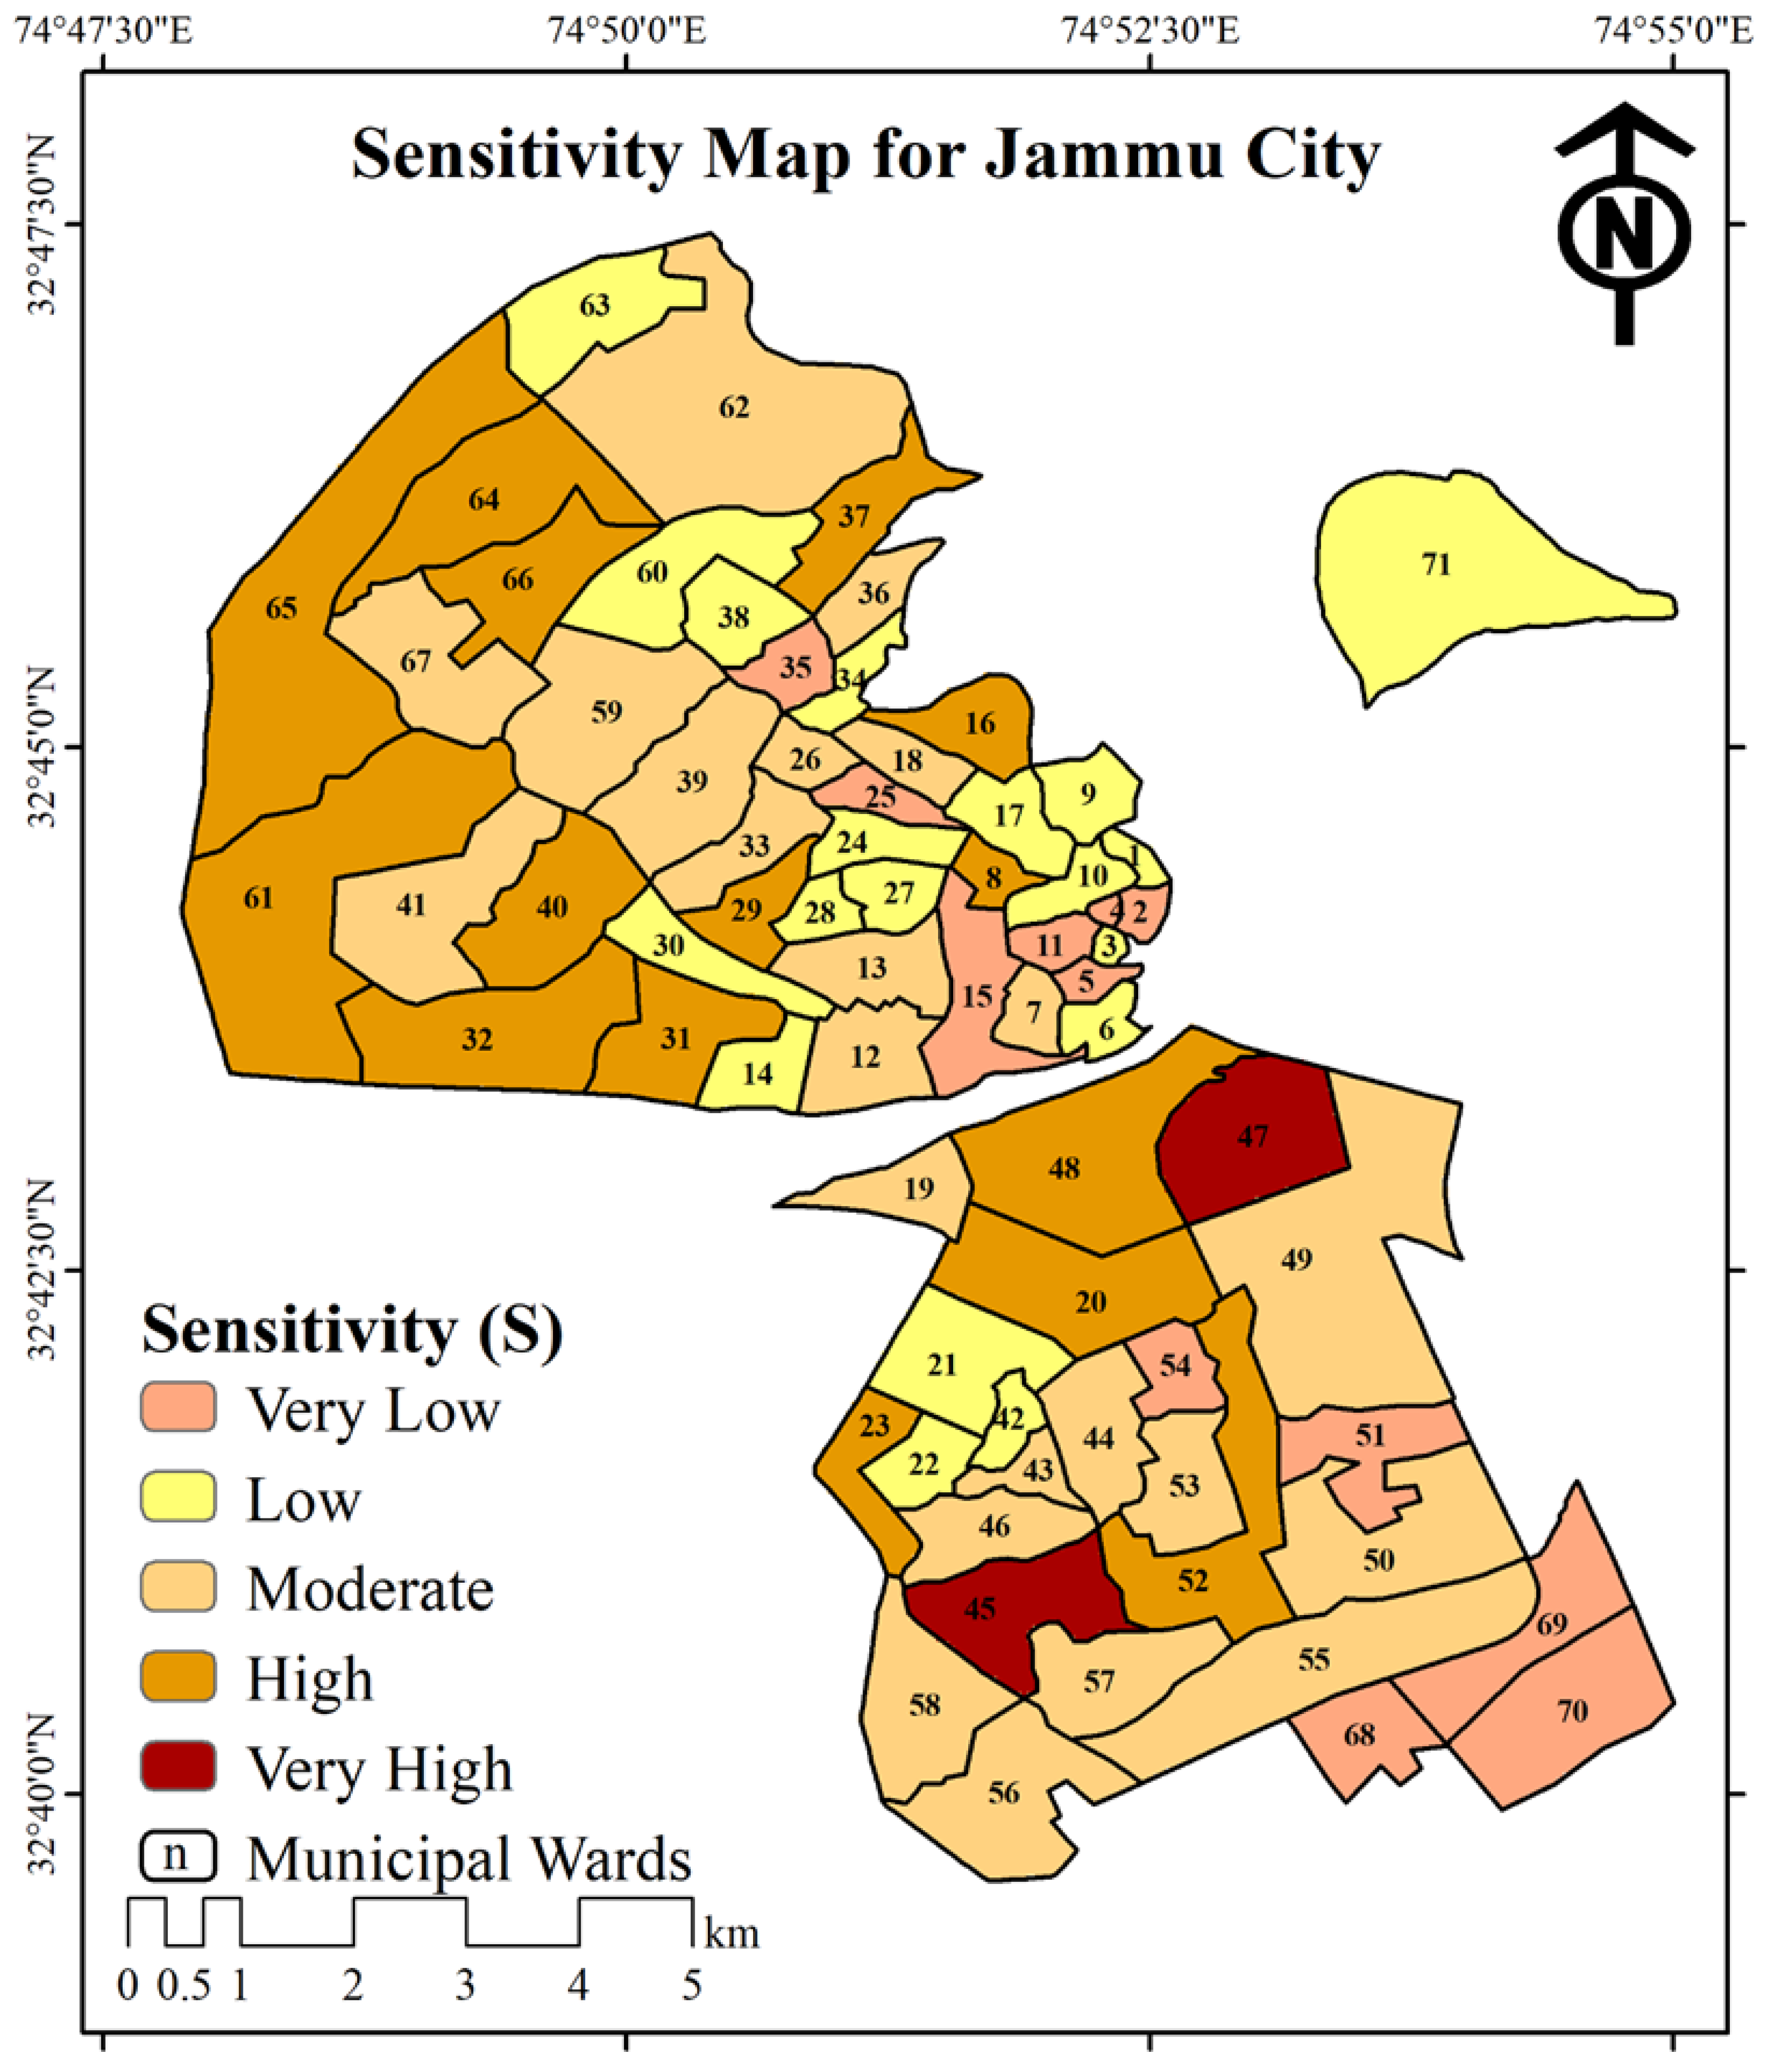
4.4.2. Sensitivity (S)
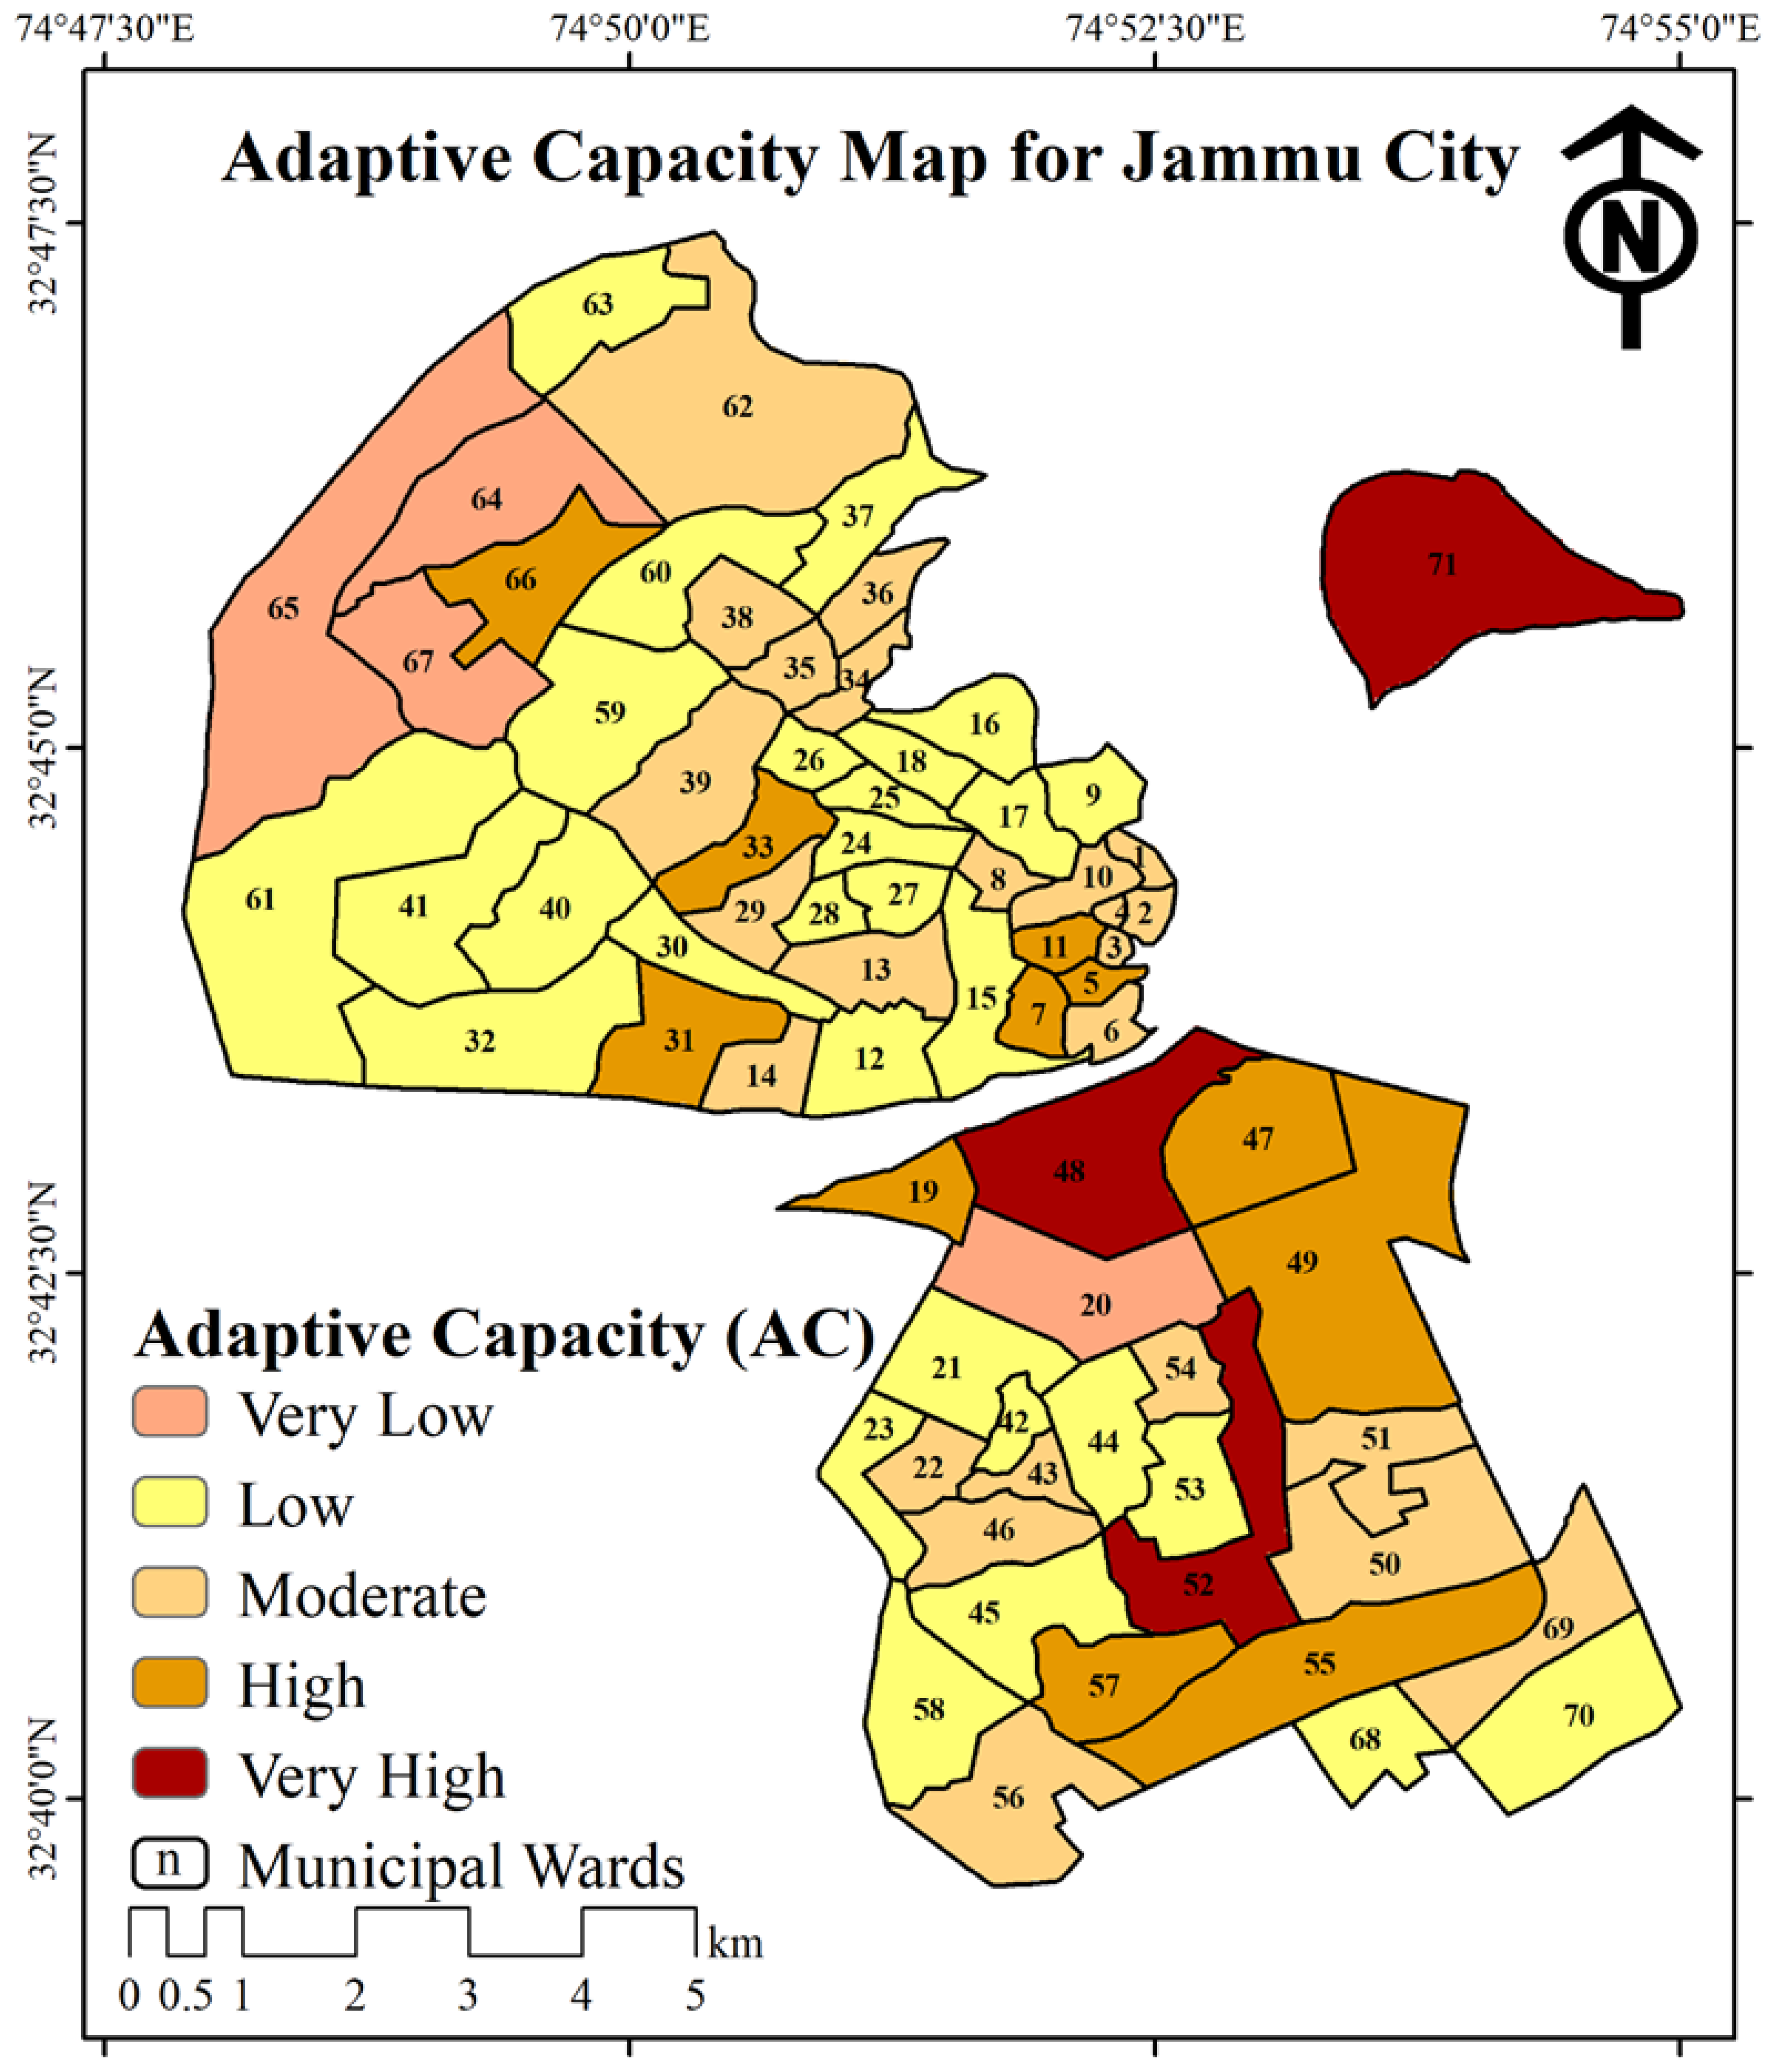
4.4.3. Adaptive Capacity (AC)
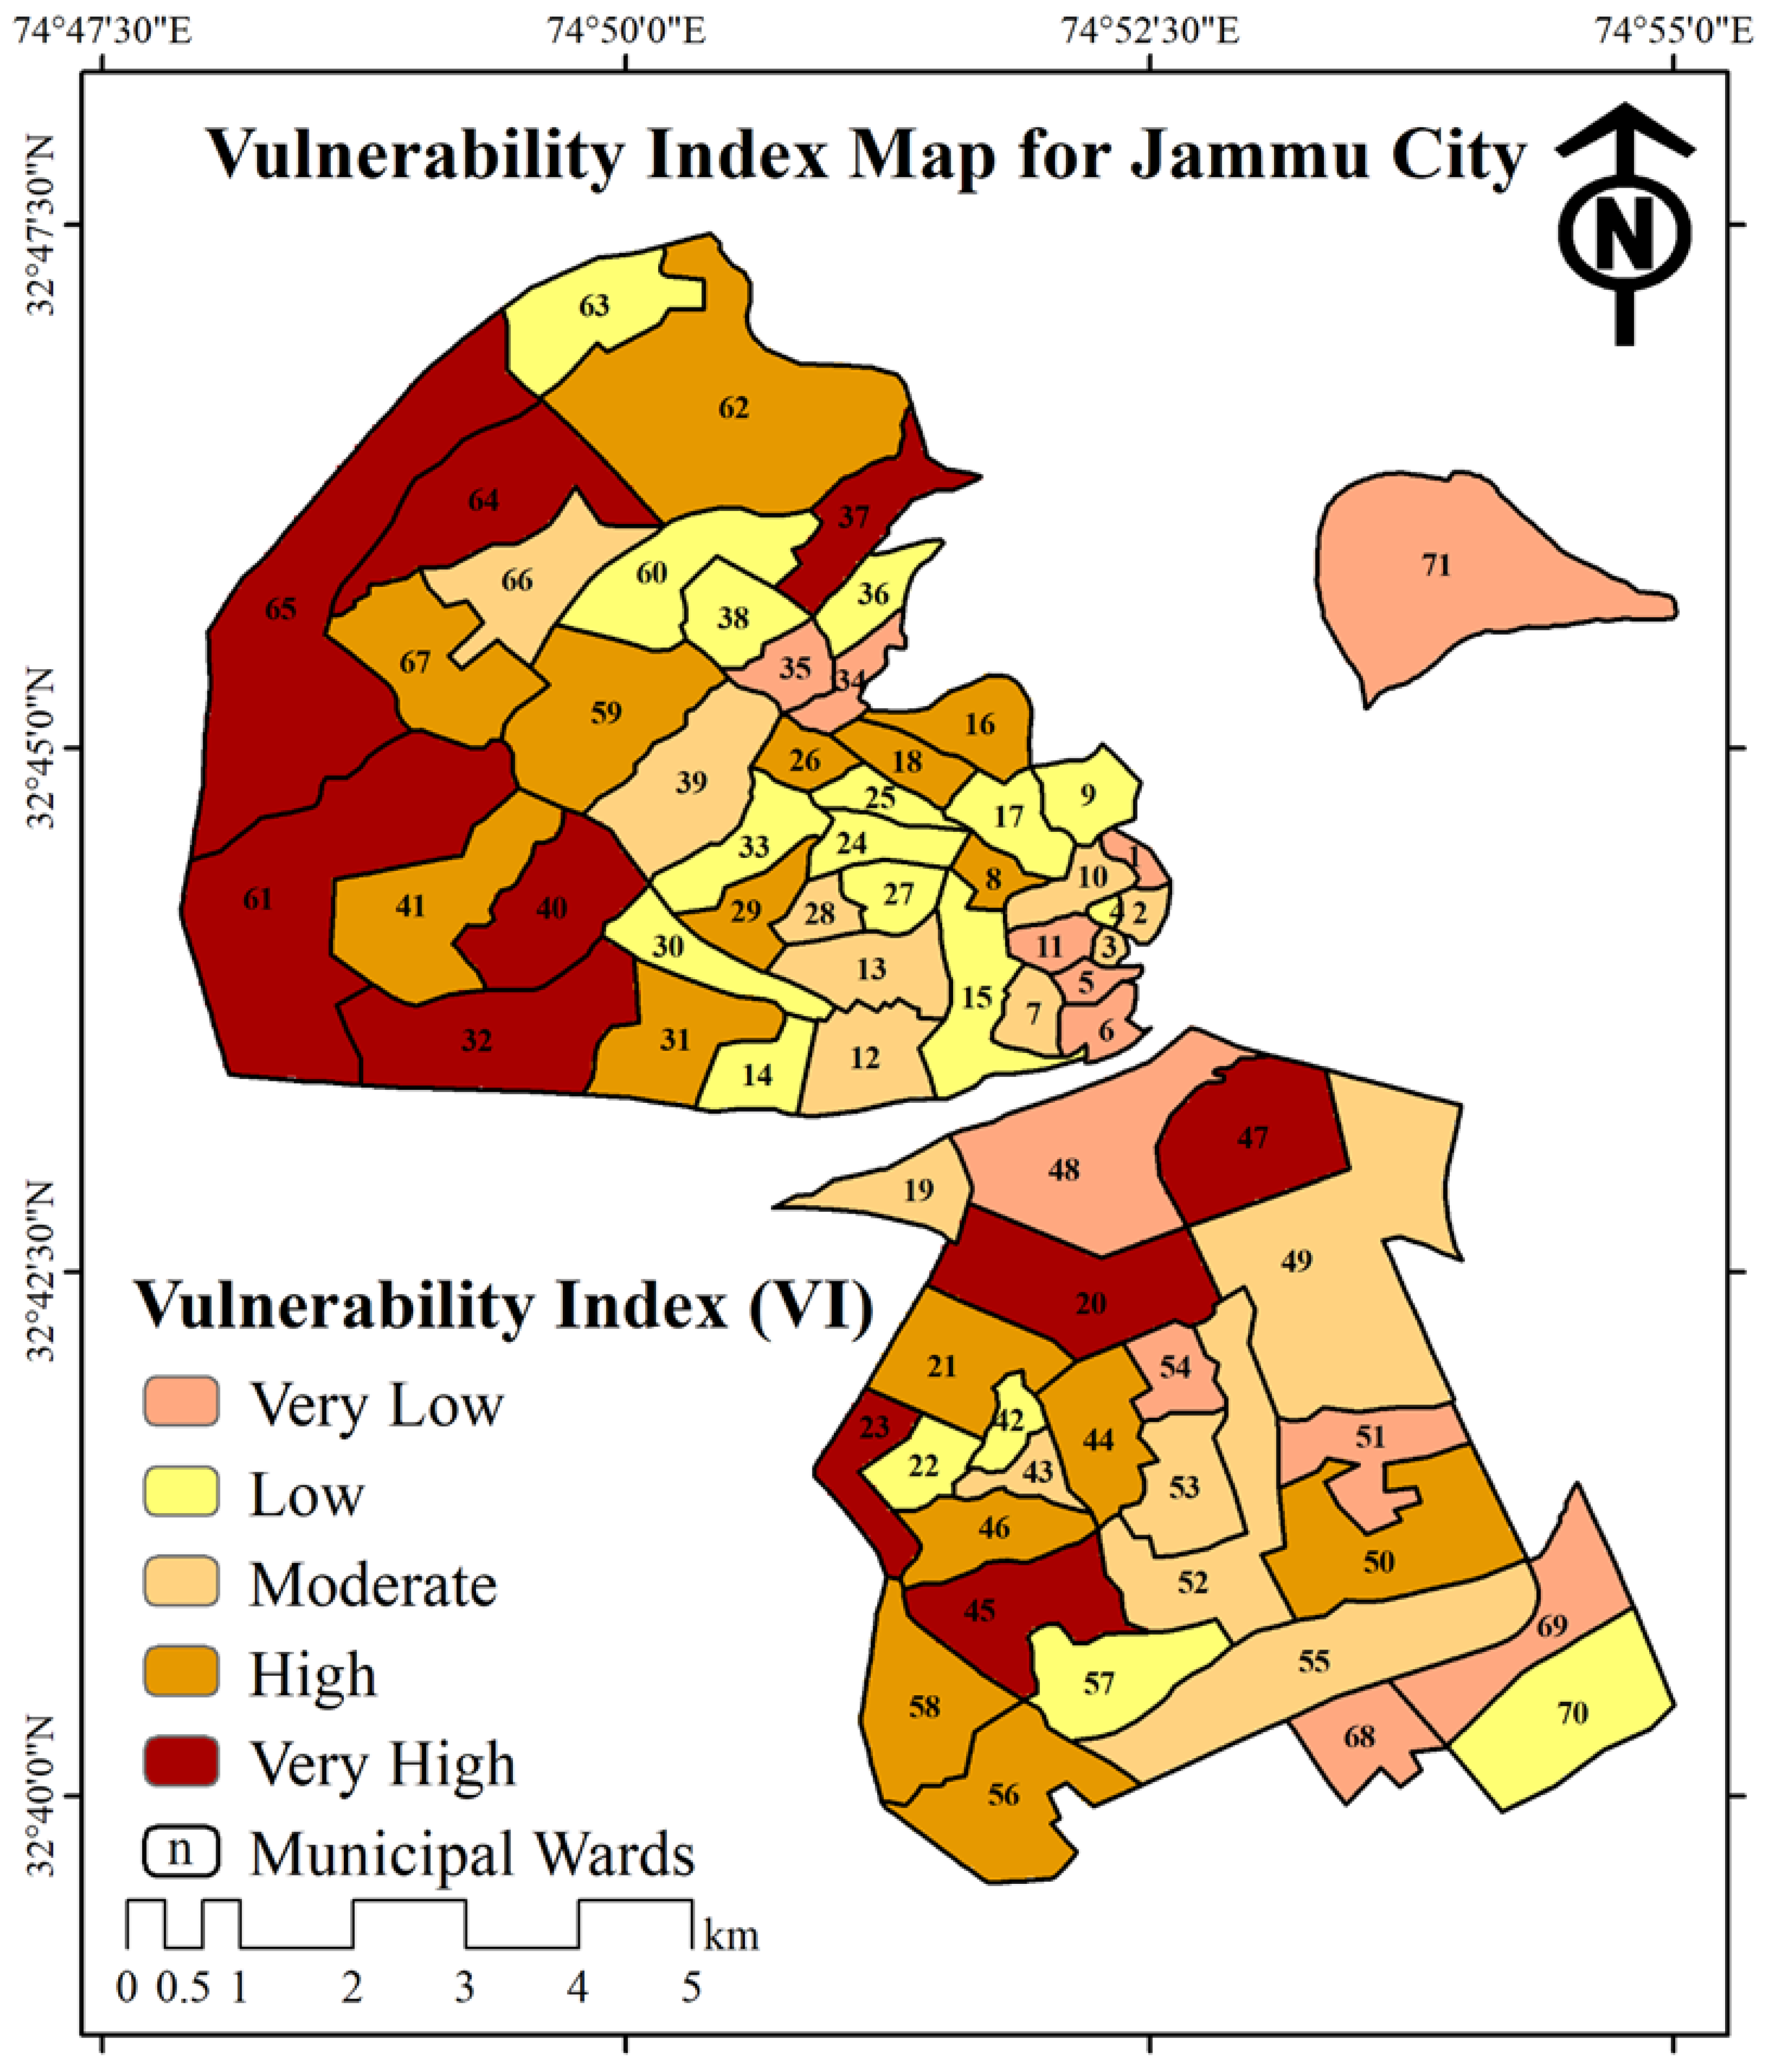
4.4.4. Spatial Distribution of the Ward-Level Inherent Vulnerability Index (VI)
5. Conclusions
Author Contributions
Funding
Data Availability Statement
Conflicts of Interest
References
- United Nations Population Division of the Department of Economic and Social Affairs. World Population Prospects 2019: Highlights (ST/ESA/SER.A/423); United Nations: New York City, NY, USA, 2019. [Google Scholar]
- Angel, S.; Parent, J.; Civco, D.L.; Blei, A.; Potere, D. The dimensions of global urban expansion: Estimates and projections for all countries, 2000–2050. Prog. Plan. 2011, 75, 53–107. [Google Scholar] [CrossRef]
- Seto, K.C.; Sánchez-Rodríguez, R.; Fragkias, M. The New Geography of Contemporary Urbanization and the Environment. Annu. Rev. Environ. Resour. 2010, 35, 167–194. [Google Scholar] [CrossRef]
- United Nations. Technical Paper No. 2015/2. Risks of Exposure and Vulnerability to Natural Disasters at the City Level: A Global Overview; Department of Economic and Social Affairs, Population Division: New York City, NY, USA, 2015. [Google Scholar]
- Anees, M.M.; Shukla, R.; Punia, M.; Joshi, P.K. Assessment and visualization of inherent vulnerability of urban population in India to natural disasters. Clim. Dev. 2019, 12, 532–546. [Google Scholar] [CrossRef]
- Senapati, S.; Gupta, V. Socio-economic vulnerability due to climate change: Deriving indicators for fishing communities in Mumbai. Mar. Policy 2017, 76, 90–97. [Google Scholar] [CrossRef]
- Grimm, N.B.; Faeth, S.H.; Golubiewski, N.E.; Redman, C.L.; Wu, J.; Bai, X.; Briggs, J.M. Global Change and the Ecology of Cities. Science 2008, 319, 756–760. [Google Scholar] [CrossRef] [PubMed]
- Murali, R.M.; Riyas, M.J.; Reshma, K.N.; Kumar, S.S. Climate change impact and vulnerability assessment of Mumbai city, India. Nat. Hazards 2019, 102, 575–589. [Google Scholar] [CrossRef]
- Rahman, M.; Hossain, A.; Ali, R.; Ahmed, Z.; Islam, A.H.M.H. Assessing vulnerability and adaptation strategy of the cyclone affected coastal area of Bangladesh. Geoenviron. Disasters 2022, 9, 6. [Google Scholar] [CrossRef]
- Hanoon, S.K.; Abdullah, A.F.; Shafri, H.Z.M.; Wayayok, A. Comprehensive Vulnerability Assessment of Urban Areas Using an Integration of Fuzzy Logic Functions: Case Study of Nasiriyah City in South Iraq. Earth 2022, 3, 699–732. [Google Scholar] [CrossRef]
- United Nations. The World’s Cities in 2018 Data Booklet. 2018. Available online: https://www.un.org/en/development/desa/population/publications/pdf/urbanization/the_worlds_cities_in_2018_data_booklet.pdf (accessed on 17 May 2023).
- CRED-UNISDR. Economic Losses, Poverty and Disaster (1998–2007); CRED-UNISDR: Brussels, Belgium, 2017. [Google Scholar]
- Alam, E.; Khan, S.; Salam, R. Vulnerability assessment based on household views from the Dammar Char in Southeastern Bangladesh. Nat. Hazards 2022, 113, 329–344. [Google Scholar] [CrossRef]
- DST. Climate Vulnerability Assessment for Adaptation Planning in India Using a Common Framework. DST.; 2020. Available online: https://dst.gov.in/sites/default/files/Full%20Report%20%281%29.pdf (accessed on 17 May 2023).
- Jammu and Kashmir Disaster Management Authority. Jksdma.jk.gov.in. 2011. Available online: https://jksdma.jk.gov.in/jksdmaover.html (accessed on 17 May 2023).
- Chauhan, N.; Shukla, R.; Joshi, P. Assessing inherent vulnerability of farming communities across different biogeographical zones in Himachal Pradesh, India. Environ. Dev. 2020, 33, 100506. [Google Scholar] [CrossRef]
- Shukla, R.; Sachdeva, K.; Joshi, P. Inherent vulnerability of agricultural communities in Himalaya: A village-level hotspot analysis in the Uttarakhand state of India. Appl. Geogr. 2016, 74, 182–198. [Google Scholar] [CrossRef]
- Parry, M.L. (Ed.) Climate Change 2007-Impacts, Adaptation and Vulnerability: Working Group II Contribution to the Fourth Assessment Report of the IPCC; Cambridge University Press: Cambridge, UK, 2007; Volume 4. [Google Scholar] [CrossRef]
- Khan, M.A.; Mustaffa, Z.; Harahap, I.S.H.; Ibrahim, M.B.; Al-Atroush, M.E. Assessment of Physical Vulnerability and Uncertainties for Debris Flow Hazard: A Review concerning Climate Change. Land 2022, 11, 2240. [Google Scholar] [CrossRef]
- Arif, N.; Wardhana, A.; Martiana, A. Spatial analysis of the urban physical vulnerability using remote sensing and geographic information systems (case study: Yogyakarta City). IOP Conf. Ser. 2022, 986, 012067. [Google Scholar] [CrossRef]
- Singh, S.; Eghdami, M.; Singh, S. The Concept of Social Vulnerability: A Review from Disasters Perspectives. Int. J. Interdiscip. Multidiscip. Stud. 2014, 1, 71–82. [Google Scholar]
- Mah, J.C.; Penwarden, J.L.; Pott, H.; Theou, O.; Andrew, M.K. Social vulnerability indices: A scoping review. BMC Public Health 2023, 23, 1253. [Google Scholar] [CrossRef] [PubMed]
- Aksha, S.K.; Juran, L.; Resler, L.M.; Zhang, Y. An Analysis of Social Vulnerability to Natural Hazards in Nepal Using a Modified Social Vulnerability Index. Int. J. Disaster Risk Sci. 2018, 10, 103–116. [Google Scholar] [CrossRef]
- Farooq, M.; Singh, S.K.; Kanga, S. Inherent vulnerability profiles of agriculture sector in temperate Himalayan region: A preliminary assessment. Indian J. Ecol. 2021, 48, 434–441. [Google Scholar]
- Bergstrand, K.; Mayer, B.; Brumback, B.; Zhang, Y. Assessing the Relationship Between Social Vulnerability and Community Resilience to Hazards. Soc. Indic. Res. 2014, 122, 391–409. [Google Scholar] [CrossRef]
- Emrich, C.T.; Cutter, S.L. Social Vulnerability to Climate-Sensitive Hazards in the Southern United States. Weather. Clim. Soc. 2011, 3, 193–208. [Google Scholar] [CrossRef]
- Bera, S.; Guru, B.; Oommen, T. Indicator-based approach for assigning physical vulnerability of the houses to landslide hazard in the Himalayan region of India. Int. J. Disaster Risk Reduct. 2020, 50, 101891. [Google Scholar] [CrossRef]
- Sathyan, A.R.; Funk, C.; Aenis, T.; Winker, P.; Breuer, L. Sensitivity analysis of a climate vulnerability index—A case study from Indian watershed development programmes. Clim. Chang. Responses 2018, 5, 1. [Google Scholar] [CrossRef]
- Dasgupta, S.; Badola, R. Indicator-Based Assessment of Resilience and Vulnerability in the Indian Himalayan Region: A Case Study on Socio-Economy under Different Scenarios. Sustainability 2020, 12, 6938. [Google Scholar] [CrossRef]
- Chisadza, B.; Ncube, F.; Macherera, M.; Bangira, T.; Gwate, O. Spatio-temporal variations in the ecological vulnerability of the Upper Mzingwane sub-catchment of Zimbabwe. Geomat. Nat. Hazards Risk 2023, 14, 1. [Google Scholar] [CrossRef]
- Swami, D.; Parthasarathy, D. Dynamics of exposure, sensitivity, adaptive capacity and agricultural vulnerability at district scale for Maharashtra, India. Ecol. Indic. 2021, 121, 107206. [Google Scholar] [CrossRef]
- Yu, J.; Castellani, K.; Forysinski, K.; Gustafson, P.; Lu, J.; Peterson, E.; Tran, M.; Yao, A.; Zhao, J.; Brauer, M. Geospatial indicators of exposure, sensitivity, and adaptive capacity to assess neighbourhood variation in vulnerability to climate change-related health hazards. Environ. Health Glob. Access Sci. Source 2021, 20, 31. [Google Scholar] [CrossRef] [PubMed]
- Rajesh, S.; Jain, S.; Sharma, P. Inherent vulnerability assessment of rural households based on socio-economic indicators using categorical principal component analysis: A case study of Kimsar region, Uttarakhand. Ecol. Indic. 2018, 85, 93–104. [Google Scholar] [CrossRef]
- Nengroo, Z.A.; Bhat, M.S.; Kuchay, N.A. Measuring urban sprawl of Srinagar city, Jammu and Kashmir, India. J. Urban Manag. 2017, 6, 45–55. [Google Scholar] [CrossRef]
- Census of India 2011. Censusindia.gov.in. Available online: https://censusindia.gov.in/nada/index.php/catalog/499/download/1644/DH_2011_0103_PART_B_DCHB_LEH.pdf (accessed on 31 December 2023).
- Seyam, M.H.; Haque, R.; Rahman, M. Identifying the land use land cover (LULC) changes using remote sensing and GIS approach: A case study at Bhaluka in Mymensingh, Bangladesh. Case Stud. Chem. Environ. Eng. 2023, 7, 100293. [Google Scholar] [CrossRef]
- Hassan, Z.; Shabbir, R.; Ahmad, S.S.; Malik, A.H.; Aziz, N.; Butt, A.; Erum, S. Dynamics of land use and land cover change (LULCC) using geospatial techniques: A case study of Islamabad Pakistan. SpringerPlus 2016, 5, 812. [Google Scholar] [CrossRef]
- Sobrino, J.A.; Jimenez-Munoz, J.C.; Soria, G.; Romaguera, M.; Guanter, L.; Moreno, J.; Plaza, A.; Martinez, P. Land Surface Emissivity Retrieval From Different VNIR and TIR Sensors. IEEE Trans. Geosci. Remote Sens. 2008, 46, 316–327. [Google Scholar] [CrossRef]
- Jimenez-Munoz, J.C.; Cristobal, J.; Sobrino, J.A.; Soria, G.; Ninyerola, M.; Pons, X. Revision of the Single-Channel Algorithm for Land Surface Temperature Retrieval from Landsat Thermal-Infrared Data. IEEE Trans. Geosci. Remote Sens. 2009, 47, 339–349. [Google Scholar] [CrossRef]
- Szabo, S.; Brondizio, E.; Renaud, F.G.; Hetrick, S.; Nicholls, R.J.; Matthews, Z.; Tessler, Z.; Tejedor, A.; Sebesvari, Z.; Foufoula-Georgiou, E.; et al. Population dynamics, delta vulnerability and environmental change: Comparison of the Mekong, Ganges–Brahmaputra and Amazon delta regions. Sustain. Sci. 2016, 11, 539–554. [Google Scholar] [CrossRef] [PubMed]
- McLeman, R. Impacts of population change on vulnerability and the capacity to adapt to climate change and variability: A typology based on lessons from “a hard country”. Popul. Environ. 2009, 31, 286–316. [Google Scholar] [CrossRef]
- Liu, X.; Yue, W.; Yang, X.; Hu, K.; Zhang, W.; Huang, M. Mapping Urban Heat Vulnerability of Extreme Heat in Hangzhou via Comparing Two Approaches. Complexity 2020, 2020, 9717658. [Google Scholar] [CrossRef]
- Ehrlich, D.; Kemper, T.; Pesaresi, M.; Corbane, C. Built-up area and population density: Two Essential Societal Variables to address climate hazard impact. Environ. Sci. Policy 2018, 90, 73–82. [Google Scholar] [CrossRef] [PubMed]
- Kim, H.G.; Lee, D.K.; Jung, H.; Kil, S.-H.; Park, J.H.; Park, C.; Tanaka, R.; Seo, C.; Kong, W.; Oh, K.; et al. Finding key vulnerable areas by a climate change vulnerability assessment. Nat. Hazards 2016, 81, 1683–1732. [Google Scholar] [CrossRef]
- Shah, D.; Arora, S.K.; Chaturvedi, S.; Gupta, P. Defining and measuring vulnerability in young people. Indian J. Community Med. 2015, 40, 193. [Google Scholar] [CrossRef]
- Handayani, W.; Rudiarto, I.; Setyono, J.S.; Chigbu, U.E.; Sukmawati, A.M. Vulnerability assessment: A comparison of three different city sizes in the coastal area of Central Java, Indonesia. Adv. Clim. Chang. Res. 2017, 8, 286–296. [Google Scholar] [CrossRef]
- Jerin, T.; Azad, M.A.K.; Khan, M.N. Climate change-triggered vulnerability assessment of the flood-prone communities in Bangladesh: A gender perspective. Int. J. Disaster Risk Reduct. 2023, 95, 103851. [Google Scholar] [CrossRef]
- Sadia, H.; Iqbal, M.J.; Ahmad, J.; Ali, A.; Ahmad, A. Gender-sensitive public health risks and vulnerabilities’ assessment with reference to floods in Pakistan. Int. J. Disaster Risk Reduct. 2016, 19, 47–56. [Google Scholar] [CrossRef]
- Sarkar, A.; Chouhan, P. COVID-19: District level vulnerability assessment in India. Clin. Epidemiol. Glob. Health 2020, 9, 204–215. [Google Scholar] [CrossRef] [PubMed]
- Raja, D.R.; Hredoy, M.S.N.; Islam, M.K.; Islam, K.M.A.; Adnan, M.S.G. Spatial distribution of heatwave vulnerability in a coastal city of Bangladesh. Environ. Chall. 2021, 4, 100122. [Google Scholar] [CrossRef]
- Mazumdar, J.; Paul, S.K. Socioeconomic and infrastructural vulnerability indices for cyclones in the eastern coastal states of India. Nat. Hazards 2016, 82, 1621–1643. [Google Scholar] [CrossRef]
- Singh, R.K.; Kumar, M. Assessing vulnerability of agriculture system to climate change in the SAARC region. Environ. Chall. 2021, 5, 100398. [Google Scholar] [CrossRef]
- Ma, Y.; Guga, S.; Xu, J.; Su, Y.; Liu, X.; Tong, Z.; Zhang, J. Agricultural Vulnerability Assessment of High-Temperature Disaster in Shaanxi Province of China. Agriculture 2022, 12, 980. [Google Scholar] [CrossRef]
- Jackson, P.R. Differential Vulnerability and Psychological Health in Unemployment. Statistician 1985, 34, 83. [Google Scholar] [CrossRef]
- Tang, S.; Horter, L.; Bosh, K.; Kassem, A.M.; Kahn, E.B.; Ricaldi, J.N.; Pao, L.Z.; Kang, G.J.; Singleton, C.-M.; Liu, T.; et al. Change in unemployment by social vulnerability among United States counties with rapid increases in COVID-19 incidence—July 1–31 October 2020. PLoS ONE 2022, 17, e0265888. [Google Scholar] [CrossRef] [PubMed]
- Rasch, R.J. Assessing urban vulnerability to flood hazard in Brazilian municipalities. Environ. Urban. 2015, 28, 145–168. [Google Scholar] [CrossRef]
- Nazeer, M.; Bork, H.-R. Flood Vulnerability Assessment through Different Methodological Approaches in the Context of North-West Khyber Pakhtunkhwa, Pakistan. Sustainability 2019, 11, 6695. [Google Scholar] [CrossRef]
- Mwatu, M.M.; Recha, C.W.; Ondimu, K.N. Assessment of Livelihood Vulnerability to Rainfall Variability among Crop Farming Households in Kitui South Sub-County, Kenya. OALib 2020, 07, 1–14. [Google Scholar] [CrossRef]
- Opiyo, F.E.; Wasonga, O.V.; Nyangito, M.M. Measuring household vulnerability to climate-induced stresses in pastoral rangelands of Kenya: Implications for resilience programming. Pastoralism 2014, 4, 10. [Google Scholar] [CrossRef]
- Li, Y.; Zhang, X.; Zhao, X.; Ma, S.; Cao, H.; Cao, J. Assessing spatial vulnerability from rapid urbanization to inform coastal urban regional planning. Ocean Coast. Manag. 2016, 123, 53–65. [Google Scholar] [CrossRef]
- St-Germain, A.-A.F.; Tarasuk, V. Homeownership status and risk of food insecurity: Examining the role of housing debt, housing expenditure and housing asset using a cross-sectional population-based survey of Canadian households. Int. J. Equity Health 2020, 19, 5. [Google Scholar] [CrossRef]
- Aizawa, T.; Helble, M. ADBI Working Paper Series Health and Home Ownership: Findings for the Case of Japan Asian Development Bank Institute. 2015. Available online: https://www.adb.org/sites/default/files/publication/160046/adbi-wp525.pdf (accessed on 17 May 2023).
- He, L.; Zhou, S. Household Financial Vulnerability to Income and Medical Expenditure Shocks: Measurement and Determinants. Int. J. Environ. Res. Public Health 2022, 19, 4480. [Google Scholar] [CrossRef]
- Zhang, H.; Zhao, Y.; Pedersen, J. Capital assets framework for analysing household vulnerability during disaster. Disasters 2019, 44, 687–707. [Google Scholar] [CrossRef]
- Mesfin, D.; Simane, B.; Belay, A.; Recha, J.W.; Schmiedel, U. Assessing the Adaptive Capacity of Households to Climate Change in the Central Rift Valley of Ethiopia. Climate 2020, 8, 106. [Google Scholar] [CrossRef]
- Hutton, G.; Chase, C. Water Supply, Sanitation, and Hygiene; The International Bank for Reconstruction and Development/The World Bank: Washington, DC, USA, 2017. [Google Scholar]
- Freeman, M.C.; Garn, J.V.; Sclar, G.D.; Boisson, S.; Medlicott, K.; Alexander, K.T.; Penakalapati, G.; Anderson, D.; Mahtani, A.G.; Grimes, J.E.; et al. The impact of sanitation on infectious disease and nutritional status: A systematic review and meta-analysis. Int. J. Hyg. Environ. Health 2017, 220, 928–949. [Google Scholar] [CrossRef]
- Selm, K.R.; Hess, G.R.; Peterson, M.N.; Beck, S.M.; McHale, M.R. Developing an Instrument to Measure Autonomous Adaptive Capacity to Climate Change among Urban Households. Front. Ecol. Evol. 2018, 6, 13. [Google Scholar] [CrossRef]
- Datta, P.; Behera, B. Assessment of adaptive capacity and adaptation to climate change in the farming households of Eastern Himalayan foothills of West Bengal, India. Environ. Chall. 2022, 7, 100462. [Google Scholar] [CrossRef]
- Inostroza, L.; Palme, M.; de la Barrera, F. A Heat Vulnerability Index: Spatial Patterns of Exposure, Sensitivity and Adaptive Capacity for Santiago de Chile. PLoS ONE 2016, 11, e0162464. [Google Scholar] [CrossRef]
- Won, K.; Chung, E.-S.; Choi, S.-U. Parametric Assessment of Water Use Vulnerability Variations Using SWAT and Fuzzy TOPSIS Coupled with Entropy. Sustainability 2015, 7, 12052–12070. [Google Scholar] [CrossRef]
- Moreira, L.L.; Vanelli, F.M.; Schwamback, D.; Kobiyama, M.; de Brito, M.M. Sensitivity analysis of indicator weights for the construction of flood vulnerability indexes: A participatory approach. Front. Water 2023, 5, 970469. [Google Scholar] [CrossRef]
- Galderisi, A.; Limongi, G. A Comprehensive Assessment of Exposure and Vulnerabilities in Multi-Hazard Urban Environments: A Key Tool for Risk-Informed Planning Strategies. Sustainability 2021, 13, 9055. [Google Scholar] [CrossRef]
- Climate Vulnerability Assessment for the Indian Himalayan Region Using a Common Framework. 2018. Available online: https://www.weadapt.org/sites/weadapt.org/files/climate_va_for_ihr_using_common_framework.pdf (accessed on 28 June 2023).
- Murthy, C.S.; Laxman, B.; Sai, M.V.R.S. Geospatial analysis of agricultural drought vulnerability using a composite index based on exposure, sensitivity and adaptive capacity. Int. J. Disaster Risk Reduct. 2015, 12, 163–171. [Google Scholar] [CrossRef]
- Liu, X.; Wang, Y.; Peng, J.; Braimoh, A.K.; Yin, H. Assessing vulnerability to drought based on exposure, sensitivity and adaptive capacity: A case study in middle Inner Mongolia of China. Chin. Geogr. Sci. 2012, 23, 13–25. [Google Scholar] [CrossRef]
- Singh, C.; Deshpande, T.; Basu, R. How do we assess vulnerability to climate change in India? A systematic review of literature. Reg. Environ. Chang. 2016, 17, 527–538. [Google Scholar] [CrossRef]
- Pandey, A.; Hale, D.; Das, S.; Goddings, A.-L.; Blakemore, S.-J.; Viner, R.M. Effectiveness of Universal Self-regulation–Based Interventions in Children and Adolescents. JAMA Pediatr. 2018, 172, 566–575. [Google Scholar] [CrossRef]
- Singh, P.K.; Hiremath, B. Sustainable livelihood security index in a developing country: A tool for development planning. Ecol. Indic. 2010, 10, 442–451. [Google Scholar] [CrossRef]
- Yankson, P.W.K.; Asiedu, A.B.; Owusu, K.; Urban, F.; Siciliano, G. The livelihood challenges of resettled communities of the Bui dam project in Ghana and the role of Chinese dam-builders. Dev. Policy Rev. 2017, 36, O476–O494. [Google Scholar] [CrossRef]
- Rygel, L.; O’sullivan, D.; Yarnal, B. A Method for Constructing a Social Vulnerability Index: An Application to Hurricane Storm Surges in a Developed Country. Mitig. Adapt. Strat. Glob. Chang. 2006, 11, 741–764. [Google Scholar] [CrossRef]
- Yadav, D.K.; Barve, A. Analysis of socioeconomic vulnerability for cyclone-affected communities in coastal Odisha, India. Int. J. Disaster Risk Reduct. 2017, 22, 387–396. [Google Scholar] [CrossRef]
- Krellenberg, K.; Welz, J.; Link, F.; Barth, K. Urban vulnerability and the contribution of socio-environmental fragmentation. Prog. Hum. Geogr. 2016, 41, 408–431. [Google Scholar] [CrossRef]
- Frigerio, J.; Ballabio, A.; Isella, G.; Sakat, E.; Pellegrini, G.; Biagioni, P.; Bollani, M.; Napolitani, E.; Manganelli, C.; Virgilio, M.; et al. Tunability of the dielectric function of heavily doped germanium thin films for mid-infrared plasmonics. Phys. Rev. B 2016, 94, 085202. [Google Scholar] [CrossRef]
- Chi, N.-W.; Chang, H.-T.; Huang, H.-L. Can personality traits and daily positive mood buffer the harmful effects of daily negative mood on task performance and service sabotage? A self-control perspective. Organ. Behav. Hum. Decis. Process. 2015, 131, 1–15. [Google Scholar] [CrossRef]
- Moreira, L.L.; de Brito, M.M.; Kobiyama, M. Effects of Different Normalization, Aggregation, and Classification Methods on the Construction of Flood Vulnerability Indexes. Water 2021, 13, 98. [Google Scholar] [CrossRef]
- Žurovec, O.; Čadro, S.; Sitaula, B. Quantitative Assessment of Vulnerability to Climate Change in Rural Municipalities of Bosnia and Herzegovina. Sustainability 2017, 9, 1208. [Google Scholar] [CrossRef]
- Singh, L.; Singh, H.; Singh, S. Managing Natural Resources and Environmental Challenges in the Face of Urban Sprawl in Indian Himalayan City of Jammu. J. Indian Soc. Remote Sens. 2020, 48, 1139–1147. [Google Scholar] [CrossRef]
- Yuan, F.; Bauer, M.E. Comparison of impervious surface area and normalized difference vegetation index as indicators of surface urban heat island effects in Landsat imagery. Remote Sens. Environ. 2007, 106, 375–386. [Google Scholar] [CrossRef]
- Aburas, M.M.; Abdullah, S.H.; Ramli, M.F.; Asha’ari, Z.H. Measuring land cover change in Seremban. Malaysia Using NDVI Index. Procedia Environ. Sci. 2015, 30, 238–243. [Google Scholar] [CrossRef]
- Lu, D.; Weng, Q. Spectral mixture analysis of ASTER images for examining the relationship between urban thermal features and biophysical descriptors in Indianapolis, Indiana, USA. Remote Sens. Environ. 2006, 104, 157–167. [Google Scholar] [CrossRef]
- Julien, Y.; Sobrino, J.A.; Verhoef, W. Changes in land surface temperatures and NDVI values over Europe between 1982 and 1999. Remote Sens. Environ. 2006, 103, 43–55. [Google Scholar] [CrossRef]
- Esfandeh, S.; Danehkar, A.; Salmanmahiny, A.; Sadeghi, S.M.M.; Marcu, M.V. Climate Change Risk of Urban Growth and Land Use/Land Cover Conversion: An In-Depth Review of the Recent Research in Iran. Sustainability 2021, 14, 338. [Google Scholar] [CrossRef]
- Ullah, S.; Tahir, A.A.; Akbar, T.A.; Hassan, Q.K.; Dewan, A.; Khan, A.J.; Khan, M. Remote Sensing-Based Quantification of the Relationships between Land Use Land Cover Changes and Surface Temperature over the Lower Himalayan Region. Sustainability 2019, 11, 5492. [Google Scholar] [CrossRef]
- Ahmed, B.; Kamruzzaman, M.; Zhu, X.; Rahman, M.S.; Choi, K. Simulating Land Cover Changes and Their Impacts on Land Surface Temperature in Dhaka, Bangladesh. Remote Sens. 2013, 5, 5969–5998. [Google Scholar] [CrossRef]
- Voogt, J.A.; Oke, T.R. Thermal remote sensing of urban climates. Remote Sens. Environ. 2003, 86, 370–384. [Google Scholar] [CrossRef]
- Mutiibwa, D.; Strachan, S.; Albright, T. Land Surface Temperature and Surface Air Temperature in Complex Terrain. IEEE J. Sel. Top. Appl. Earth Obs. Remote Sens. 2015, 8, 4762–4774. [Google Scholar] [CrossRef]
- Tan, B.Y.; Chew, N.W.; Lee, G.K.; Jing, M.; Goh, Y.; Yeo, L.L.; Zhang, K.; Chin, H.-K.; Ahmad, A.; Khan, F.A.; et al. Psychological Impact of the COVID-19 Pandemic on Health Care Workers in Singapore. Ann. Intern. Med. 2020, 173, 317–320. [Google Scholar] [CrossRef]
- Weng, Q.; Lu, D.; Schubring, J. Estimation of land surface temperature–vegetation abundance relationship for urban heat island studies. Remote Sens. Environ. 2004, 89, 467–483. [Google Scholar] [CrossRef]
- Chen, X.-L.; Zhao, H.-M.; Li, P.-X.; Yin, Z.-Y. Remote sensing image-based analysis of the relationship between urban heat island and land use/cover changes. Remote Sens. Environ. 2006, 104, 133–146. [Google Scholar] [CrossRef]
- Buyantuyev, A.; Wu, J. Urban heat islands and landscape heterogeneity: Linking spatiotemporal variations in surface temperatures to land-cover and socioeconomic patterns. Landsc. Ecol. 2009, 25, 17–33. [Google Scholar] [CrossRef]
- Yue, W.; Xu, J.; Tan, W.; Xu, L. The relationship between land surface temperature and NDVI with remote sensing: Application to Shanghai Landsat 7 ETM+ data. Int. J. Remote Sens. 2007, 28, 3205–3226. [Google Scholar] [CrossRef]
- Traore, M.; Lee, M.S.; Rasul, A.; Balew, A. Assessment of land use/land cover changes and their impacts on land surface temperature in Bangui (the capital of Central African Republic). Environ. Chall. 2021, 4, 100114. [Google Scholar] [CrossRef]
- Srinivasan, V.; Seto, K.C.; Emerson, R.; Gorelick, S.M. The impact of urbanization on water vulnerability: A coupled human–environment system approach for Chennai, India. Glob. Environ. Chang. 2013, 23, 229–239. [Google Scholar] [CrossRef]
- Cutter, S.L.; Boruff, B.J.; Shirley, W.L. Social Vulnerability to Environmental Hazards. Soc. Sci. Q. 2003, 84, 242–261. [Google Scholar] [CrossRef]
- Wu, G.; Siegler, S.; Allard, P.; Kirtley, C.; Leardini, A.; Rosenbaum, D.; Whittle, M.; D’Lima, D.D.; Cristofolini, L.; Witte, H.; et al. ISB recommendation on definitions of joint coordinate system of various joints for the reporting of human joint motion—Part I: Ankle, hip, and spine. J. Biomech. 2002, 35, 543–548. [Google Scholar] [CrossRef] [PubMed]
- Aubrecht, C.; Özceylan, D. Identification of heat risk patterns in the U.S. National Capital Region by integrating heat stress and related vulnerability. Environ. Int. 2013, 56, 65–77. [Google Scholar] [CrossRef]
- Lankao, P.R.; Qin, H. Conceptualizing urban vulnerability to global climate and environmental change. Curr. Opin. Environ. Sustain. 2011, 3, 142–149. [Google Scholar] [CrossRef]
- Traoré, S.; Yapi, R.B.; Coulibaly, K.; Mathew, C.; Fokou, G.; Kazwala, R.R.; Bonfoh, B.; Alambedji, R.B. Seroprevalence of brucellosis in small ruminants and related risk behaviours among humans in different husbandry systems in Mali. PLoS ONE 2021, 16, e0245283. [Google Scholar] [CrossRef]
- Salvia, R.; Halbac-Cotoara-Zamfir, R.; Cividino, S.; Salvati, L.; Quaranta, G. From Rural Spaces to Peri-Urban Districts: Metropolitan Growth, Sparse Settlements and Demographic Dynamics in a Mediterranean Region. Land 2020, 9, 200. [Google Scholar] [CrossRef]
- Alston, J.M.; Beddow, J.M.; Pardey, P.G. Agricultural Research, Productivity, and Food Prices in the Long Run. Science 2009, 325, 1209–1210. [Google Scholar] [CrossRef]
- Benelli, P.; Mazurana, D.; Walker, P. Using sex and age disaggregated data to improve humanitarian response in emergencies. Gend. Dev. 2012, 20, 219–232. [Google Scholar] [CrossRef]
- Neumayer, E.; Plümper, T. The Gendered Nature of Natural Disasters: The Impact of Catastrophic Events on the Gender Gap in Life Expectancy, 1981–2002. Ann. Assoc. Am. Geogr. 2007, 97, 551–566. [Google Scholar] [CrossRef]
- World Health Statistics 2014. www.who.int. Available online: https://www.who.int/news/item/15-05-2014-world-health-statistics-2014 (accessed on 17 May 2023).
- Bartlett, S. Climate change and urban children: Impacts and implications for adaptation in low- and middle-income countries. Environ. Urban. 2008, 20, 501–519. [Google Scholar] [CrossRef]
- Zivin, J.G.; Shrader, J. Temperature Extremes, Health, and Human Capital. Future Child. 2016, 26, 31–50. [Google Scholar] [CrossRef]
- Armaș, I.; Gavriș, A. Social vulnerability assessment using spatial multi-criteria analysis (SEVI model) and the Social Vulnerability Index (SoVI model)—A case study for Bucharest, Romania. Nat. Hazards Earth Syst. Sci. 2013, 13, 1481–1499. [Google Scholar] [CrossRef]
- Myers, C.A.; Slack, T.; Singelmann, J. Social vulnerability and migration in the wake of disaster: The case of Hurricanes Katrina and Rita. Popul. Environ. 2008, 29, 271–291. [Google Scholar] [CrossRef]
- IPCC. Climate Change 2014: Synthesis Report. 2014. Available online: https://www.ipcc.ch/site/assets/uploads/2018/05/SYR_AR5_FINAL_full_wcover.pdf (accessed on 17 May 2023).
- Zhang, J.; Wei, Y.; Fang, Z. Ozone Pollution: A Major Health Hazard Worldwide. Front. Immunol. 2019, 10, 2518. [Google Scholar] [CrossRef]
- Appelbaum, A. The ice storm of the century: How hospitals met the challenge. J. Healthc. Prot. Manag. Publ. Int. Assoc. Hosp. Secur. 1999, 15, 115–122. Available online: https://pubmed.ncbi.nlm.nih.gov/10557440/ (accessed on 28 June 2023).
- Kollek, D.; Bezanson, J.; Carby, S.; Chowdhury, S.; Davidson, R.; Dodd, G.; Gazit, V.; Hansen-Taugher, A.; Hayman, M.; Homier, V.; et al. CAEP Position Statement—Hospital disaster preparedness. CJEM 2020, 22, 471–474. [Google Scholar] [CrossRef]
- Christiaensen, L.J.; Subbarao, K. Toward an Understanding of Household Vulnerability in Rural Kenya; Policy Research Working Paper Series; World Bank: Washington, DC, USA, 2004; Available online: https://ideas.repec.org/p/wbk/wbrwps/3326.html (accessed on 28 June 2023).
- Séguin, J.; Berry, P.; Bouchet, V.; Clarke, K.L.; Furgal, C.; Environmental, I.; MacIver, D. Human Health in a Changing Climate: A Canadian Assessment of Vulnerabilities and Adaptive Capacity. Human Health in a Changing Climate, 1; Government of Canada Publications: Dartmouth, NS, Canada, 2008; Available online: https://publications.gc.ca/collections/collection_2008/hc-sc/H128-1-08-528E.pdf (accessed on 17 May 2023).
- Chatterjee, I.; Li, I.; Robitaille, M.-C. An overview of India’s primary school education policies and outcomes 2005–2011. World Dev. 2018, 106, 99–110. [Google Scholar] [CrossRef]
- Rao, T.V.; Varghese, S. Trends and challenges of developing human capital in India. Hum. Resour. Dev. Int. 2009, 12, 15–34. [Google Scholar] [CrossRef]
- Gbetibouo, G.A.; Ringler, C.; Hassan, R. Vulnerability of the South African farming sector to climate change and variability: An indicator approach. Nat. Resour. Forum 2010, 34, 175–187. [Google Scholar] [CrossRef]
- Kleerekoper, L.; Van Esch, M.; Salcedo, T.B. How to make a city climate-proof, addressing the urban heat island effect. Resour. Conserv. Recycl. 2012, 64, 30–38. [Google Scholar] [CrossRef]
- Peña, M.A. Relationships between remotely sensed surface parameters associated with the urban heat sink formation in Santiago, Chile. Int. J. Remote Sens. 2008, 29, 4385–4404. [Google Scholar] [CrossRef]
- Espinoza, S.; Pablo; Martín-Vide, J. El estudio de la isla de calor urbana de superficie del área metropolitana de santiago de chile con imágenes terra-MODIS y análisis de componentes principales. Rev. De Geogr. Norte Gd. 2014, 57, 123–141. [Google Scholar] [CrossRef]
- Gupta, A.K.; Negi, M.; Nandy, S.; Alatalo, J.M.; Singh, V.; Pandey, R. Assessing the vulnerability of socio-environmental systems to climate change along an altitude gradient in the Indian Himalayas. Ecol. Indic. 2019, 106, 105512. [Google Scholar] [CrossRef]
- Reckien, D. Weather extremes and street life in India—Implications of Fuzzy Cognitive Mapping as a new tool for semi-quantitative impact assessment and ranking of adaptation measures. Glob. Environ. Chang. 2014, 26, 1–13. [Google Scholar] [CrossRef]
- Roy, A. Why India Cannot Plan Its Cities: Informality, Insurgence and the Idiom of Urbanization. Plan. Theory 2009, 8, 76–87. [Google Scholar] [CrossRef]
- Farooq, M.; Singh, S.K.; Kanga, S. Mainstreaming adaptation strategies in relevant flagship schemes to overcome vulnerabilities of climate change to agriculture sector. Res. J. Agric. Sci. Int. J. 2021, 12, 637–646. [Google Scholar]


| Indicators | Dimension | Functional Relationship with Vulnerability | Rationale for Selection | Source Data | References |
|---|---|---|---|---|---|
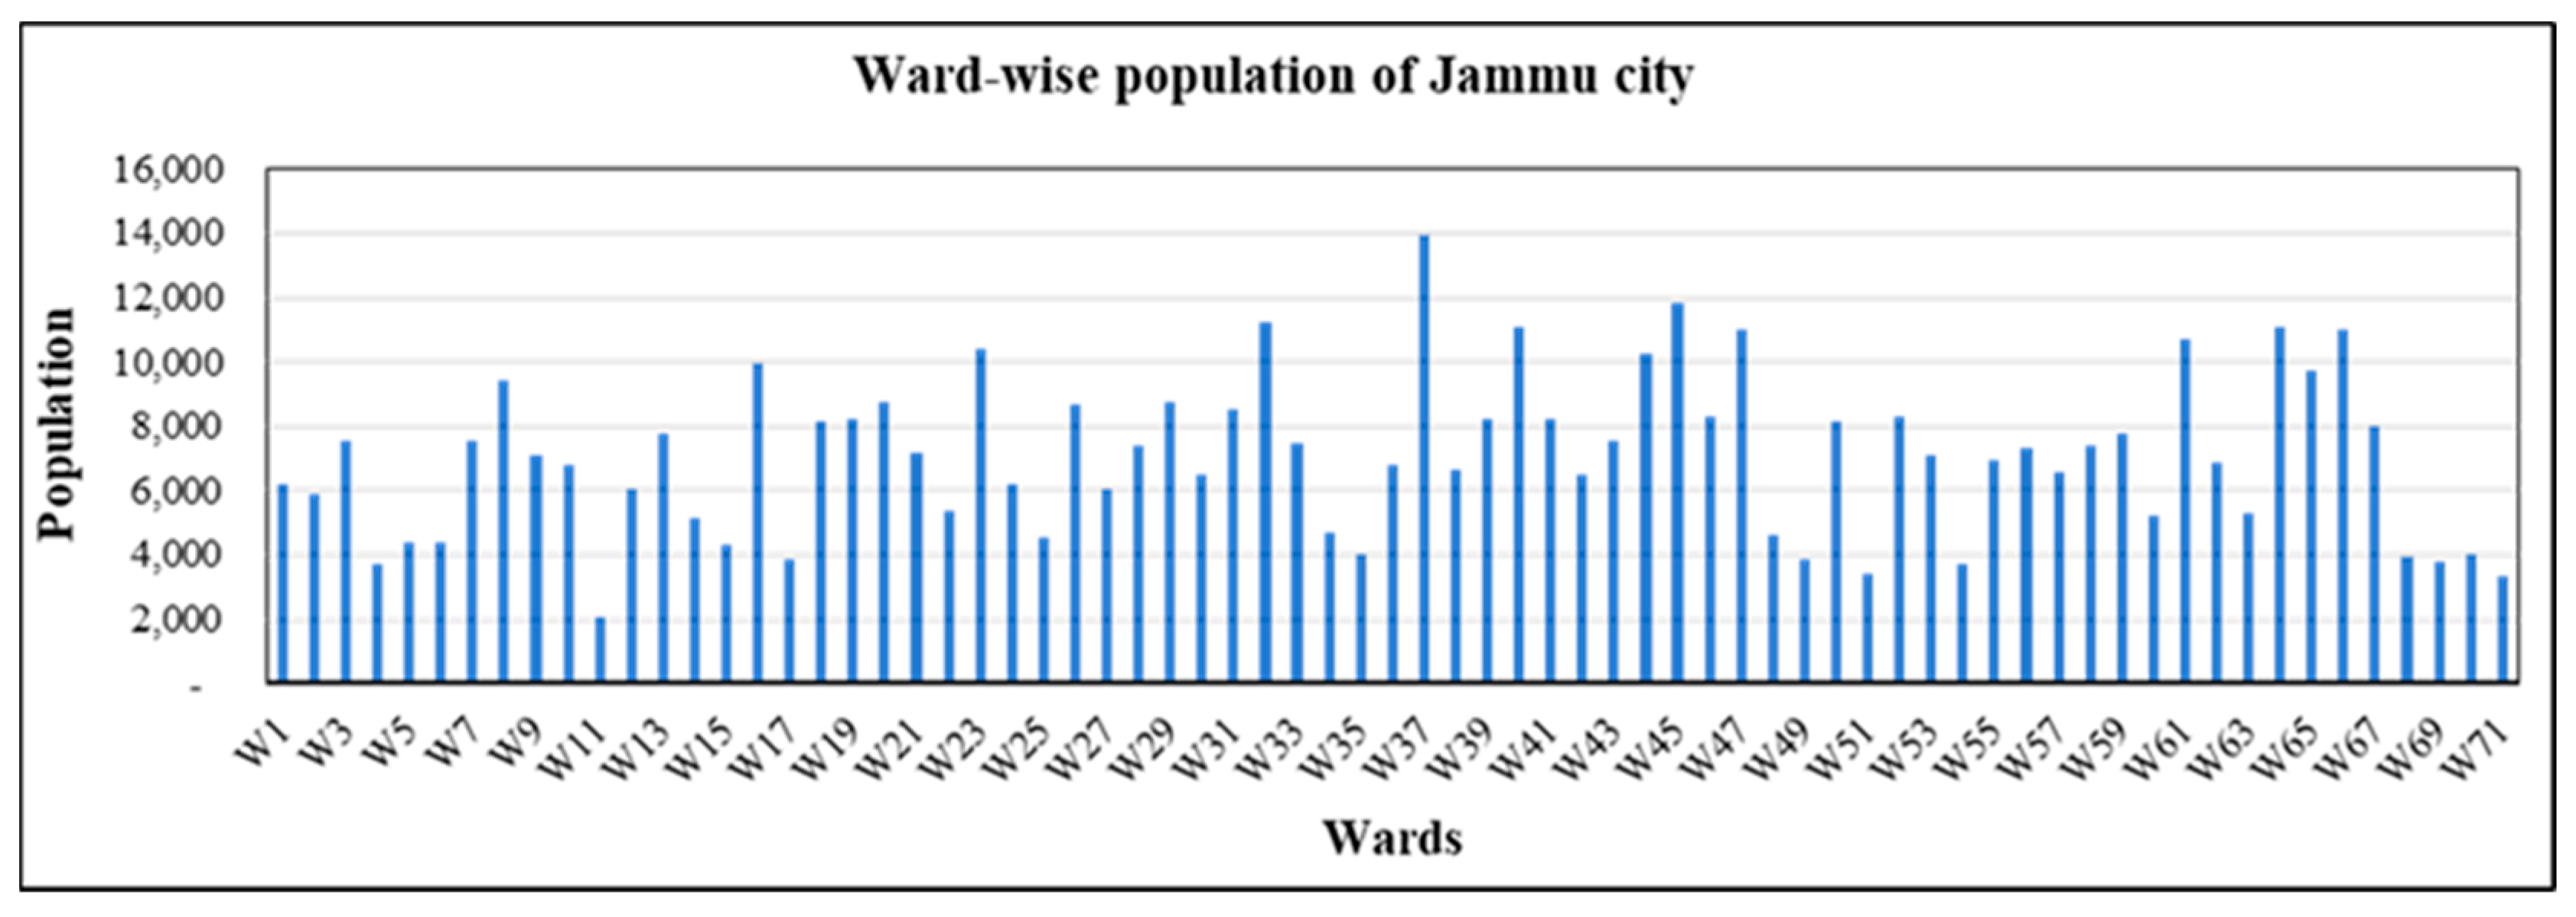
| Population | Exposure | Positive | Higher population increases vulnerability to hazards. | Census of India | [40,41] |
| LST | LST is a common indicator for heat exposure, and the increasing intensity and frequency of heatwaves pose significant environmental and health concerns. | USGS | [42] | ||
| Population density | High population density indicates that more people are vulnerable to any hazard. | Census of India | [43] | ||
| Area of Ward | The ward area serves as an exposure variable to assess the extent of risk in any type of extreme event. | Municipal Boundary | [44] | ||
| Very Young Population | Sensitivity | Positive | Children under 6 years are vulnerable to health, dependency, and disasters. | District Census Handbook | [45,46] |
| Female Population | Females, particularly those who are pregnant, are more vulnerable to any form of threat than men. | District Census Handbook | [47,48] | ||
| SC and ST Population | Due to historical discrimination, social exclusion, economic inequality, and limited access to opportunities, Scheduled Castes (SC) and Scheduled Tribes (ST) are particularly vulnerable, demanding targeted interventions for equitable development. | District Census Handbook | [27,49] | ||
| Illiterate Population | Illiterate persons are susceptible to any form of risk occurrence, because they are unaware of the potential dangers associated with these events. | District Census Handbook | [50,51] | ||
| Dependency on Agriculture | The agriculture sector as a source of livelihood is extremely sensitive to vagaries of weather and any variability can lead to loss of productivity, affecting livelihood and food security. | District Census Handbook | [52,53] | ||
| Non-Workers | People’s unemployment status is linked to poverty, making them vulnerable. | District Census Handbook | [54,55] | ||
| Kacha Structures | In the absence of a better-quality house, households may face increased vulnerability to the risks posed by extreme conditions, considering its role as an indicator of socioeconomic status. | District Census Handbook | [56,57] | ||
| Average size of Household | Greater household size indicates more social diversity and potentially varying vulnerability levels, especially in densely populated urban areas. This can increase demand for critical infrastructure and services, straining them during and after hazard events. | District Census Handbook | [58,59] | ||
| Built-up | Densely built-up areas and infrastructure with limited space and escapes routes lead to vulnerability. | USGS | [56,60] | ||
| Literacy Population | Adaptive Capacity | Negative | Literate people have a negative relation with Vulnerability; because of their enhanced knowledge and abilities, educated people confront risks and challenges. | District Census Handbook | [13,27] |
| Home Ownership | Homeowners are less vulnerable due to increased stability, security, and asset protection. | District Census Handbook | [61,62] | ||
| Household assets | Households owning assets such as a car, a bicycle, a banking facility, internet access, and other appliances like a computer are considered less vulnerable due to increased mobility, financial inclusion, connectivity, and access to information and resources, contributing to overall resilience. | District Census Handbook | [63,64] | ||
| Pucca and Semi-pucca structures | Possession of a better–quality house will improve the capacity of households to withstand the risks from any extreme conditions. | District Census Handbook | [56,65] | ||
| Sanitation | Sanitary amenities, including bathrooms and efficient waste management, contribute to community health. Robust individual health enhances resilience to environmental shocks, facilitating adept adjustment to evolving conditions. | District Census Handbook | [66,67] | ||
| Electricity | Access to electricity allows better functioning of television, radios, mobile phones, and modern technologies, thereby improving access to relevant information which enables people to make informed decisions and to take proactive adaptation measures against any risk. | District Census Handbook | [65,68,69,70] | ||
| Safe drinking water | Water is a critical resource both for domestic consumption and agriculture. Hence, access to water resources and the quality of water for household use is one of the important assets in any community. | District Census Handbook | [71,72] | ||
| Health institution | Access to functional healthcare infrastructure is essential for the overall health and well-being of any community. | District Census Handbook | [44,73,74] | ||
| NDVI | Green cover in cities and towns serves to balance temperatures, counteracting urban heat, and providing a mitigation effect on the heat environment. The absence of green space can elevate the risk of higher heat exposure. | USGS | [75,76] |
| Land Use Classes | 2021 (Area) | |
|---|---|---|
| sq.km | (%) | |
| Built up | 64.5 | 89.5 |
| Agriculture | 5 | 7 |
| Forest | 1.8 | 2.5 |
| Water bodies | 0.3 | 0.5 |
| Wasteland | 0.3 | 0.5 |
| Total | 72 | 100 |
| NDVI | Range | Area | |
|---|---|---|---|
| sq.km | % | ||
| Very Low | −0.04–0.10 | 15.8 | 22.0 |
| Low | 0.1–0.14 | 20.8 | 28.8 |
| Moderate | 0.14–0.18 | 19.0 | 26.4 |
| High | 0.18–0.23 | 12.6 | 17.6 |
| Very High | 0.23–0.48 | 3.8 | 5.2 |
| Total | 72.0 | 100.0 | |
| LST | Range (°C) | Area | |
|---|---|---|---|
| sq.km | % | ||
| Very Low | 32.96–33.46 | 2.8 | 3.9 |
| Low | 33.62–34.05 | 12.9 | 17.9 |
| Moderate | 34.05–34.42 | 27.5 | 38.2 |
| High | 34.42–34.87 | 24.0 | 33.3 |
| Very High | 34.87–35.72 | 4.8 | 6.7 |
| Total | 72.0 | 100.0 | |
| Classes | Range (E) | Area (E) | Range (S) | Area (S) | Range (AC) | Area (AC) | Range (VI) | Area (VI) | ||||
|---|---|---|---|---|---|---|---|---|---|---|---|---|
| sq.km | % | sq.km | % | sq.km | % | sq.km | % | |||||
| Very Low | 0.15–0.22 | 5.26 | 7.29 | 0.04–0.16 | 6.93 | 9.62 | 0.14–0.24 | 8.6 | 12.0 | 0.29–0.33 | 9.77 | 13.55 |
| Low | 0.22–0.28 | 14.17 | 19.66 | 0.16–0.24 | 11.85 | 16.45 | 0.24–0.33 | 27.3 | 37.9 | 0.33–0.39 | 11.35 | 15.75 |
| Moderate | 0.28–0.34 | 11.89 | 16.50 | 0.24–0.33 | 27.72 | 38.46 | 0.33–0.41 | 16.9 | 23.4 | 0.39–0.42 | 14.42 | 20.00 |
| High | 0.34–0.43 | 29.39 | 40.78 | 0.33–0.46 | 22.88 | 31.75 | 0.41–0.54 | 12.4 | 17.3 | 0.42–0.48 | 18.38 | 25.49 |
| Very High | 0.43–0.55 | 11.36 | 15.76 | 0.46–0.63 | 2.69 | 3.73 | 0.54–0.64 | 6.8 | 9.4 | 0.48–0.59 | 18.15 | 25.17 |
| Total | - | 72 | 100 | - | 72 | 100 | - | 72 | 100 | - | 72 | 100 |
Disclaimer/Publisher’s Note: The statements, opinions and data contained in all publications are solely those of the individual author(s) and contributor(s) and not of MDPI and/or the editor(s). MDPI and/or the editor(s) disclaim responsibility for any injury to people or property resulting from any ideas, methods, instructions or products referred to in the content. |
© 2024 by the authors. Licensee MDPI, Basel, Switzerland. This article is an open access article distributed under the terms and conditions of the Creative Commons Attribution (CC BY) license (https://creativecommons.org/licenses/by/4.0/).
Share and Cite
Bharti, S.; Haq, A.U.; Guite, L.T.S.; Kanga, S.; Mushtaq, F.; Farooq, M.; Singh, S.K.; Kumar, P.; Meraj, G. Development of Inherent Vulnerability Index within Jammu Municipal Limits, India. Climate 2024, 12, 12. https://doi.org/10.3390/cli12010012
Bharti S, Haq AU, Guite LTS, Kanga S, Mushtaq F, Farooq M, Singh SK, Kumar P, Meraj G. Development of Inherent Vulnerability Index within Jammu Municipal Limits, India. Climate. 2024; 12(1):12. https://doi.org/10.3390/cli12010012
Chicago/Turabian StyleBharti, Simran, Adyan Ul Haq, L. T. Sasang Guite, Shruti Kanga, Fayma Mushtaq, Majid Farooq, Suraj Kumar Singh, Pankaj Kumar, and Gowhar Meraj. 2024. "Development of Inherent Vulnerability Index within Jammu Municipal Limits, India" Climate 12, no. 1: 12. https://doi.org/10.3390/cli12010012
APA StyleBharti, S., Haq, A. U., Guite, L. T. S., Kanga, S., Mushtaq, F., Farooq, M., Singh, S. K., Kumar, P., & Meraj, G. (2024). Development of Inherent Vulnerability Index within Jammu Municipal Limits, India. Climate, 12(1), 12. https://doi.org/10.3390/cli12010012