
Assessment of Changes in Agroclimatic Resources of the Republic of Bashkortostan (Russia) under the Context of Global Warming

 , , , ,
Abstract
1. Introduction
2. Materials and Methods
3. Results
4. Discussion
5. Conclusions
Author Contributions
Funding
Data Availability Statement
Conflicts of Interest
References
- Deng, K.Q.; Azorin-Molina, C.; Yang, S.; Hu, C.D.; Zhang, G.F.; Minola, L.; Vicente-Serrano, S.; Chen, D. Shifting of Summertime Weather Extremes in Western Europe during 2012–2020. Adv. Clim. Chang. Res. 2022, 13, 218–227. [Google Scholar] [CrossRef]
- Akimov, L.M. Trends in the Change of the Thermal Regime in Arid and Adjacent Territories of the European Part of Russia in the Summer Period. Arid Ecosyst. 2021, 27, 3–12. [Google Scholar] [CrossRef]
- Lysenko, S.A.; Loginov, V.F. Multidecadal Oscillations of Temperature and Humidity Characteristics on the Territory of Belarus. Issues Probl. Hydrometeorol. Dr. 2020, 4, 39–50. [Google Scholar]
- Perry, K.; Legg, W. Sustainable Management of Water Resources in Agriculture; Organisation for Economic Co-Operation and Development: Paris, France, 2010; p. 120. [Google Scholar]
- Dosio, A.; Spinoni, J.; Migliavacca, M. Record-Breaking and Unprecedented Compound Hot and Dry Summers in Europe under Different Emission Scenarios. Environ. Res. Clim. 2023, 2, 045009. [Google Scholar] [CrossRef]
- Omar, M.E.D.M.; Moussa, A.M.A.; Hinkelmann, R. Impacts of Climate Change on Water Quantity, Water Salinity, Food Security, and Socioeconomy in Egypt. Water Sci. Eng. 2021, 14, 17–27. [Google Scholar] [CrossRef]
- Liu, Y.; Liu, Y.; Wang, W.; Fan, X.; Cui, W. Soil Moisture Droughts in East Africa: Spatiotemporal Patterns and Climate Drivers. J. Hydrol. Reg. Stud. 2022, 40, 101013. [Google Scholar] [CrossRef]
- Shiferaw, B.; Tesfaye, K.; Kassie, M.; Abate, T.; Prasanna, B.M.; Menkir, A. Managing Vulnerability to Drought and Enhancing Livelihood Resilience in Sub-Saharan Africa: Technological, Institutional and Policy Options. Weather Clim. Extrem. 2014, 3, 67–79. [Google Scholar] [CrossRef]
- Chalchissa, F.B.; Diga, G.M.; Feyisa, G.L.; Tolossa, A.R. Geospatial Variabilities and Trends in Extreme Agroclimatic Indicators in the Jimma Zone, Southwest Ethiopia. Theor. Appl. Climatol. 2024, 155, 229–247. [Google Scholar] [CrossRef]
- Karimi, V.; Karami, E.; Keshavarz, M. Climate Change and Agriculture: Impacts and Adaptive Responses in Iran. J. Integr. Agric. 2018, 17, 1–15. [Google Scholar] [CrossRef]
- Nissan, H.; Muñoz, Á.G.; Mason, S.J. Targeted Model Evaluations for Climate Services: A Case Study on Heat Waves in Bangladesh. Clim. Risk Manag. 2020, 28, 100213. [Google Scholar] [CrossRef]
- Angom, J.; Viswanathan, P.K.; Ramesh, M.V. The Dynamics of Climate Change Adaptation in India: A Review of Climate Smart Agricultural Practices among Smallholder Farmers in Aravalli District, Gujarat, India. Curr. Res. Environ. Sustain. 2021, 3, 100039. [Google Scholar] [CrossRef]
- Yang, Y.; Maraun, D.; Ossó, A.; Tang, J. Increased Spatial Extent and Likelihood of Compound Long-Duration Dry and Hot Events in China, 1961–2014. Nat. Hazards Earth Syst. Sci. 2023, 23, 693–709. [Google Scholar] [CrossRef]
- Hao, Z.; Hao, F.; Xia, Y.; Feng, S.; Sun, C.; Zhang, X.; Fu, Y.; Hao, Y.; Zhang, Y.; Meng, Y. Compound Droughts and Hot Extremes: Characteristics, Drivers, Changes, and Impacts. Earth-Sci. Rev. 2022, 235, 104241. [Google Scholar] [CrossRef]
- Arnell, N.W.; Freeman, A. The Effect of Climate Change on Agro-Climatic Indicators in the UK. Clim. Chang. 2021, 165, 1–26. [Google Scholar] [CrossRef]
- Pavlova, V.N.; Perevodchikov, Y.P.; Karachentsova, A.A.; Tagirov, M.S.; Mirsaeva, N.A. Assessment of Agro-Climatic Resources and Yield of Spring Wheat in the Republic of Tatarstan. Meteorol. Hydrol. 2023, 1, 90–102. [Google Scholar] [CrossRef]
- Georgopoulou, E.; Mirasgedis, S.; Sarafidis, Y.; Vitaliotou, M.; Lalas, D.P.; Theloudis, I.; Giannoulaki, K.D.; Dimopoulos, D.; Zavras, V. Climate Change Impacts and Adaptation Options for the Greek Agriculture in 2021–2050: A Monetary Assessment. Clim. Risk Manag. 2017, 16, 164–182. [Google Scholar] [CrossRef]
- Ajjur, S.B.; Al-Ghamdi, S.G. Towards Sustainable Energy, Water and Food Security in Qatar under Climate Change and Anthropogenic Stresses. Energy Rep. 2022, 8, 514–518. [Google Scholar] [CrossRef]
- Guo, C.; Dai, H.; Liu, X.; Wu, Y.; Liu, X.; Liu, Y. Impacts of Climate Change Mitigation on Agriculture Water Use: A Provincial Analysis in China. Geogr. Sustain. 2020, 1, 189–199. [Google Scholar] [CrossRef]
- Qi, W.; Feng, L.; Yang, H.; Liu, J. Warming Winter, Drying Spring and Shifting Hydrological Regimes in Northeast China under Climate Change. J. Hydrol. 2022, 606, 127390. [Google Scholar] [CrossRef]
- Syed, A.; Raza, T.; Bhatti, T.T.; Eash, N.S. Climate Impacts on the Agricultural Sector of Pakistan: Risks and Solutions. Environ. Chall. 2022, 6, 100433. [Google Scholar] [CrossRef]
- Agyeman, R.Y.K.; Huo, F.; Li, Z.; Li, Y. Projected Changes in the Hotspots for Agriculturally Relevant Compound Events in Western Canada Cropping Regions under the RCP8.5 Scenario. Q. J. R. Meteorol. Soc. 2023, 149, 830–842. [Google Scholar] [CrossRef]
- Chipanshi, A.; Berry, M.; Zhang, Y.; Qian, B.; Steier, G. Agroclimatic Indices across the Canadian Prairies under a Changing Climate and Their Implications for Agriculture. Int. J. Climatol. 2022, 42, 2351–2367. [Google Scholar] [CrossRef]
- del Barrio, R.; Fernandez, E.; Brendel, A.S.; Whitney, C.; Campoy, J.A.; Luedeling, E. Climate Change Impacts on Agriculture’s Southern Frontier—Perspectives for Farming in North Patagonia. Int. J. Climatol. 2021, 41, 726–742. [Google Scholar] [CrossRef]
- Camarero, J.J.; Campelo, F.; Colangelo, M.; Valeriano, C.; Knorre, A.; Solé, G.; Rubio-Cuadrado, Á. Decoupled leaf-wood phenology in two pine species from contrasting climates: Longer growing seasons do not mean more radial growth. Agric. For. Meteorol. 2022, 327, 109223. [Google Scholar] [CrossRef]
- Szyga-Pluta, K. Assessment of Changing Agroclimatic Conditions in Poland Based on Selected Indicators. Atmosphere 2022, 13, 1232. [Google Scholar] [CrossRef]
- Ruosteenoja, K.; Räisänen, J.; Pirinen, P. Projected changes in thermal seasons and the growing season in Finland. Int. J. Climatol. 2011, 31, 1473–1487. [Google Scholar] [CrossRef]
- Kang, J.; Yang, Z.; Yu, B.; Ma, Q.; Jiang, S.; Shishov, V.V.; Zhou, P.; Huang, J.-G.; Ding, X. An earlier start of growing season can affect tree radial growth through regulating cumulative growth rate. Agric. For. Meteorol. 2023, 342, 109738. [Google Scholar] [CrossRef]
- Khan, V.M.; Vilfand, R.M.; Tishenko, V.A.; Emelina, S.V.; Gritsun, A.S.; Volodin, E.M.; Vorobiova, V.V.; Tarasevich, M.A. Assessment of changes in the temperature regime of Northern Eurasia for the next five years according to the INM RAS Earth system model forecasts and their possible consequences for agriculture. Russ. Meteorol. Hydrol. 2023, 9, 14–28. [Google Scholar] [CrossRef]
- Dai, S.; Shulski, M.D.; Hubbard, K.G.; Takle, E.S. A spatiotemporal analysis of Midwest US temperature and precipitation trends during the growing season from 1980 to 2013. Int. J. Climatol. 2016, 36, 517–525. [Google Scholar] [CrossRef]
- Chen, X.; Pan, W. Relationships among phenological growing season, time-integrated normalized difference vegetation index and climate forcing in the temperate region of eastern China. Int. J. Climatol. 2002, 22, 1781–1792. [Google Scholar] [CrossRef]
- AR6 IPCC. Climate Change 2021: The Physical Science Basis. Available online: https://www.ipcc.ch/assessment-report/ar6/ (accessed on 2 November 2023).
- Cherenkovaa, E.A.; Semenova, V.A. A New Approach to Identifying the Influence of Climate Extreme on the Reduction of Wheat Yield in the South of European Russia. Dokl. Earth Sci. 2021, 500, 88–94. [Google Scholar] [CrossRef]
- Semenov, S.M. (Ed.) Methods for Assessing the Effects of Climate Change on Physical and Biological Systems; Roshydromet: Moscow, Russia, 2012; p. 512. [Google Scholar]
- Pavlova, V.N.; Karachenkova, A.A. Observed Climate Changes and Dynamics of Agro-Climatic Resources in the XX-XXI Centuries on the Territory of the Volga Federal District. Proc. Main Geophys. Obs. Named A. I. Voeykov 2016, 583, 112–128. [Google Scholar]
- Sinitsina, N.I.; Goltsberg, I.A.; Strunnikov, E.A. Agroclimatology; Hydrometeoizdat: Leningrad, Russia, 1973; p. 344. [Google Scholar]
- Galimova, R.G. Analysis of Changes in Temperature and Humidity Regime in the Republic of Bashkortostan in Recent Period. Bull. Udmurt Univ. Ser. Biol. Earth Sci. 2020, 30, 83–93. [Google Scholar] [CrossRef]
- Territorial Body of the Federal State Statistics Service for the Republic of Bashkortostan. Available online: https://02.rosstat.gov.ru/storage/mediabank/Mesto-Respubliki-Bashkortostan-sredi-subektov-Rossiyskoy-Federacii-za-2022-god.pdf (accessed on 10 August 2023).
- Lamy, K.; Portafaix, T.; Josse, B.; Brogniez, C.; Godin-beekmann, S.; Revell, L.; Akiyoshi, H.; Bekki, S.; Hegglin, M.I.; Deushi, M.; et al. Ultraviolet Radiation Modelling Using Output from the Chemistry Climate Model Initiative. Atmos. Chem. Phys. 2018, 19, 10087–10110. [Google Scholar] [CrossRef]
- Federal State Statistics Service/Republic of Bashkortostan/Agriculture, Hunting and Forestry. Available online: http://bashstat.gks.ru/wps/wcm/connect/rosstat_ts/bashstat/ru/statistics/enterprises/agriculture/ (accessed on 1 August 2023).
- Guidelines of the World Meteorological Organization for the Calculation of Climate Norms. Available online: https://library.wmo.int/doc_num.php?explnum_id=4168 (accessed on 1 August 2023).
- Sadokov, V.P.; Neushkin, A.I.; Kozeltseva, V.F.; Kuznetsova, N.N. Summer Drought (May–August 1949–1999) on the Territory of the Former USSR. Proc. GMC RF 2001, 336, 3–33. [Google Scholar]
- Edelgeriev, R.S.-H. National Report “Global Climate and Soil Cover of Russia: Manifestations of Drought, Prevention, Control Measures, Elimination of Consequences and Adaptive Measures (Agriculture and Forestry)”; Limited Liability Company “MBA Publishing House”: Moscow, Russia, 2021; p. 700. [Google Scholar]
- Galimova, R.G.; Perevedentsev, Y.P.; Yanaev, G.A. Agro-Climatic Resources of the Republic of Bashkortostan. Proc. Vor. State Univ. Ser. Geogr. Geoecology 2019, 3, 29–39. [Google Scholar]
- Perevedentsev, Y.P.; Sharipova, R.B.; Vazhnova, N.A. Agroclimatic Resources of the Ulyanovsk Region and Their Impact on the Yield of Crops. Bull. Udmurt Univ. Ser. Biol. Earth Sci. 2012, 2, 120–126. [Google Scholar]
- Nobakht, M.; Beavis, P.; O’Hara, S.; Hutjes, R.; Supit, I. Agroclimatic Indicators from 1951 to 2099 Derived from Climate Projections; 2019. Copernicus Climate Change Service (C3S) Climate Data Store (CDS). Available online: https://cds.climate.copernicus.eu/cdsapp#!/dataset/10.24381/cds.dad6e055?tab=overview (accessed on 23 November 2023).
- Materials of the Bashkir Department of Hydrometeorology and Environmental Monitoring, 1961–2020.
- Komissarov, A.V.; Khafizov, A.R.; Ishbulatov, M.G.; Khazipova, A.F. Current State and Prospects for the Development of Irrigated Agriculture in the Republic of Bashkortostan. Melior. Water Manag. 2022, 1, 22–26. [Google Scholar] [CrossRef]
- Meladze, G.; Meladze, M. Agroclimatic Zone Scenarios of the Distribution of Crops with Account of Global Warming. Bull. Georgian Natl. Acad. Sci. 2009, 1, 151–155. [Google Scholar]
- Maurya, H.K.; Joshi, N.; Swami, D.; Suryavanshi, S. Change in Temperature Extremes over India Under 1.5 °C and 2 °C Global Warming Targets. Theor. Appl. Climatol. 2023, 152, 57–73. [Google Scholar] [CrossRef]
- Agyeman, R.; Huo, F.; Li, Z.; Li, Y. Modeled Changes in Selected Agroclimatic Indices over the Croplands of Western Canada under the RCP8.5 Scenario. Q. J. R. Meteorol. Soc. 2021, 152, 4188. [Google Scholar] [CrossRef]
- Chalchissa, F.B. Assessments of Extreme Agroclimatic Indicators and Climate. Ph.D. Thesis, Jimma University, Jima, Ethiopian, 2023. [Google Scholar]
- Peng, S.; Huang, J.; Sheehy, J.E.; Laza, R.C.; Visperas, R.M.; Zhong, X.; Centeno, G.S.; Khush, G.S.; Cassman, K.G. Rice Yields Decline with Higher Night Temperature from Global Warming. Proc. Natl. Acad. Sci. USA 2004, 101, 9971–9975. [Google Scholar] [CrossRef]
- Vogel, E.; Donat, M.G.; Alexander, L.V.; Meinshausen, M.; Ray, D.K.; Karoly, D.; Meinshausen, N.; Frieler, K. The Effects of Climate Extremes on Global Agricultural Yields. Environ. Res. Lett. 2019, 14, 054010. [Google Scholar] [CrossRef]
- Hatfield, J.L.; Prueger, J.H. Temperature Extremes: Effect on Plant Growth and Development. Weather Clim. Extrem. 2015, 10, 4–10. [Google Scholar] [CrossRef]
- Meladze, G.; Meladze, M. Influence of Global Warming on Agroclimatic Indices of Agriculture and Intensity of Droughts in Kakheti Region, East Georgia. Bull. Georg. Natl. Acad. Sci. 2016, 10, 97–104. [Google Scholar]
- Carew, R.; Meng, T.; Florkowski, W.J.; Smith, R.; Blair, D. Climate Change Impacts on Hard Red Spring Wheat Yield and Production Risk: Evidence from Manitoba, Canada. Can. J. Plant Sci. 2017, 98, 782–795. [Google Scholar] [CrossRef]
- Meng, T.; Carewa, R.; Florkowski, W.J.; Klepacka, A.M. Analyzing Temperature and Precipitation Influences on Yield Distributions of Canola and Spring Wheat in Saskatchewan. J. Appl. Meteorol. Climatol. 2017, 56, 897–913. [Google Scholar] [CrossRef]
- Agyeman, R.Y.K.; Huo, F.; Li, Z.; Li, Y.; Elshamy, M.E.; Hwang, Y. Impact of Climate Change under the RCP8.5 Emission Scenario on Multivariable Agroclimatic Indices in Western Canada from Convection-Permitting Climate Simulation. Anthropocene 2023, 44, 100408. [Google Scholar] [CrossRef]
- Trnka, M.; Balek, J.; Brázdil, R.; Dubrovský, M.; Eitzinger, J.; Hlavinka, P.; Chuchma, F.; Možný, M.; Prášil, I.; Růžek, P.; et al. Observed Changes in the Agroclimatic Zones in the Czech Republic between 1961 and 2019. Plant Soil Environ. 2021, 67, 154–163. [Google Scholar] [CrossRef]
- Graczyk, D.; Kundzewicz, Z.W. Changes of Temperature-Related Agroclimatic Indices in Poland. Theor. Appl. Climatol. 2016, 124, 401–410. [Google Scholar] [CrossRef]
- Pavlova, V.N.; Karachenkova, A.A. Assessment of Changes in Climate-Based Productivity of Summer Wheat in the Main Regions of Its Cultivation in Russia. Fundam. Appl. Climatol. 2020, 4, 68–87. [Google Scholar] [CrossRef]
- Pavlova, V.N.; Karachenkova, A.A.; Varcheva, S.E. Regional Monitoring of Agro-Climatic Conditions of Crop Formation under Climate Change. Proc. Main Geophys. Obs. Named A. I. Voeykov 2020, 596, 55–77. [Google Scholar]
- Nikitin, S.N.; Sharipova, R.B. Assessment of Change of Agroclimatic Potential of Ulyanovsk Region for Plant Production. Vestn. Ulyanovsk. State Agric. Acad. 2022, 230, 36–42. [Google Scholar] [CrossRef]
- The Third Assessment Report on Climate Change and Its Consequences on the Territory of the Russian Federation. General Summary; High-Tech Technologies: St. Petersburg, Russia, 2022; p. 124.
- Zhao, J.; Wang, Z. Future Trends of Water Resources and Influences on Agriculture in China. PLoS ONE 2020, 15, e0231671. [Google Scholar] [CrossRef]
- Robinson, E.L.; Huntingford, C.; Semeena, V.S.; Bullock, J.M. CHESS-SCAPE: High-Resolution Future Projections of Multiple Climate Scenarios for the United Kingdom Derived from Downscaled United Kingdom Climate Projections 2018 Regional Climate Model Output. Earth Syst. Sci. Data 2023, 15, 5371–5401. [Google Scholar] [CrossRef]


| Season of the Year | Si Gradations | Weather and Climate Conditions |
|---|---|---|
| Warm period | Si ≥ 3 | severe drought |
| 3 > Si > 2 | average drought | |
| 1 < Si ≤ 2 | dry conditions (mild drought) | |
| −1 ≤ Si ≤ 1 | normal moisturising conditions | |
| −2 ≤ Si < −1 | humid conditions (low excessive moisture) | |
| −3 < Si < −2 | medium excessive moisturisation | |
| Si ≤ −3 | severe overhydration | |
| Cold period | Si > 2 | warm and snowy winter |
| Si < −2 | cold and snowy winter |
| Agro-Climatic Indicator | Mean, °C | Maximum, °C (Year) | Minimum, °C (Year) | TLSC, °C/10 Years |
|---|---|---|---|---|
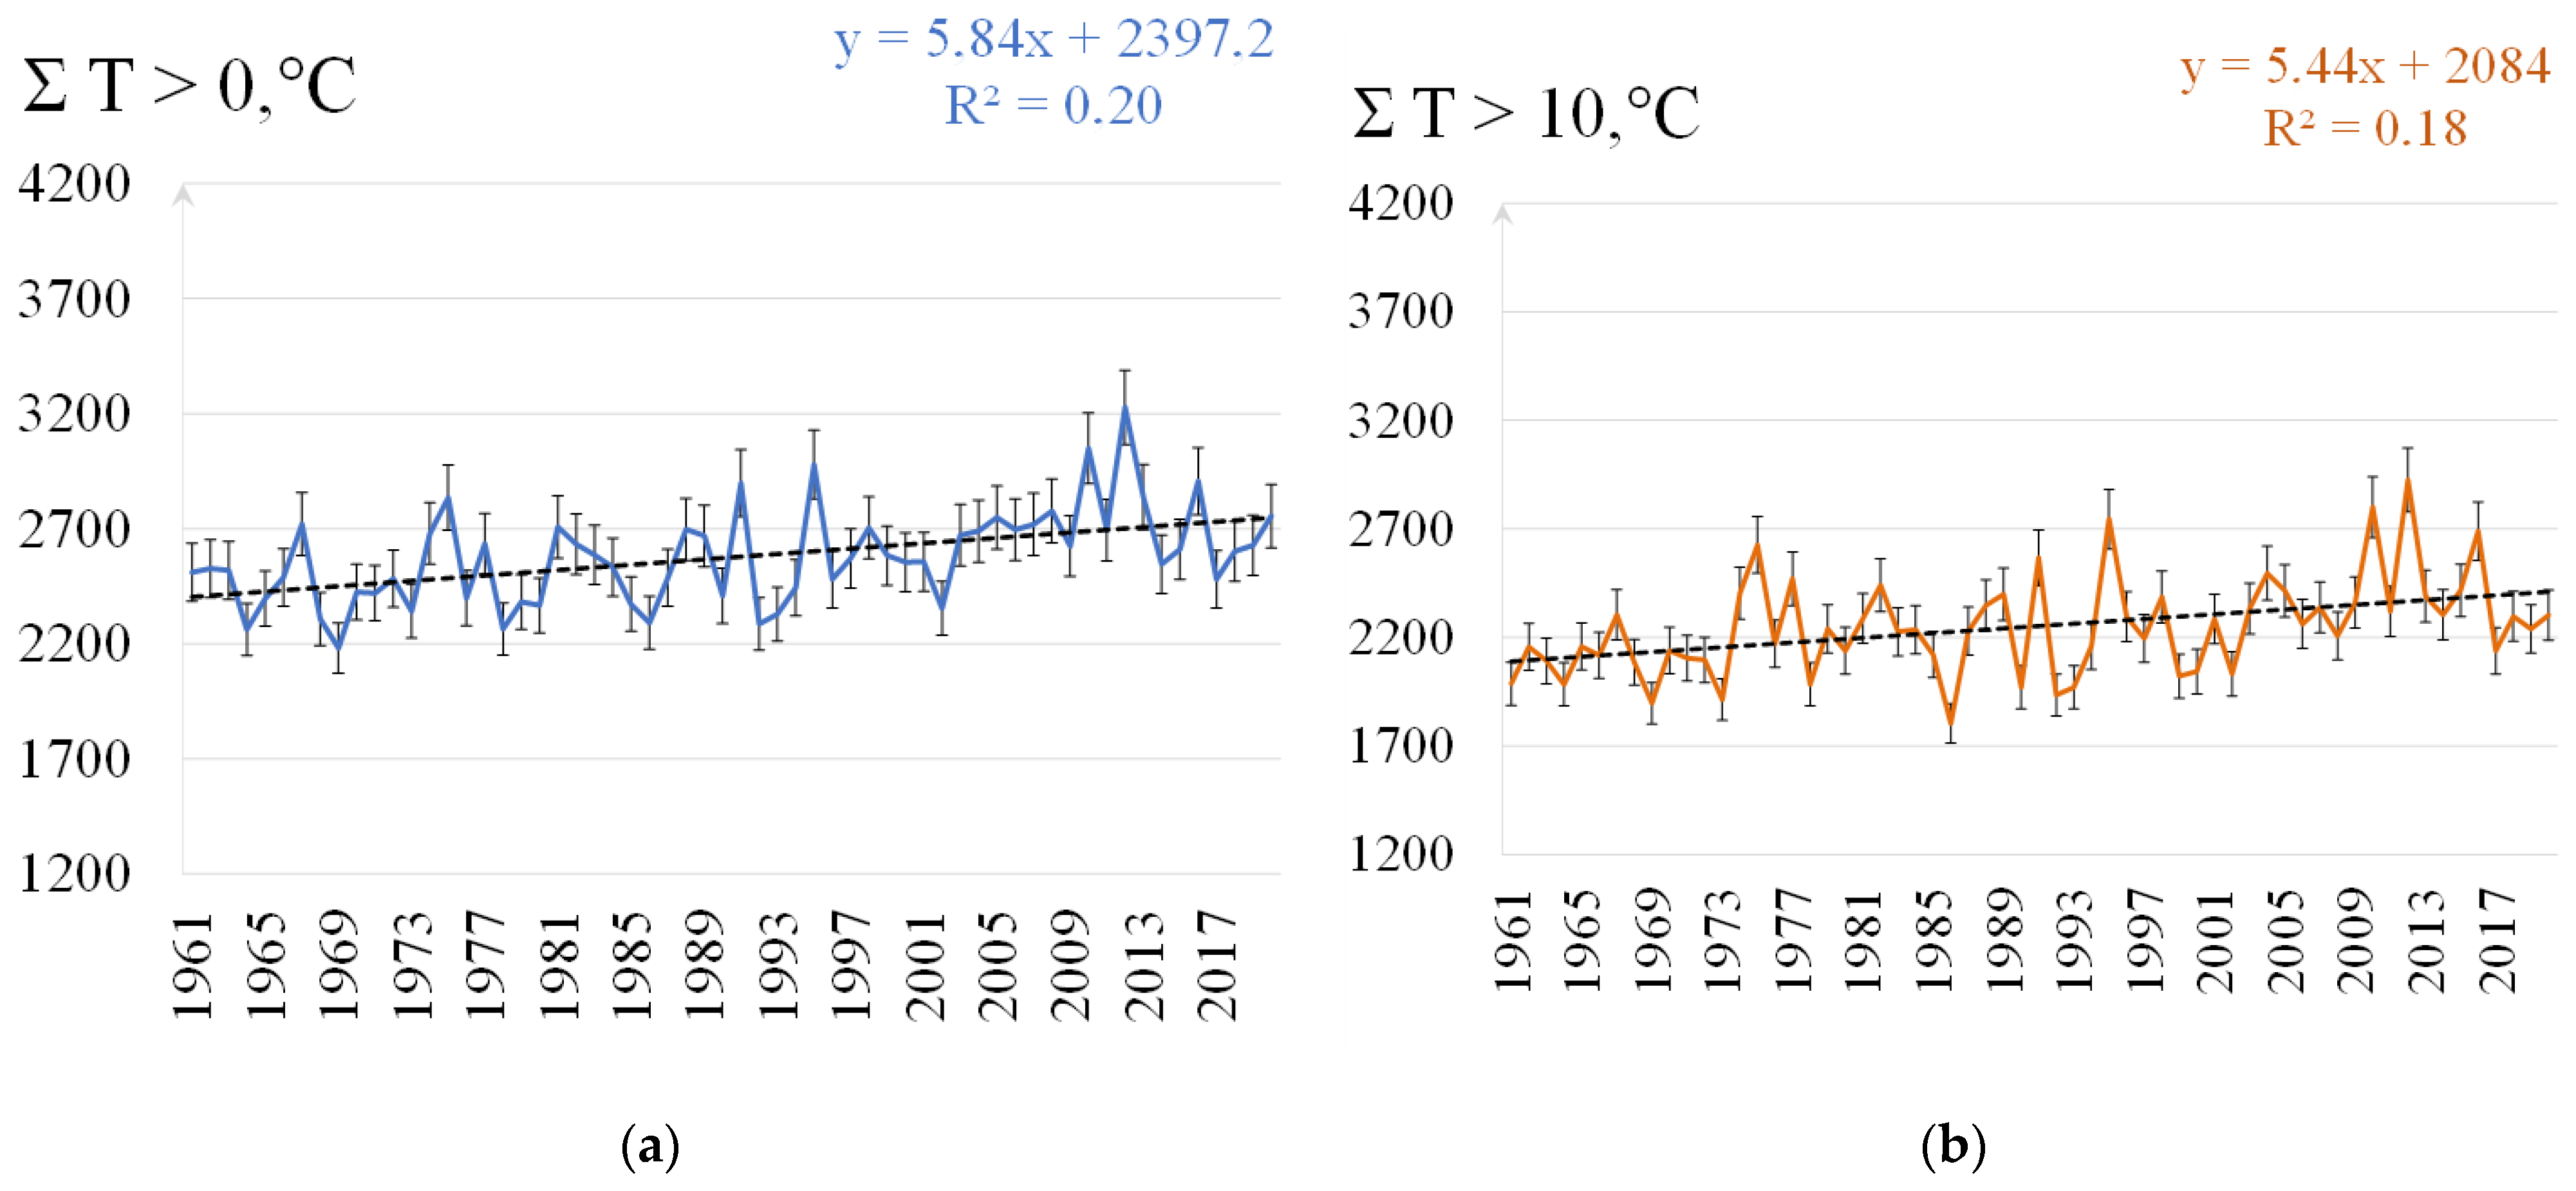
| ƩT ≥ 0 °C (°C) | 2575 | 3228 (2012) | 2181 (1969) | 58.4 |
| ƩT ≥ 10 °C (°C) | 2250 | 2926 (2012) | 1804 (1986) | 54.4 |
| HCS | 1.12 | 2.0 (1994) | 0.4 (2010) | 0.003 |
| Indicator | Agricultural Crop | IV | V | VI | VII | VIII | IX | X | V.P. | T.P. | Year |
|---|---|---|---|---|---|---|---|---|---|---|---|
| Air temperature | Cereals | −0.40 | −0.27 | −0.59 | −0.16 | −0.21 | 0.09 | 0.31 | −0.53 | −0.44 | −0.08 |
| Technical | −0.05 | 0.10 | −0.04 | −0.04 | −0.13 | −0.11 | 0.13 | −0.08 | −0.04 | 0.21 | |
| Oilseeds | −0.21 | −0.05 | −0.04 | −0.11 | −0.23 | −0.08 | 0.32 | −0.23 | −0.14 | 0.09 | |
| Vegetables (potatoes) | −0.49 | 0.04 | −0.36 | −0.28 | −0.35 | −0.04 | 0.33 | −0.50 | −0.40 | −0.18 | |
| Sum of temperatures | Cereals | −0.43 | −0.47 | ||||||||
| Technical | −0.03 | −0.12 | |||||||||
| Oilseeds | −0.14 | −0.25 | |||||||||
| Vegetables (potatoes) | −0.39 | −0.38 | |||||||||
| Precipitation sum | Cereals | 0.21 | 0.50 | 0.18 | 0.31 | −0.23 | 0.14 | −0.04 | 0.43 | 0.38 | 0.33 |
| Technical | 0.44 | −0.21 | −0.21 | 0.55 | 0.43 | 0.18 | −0.05 | 0.40 | 0.30 | 0.22 | |
| Oilseeds | 0.52 | 0.05 | −0.21 | 0.76 | 0.25 | 0.14 | −0.25 | 0.53 | 0.35 | 0.13 | |
| Vegetables (potatoes) | 0.33 | 0.06 | −0.12 | 0.51 | 0.25 | 0.11 | 0.04 | 0.40 | 0.35 | 0.23 | |
| HCS | Cereals | 0.45 | |||||||||
| Technical | 0.04 | ||||||||||
| Oilseeds | 0.17 | ||||||||||
| Vegetables (potatoes) | 0.23 | ||||||||||
| Ped S index | Cereals | −0.36 | −0.42 | −0.46 | −0.27 | −0.08 | −0.02 | 0.18 | −0.56 | −0.47 | −0.24 |
| Technical | −0.35 | 0.16 | 0.09 | −0.30 | −0.25 | −0.17 | 0.11 | −0.24 | −0.19 | 0.01 | |
| Oilseeds | −0.49 | −0.06 | 0.09 | −0.44 | −0.26 | −0.13 | 0.34 | −0.40 | −0.27 | 0.01 | |
| Vegetables (potatoes) | −0.52 | −0.01 | −0.16 | −0.46 | −0.35 | −0.09 | 0.15 | −0.57 | −0.43 | −0.18 |
| Period | Mean of Daily Mean Temperature, °C | Precipitation Sum, mm |
|---|---|---|
| RCP 2.6 | ||
| 2011–2040 | 5.84 ± 0.14 | 575.00 ± 11.00 |
| 2041–2070 | 6.81 ± 0.14 | 590.95 ± 11.95 |
| 2071–2099 | 6.66 ± 0.14 | 601.37 ± 13.24 |
| RCP 4.5 | ||
| 2011–2040 | 5.17 ± 0.14 | 551.58 ± 10.80 |
| 2041–2070 | 7.12 ± 0.14 | 573.82 ± 10.58 |
| 2071–2099 | 8.01 ± 0.15 | 582.48 ± 12.19 |
| RCP 6.0 | ||
| 2011–2040 | 5.19 ± 0.14 | 583.40 ± 11.53 |
| 2041–2070 | 7.76 ± 0.14 | 569.05 ± 11.02 |
| 2071–2099 | 8.87 ± 0.13 | 558.07 ± 11.77 |
| RCP 8.5 | ||
| 2011–2040 | 5.9 ± 0.14 | 586.70 ± 11.70 |
| 2041–2070 | 8.14 ± 0.14 | 579.82 ± 12.54 |
| 2071–2099 | 10.65 ± 0.14 | 594.79 ± 11.39 |
Disclaimer/Publisher’s Note: The statements, opinions and data contained in all publications are solely those of the individual author(s) and contributor(s) and not of MDPI and/or the editor(s). MDPI and/or the editor(s) disclaim responsibility for any injury to people or property resulting from any ideas, methods, instructions or products referred to in the content. |
© 2024 by the authors. Licensee MDPI, Basel, Switzerland. This article is an open access article distributed under the terms and conditions of the Creative Commons Attribution (CC BY) license (https://creativecommons.org/licenses/by/4.0/).
Share and Cite
Kamalova, R.; Bogdan, E.; Belan, L.; Tuktarova, I.; Firstov, A.; Vildanov, I.; Saifullin, I. Assessment of Changes in Agroclimatic Resources of the Republic of Bashkortostan (Russia) under the Context of Global Warming. Climate 2024, 12, 11. https://doi.org/10.3390/cli12010011
Kamalova R, Bogdan E, Belan L, Tuktarova I, Firstov A, Vildanov I, Saifullin I. Assessment of Changes in Agroclimatic Resources of the Republic of Bashkortostan (Russia) under the Context of Global Warming. Climate. 2024; 12(1):11. https://doi.org/10.3390/cli12010011
Chicago/Turabian StyleKamalova, Rita, Ekaterina Bogdan, Larisa Belan, Iren Tuktarova, Alexey Firstov, Ildar Vildanov, and Irik Saifullin. 2024. "Assessment of Changes in Agroclimatic Resources of the Republic of Bashkortostan (Russia) under the Context of Global Warming" Climate 12, no. 1: 11. https://doi.org/10.3390/cli12010011
APA StyleKamalova, R., Bogdan, E., Belan, L., Tuktarova, I., Firstov, A., Vildanov, I., & Saifullin, I. (2024). Assessment of Changes in Agroclimatic Resources of the Republic of Bashkortostan (Russia) under the Context of Global Warming. Climate, 12(1), 11. https://doi.org/10.3390/cli12010011