Article

Evaluation of Gridded Meteorological Data for Crop Sensitivity Assessment to Temperature Changes: An Application with CERES-Wheat in the Mediterranean Basin

by
Konstantina S. Liakopoulou
and
Theodoros Mavromatis
*
Department of Meteorology and Climatology, School of Geology, Aristotle University of Thessaloniki, 54124 Thessaloniki, Greece
*
Author to whom correspondence should be addressed.
Climate 2023, 11(9), 180; https://doi.org/10.3390/cli11090180
Submission received: 19 July 2023 / Revised: 19 August 2023 / Accepted: 22 August 2023 / Published: 29 August 2023
(This article belongs to the Special Issue Climate Change Impacts at Various Geographical Scales II)

Abstract

:
In areas with a limited or non-existent network of observing stations, it is critical to assess the applicability of gridded datasets. This study examined the agreement of Agri4Cast and E-OBS at two spatial resolutions (10 km (EOBS-0.1) and 25 km (EOBS-0.25)) in 13 Mediterranean stations nearby to wheat crops and how this agreement may influence simulated potential development and production with the crop simulation model (CSM) CERES-Wheat in historical and near-future (2021–2040) (NF) periods. A wide range of sensitivity tests for maximum and minimum air temperatures and impact response surfaces were used for the future projections. EOBS-0.1 showed the lowest discrepancies over observations. It underestimated statistical measures of temperature and precipitation raw data and their corresponding extreme indices and overestimated solar radiation. These discrepancies caused small delays (5–6 days, on average) in crop development and overestimations (8%) in grain production in the reference period. In the NF, the use of EOBS-0.1 reduced by a few (2–3) days the biases in crop development, while yield responses differed among stations. This research demonstrated the ability of EOBS-0.1 for agricultural applications that depend on potential wheat development and productivity in historical and future climate conditions expected in the Mediterranean basin.

1. Introduction

Over the past few decades, several high-resolution gridded weather products (such as reanalysis and reprocessing) have been developed using multiple data sources and techniques, including in situ measurements, numerical modeling (retrospective analysis), and remote sensing (ground-based radars and satellites). Datasets generated from fitting smooth curves to irregularly spaced station meteorological data or using interpolation algorithms that incorporate knowledge of physical processes to match observations at the station locations are termed “station-based’’ datasets [1]. The difficulties of converting station data into gridded datasets are well documented [2]. Reanalysis data, on the other hand, are generated by numerical weather prediction (NWP) models that assimilate sequentially observed surface and atmosphere data to reconstruct past land surface, atmosphere, and ocean state variables [3]. Prominent gridded products in the literature include the NASA Modern Era Retrospective analysis for Research and Applications (MERRA-2) [4], the National Center for Environmental Prediction–National Center for Atmospheric Research reanalysis (NCEP/NCAR) [5], the ERA-Interim produced by the European Centre for Medium-range Weather Forecasts (ECMWF), and the Agri4Cast (JRC MARS Meteorological Database). Among the well-known reprocessed datasets are the Climatic Research Unit Temperature dataset (CRUTEM5) [6], the Goddard Institute for Space Studies Surface Temperature Analysis dataset (GISTEMP v4) [7], and the European gridded dataset (E-OBS).
The Mediterranean region has been referenced as one of the most responsive regions to climate change and was defined as a primary “Hot spot”, based on the results from climate simulation models [8]. Ref. [9] attributed the projected temperature rise and precipitation decrease in this region to the confluence of two different effects of a warming climate: a change in the dynamics of upper atmospheric circulation and a reduction in the temperature difference between land and sea. The projected drying and warming are expected to have an impact on agriculture and, therefore, on wheat, as earlier cultivation and a reduction in production are expected. The wheat-growing area within the Mediterranean basin represents 27% of the arable land, and the region represents 60% of the world’s growing area for durum wheat (Triticum turgidum L. subs. durum [Desf.]), the species used for pasta manufacturing [10].
The necessity of assessing the impacts of climate change on wheat production and security can be achieved using crop simulation models. These attempt to quantitatively describe the ecophysiological processes of crop growth and development as a function of weather conditions, soil conditions, and crop management [11]. Furthermore, they provide an alternative, less time consuming, and inexpensive means of determining the optimum crop and irrigation requirements under varied climatic conditions. On the other hand, they require daily weather data (such as air temperature, precipitation, and solar radiation), which in many regions where crops are grown are not available. CERES-Wheat is one of the most widely used crop models for wheat. Gridded data, a valuable source of information over regions with sparse observational data [12], have several advantages, which explain their widespread use, but also potential inaccuracies and errors that could distort crop models’ results, decreasing their usefulness for agricultural applications. Given the large range of gridded products currently available, investigators must evaluate their strengths and weaknesses before using them. Furthermore, except for [13], who explored the feasibility of the Crop Growth Monitoring System (CGMS) driven by Agri4Cast data over Europe, we are not aware of any other study assessing the impacts of inaccuracies in gridded weather data on the sensitivity of crop production in the Mediterranean region with crop simulation models under historical and/or future climate conditions.
In this context, the central focus of this study is how well-gridded weather data perform in estimating potential food production under historical and future climate conditions. To achieve this, meteorological parameters, on a daily basis, from three gridded datasets (E-OBS in 2 spatial resolutions and Agri4Cast) and 13 Mediterranean meteorological stations, selected for their proximity to wheat crops, were compared for their skills in reproducing (a) the climate type for each station and a number of statistical characteristics with respect to the data, as well as for corresponding extreme indices, and (b) the sensitivity of wheat development and yield simulated with CERES-Wheat, employing impact response surfaces for a reference period and across a wide range of changes (sensitivity tests) in air temperature.

2. Materials and Methods

Daily observations (from now on OBS) of maximum and minimum air temperatures, precipitation, and solar radiation (from now on Tmax (°C), Tmin (°C), Prec (mm), and QQ (MJ/m2/day), respectively), from 13 Mediterranean stations were obtained (see Figure 1). Data for the stations in Spain, France, Italy, and Cyprus were collected from the NCEI/NOAA (National Centers for Environmental Information, National Oceanic and Atmospheric Administration) CDO (Climate Data Online) database [14]. Greek station (Thessaloniki and Larissa) data were assembled from the Aristotle University of Thessaloniki and Larissa Airport, respectively. Each weather station in this study was selected due to its closeness to a wheat area. The majority of stations have complete data for Tmax and Prec. Missing data for each station and meteorological parameter (months with gaps ≥10 days were discarded) is presented in Table S1. QQ shows larger gaps for most of the stations and total absences in four (Montpellier, Cagliari, Larisa, and Larnaca).
The Agri4Cast data (or MarsMet data, from now on Agri4Cast) [15] were assembled by the Joint Research Centre (JRC) for the Monitoring Agricultural Resources (MARS) unit and cover the EU member states since 1975. It consists of (i) daily weather obtained from at least 4200 synoptic weather stations with an irregular distribution and density; and (ii) six weather forecast products (five data products from ECMWF and one from the Copernicus Programme) with a different number of forecast days (forecast depth) and a varying number of possible realizations called “members”. To determine weather conditions in the space that is not covered by weather stations, interpolation is used. The two data sources are interpolated to the centers of the same fixed grid of 25 × 25 km, and a regular distribution is organized that covers the entire region of interest [16].
E-OBS is a daily gridded reprocessed observational dataset that derives from ECA&D (European Climate Assessment and Dataset) [17] and daily observations, including data for precipitation, air temperature, and sea level pressure in Europe since 1950 [18,19]. The E-OBS dataset was developed using a three-step methodology [18]. It was produced with the primary purpose of regional climate model (RCM) evaluation, but it is also used for climate monitoring throughout Europe and the study of extreme events [20]. Many stations have been added to ECA&D in recent years, increasing approximately from 1200 to 3700 temperature stations and from 2500 to 9000 rain stations. The number of available stations decreases from north to south and from west to east and varies with time. There were fewer stations before about 1961 as well as after 2000 [21]. E-OBS covers the area between 25° N–71.5° N and 25° W–45° E. The elevation file makes use of the Global 30 Arc-Second Elevation Data Set (GTOPO30), a global raster Digital Elevation Model (DEM) with a horizontal grid spacing of approximately 1 km developed by the USGS [22]. In this study, version 23.1e was used with two spatial resolutions, 0.1 × 0.1 (10 km) and 0.25 × 0.25 (25 km) (from now on EOBS-0.1 and EOBS-0.25, respectively).
No notable gaps were reported in gridded datasets. The geographical features (latitude, longitude, and altitude) and the location for each station and grid cell center are presented in Table S2 and Figure 1. Differences larger than 200 m in altitude were found on some occasions (Malaga, Granada, Melilla, Thessaloniki, and Larnaca) (Table S2). To account for these differences, the gridded daily temperature time series was adjusted by the normal lapse rate (0.65 °C temperature decrease for every 100 m rise in altitude).
The Decision Support System for Agrotechnology Transfer (DSSAT, version 4.7.5) [23,24] includes crop models for more than 42 crop species and improved tools that facilitate the use of crop models. The CERES-Wheat model was chosen to simulate wheat yield and development in the study area. It is made up of nonlinear, dynamic mathematical functions that describe wheat development, growth, and yield, as well as changes in soil water and nutrients at the field scale as a result of management and daily weather conditions. It simulates root and shoot development, leaf and stem growth and senescence, biomass accumulation and partitioning between roots and shoots, leaf area index, root stem, leaf, and grain growth. Its minimum meteorological requirements include Tmax, Tmin, Prec, and QQ. It also requires soil management information (e.g., planting date, row spacing, and seeding density) as well as variety-specific genetic coefficients. It has been used in model intercomparison studies and utilized in climate change impact assessment at various scales, and it has been extensively tested, demonstrating a good ability to reproduce wheat development, growth, and productivity in the Mediterranean basin [25,26]. For a comprehensive description of CERES-Wheat, readers should consult [27].
The steps followed in this study are shown in Figure 2. Firstly, the gridded data (EOBS-0.1, EOBS-0.25, and Agri4Cast) were checked for their skill in reproducing the observed climate type based on the Köppen–Trewartha climate classification (KTC) [28,29]. Then, they were directly compared with station data (Figure 1) using statistical measures and extreme temperature (days with Tmax > 25 °C (summer days), Tmax < 0 °C (icing days), Tmin > 20 °C (tropical nights), and Tmin < 0 °C (frost days)) and precipitation (days with Prec ≥ 0.1 mm, Prec ≥ 1 mm, and the 95th and 99th percentiles of precipitation) related indices. These indices were proposed and calculated according to definitions proposed by the WMO [30,31,32]. Finally, they were evaluated for their abilities in reproducing wheat development (anthesis and maturity) and harvested yield with the CERES-Wheat model over the Mediterranean region for the reference period (Table 1) initially and consequently under a wide range of changes in Tmax and Tmin (sensitivity tests). As a result of the total absence of QQ measurements at 4 stations (Montpellier, Cagliari, Larisa, and Larnaca), different reference periods and stations were used during the direct comparison of weather data and the CERES-Wheat runs.
The crop model was run in potential mode (with inactive subroutines for soil moisture and fertilization simulation). In this mode, only temperature, solar radiation, and the variety’s genetic characteristics are required [33], and yield relies solely on relatively well-understood processes, which include the balance between photosynthesis and respiration and the partitioning of total dry matter between seed and vegetative organs [34]. Furthermore, since crop production in the future is expected to be much closer to potential yield due to increased food demand but limited land and water resources for the expansion of agriculture [35], a focus on potential mode constitutes a robust proxy for future food production [34]. Iride, the durum wheat variety chosen for this study, is a relatively new variety (released in 1996) with high productivity and adaptability to different environments. The genetic coefficients of Iride, as estimated by [36], are presented in Table S3. The same crop management and sowing day (1 November) were chosen for all stations.
WeatherMan [37], a software package included in DSSAT’s tools, was used for preparing daily weather (including completeness and erroneous values check) data for use with CERES-Wheat since no missing data are allowed. Different procedures were used to fill in the missing data. Regarding rainfall gaps, a first-order Markov chain model was used to simulate rainfall occurrence or absence on each day, and consequently, the gamma distribution function was applied to fill the rainfall amount [38]. 10-day running means were used to fill temperature and solar radiation gaps (see Vol. 4 in [23]).
The range of the sensitivity tests in air temperature for the near future period (2021–2040) over the Mediterranean Region was guided by the interactive IPCC maps [39] (the mean temperature projections and their variations for the near future are illustrated in Figure S1). The climate is expected to warm throughout all seasons, with summer temperatures reaching up to 4–5 °C. According to the Coupled Model Intercomparison Project-Phase 5 (CMIP5) GCM forecasts, [40] found a considerable warming in all seasons and areas of the Mediterranean under the RCP4.5 scenario, with a maximum in summer of nearly 3 °C, comparing 2071–2098 to 1980–2005. To predict the future climate in the Mediterranean, [41] used a multi-model, multi-scenario, and multi-domain analysis. The authors specifically utilized the RCM predictions of the Coordinate Regional Downscaling Experiment—CORDEX [42], across several domains (including the Mediterranean), under the RCP2.6, RCP4.5, and RCP8.5 scenarios. The Mediterranean is anticipated to warm by 1–5 °C by the end of the 21st century, with summer temperatures reaching 7 °C. Regardless of the RCP scenarios, maximum changes in Tmax and Tmin are expected to be around +1.6 °C in the NF. The predicted temperature projections based on the three RCPs do not show substantial differences between Tmax and Tmin (Table 2). In fact, the median values for RCP2.6 and RCP4.5 are similar. The extreme temperature projections (P95) of RCP4.5 are marginally lower than those of RCP2.6 and RCP8.5 (1.5 °C for Tmax and 1.4 °C for Tmin vs. 1.6 °C). As a result, incremental sensitivity tests were conducted using consistent positive synchronous adjustments (from 0 °C to +1.6 °C in steps of 0.1 °C, 289 (17 × 17) scenarios in total) in observed Tmax and Tmin during the growing season (December–June) (Figure 3).
Impact response surfaces (IRSs) were used to depict the response of simulated CERES-Wheat crop responses to changes in Tmax and Tmin as a plotted surface. IRSs provide an opportunity to test model performance across a wide range of conditions, including those that may lie outside the conventional application of many models [43]. They have been increasingly applied during the past decade to illustrate impact model sensitivity to climate variables in sectors such as agriculture, hydrology, and ecosystems [44].
For a given weather or crop parameter, agreement and biases between gridded (G) and measured (M) weather data were assessed with the root mean square error (RMSE):
R M S E = i = 1 n G i     ¯ M i 2 n  
where Mi and Gi are the variables derived from the measured and gridded data for the ith site-year, respectively. The RMSE provides a measure of the degree of agreement between weather data sources. Relative RMSE (rRMSE) was also calculated as a percentage of the measured mean for a given weather variable or crop parameter based on the respective measured variable/parameter. The correlation coefficient (r), which estimates the goodness of fit between two variables, and the non-statistically based way of interpreting its values, as suggested by [45] (Table S4), were also used.
r = i G i G i ¯ M i M ¯ i G i G i ¯ 2 i M i M ¯ 2

3. Results

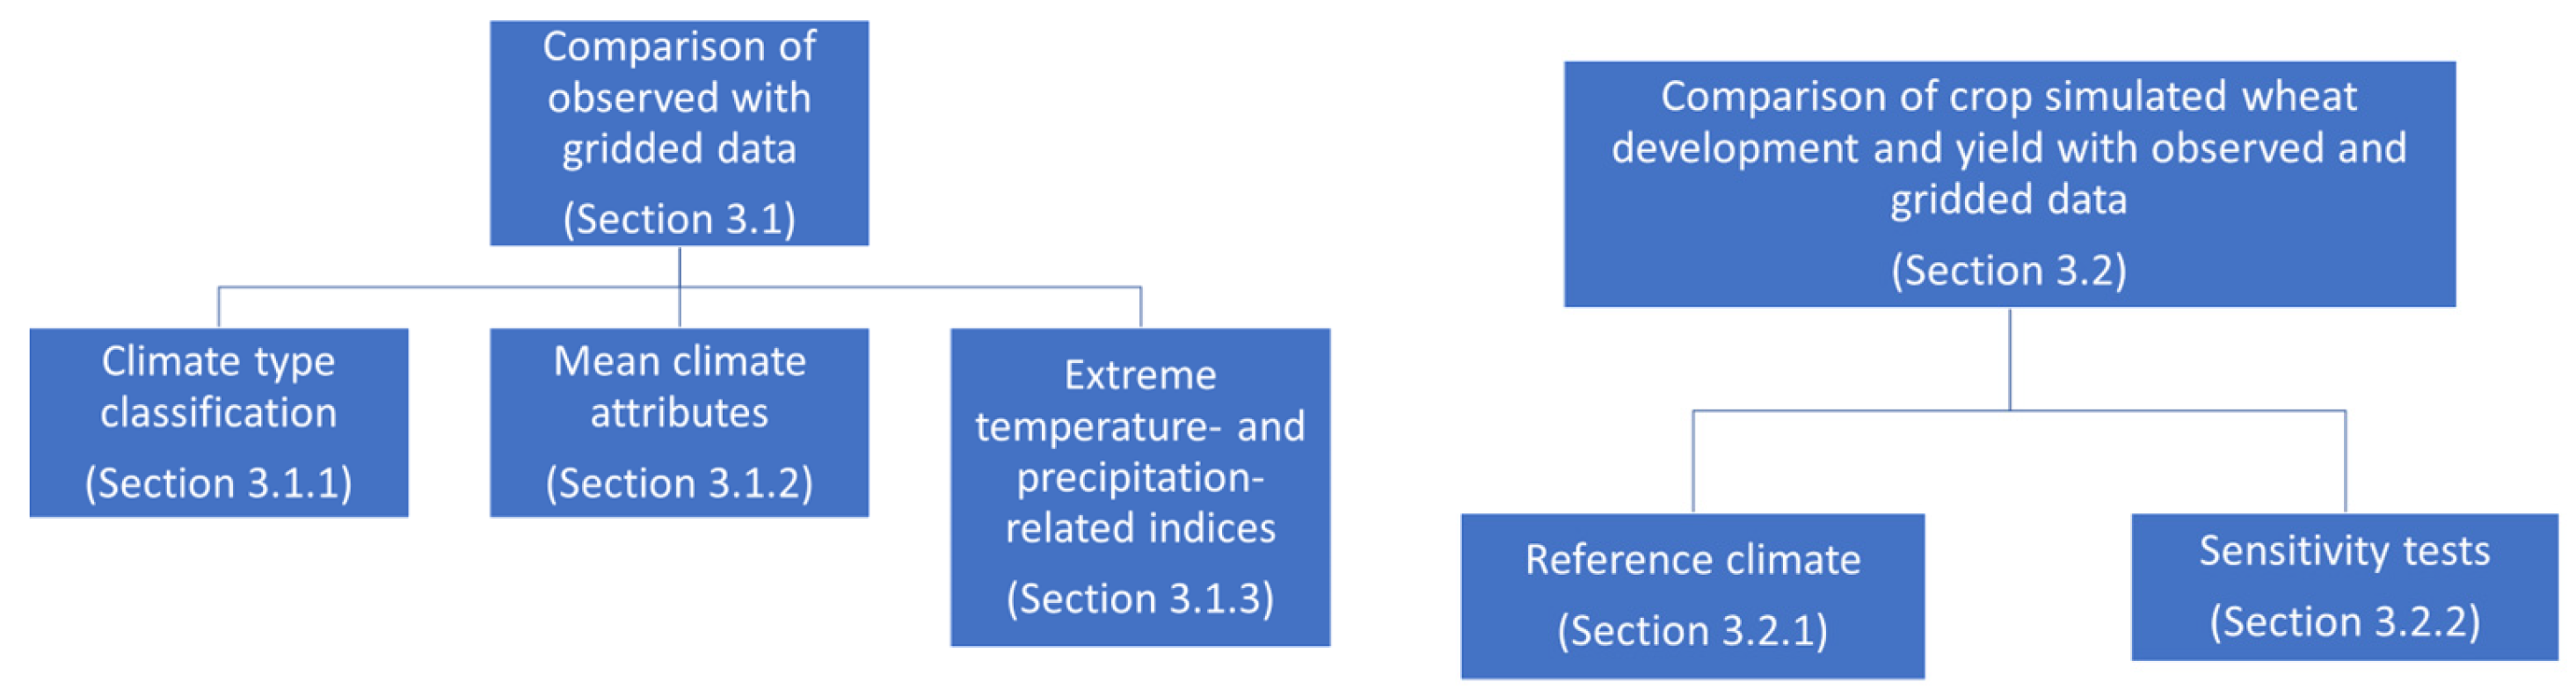
3.1. Comparison of Measured with Gridded Weather Data

3.1.1. Climate Classification
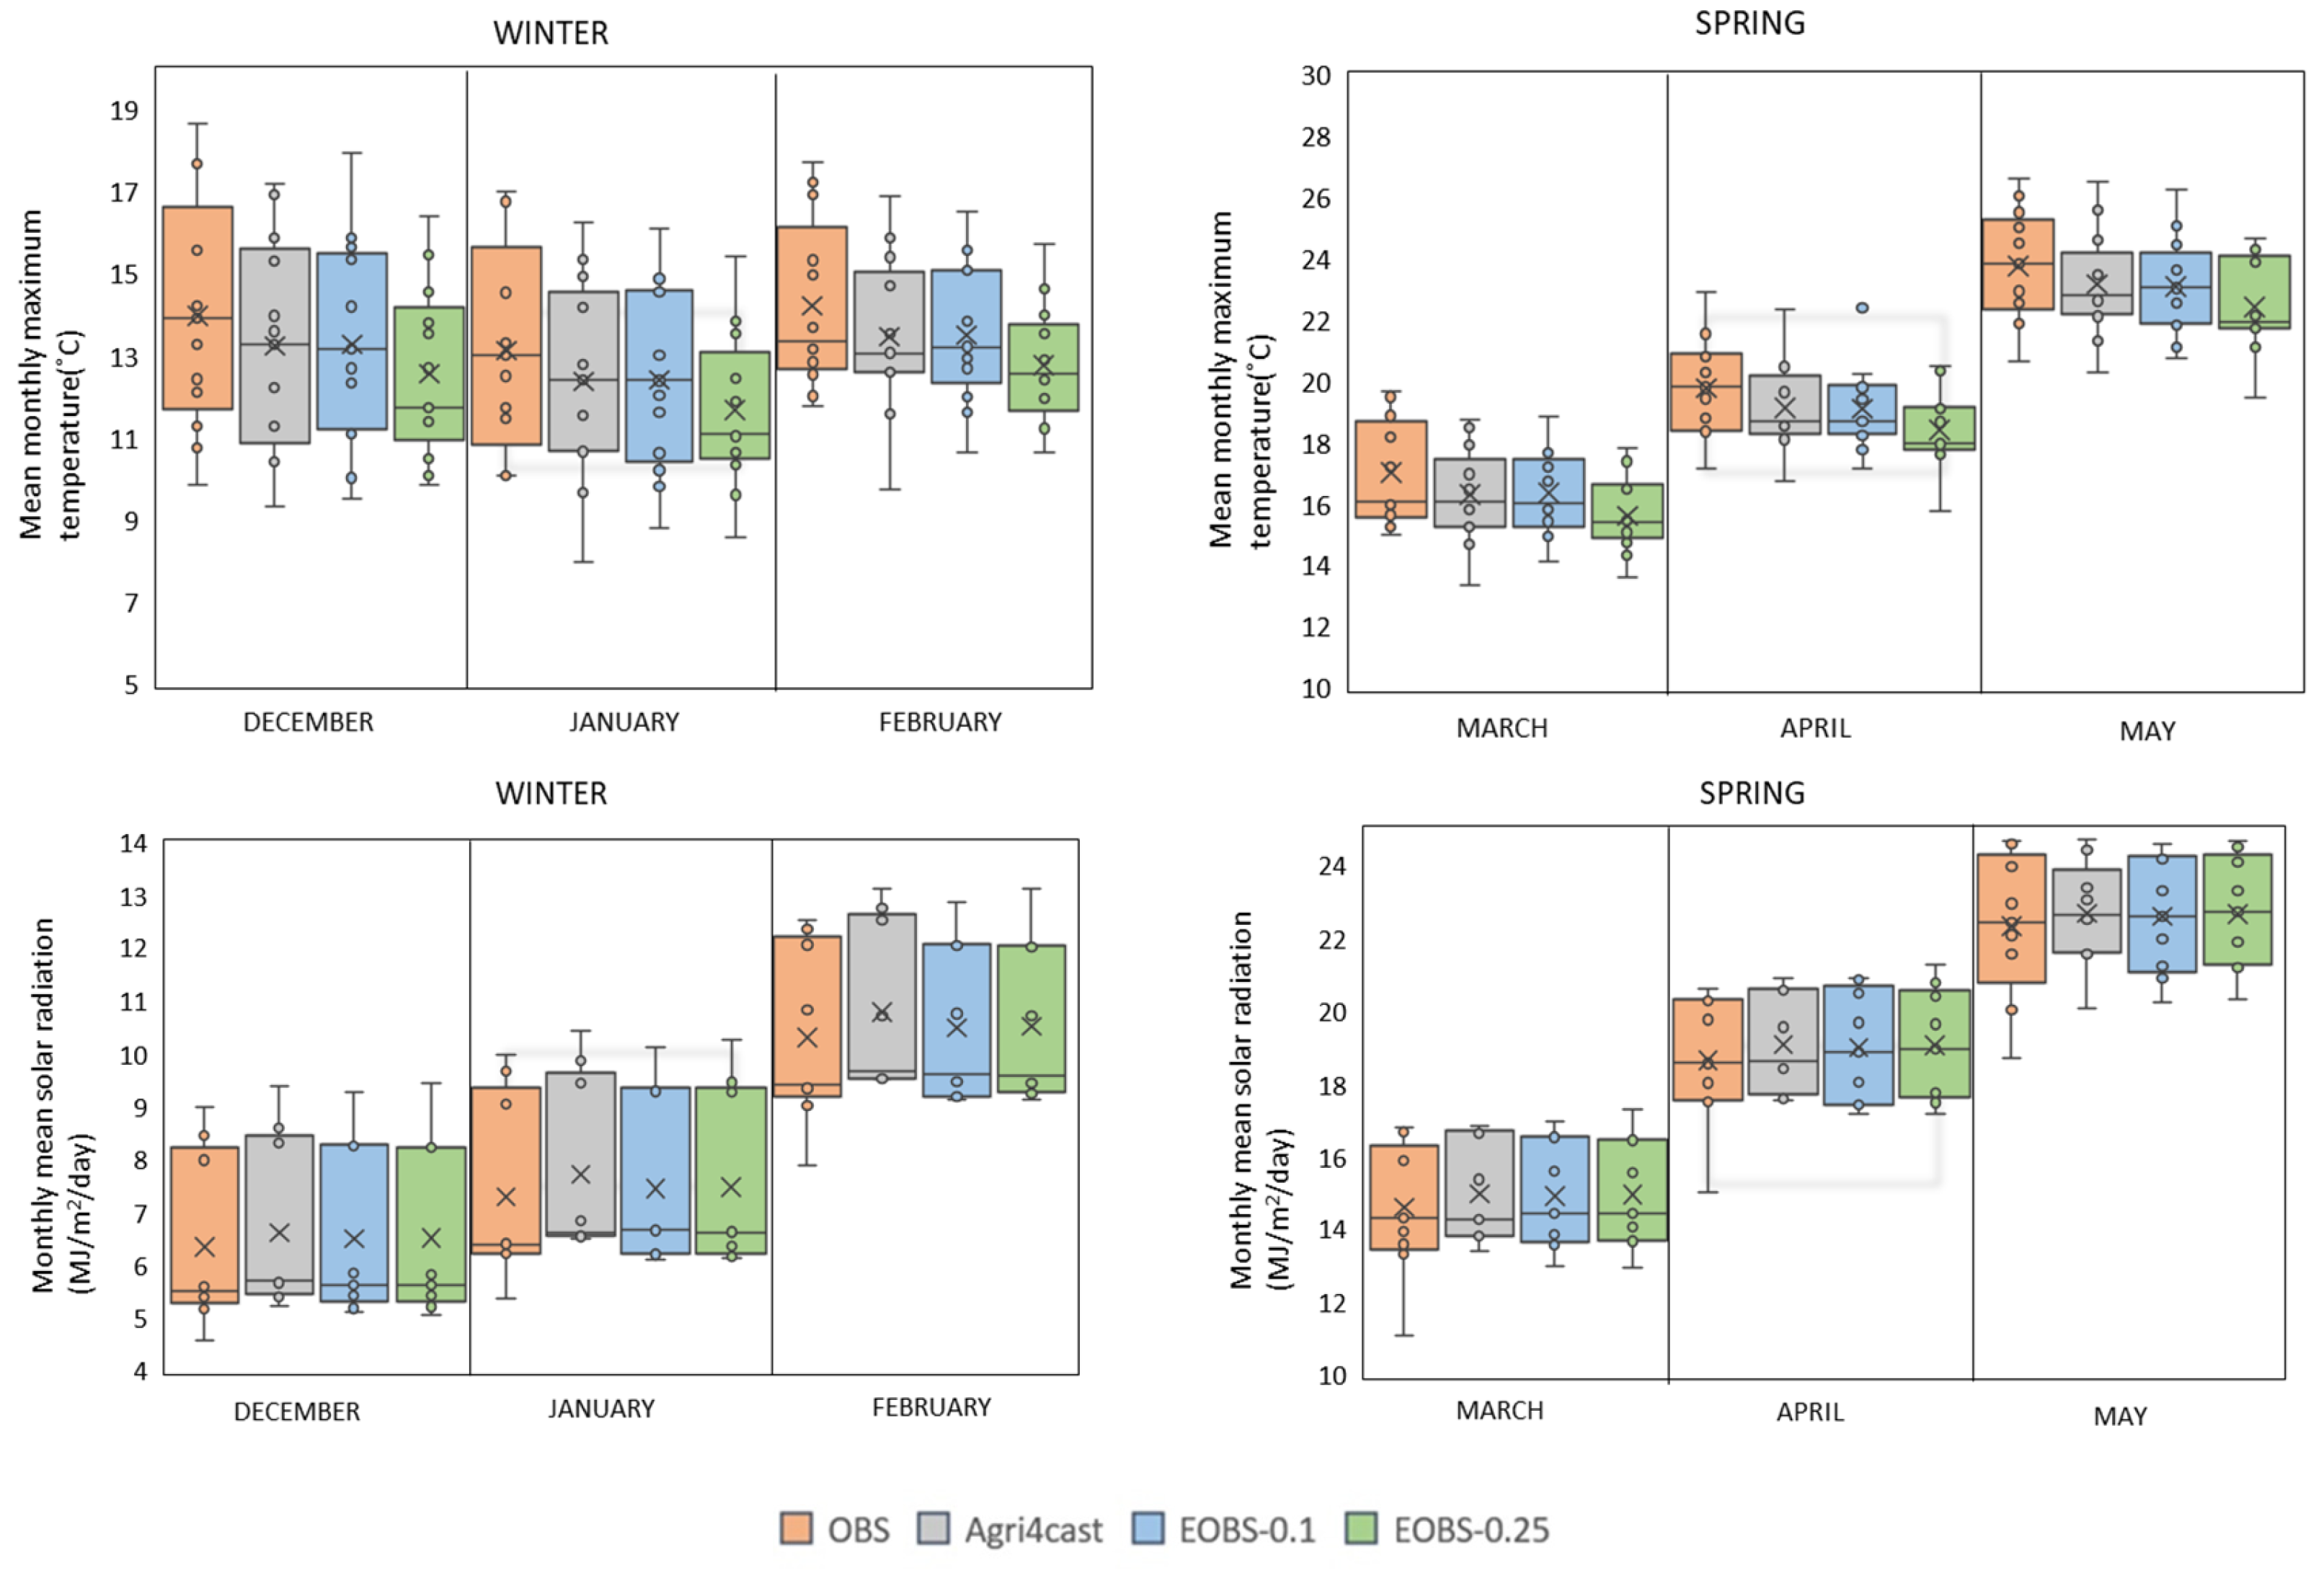
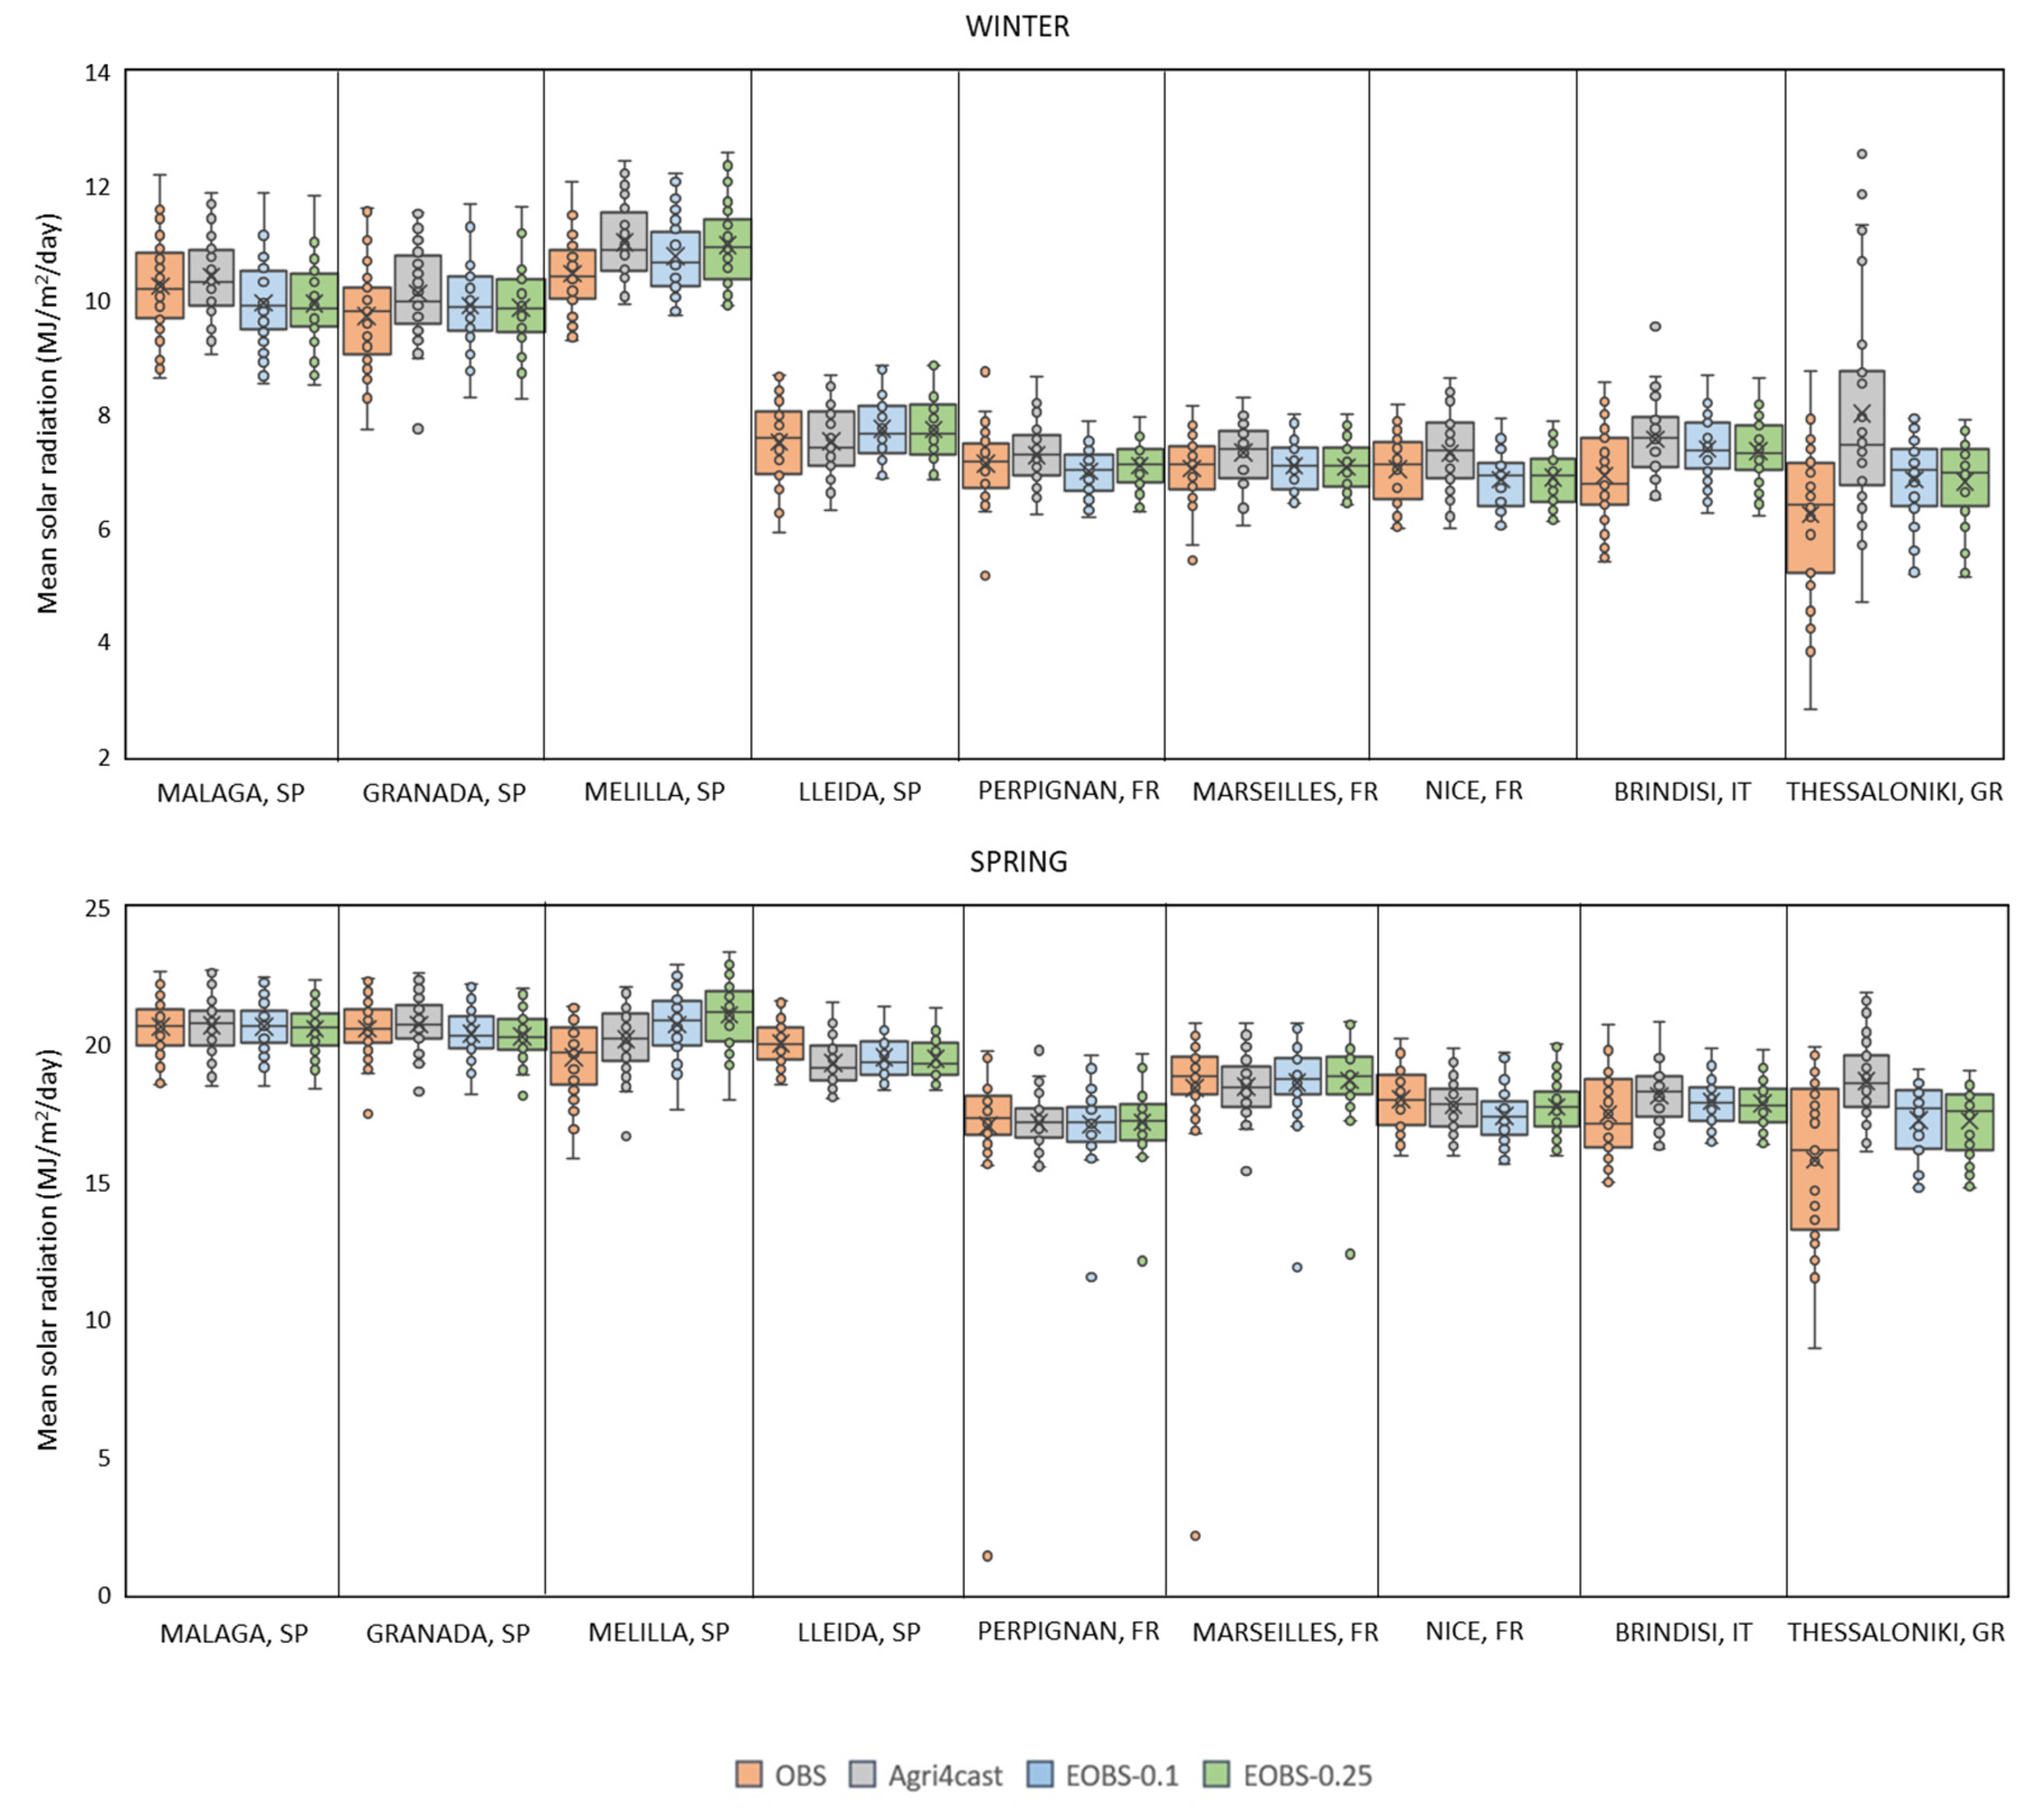
Table 3 compares the climate types, according to KTC classification, for each station using monthly temperature and precipitation time series of observations and gridded data. With OBS, Lleida, Larissa, and Thessaloniki are categorized as Bsk (cold semi-arid climate) and the others as Csa (hot summer Mediterranean climate). Gridded data are in full agreement with C-type climates and only in partial agreement with B-type climates. Melilla was classified as Bsk from gridded data but as Bsh (hot semi-arid climate) from OBS, while in the case of Larnaca, incoherence was found between EOBS-0.25 and OBS as the former classified the station as Csa and the latter as Bsh.

3.1.2. Mean Climate

Figure 4 presents the results of the comparison between gridded data and OBS for Tmax and QQ in the winter and spring months, across stations, for the reference period (Figure S2 shows the respective results for Tmin and Prec). The gridded products underestimated the observed means and medians of Tmax, Tmin, and Prec and overestimated these of QQ. EOBS-0.1 was the best product for each parameter, followed by Agri4Cast for Tmax and Tmin and EOBS-0.25 for Prec and QQ. The maximum discrepancies (expressed as % error = ((Re − OBS)/OBS * 100) in Tmax with EOBS-0.1 occurred in winter (December (−5.0% or −0.7 °C), January (−5.5% or −0.7 °C), and February (−5.0% or −0.7 °C), while the minimum occurred in summertime. Similarly, for Tmin, the highest underestimation emerged in winter (December (−12.6% or −0.7 °C), January (−16.7% or −0.7 °C), and February (−15.4% or −0.8 °C)) and the lowest in summer. The maximum errors occurred in July, August, and September for Prec (−20.6% (−2 mm), −10.9% (−2 mm), and −10.1% (−4 mm), respectively), while the minimum was observed in January and April. Regarding QQ, the differences were similar for all months, reaching +1.6% or 0.1. MJ/m2/day in December. EOBS-0.1 also presented the lowest differences in year-to-year variability from the observations.
EOBS-0.1-derived Tmax and Tmin were the superior gridded data for most of the stations, with Agri4Cast following at the remaining stations. Its performance, however, varied with the season and statistical index. EOBS-0.1 for Tmax was closer to observed means (medians) at 7–8 stations in winter, summer, and autumn, while in spring it performed equally well (6 stations each) with Agri4Cast (Figure 5). EOBS-0.1-derived Tmin presented the smallest discrepancies from OBS means in winter and autumn (7–8 stations), performed equally well with Agri4Cast in summer (6 stations each), and less satisfactorily in spring (Figure S3). The higher values of rRMSE for Tmax were identified in Thessaloniki (14% in winter) and Granada (4–7% in other seasons), while for Tmin, they were identified in Granada (62.8% in winter), Thessaloniki (23% in spring), and Melilla (9.3% and 12.5% in summer and autumn, respectively). EOBS-0.1 was closer to observed precipitation means (at 7–9 stations) (Figure S4) and presented a lower rRMSE and higher associations (very high at 11 stations for each season). The higher rRMSEs were found in Melilla (23.5% in winter), Larisa (23.9% in spring), and Brindisi (38.7% in summer and 21.6% in autumn). In relation to seasonal QQ averages, EOBS-0.1 with respect to EOBS-0.25 was superior in spring (6 stations) and summer (4 stations), underperformed in winter, and was equally effective in autumn (Figure 6). EOBS-0.1 also presented (i) lower rRMSE values at 5–6 stations in spring and summer, while each E-OBS product showed the lowest values at 4 stations in winter and autumn, and (ii) higher associations (r ranged from 0.604 in autumn to 0.973 in summer) but lower in relation to precipitation.

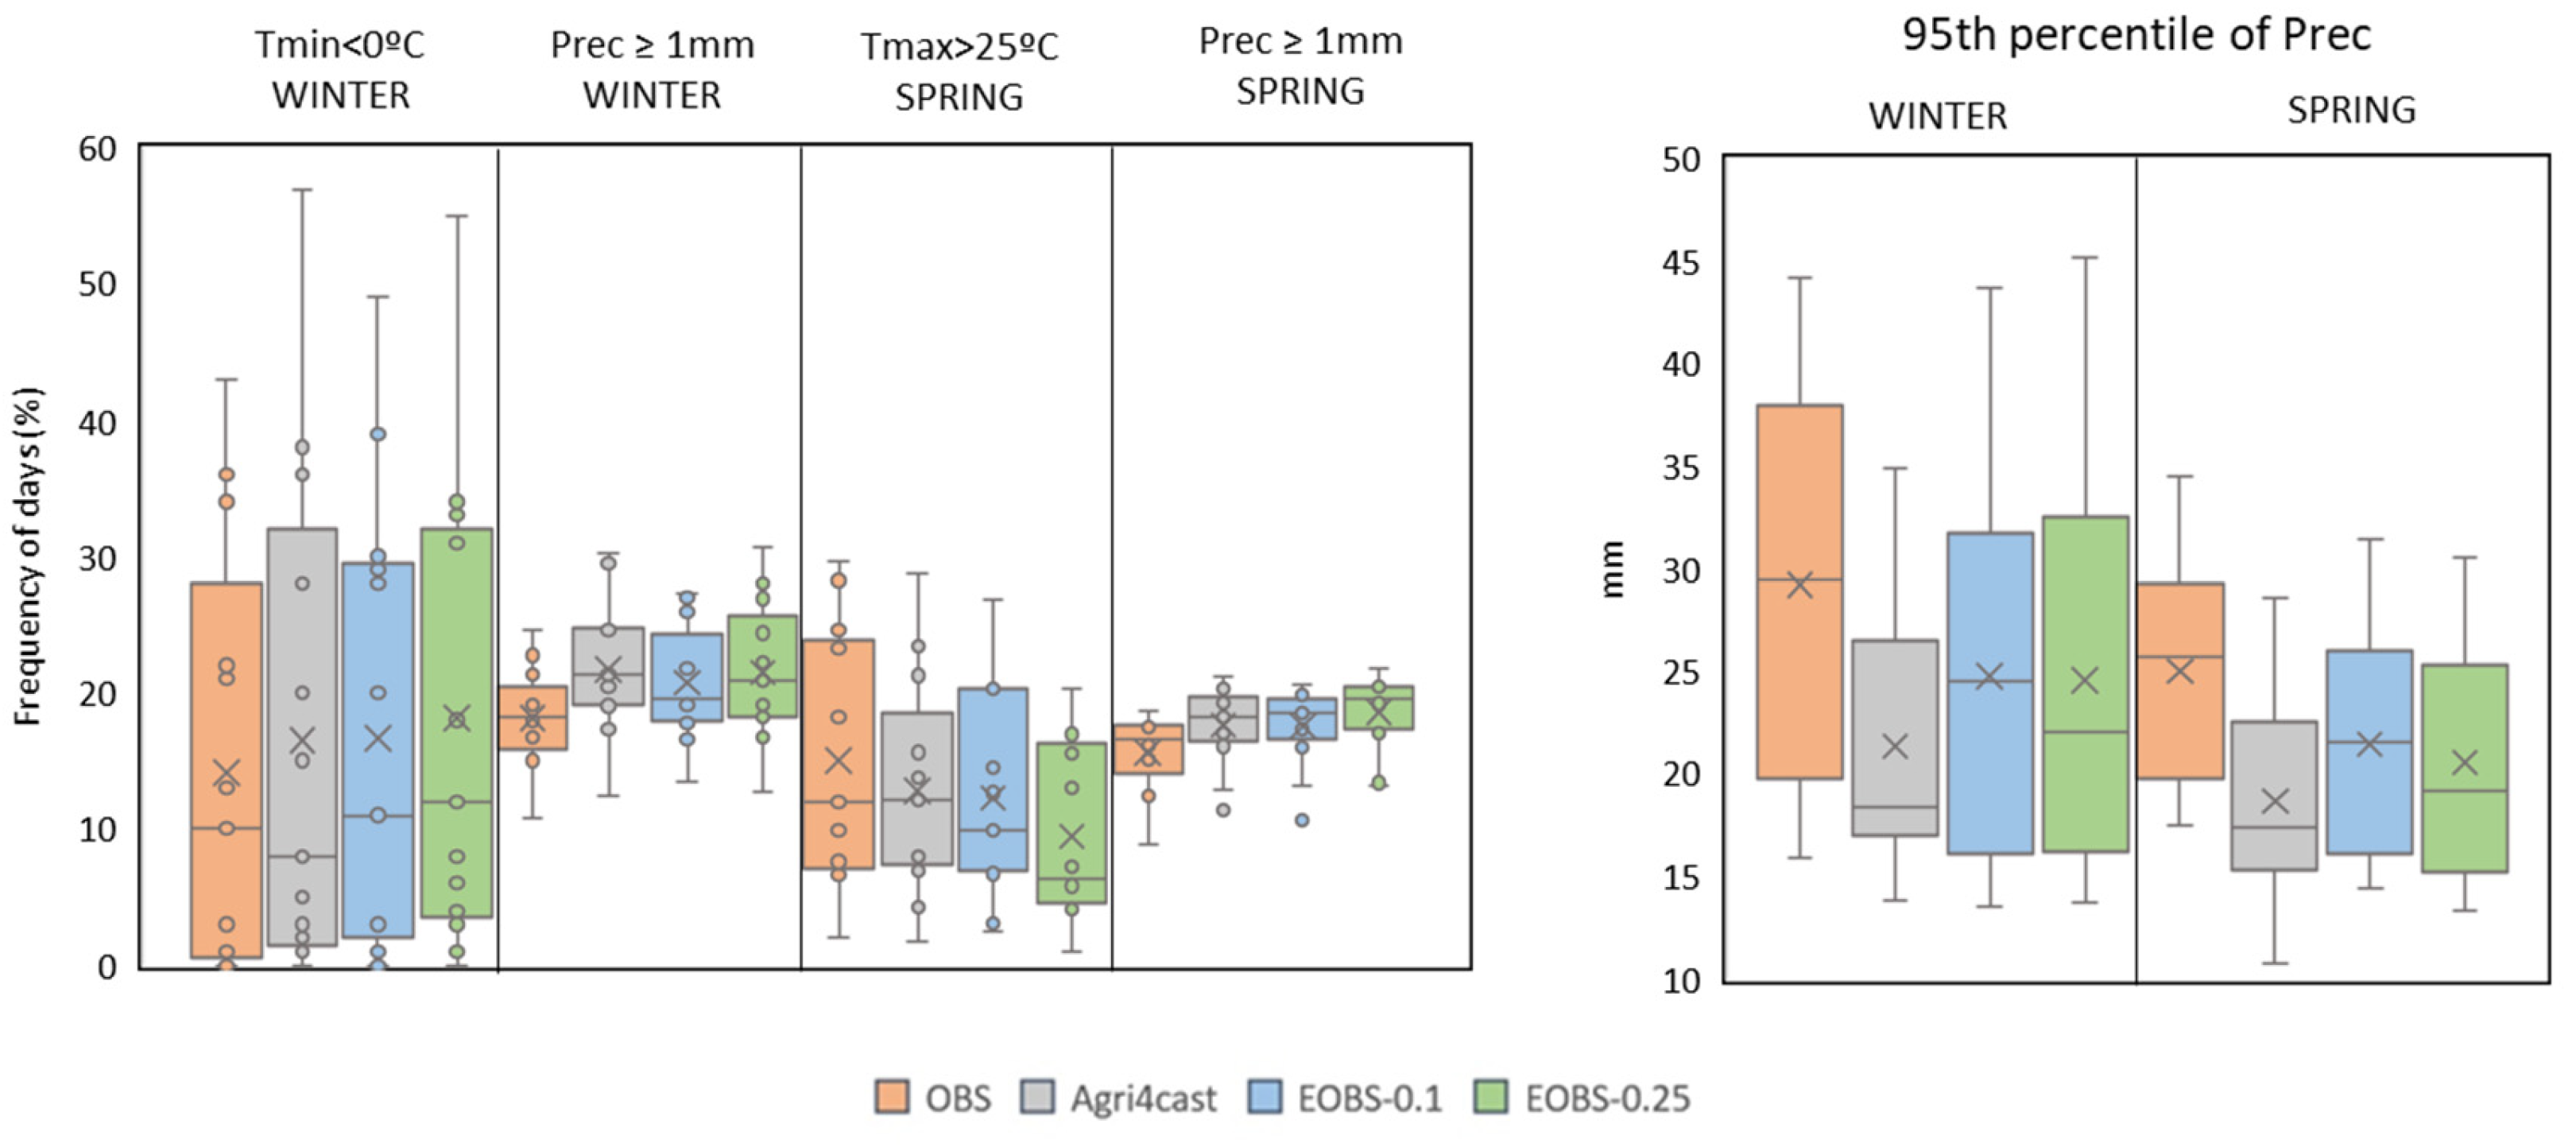
3.1.3. Extreme Climate Indices

Figure 7 compares temperature (frequency of days with Tmin < 0 °C (frost days) and Tmax > 25 °C (summer days)—and precipitation (frequency of days with Prec ≥ 1.0 mm and the 95th percentile) related indices across stations (n = 13) in winter and spring for measured (OBS) and gridded data during the reference period.
Each gridded product correctly reproduced the (close to) zero appearance of the three temperature-based indices (Tmax > 25 °C, Tmax < 0 °C (icing days), and Tmin > 20 °C (tropical nights)) in winter. Regarding the frequency of frost days, stations could be categorized into two groups: (1) ≤13% (low frequency) and (2) >20% (high frequency). In the first group, consisting of 8 stations, EOBS-0.1 emerged as the best product. None of the products stood out for the latter group of stations. In spring, all products underestimated the low frequency of tropical nights in Thessaloniki and Larnaca. EOBS-0.25 reproduced better the frequency of frost days at 6 stations, while EOBS-0.1 and Agri4Cast at 4 Agri4Cast (and then EOBS-0.1) exhibited lower deviations from the observations at the stations presenting both low (<13%) (7 stations) and high (≥18%) (Malaga, Granada, Lleida, Larisa, Thessaloniki, and Larnaca) frequencies of days with Tmax > 25 °C (Figure 7). In the summertime, all gridded products accurately replicated the zero frequency of icing and frost days. Regarding summer days, EOBS-0.1 exhibited the lowest discrepancies from OBS at 7 stations, followed by Agri4Cast at 5. Agri4Cast approximated in 8 stations better the frequency of tropical nights followed by EOBS-0.1 in 4. In autumn, all products correctly reproduced the zero frequency of icing and frost (in 6 stations) days. In Granada and Thessaloniki, the gridded products indicated frost days (with EOBS-0.1 showing less frequent mistakes) while there are none. In the rest of the stations, negligible differences were found between the products. While none of the products stood out for the stations (Mellila and Larnaca) presenting the higher (>20%) frequency of tropical nights, EOBS-0.1 was the best achiever at the remaining stations with low frequency (<13%) of this index. EOBS-0.1 is also the best choice in reproducing the frequency of summer days.
The frequency of wet days with the lower threshold (0.1 mm) showed that EOBS-0.25 was closer to observed seasonal frequencies. Increasing the rainfall threshold to 1 mm favored EOBS-0.1 in autumn, summer, and winter, and Agri4Cast in spring. EOBS-0.1 better reproduced the 95th and 99th percentiles of precipitation, followed in long distance by EOBS-0.25 (Figure 7).

3.2. Comparison of Crop Simulated Wheat Development and Yield with Measured and Gridded Weather Data

3.2.1. Reference Climate

The discrepancies between the estimated Ceres-Wheat anthesis, maturity, and harvested yield between the gridded products and the observed time series for the reference period and sensitivity tests are illustrated in Figure 8 and Table S5. All products predicted later development stages (anthesis and maturity) and overestimated yield production. EOBS-0.1 presented the lowest, compared to other gridded data, discrepancies for anthesis (4.7 days on average, varying from 0 days in Melilla and Brindisi to 8.9 days in Granada and Thessaloniki) at five stations, maturity (5.7 days on average, ranging from 0 days in Brindisi to 10.9 days in Malaga) at four stations, and yield production (7.7% on average, spanning from 0.4% in Lleida to 26.7% in Thessaloniki) at six stations, and EOBS-0.25 the largest. The superiority of EOBS-0.1 was further confirmed when the correlation coefficient r and %RMSE were estimated. The former coefficient was very high (except for Malaga and Mellilla) for anthesis and maturity and ranged from 0.56 (Thessaloniki) to 0.89 (Lleila) for yield (Table S6). The mean value of rRMSE across stations (5.4% for anthesis, 5.9% for maturity, and 11.2% for yield) was well within ±15%, the accepted range adopted by [34,46] (Table S6).

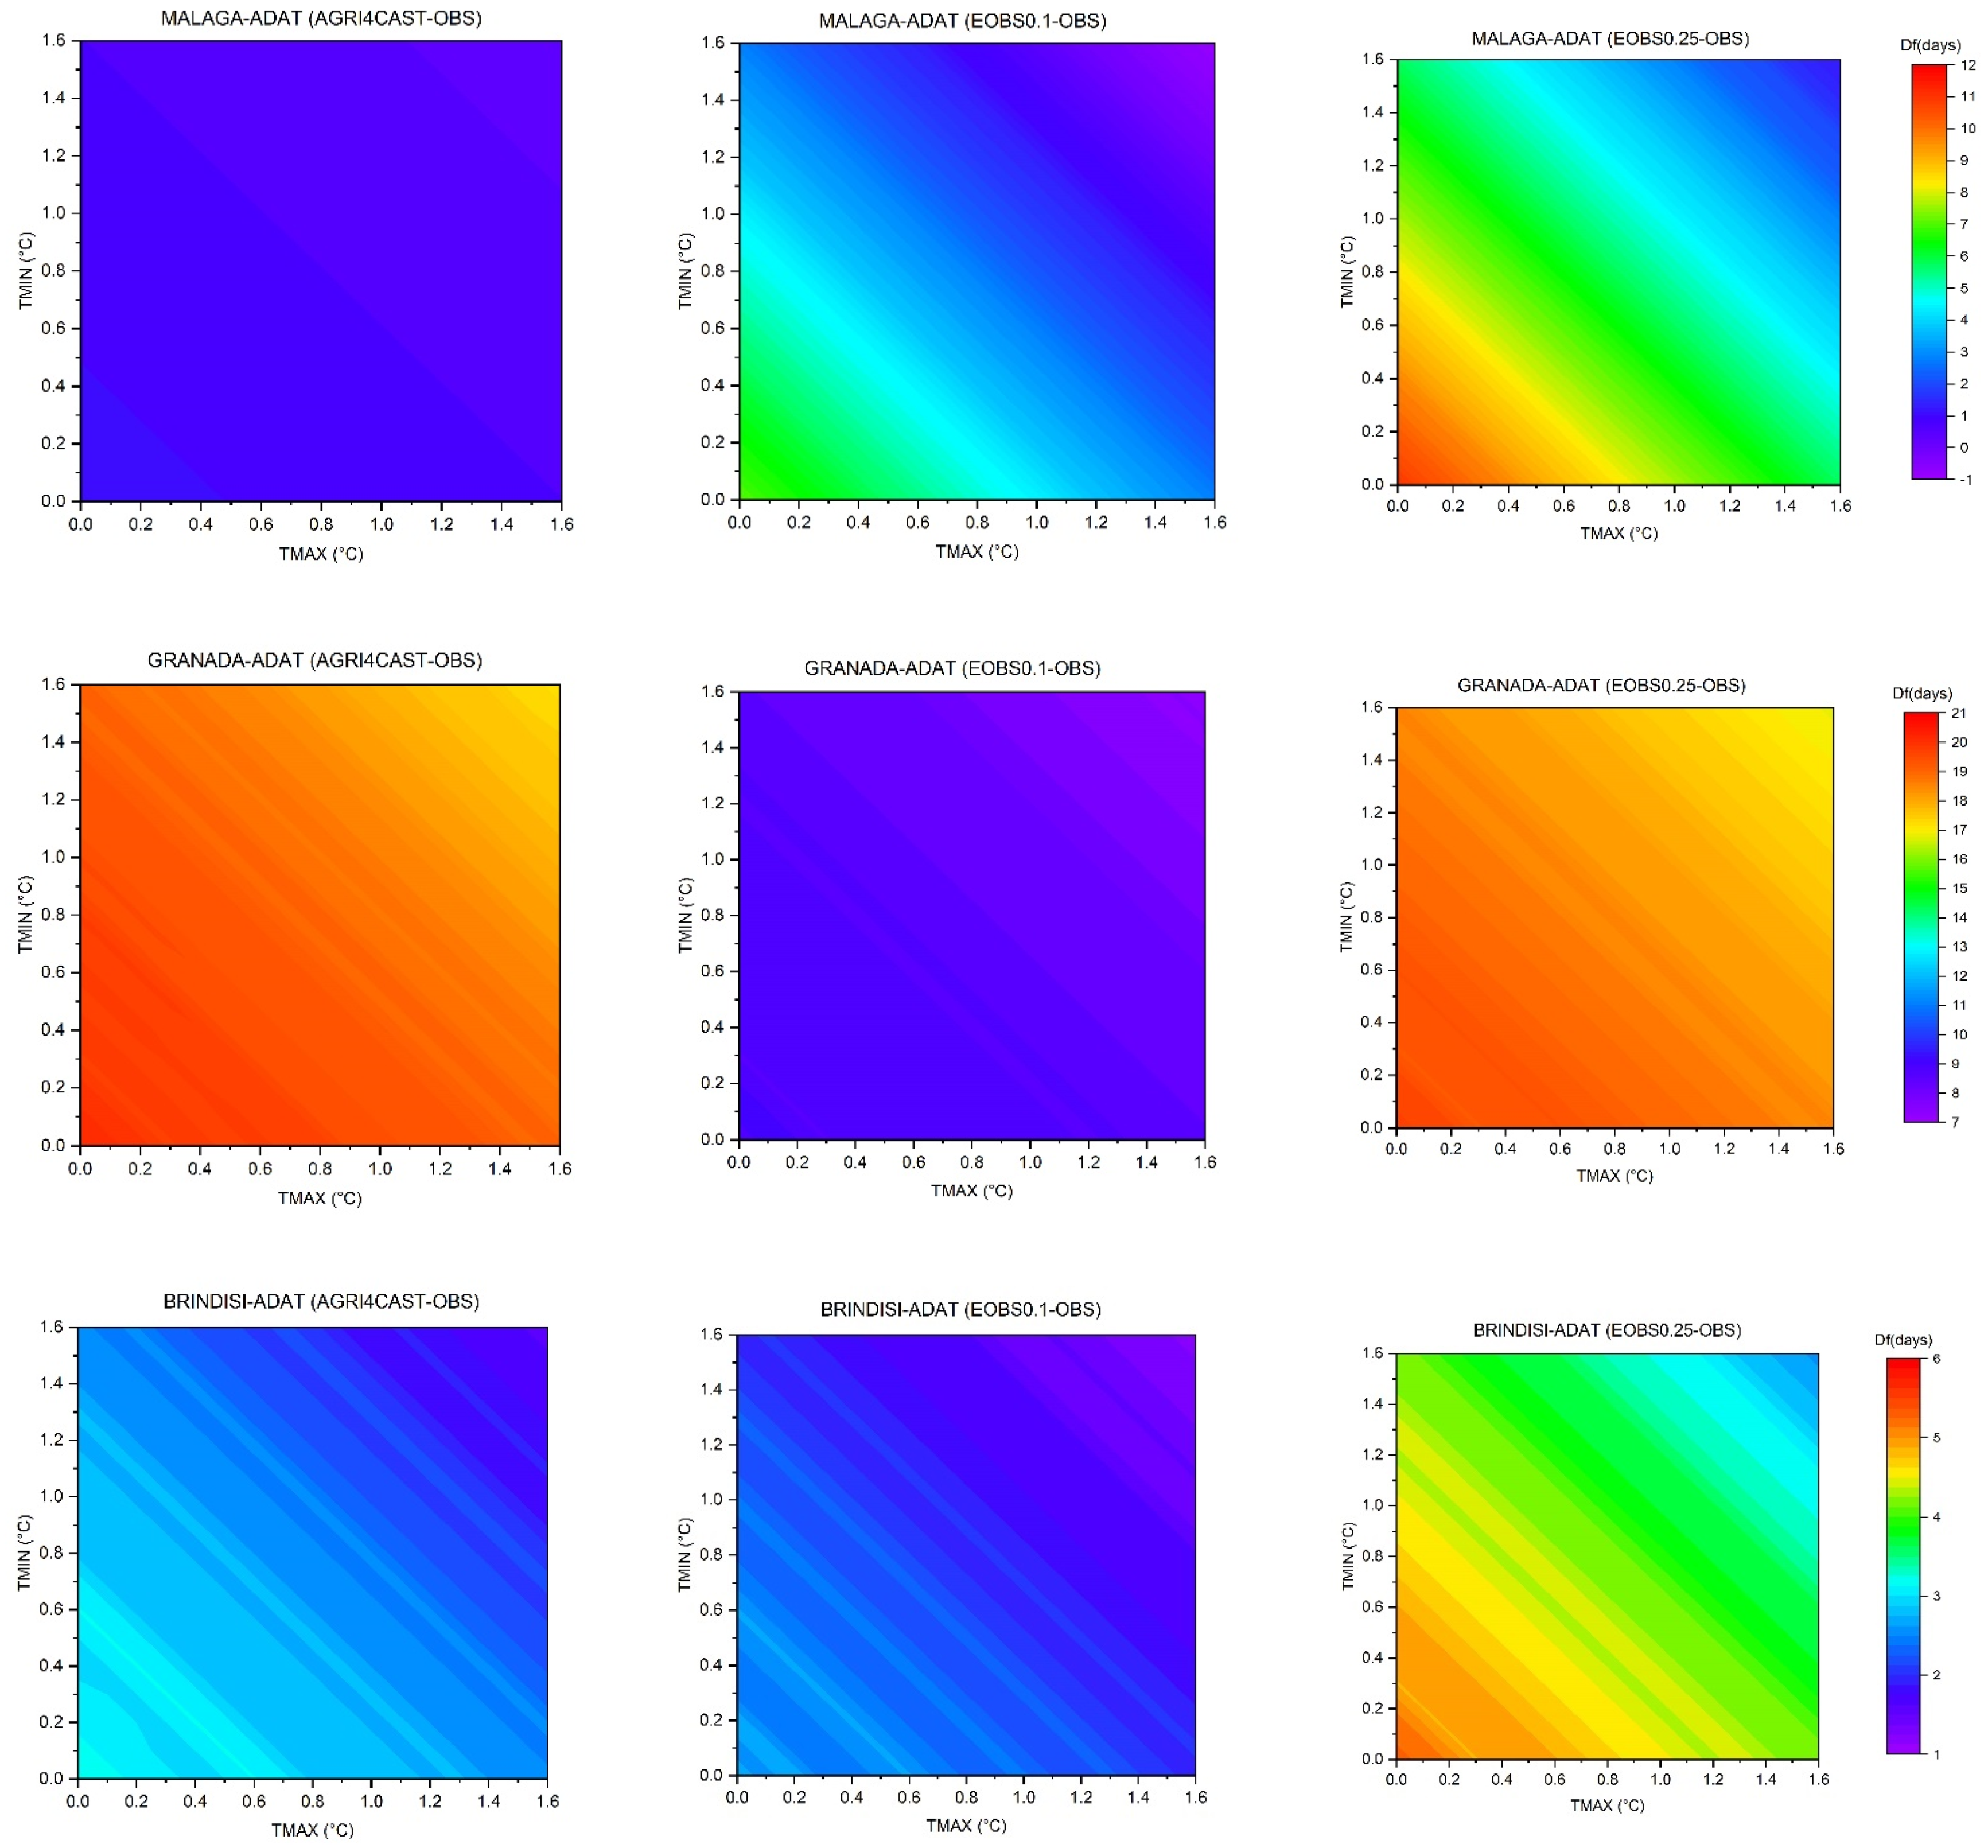
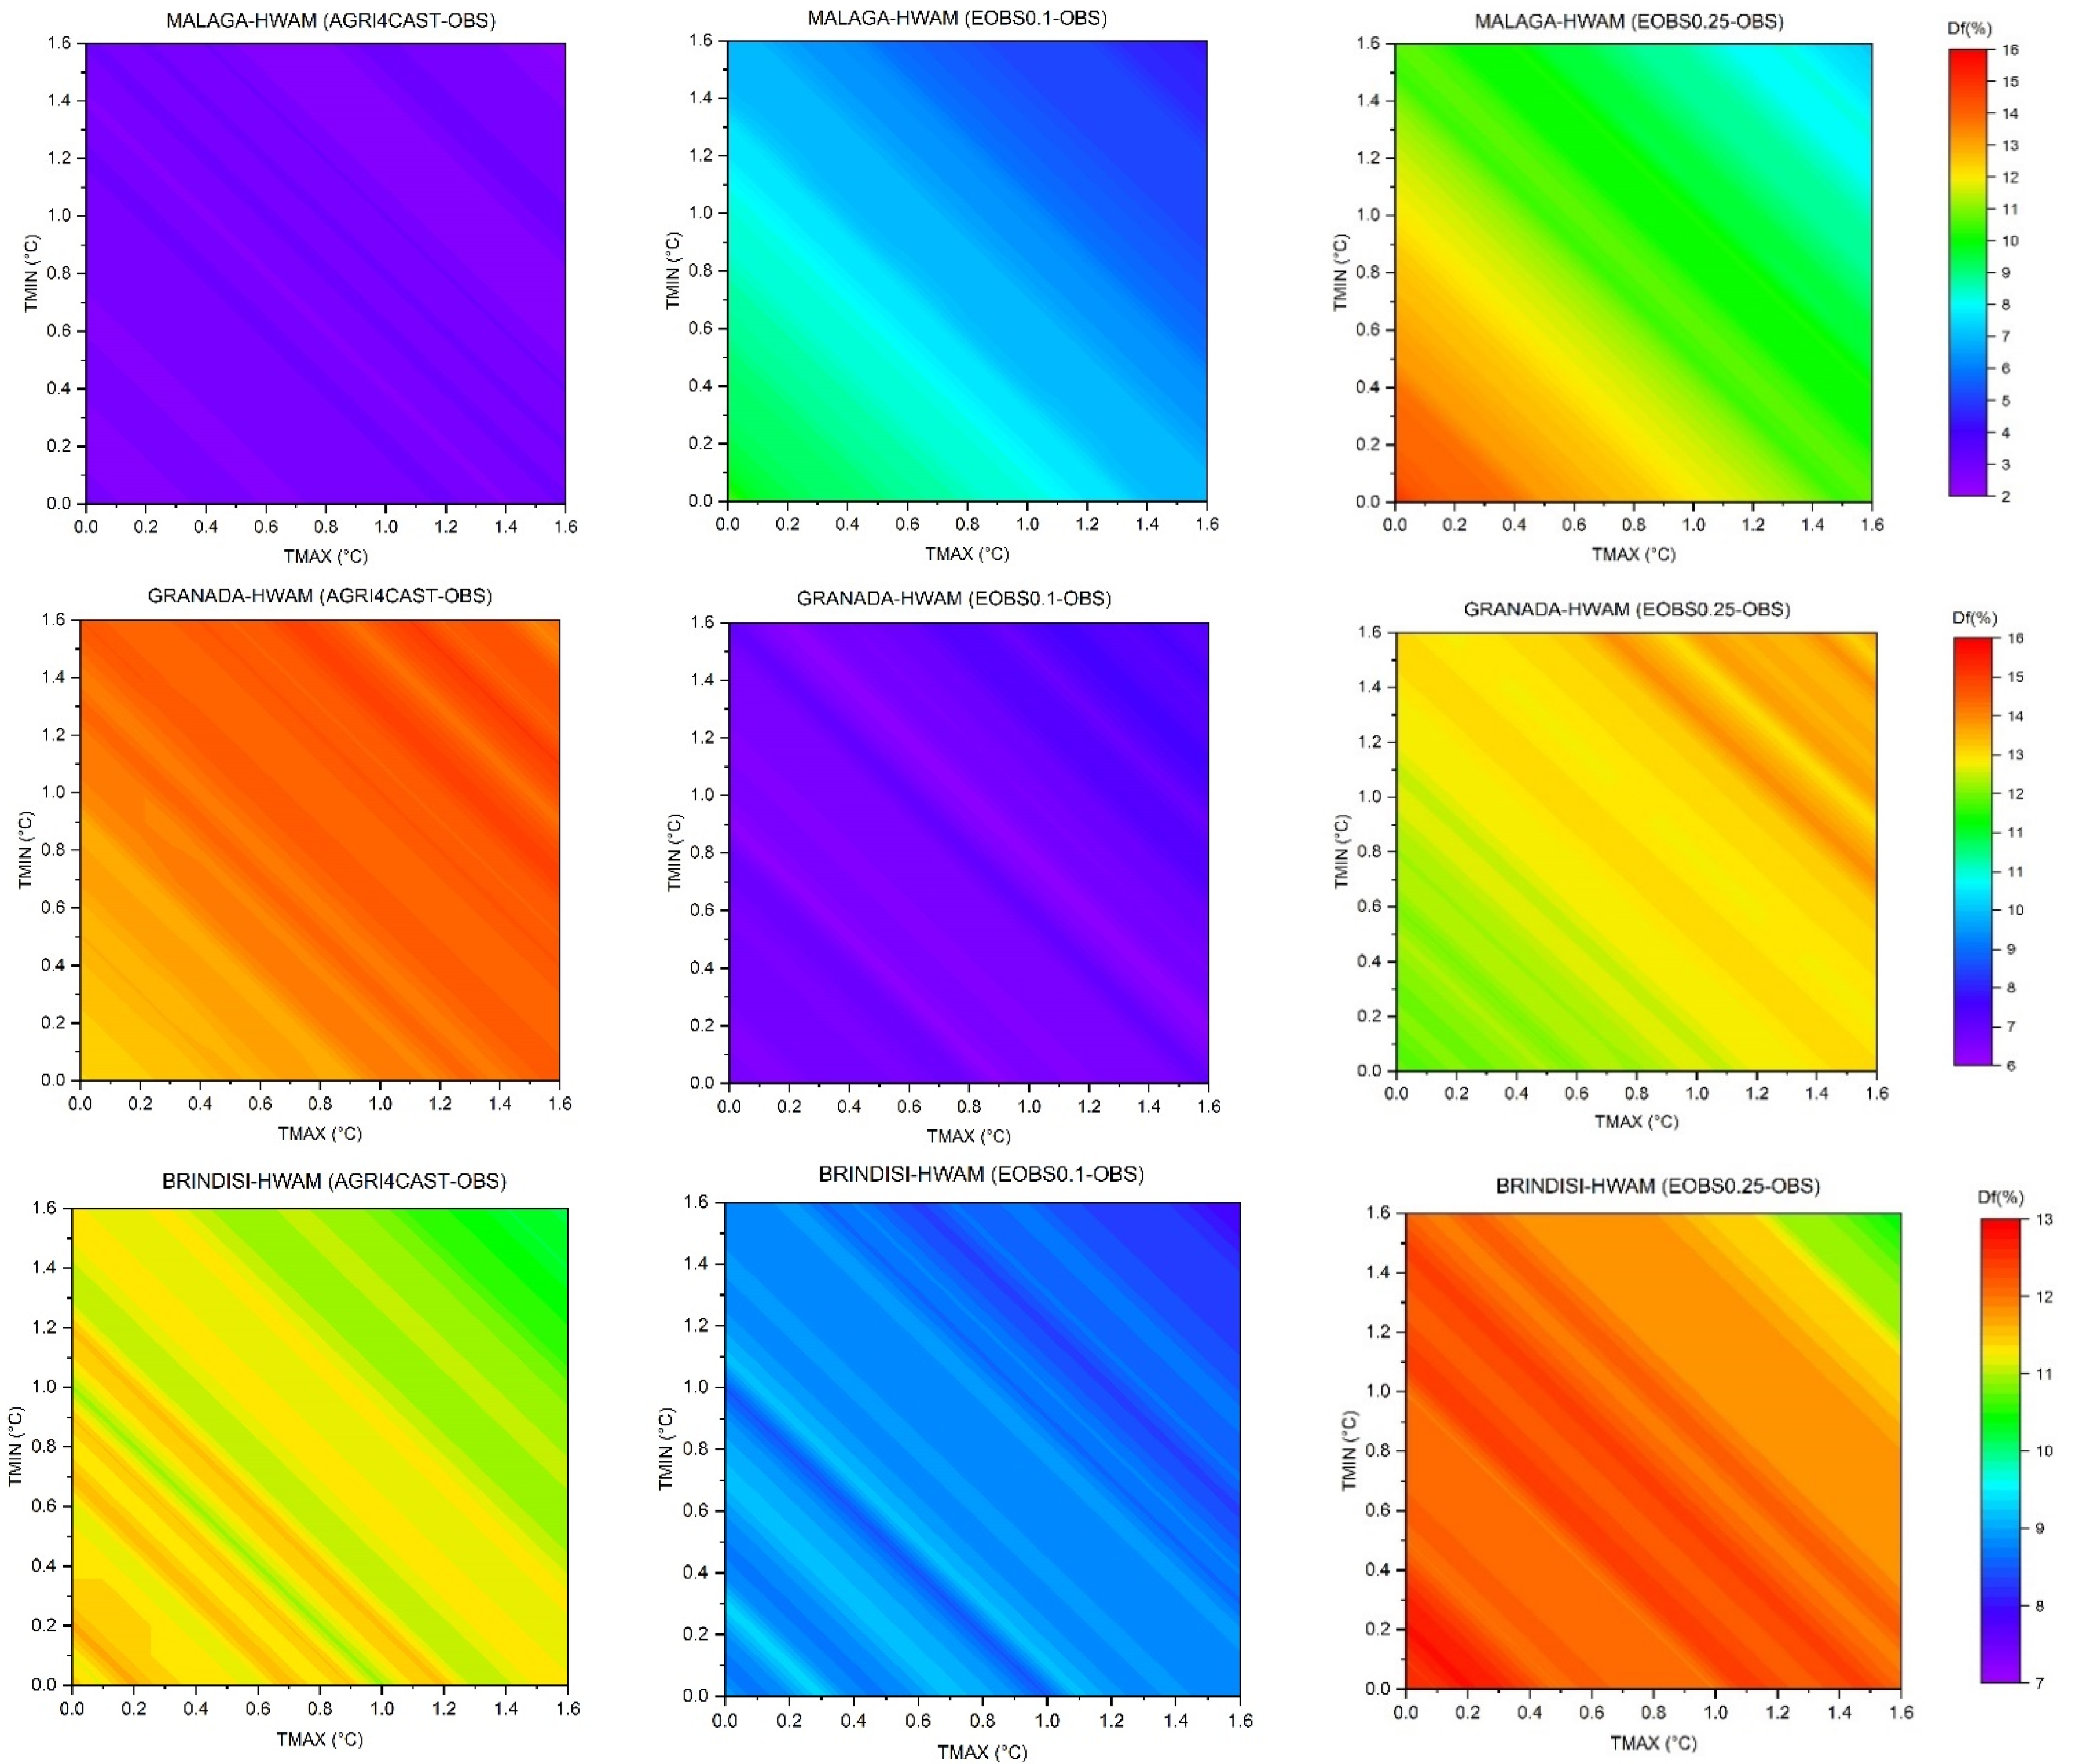
3.2.2. Sensitivity Tests

EOBS-0.1 remained the best choice after the sensitivity tests were conducted, as it presented the lowest, compared to other gridded data, deviations for anthesis (4.2 days on average, varying from −1.8 days in Melilla to 10.5 days in Thessaloniki) at four stations, maturity (3.3 days on average, varying from −9.3 days in Thessaloniki to 8.3 days in Granada) at four stations, and yield (8.2% on average, spanning from 0.1% in Perpignan to 28.3% in Thessaloniki) at five stations, and EOBS-0.25 the largest (Figure 8). The superiority of EOBS-0.1 was further confirmed when the correlation coefficient r and %RMSE were estimated. Interestingly, with respect to the reference period, warming decreased the discrepancies in the timing of development stages (with EOBS-0.1, for example, from +4.7 to +4.2 days, on average, for anthesis and from +5.7 to +3.3 days, on average, for maturity) and slightly increased these in simulated yield (with EOBS-0.1, from +7.7 to +8.2%, on average, for harvesting) (Figure 8).
The mean deviations between gridded and measured weather (expressed as gridded-measured (days)) data simulated with CERES-Wheat anthesis for Malaga, Granada, and Brindisi to changes in Tmax and Tmin are illustrated as impact response surfaces (IRS) in Figure 9 (see Figure S5 for the other stations). As a result, positive or negative differences indicate early or delayed anthesis compared to those found with observations, respectively. The gridded products projected earlier (because of error decreasing) by a few days anthesis with future warming. In Granada, for example, an earlier by three days (the deviation from +10 days with the reference climate was reduced to +7 days in the near future (NF)) anthesis is projected with EOBS-0.1 as a result of a temperature increase of at least 1.2 °C. The respective shift in Brindisi by using the same product due to a temperature increase of at least 1.3 °C in the NF is two days (from +3 days with the reference climate to +1 day in the NF) (Figure 9).
The response of maturity was like anthesis with future warming due to error decreasing in NF by using gridded data. As a result, the delay of maturity using EOBS-0.1 and Agri4Cast is reduced by a few days compared to that using observations (Figure S6). For example, an earlier maturity by a day (from +3 days with the reference climate to +2 days in NF) is projected in Brindisi by using EOBS-0.1 due to a temperature increase of at least 1.2 °C in NF. It should also be noted that the similar effects of Tmax and Tmin from EOBS-0.1 and Agri4Cast on both development stages with warming.
The response of grain yield to future warming due to errors caused by using gridded data differed among the stations considered in this study (Figure 10 and Figure S7). Small decreases in yield overestimations are projected in Nice and Brindisi (from about +4% and +9.5% with the reference climate to +3% and +8% in NF, for the former and latter station, respectively) by using EOBS-0.1 due to temperature increases of at least 1.2 °C in NF. Similar in magnitude and direction was the yield response to temperature increases in Malaga with Agri4Cast. In Granada and Thessaloniki, on the other hand, increases in yield overestimation, from +6% and +25% with the reference climate, increased to +8% in NF for the former station using EOBS-0.1 and +31% for the latter using EOBS-0.25. Even smaller yield responses with future warming were found in Melilla and Perpignan using EOBS-0.1-derived data, in Lleida with EOBS-0.25, and in Marseilles with Agri4Cast.

4. Discussion

Although meteorological stations continue to be the primary source of meteorological data, gridded data can be a valuable source of information in the study of weather and climate in areas with a limited or non-existent network of observing stations. The current study used maximum (Tmax) and minimum (Tmin) air temperature, precipitation (Prec), and solar radiation (QQ) data for the period 1980–2019 from three gridded products (Agri4Cast and E-OBS) at two spatial resolutions (10 km (EOBS-0.1) and 25 km (EOBS-0.25)), as well as observations from 13 Mediterranean stations (OBS) chosen for their proximity to wheat crops. The main objectives were to assess (i) the skills of gridded data in reproducing the observed climate type based on the Köppen–Trewartha climate classification and compare them with respective measured data from the selected stations using statistical measures and extreme temperature- and precipitation-related indices, and (ii) the sensitivity of wheat development and yield simulated with CERES-Wheat, employing impact response surfaces, for the reference period and across a wide range of Tmax and Tmin. Two hundred and eighty-nine sensitivity tests were conducted by applying consistent positive and synchronous adjustments (from 0 °C to +1.6 °C in steps of 0.1) in the daily temperature series. The primary findings for each objective follow:
i.
Agri4Cast and EOBS-0.1, the best products across stations, correctly identified the C-type climates but only partially the B-type climates. EOBS-0.1, the best-gridded product, underestimated the observed monthly means and medians of Tmax, Tmin, and Prec and overestimated QQ. On a station-based seasonal analysis, EOBS-0.1 was closer to the observed means and medians of Tmax and Tmin, followed by Agri4Cast. Its performance, however, varied with the season and statistical measures used. EOBS-0.1 was closer to observed precipitation means at 7 to 9 stations (variable with season), and they presented lower rRMSE and higher associations. With respect to EOBS-0.25-derived solar radiation, EOBS-0.1 was superior in spring and summer and presented lower rRMSE values and higher associations (but lower in relation to precipitation).
Regarding extreme temperature-related indices, the quality of gridded data varied with season and index. EOBS-0.1 showed better skills in approximating the observed frequencies of frost days in winter. In spring, the frequency of frost and summer days were better reproduced by EOBS-0.25 and Agri4Cast, respectively. In summer, EOBS-0.1 exhibited the lowest discrepancies in summer days and Agri4Cast the frequency of tropical nights. In autumn, negligible differences were found in the abilities of gridded products, except for EOBS-0.1 skills in reproducing the frequency of summer days. While EOBS-0.25 was closer to the observed seasonal frequencies of wet days with the lower threshold (0.1 mm), increasing the threshold to 1 mm favored EOBS-0.1 in reproducing the 95th and 99th percentiles and frequencies of observed precipitation.
The comparison of the 1981–2010 mean daily temperature data of ERA5 (with 31 km spatial resolution) with the respective EOBS-0.25 and ECA&D observational data by [47] across Europe showed similar results in terms of RMSE and r. For the Mediterranean and Iberian sectors (which included the 13 stations of the current study), r was 0.998 and 0.999, and the RMSE was 1.39 °C and 1.10 °C, respectively, on an annual basis. ERA5 also underestimated the observational annual means of the Mediterranean sector by 1.32 °C and of the Iberian by 1.04 °C. They concluded that ERA5 captures the spatial distribution of temperature over Europe and reported limitations over areas with sharp orography, complex terrain, and a sparse observational network, such as the Alpine region and the Mediterranean mountain windward regions. [48] compared five gridded datasets (ERA-Interim, Agri4Cast, UERRA MESCAN-SURFEX, ERA5-Land, and E-OBS) in reproducing selected spatiotemporal characteristics of air temperature measured at 19 wine production regions in Greece during 1981–2012. EOBS-0.25 was the best performer in terms of maximum and minimum temperatures, underestimating the observations. Agri4Cast, the second-best option, overestimated observations. The same gridded sets were also identified as the better sources of daily precipitation (mostly underestimating the observations, however) in Greece, compared with ERA-Interim [12]. Ref. [49] evaluated the performance of E-OBS and CRU for reproducing station-based precipitation and temperature data (with a particular focus on trends of the weather parameters and on two aridity indices (De Martonne (DMI) and the Pinna combinative (PCI)) over the Apulia region in southern Italy during 1956–2019). They concluded that the gridded data products allow only general indications of the spatial-temporal evolution of aridity classification in the region. Ref. [50] evaluated the ability of EOBS-0.25 to reproduce observed temperature and precipitation data and indices from meteorological stations across the NE Mediterranean sub-region during 1961–1990. The analysis, in agreement with this study, revealed that (i) the gridded dataset satisfactorily reproduced temperature data and related extreme indices, better than precipitation, in most study sites, with deviations evident at high elevation locations, and (ii) tended to underestimate the extreme temperature- and precipitation-related indices used. Our study also confirmed the results of [51] regarding the overestimation of measured irradiation in France and North Africa by reanalysis products (the %RMSE for ERA-Interim ranged from 31% to 43% in France and from 10% to 25% in North Africa) due to overestimation of the occurrence of clear sky conditions.
ii.
The gridded products predicted later anthesis, maturity and overestimated yield production, for the reference period. EOBS-0.1 presented the lower deviations (4.7 days on average for anthesis, 5.7 days on average for maturity, and overestimated yield by 7.7%), and EOBS-0.25 the largest. The yield overestimation by the EOBS-0.1 is primarily due to the delay in simulated EOBS-0.1 anthesis and maturity and thus growing season length, which gives wheat more time to accumulate biomass and yield.
Ref. [46] assessed the agreement of grid weather data (Daymet and PRISM) with measured weather data and the degree to which this agreement may influence simulated maize growth and development with hybrid maize in the US corn belt. Since the rRMSE for yield, unlike for anthesis and maturity, exceeded 15%, they concluded that while gridded data appear to be robust for applications that only require temperature for the prediction of crop stages, they should not be used for applications that depend on accurate estimation of crop water balance, crop growth, and yield. Ref. [34] reached similar conclusions assessing three gridded products (CRU, NCEP/DOE, and NASA POWER) for three crops in China (rice with the ORYZA2000 crop model), the USA (maize with the hybrid maize crop model), and Germany (wheat with the CERES-Wheat crop model).
In this study, rRMSE remained well below 15% for anthesis, maturity, and yield (except for Thessaloniki), suggesting that the degree of agreement of gridded data in reproducing simulated crop responses decreased in regions with low network density. This was a result of the difficulty in reproducing the statistical properties of the weather observations in Thessaloniki. Therefore, the gridded weather data from EOBS-0.1 appear to be robust even for accurate estimation of potential wheat yield (although with less confidence than for development stages). It should be mentioned, however, that conclusions will probably be different when simulation runs with CERES-Wheat are conducted in rainfed mode (i.e., at a water- and/or nutrient-limited production level), like in the above-mentioned studies, since the performance of CERES-Wheat and generally of crop models is more satisfactory than under resource-limiting conditions in some growing stages [52,53].
EOBS-0.1 remained the best choice in this study, and after the application of sensitivity tests predicting later anthesis (by 4.2 days on average), maturity (by 3.3 days on average), and higher yield (by 8.2% on average), EOBS-0.25 remained the worst. When the discrepancies estimated with Ceres-Wheat anthesis, maturity, and yield between the gridded products and the observed time series were illustrated in the form of impact response surfaces (IRS): (i) The delayed anthesis and maturity caused by the use of gridded data in the reference period were reduced by a few (2–3) days in the NF; (ii) the response of grain yield, on the other hand, was not uniform and differed among the stations considered in this study; and (iii) both development stages and yield were equally responsive to similar magnitude adjustments of Tmax and Tmin. A crop yield decline with respect to a wide range of sensitivity tests in temperature through IRS was confirmed for wheat employing a large ensemble of crop simulation models in Finland, Germany, and Spain [54], and soybean in the USA [55].

5. Conclusions

The study assessed the agreement of gridded weather data (Agri4Cast and E-OBS) at two spatial resolutions (10 km (EOBS-0.1) and 25 km (EOBS-0.25)) with observations from several Mediterranean stations chosen for their proximity to wheat crops and the degree to which this agreement may influence simulated wheat development and production with CERES-Wheat. EOBS-0.1, the best-gridded product, with respect to observations:
  • underestimated monthly and seasonal averages of Tmax, Tmin, and Prec, and underestimated related to temperature (days with Tmax > 25 °C, Tmax < 0 °C, Tmin > 20 °C, and Tmin < 0 °C) and precipitation (days with Prec ≥ 0.1 mm, Prec ≥ 1 mm, and the 95th and 99th percentiles) extreme indices.
  • presented well below 15% rRMSE in simulation with CERES-Wheat anthesis, maturity, and yield (delays for the development stages and overestimated grain production were found) for the reference period. These deviations, over a wide range of sensitivity tests in Tmax and Tmin, using impact response surfaces, were further reduced in the case of crop development while increasing in most stations in the case of wheat production.
Although this study cannot be considered an independent validation of the gridded datasets (since the selected stations for assessing the performance of the corresponding grids might have been used for the construction of the gridded products) and assumed no changes in solar radiation in the Mediterranean basin in NF (in agreement with the results of [56]), it demonstrated the capacity of EOBS-0.1 for applications that depend on potential wheat development and productivity in current and warming future conditions expected in the Mediterranean region. Further research is required for assessing uncertainties related to water and/or nitrogen stress (i.e., testing at a water- and/or nutrient-limited production level), different crop models, crops, and climate conditions.

Supplementary Materials

The following supporting information can be downloaded at: https://www.mdpi.com/article/10.3390/cli11090180/s1, Table S1: Missing data for each station and meteorological parameter. X = absence of meteorological data. “Produced by the authors”.; Table S2: Latitude (°), longitude (°), and altitude (m) of observations (OBS) and grid products (AGRI4CAST, EOBS-0.1 and EOBS-0.25). “Produced by the authors”; Table S3: Genetic coefficients for Iride variety (Mereu et al., 2019); Table S4: Scale of correlation coefficient and interpretation of its calculated values (Hinkle et al. 1994); Table S5: Discrepancies of simulated with CERES-Wheat anthesis, maturity (expressed as Gridded (G) − Measured (M)) and harvested yield ((G − M)/M) × 100 (%) for the reference period. “Produced by the authors”; Table S6: rRMSE and r for anthesis, maturity and yield for the reference period. “Produced by the authors”; Figure S1: Illustrated maps for Tmax and Tmin (1st & 2nd row) and their variations (3d & 4th row) for the near future (2021–2040), for RCP 4.5 in continental Mediterranean regions according to IPCC (https://interactive-atlas.ipcc.ch/); Figure S2: Comparison between gridded data and OBS for minimum temperature (13 stations) and Prec (13 stations) (1st and 2nd row, respectively) for the reference period. “Produced by the authors”; Figure S3: Seasonal comparison of Tmin between gridded data and OBS for each season (they were ranked from west to east) and the reference period. “Produced by the authors”; Figure S4: Seasonal comparison of Prec between gridded data and OBS for each season (they were ranked from west to east) and the reference period. “Produced by the authors”; Figure S5: Discrepancies between gridded (EOBS-0.1, EOBS-0.25 and Agri4Cast) and measured (OBS) weather data of simulated with CERES-Wheat anthesis (expressed as Gridded −Measured (days)) for Melilla, Lleida, Perpignan, Marseilles, Nice and Thessaloniki to changes in maximum (Tmax) and minimum (Tmin) air temperature. “Produced by the authors”; Figure S6: Discrepancies between gridded (EOBS-0.1, EOBS-0.25 and Agri4Cast) and measured (OBS) weather data of simulated with CERES-Wheat anthesis (expressed as Gridded −Measured (days)) for each station to changes in maximum (Tmax) and minimum (Tmin) air temperature. “Produced by the authors”; Figure S7: As for Figure S5 but for grain yield (expressed as (Gridded − Measured)/Measured × 100). “Produced by the authors”.

Author Contributions

Conceptualization, T.M.; methodology, T.M.; software, T.M. and K.S.L.; validation, K.S.L.; formal analysis, K.S.L.; investigation, T.M. and K.S.L.; resources, K.S.L.; data curation, K.S.L.; writing—original draft preparation, K.S.L.; writing—review and editing, T.M. and K.S.L.; visualization, K.S.L.; supervision, T.M. All authors have read and agreed to the published version of the manuscript.

Funding

This research received no external funding.

Institutional Review Board Statement

Not applicable.

Informed Consent Statement

Not applicable.

Data Availability Statement

The data used in this study are available through the links provided in the respective references.

Conflicts of Interest

The authors declare no conflict of interest.

References

  1. Walton, D.; Hall, A. An Assessment of High-Resolution Gridded Temperature Datasets over California. J. Clim. 2018, 31, 3789–3810. [Google Scholar] [CrossRef]
  2. Lawrimore, J.H.; Menne, M.J.; Gleason, B.E.; Williams, C.N.; Wuertz, D.B.; Vose, R.S.; Rennie, J. An Overview of the Global Historical Climatology Network Monthly Mean Temperature Data Set, Version 3. J. Geophys. Res. Atmos. 2011, 116, D19121. [Google Scholar] [CrossRef]
  3. Pelosi, A.; Terribile, F.; D’Urso, G.; Chirico, G.B. Comparison of ERA5-Land and UERRA MESCAN-SURFEX Reanalysis Data with Spatially Interpolated Weather Observations for the Regional Assessment of Reference Evapotranspiration. Water 2020, 12, 1669. [Google Scholar] [CrossRef]
  4. Gelaro, R.; McCarty, W.; Suárez, M.J.; Todling, R.; Molod, A.; Takacs, L.; Randles, C.A.; Darmenov, A.; Bosilovich, M.G.; Reichle, R.; et al. The Modern-Era Retrospective Analysis for Research and Applications, Version 2 (MERRA-2). J. Clim. 2017, 30, 5419–5454. [Google Scholar] [CrossRef]
  5. Kanamitsu, M.; Kumar, A.; Juang, H.-M.H.; Schemm, J.-K.; Wang, W.; Yang, F.; Hong, S.-Y.; Peng, P.; Chen, W.; Moorthi, S.; et al. NCEP Dynamical Seasonal Forecast System 2000. Bull. Am. Meteorol. Soc. 2002, 83, 1019–1037. [Google Scholar] [CrossRef]
  6. Osborn, T.J.; Jones, P.D.; Lister, D.H.; Morice, C.P.; Simpson, I.R.; Winn, J.P.; Hogan, E.; Harris, I.C. Land Surface Air Temperature Variations Across the Globe Updated to 2019: The CRUTEM5 Data Set. J. Geophys. Res. Atmos. 2021, 126, e2019JD032352. [Google Scholar] [CrossRef]
  7. Lenssen, N.J.L.; Schmidt, G.A.; Hansen, J.E.; Menne, M.J.; Persin, A.; Ruedy, R.; Zyss, D. Improvements in the GISTEMP Uncertainty Model. J. Geophys. Res. Atmos. 2019, 124, 6307–6326. [Google Scholar] [CrossRef]
  8. Cos, J.; Doblas-Reyes, F.; Jury, M.; Marcos, R.; Bretonnière, P.-A.; Samsó, M. The Mediterranean Climate Change Hotspot in the CMIP5 and CMIP6 Projections. Earth Syst. Dyn. 2022, 13, 321–340. [Google Scholar] [CrossRef]
  9. Tuel, A.; Eltahir, E.A.B. Why Is the Mediterranean a Climate Change Hot Spot? J. Clim. 2020, 33, 5829–5843. [Google Scholar] [CrossRef]
  10. Royo, C.; Soriano, J.M.; Alvaro, F. Wheat: A Crop in the Bottom of the Mediterranean Diet Pyramid. In Mediterranean Identities—Environment, Society, Culture; Fuerst-Bjelis, B., Ed.; InTech: London, UK, 2017; ISBN 978-953-51-3585-2. [Google Scholar]
  11. Hodson, D.; White, J. GIS and Crop Simulation Modelling Applications in Climate Change Research. In Climate CHANGE and Crop Production; Reynolds, M.P., Ed.; CABI: Wallingford, UK, 2010; pp. 245–262. ISBN 978-1-84593-633-4. [Google Scholar]
  12. Mavromatis, T.; Voulanas, D. Evaluating ERA-Interim, Agri4Cast, and E-OBS Gridded Products in Reproducing Spatiotemporal Characteristics of Precipitation and Drought over a Data Poor Region: The Case of Greece. Int. J. Climatol. 2021, 41, 2118–2136. [Google Scholar] [CrossRef]
  13. Toreti, A.; Maiorano, A.; De Sanctis, G.; Webber, H.; Ruane, A.C.; Fumagalli, D.; Ceglar, A.; Niemeyer, S.; Zampieri, M. Using Reanalysis in Crop Monitoring and Forecasting Systems. Agric. Syst. 2019, 168, 144–153. [Google Scholar] [CrossRef] [PubMed]
  14. Climate Data Online (CDO)—The National Climatic Data Center’s (NCDC) Climate Data Online (CDO) Provides Free Access to NCDC’s Archive of Historical Weather and Climate Data in Addition to Station History Information.|National Climatic Data Center (NCDC). Available online: https://www.ncdc.noaa.gov/cdo-web/ (accessed on 8 July 2023).
  15. Agri4Cast ToolBox. Available online: https://agri4cast.jrc.ec.europa.eu/ (accessed on 8 July 2023).
  16. Baruth, B.; Genovese, G.; Le, O. CGMS Version 9.2: User Manual and Technical Documentation; Publications Office: Luxembourg, 2007. [Google Scholar]
  17. Home European Climate Assessment & Dataset. Available online: https://www.ecad.eu/ (accessed on 8 July 2023).
  18. Haylock, M.R.; Hofstra, N.; Klein Tank, A.M.G.; Klok, E.J.; Jones, P.D.; New, M. A European Daily High-Resolution Gridded Data Set of Surface Temperature and Precipitation for 1950–2006. J. Geophys. Res. 2008, 113, D20119. [Google Scholar] [CrossRef]
  19. Klok, E.J.; Klein Tank, A.M.G. Updated and Extended European Dataset of Daily Climate Observations. Int. J. Climatol. 2009, 29, 1182–1191. [Google Scholar] [CrossRef]
  20. Lavaysse, C.; Camalleri, C.; Dosio, A.; Van Der Schrier, G.; Toreti, A.; Vogt, J. Towards a Monitoring System of Temperature Extremes in Europe. Nat. Hazards Earth Syst. Sci. 2017, 18, 91–104. [Google Scholar] [CrossRef]
  21. Cornes, R.C.; Van Der Schrier, G.; Van Den Besselaar, E.J.M.; Jones, P.D. An Ensemble Version of the E-OBS Temperature and Precipitation Data Sets. J. Geophys. Res. Atmos. 2018, 123, 9391–9409. [Google Scholar] [CrossRef]
  22. E-OBS Data Access. Available online: https://surfobs.climate.copernicus.eu/dataaccess/access_eobs.php (accessed on 8 July 2023).
  23. Hoogenboom, G.; Porter, C.H.; Boote, K.J.; Shelia, V.; Wilkens, P.W.; Singh, U.; White, J.W.; Asseng, S.; Lizaso, J.I.; Moreno, L.P.; et al. The DSSAT Crop Modeling Ecosystem. In Advances in Crop Modelling for a Sustainable Agriculture; Burleigh Dodds Science Publishing: London, UK, 2019; p. 420. ISBN 978-0-429-26659-1. [Google Scholar]
  24. Jones, J.W.; Hoogenboom, G.; Porter, C.H.; Boote, K.J.; Batchelor, W.D.; Hunt, L.A.; Wilkens, P.W.; Singh, U.; Gijsman, A.J.; Ritchie, J.T. The DSSAT Cropping System Model. Eur. J. Agron. 2003, 18, 235–265. [Google Scholar] [CrossRef]
  25. Dettori, M.; Cesaraccio, C.; Duce, P. Simulation of Climate Change Impacts on Production and Phenology of Durum Wheat in Mediterranean Environments Using CERES-Wheat Model. Field Crops Res. 2017, 206, 43–53. [Google Scholar] [CrossRef]
  26. Symeonidis, K.; Mavromatis, T.; Kotzamanidis, S. Investigating with the Ceres-Wheat Model the Impacts of Soil and Climate Factors on Durum Wheat Performance and Earliness in Northern Greece. In Advances in Meteorology, Climatology and Atmospheric Physics; Helmis, C.G., Nastos, P.T., Eds.; Springer Atmospheric Sciences; Springer: Berlin/Heidelberg, Germany, 2013; pp. 743–749. ISBN 978-3-642-29171-5. [Google Scholar]
  27. Ritchie, J.; Otter, S. Description and Performance of CERES-Wheat: A User-Oriented Wheat Yield Model. USDA-ARS ARS-38 1985, 38, 159–175. [Google Scholar]
  28. Meteotemplate. Available online: http://www.meteotemplate.com/template/plugins/climateClassification/koppen.php (accessed on 8 July 2023).
  29. Peel, M.C.; Finlayson, B.L.; McMahon, T.A. Updated World Map of the Köppen-Geiger Climate Classification. Hydrol. Earth Syst. Sci. 2007, 11, 1633–1644. [Google Scholar] [CrossRef]
  30. World Meteorological Organization. Available online: https://public.wmo.int/en (accessed on 8 July 2023).
  31. Klein Tank, A.M.G.; Können, G.P. Trends in Indices of Daily Temperature and Precipitation Extremes in Europe, 1946–1999. J. Clim. 2003, 16, 3665–3680. [Google Scholar] [CrossRef]
  32. Frich, P.; Alexander, L.; Della-Marta, P.; Gleason, B.; Haylock, M.; Klein Tank, A.; Peterson, T. Observed Coherent Changes in Climatic Extremes during the Second Half of the Twentieth Century. Clim. Res. 2002, 19, 193–212. [Google Scholar] [CrossRef]
  33. Van Ittersum, M.K.; Leffelaar, P.A.; Van Keulen, H.; Kropff, M.J.; Bastiaans, L.; Goudriaan, J. On Approaches and Applications of the Wageningen Crop Models. Eur. J. Agron. 2003, 18, 201–234. [Google Scholar] [CrossRef]
  34. Wart, J.; Grassini, P.; Cassman, K.G. Impact of Derived Global Weather Data on Simulated Crop Yields. Glob. Change Biol. 2013, 19, 3822–3834. [Google Scholar] [CrossRef] [PubMed]
  35. Godfray, H.C.J.; Beddington, J.R.; Crute, I.R.; Haddad, L.; Lawrence, D.; Muir, J.F.; Pretty, J.; Robinson, S.; Thomas, S.M.; Toulmin, C. Food Security: The Challenge of Feeding 9 Billion People. Science 2010, 327, 812–818. [Google Scholar] [CrossRef] [PubMed]
  36. Mereu, V.; Gallo, A.; Spano, D. Optimizing Genetic Parameters of CSM-CERES Wheat and CSM-CERES Maize for Durum Wheat, Common Wheat, and Maize in Italy. Agronomy 2019, 9, 665. [Google Scholar] [CrossRef]
  37. Pickering, N.B.; Hansen, J.W.; Jones, J.W.; Wells, C.M.; Chan, V.K.; Godwin, D.C. WeatherMan: A Utility for Managing and Generating Daily Weather Data. Agron. J. 1994, 86, 332–337. [Google Scholar] [CrossRef]
  38. Richardson, C.W.; Wright, D.A. WGEN: A Model for Generating Daily Weather Variables; U.S. Dept. of Agriculture, Agricultural Research Service; National Technical Information Service (NTIS): Washington, DC, USA, 1984; Volume ARS-8.
  39. IPCC WGI Interactive Atlas. Available online: https://interactive-atlas.ipcc.ch/ (accessed on 8 July 2023).
  40. Mariotti, A.; Pan, Y.; Zeng, N.; Alessandri, A. Long-Term Climate Change in the Mediterranean Region in the Midst of Decadal Variability. Clim. Dyn. 2015, 44, 1437–1456. [Google Scholar] [CrossRef]
  41. Zittis, G.; Hadjinicolaou, P.; Klangidou, M.; Proestos, Y.; Lelieveld, J. A Multi-Model, Multi-Scenario, and Multi-Domain Analysis of Regional Climate Projections for the Mediterranean. Reg. Environ. Chang. 2019, 19, 2621–2635. [Google Scholar] [CrossRef]
  42. Cordex—Coordinated Regional Climate Downscaling Experiment. Available online: https://cordex.org/ (accessed on 8 July 2023).
  43. Carter, T.R.; Fronzek, S. A Model-Based Response Surface Approach for Evaluating Climate Change Risks and Adaptation Urgency. In Climate Adaptation Modelling; Kondrup, C., Mercogliano, P., Bosello, F., Mysiak, J., Scoccimarro, E., Rizzo, A., Ebrey, R., Ruiter, M.D., Jeuken, A., Watkiss, P., Eds.; Springer Climate; Springer International Publishing: Cham, Switzerland, 2022; pp. 67–75. ISBN 978-3-030-86210-7. [Google Scholar]
  44. Pirttioja, N.; Palosuo, T.; Fronzek, S.; Räisänen, J.; Rötter, R.P.; Carter, T.R. Using Impact Response Surfaces to Analyse the Likelihood of Impacts on Crop Yield under Probabilistic Climate Change. Agric. For. Meteorol. 2019, 264, 213–224. [Google Scholar] [CrossRef]
  45. Hinkle, D.E.; Wiersma, W.; Jurs, S.G. Applied Statistics for the Behavioral Sciences, 3rd ed.; Houghton Mifflin: Boston, MA, USA, 1994. [Google Scholar]
  46. Mourtzinis, S.; Rattalino Edreira, J.I.; Conley, S.P.; Grassini, P. From Grid to Field: Assessing Quality of Gridded Weather Data for Agricultural Applications. Eur. J. Agron. 2017, 82, 163–172. [Google Scholar] [CrossRef]
  47. Velikou, K.; Lazoglou, G.; Tolika, K.; Anagnostopoulou, C. Reliability of the ERA5 in Replicating Mean and Extreme Temperatures across Europe. Water 2022, 14, 543. [Google Scholar] [CrossRef]
  48. Voulanas, D.; Mavromatis, T. Evaluation of Five Reanalysis Products in Reproducing the Spatio-Temporal Characteristics of Air Temperature over Greece. In Proceedings of the 15th International Conference on Meteorology, Climatology and Atmospheric Physics—COMECAP 2021, Ioannina, Greece, 26–29 September 2021; pp. 320–323. [Google Scholar]
  49. My, L.; Di Bacco, M.; Scorzini, A.R. On the Use of Gridded Data Products for Trend Assessment and Aridity Classification in a Mediterranean Context: The Case of the Apulia Region. Water 2022, 14, 2203. [Google Scholar] [CrossRef]
  50. Kostopoulou, E.; Giannakopoulos, C.; Hatzaki, M.; Tziotziou, K. Climate Extremes in the NE Mediterranean: Assessing the E-OBS Dataset and Regional Climate Simulations. Clim. Res. 2012, 54, 249–270. [Google Scholar] [CrossRef]
  51. Boilley, A.; Wald, L. Comparison between Meteorological Re-Analyses from ERA-Interim and MERRA and Measurements of Daily Solar Irradiation at Surface. Renew. Energy 2015, 75, 135–143. [Google Scholar] [CrossRef]
  52. Timsina, J.; Humphreys, E. Performance of CERES-Rice and CERES-Wheat Models in Rice–Wheat Systems: A Review. Agric. Syst. 2006, 90, 5–31. [Google Scholar] [CrossRef]
  53. Wei, Y.; Ru, H.; Leng, X.; He, Z.; Ayantobo, O.O.; Javed, T.; Yao, N. Better Performance of the Modified CERES-Wheat Model in Simulating Evapotranspiration and Wheat Growth under Water Stress Conditions. Agriculture 2022, 12, 1902. [Google Scholar] [CrossRef]
  54. Pirttioja, N.; Carter, T.; Fronzek, S.; Bindi, M.; Hoffmann, H.; Palosuo, T.; Ruiz-Ramos, M.; Tao, F.; Trnka, M.; Acutis, M.; et al. Temperature and Precipitation Effects on Wheat Yield across a European Transect: A Crop Model Ensemble Analysis Using Impact Response Surfaces. Clim. Res. 2015, 65, 87–105. [Google Scholar] [CrossRef]
  55. Ruane, A.C.; McDermid, S.; Rosenzweig, C.; Baigorria, G.A.; Jones, J.W.; Romero, C.C.; DeWayne Cecil, L. Carbon-Temperature-Water Change Analysis for Peanut Production under Climate Change: A Prototype for the AgMIP Coordinated Climate-Crop Modeling Project (C3MP). Glob. Chang. Biol. 2014, 20, 394–407. [Google Scholar] [CrossRef]
  56. Coppola, E.; Nogherotto, R.; Ciarlo’, J.M.; Giorgi, F.; Meijgaard, E.; Kadygrov, N.; Iles, C.; Corre, L.; Sandstad, M.; Somot, S.; et al. Assessment of the European Climate Projections as Simulated by the Large EURO-CORDEX Regional and Global Climate Model Ensemble. J. Geophys. Res. Atmos. 2021, 126, e2019JD032356. [Google Scholar] [CrossRef]
Figure 1. Spatial distribution of Mediterranean meteorological stations and gridded cells’ centers. “Produced by the authors”.
Climate 11 00180 g001
Figure 2. Flowchart of study. “Produced by the authors”.
Climate 11 00180 g002
Figure 3. Sensitivity tests in maximum and minimum air temperatures. “Produced by the authors”.
Climate 11 00180 g003
Figure 4. Comparison between gridded data and OBS for maximum temperature (13 stations) and solar radiation (9 stations) (1st and 2nd rows, respectively) in winter and spring months for the reference period. “Produced by the authors”.
Climate 11 00180 g004
Figure 5. Station-by-station comparison between gridded data and OBS for maximum temperature in winter and spring months for the reference period (the stations were ranked from west to east). “Produced by the authors”.
Climate 11 00180 g005
Figure 6. As for Figure 5, only mean monthly solar radiation (QQ) is shown. “Produced by the authors”.
Climate 11 00180 g006
Figure 7. Comparison of temperature- and precipitation related indices in winter and spring for measured (OBS) and gridded data during the reference period (n = 13 stations). “Produced by the authors”.
Climate 11 00180 g007
Figure 8. Discrepancies of simulated with CERES-Wheat anthesis, maturity (expressed as gridded (G), − measured (M)), and harvested yield ((G − M)/M) × 100(%) for the reference period (1st row) and sensitivity tests (2nd row). “Produced by the authors”.
Climate 11 00180 g008
Figure 9. Discrepancies between gridded (EOBS-0.1, EOBS-0.25, and Agri4Cast) and measured (OBS) weather data simulated with CERES-Wheat anthesis (expressed as gridded-measured (days)) for Malaga (1st row), Granada (2nd row), and Brindisi (3rd row) to changes in maximum (Tmax) and minimum (Tmin) air temperatures. “Produced by the authors”.
Climate 11 00180 g009
Figure 10. As for Figure 9, but the relative changes in harvested yield are shown. “Produced by the authors”.
Climate 11 00180 g010
Table 1. Reference period for each station and meteorological parameter (X indicates absence of solar radiation meteorological data). The last column shows the reference periods for CERES-Wheat runs.
Reference Period
StationTMAX/TMIN/PRECSol.RadCeres-Wheat
MALAGA, SP1980–20191980–20191980–2019
GRANADA, SP1980–20191980–20191980–2019
MELILLA, SP1980–20191980–20191980–2019
LLEIDA, SP1980–20191991–20191991–2019
PERPIGNAN, FR1980–20191980–20191980–2019
MONTPELLIER, FR1980–2019X
MARSEILLES, FR1980–20191980–20191980–2019
NICE, FR1980–20191980–20171980–2017
CAGLIARI, IT1980–2019X
BRINDISI, IT1980–20191980–20171980–2017
LARISA, GR1980–2019X
THESSALONIKI, GR1980–20191980–20091980–2009
LARNACA, CY1980–2019X
Table 2. Projected changes of different percentiles of maximum (Tmax) and minimum Tmin (°C) air temperature according to IPCC for the Mediterranean region, for the near future, and for different RCP scenarios (reference period 1981–2010).
Tmax (°C)
PeriodScenarioMedian (°C) P25 (°C)P75 (°C)P10 (°C)P90 (°C)P5 (°C)P95 (°C)
Near future (2021–2040)RCP2.60.90.81.30.71.60.61.6
RCP4.50.90.910.81.40.81.5
RCP8.51.111.20.81.60.81.6
Tmin (°C)
PeriodScenarioMedian (°C)P25 (°C)P75 (°C)P10 (°C)P90 (°C)P5 (°C)P95 (°C)
Near future (2021–2040)RCP2.60.90.81.30.71.50.61.6
RCP4.50.90.80.90.81.40.71.4
RCP8.51.10.91.10.81.60.81.6
Table 3. Climate type determination based on the Köppen–Trewartha climate classification for each station using OBS and gridded data. The stations are presented according to their latitude (from west to east).
StationOBSAGRI4CASTEOBS–0.1EOBS–0.25
MALAGA AEROPUERTO, SPCsaCsaCsaCsa
GRANADA AEROPUERTO, SPCsaCsaCsaCsa
MELILLA, SPBshBskBskBsk
LLEIDA, SPBskBskBskBsk
PERPIGNAN, FRCsaCsaCsaCsa
MONTPELLIER AEROPORT, FRCsaCsaCsaCsa
MARSEILLES MARIGNANE, FRCsaCsaCsaCsa
NICE, FRCsaCsaCsaCsa
CAGLIARI, ITCsaCsaCsaCsa
BRINDISI, ITCsaCsaCsaCsa
LARISSA, GRBskBskBskBsk
THESSALONIKI, GRBskBskBskBsk
LARNACA, CYBshBshBshCsa
Disclaimer/Publisher’s Note: The statements, opinions and data contained in all publications are solely those of the individual author(s) and contributor(s) and not of MDPI and/or the editor(s). MDPI and/or the editor(s) disclaim responsibility for any injury to people or property resulting from any ideas, methods, instructions or products referred to in the content.

