Article

Hydrological and Precipitation Extremes and Trends over the Paraiba do Sul River Basin, Brazil

by
Débora Martins de Oliveira
*,
Vanessa Silveira Barreto Carvalho
,
Benedito Cláudio da Silva
,
Michelle Simões Reboita
and
Bruno de Campos
Instituto de Recursos Naturais, Departamento de Ciências Atmosféricas, Universidade Federal de Itajubá, Itajubá 37500-903, Brazil
*
Author to whom correspondence should be addressed.
Climate 2023, 11(7), 138; https://doi.org/10.3390/cli11070138
Submission received: 3 June 2023 / Revised: 18 June 2023 / Accepted: 20 June 2023 / Published: 27 June 2023
(This article belongs to the Special Issue Global Warming and Extreme Drought)

Abstract

:
The Paraiba do Sul River Basin (PSRB) is a vital source of water resources in Brazil, providing water for human consumption, industry, agriculture, and hydroelectric energy generation. As part of one of the most developed areas of the country, in the Southeast of Brazil, the region is vulnerable to the impacts of climate change, with evidence of extreme events such as droughts and floods affecting the availability and quality of water. Hence, this study analyzes precipitation and streamflow rates data from the PSRB between 1939–2020 to investigate the spatial variability of average patterns and extreme events, trends, and their relationship with urban growth and socioeconomic development. The analysis reveals significant spatial variations in precipitation and runoff rates, with higher altitude areas, such as the Serra da Mantiqueira, exhibiting higher average values. Moreover, the Mann–Kendall trend results showed in most of the sites no significant trend regarding precipitation data; however, about 50% of the sites in the PSRB presented a decreasing trend of runoff rates. Since the precipitation does not explain identified changes in the hydrological patterns, the evaluation of the area’s urban growth and socioeconomic development throughout the decades suggested that human activities, such as those associated with urbanization, have played a significant role in altering the runoff patterns in the basin. These findings highlight the importance of sustainable land-use planning and water resource-management practices in the PSRB to mitigate the negative impacts of urbanization on the hydrological cycle and to enhance the resilience of the region’s water resources.

1. Introduction

According to the Sixth Assessment Report on Climate Change (AR6-WGI) of the Intergovernmental Panel on Climate Change—IPCC [1], an increase of at least 1.5 °C in the global average temperature is expected by 2030, which can lead to changes in the hydrological regime, both on local and global scales and even in the most optimistic climate-change scenarios. As a consequence, the increase in the frequency of meteorological and hydrological extreme events such as prolonged droughts or floods should promote additional changes in water availability in a given region and may affect the quality of life of communities around the world in comparison to the current climate conditions [2,3,4]. Evidence of the increase in the frequency of extreme precipitation and flood events and their impacts have already been reported in the literature by different regions of the globe [5,6,7,8]. Hence, since fresh water is a natural resource with limited availability, the assessment of the average behavior and anomalies of rainfall and runoff rates in a water basin is vital for the management of water resources and essential to ensure sustainability in the near future.
In Brazil, the Paraiba do Sul River Basin (PSRB) stands out in the economic and geographical scenarios since it is located in the states with the highest population density and economic development in the country (São Paulo, Rio de Janeiro, and Minas Gerais), being responsible for a large part of the public water supply in the region [9] with a total water demand estimated at more than 20 m3.s−1. According to the National Water Agency (Agência Nacional de Águas, ANA) [10], the water demand in the PSRB is rising because of several socioeconomic activities and successive transformations due to the urban–industrial development of the region, and it is expected to grow by approximately 24% over the next 10 years. The water usage in the region includes the generation of hydroelectric energy; consumption by activities such as industry, agriculture, mining, and fishing; and urban supply, responsible for the water used by 14 million people [11].
Between 2014 and 2017, the PSRB recorded severe rainfall deficits, leading to drought conditions with impacts on the availability of water for human supply, hydroelectric generation, industry, and agriculture [12]. Ref. [13] showed that this specific drought event caused a water crisis with significant impacts on users of the Paraiba do Sul and Guandu rivers. Ref. [14] also reinforce the drought that occurred between 2013 and 2014 as a critical period regarding the reduction of regional rainfall, which impacted the storage and regularization capacity of the main reservoir in the region, the Paraibuna Reservoir. By contrast, there are records of severe flood events in the PSRB with social and economic impacts. Ref. [15] identified, through remote-sensing images, the areas affected by the floods that occurred in the summer period of 2008/2009 in the North Fluminense region of Rio de Janeiro State. Ref. [16] also studied an episode of intense rains that occurred in January 2000 in the PSRB that accumulated, in just five days, almost 50% of the expected precipitation volume for the entire month. Numerical weather prediction techniques have also been applied to investigate rainfall over the Basin. Ref. [17] evaluated the performance of cloud microphysics and cumulus convection parameterizations using WRF, to simulate a severe rainfall event over the PSRB that occurred in January 2016. The results were then compared against ground observations, weather radar data, and satellite-based precipitation estimates. Overall, the simulations tended to underestimate precipitation fields by an average bias of 55%; however, good adjustments were found in terms of time correlations and convective activity, essential for warning purposes. These results reinforce the importance of planning the operation of the PSRB hydraulic system, as well as the analysis and forecast of positive or negative extremes of precipitation and specific flow.
Concerning PSRB, there is an inhomogeneous signal of trends in precipitation and streamflow. For instance, [18] analyzed trends in precipitation and streamflow data in the PSRB between 1920 and 2000 and found no significant positive or negative trends using the Mann–Kendall Test (MK) for precipitation; however, the streamflow data presented negative trends over the last 50 years that do not seem to be associated with changes in the rainfall throughout the basin. The authors concluded that negative trends of streamflow suggested a possible impact of human influence due to water resource management, power generation, sewage discharge into the river, irrigation, and population growth. Ref. [19] also used the MK to detect significant trends in precipitation data on 92 sites in the PSRB from 1970 to 2018 and concluded that the rainfall regime in the basin has been changing on a local scale, with regions that showed significant negative trends, while others showed a significant positive trend of precipitation. Ref. [2] also calculated trends, based on the MK test, of precipitation data from 86 sites distributed by PSRB between 1988 and 2018, and also concluded that about 20.9% of the stations showed significant trends of increase in the wet season and 22.9% of significant decreasing trends in the dry season.
However, although there are studies in the literature on the subject, there is still not enough knowledge about streamflow average patterns, extremes, trends, their relationship with precipitation extremes, and with socioeconomic development in the PSRB. It is important to emphasize that changes in rainfall and streamflow patterns in the region can be responsible for social and economic consequences for the basin, which is responsible for approximately 11% of the national gross domestic product (GDP) [20]. Therefore, this study aims, through precipitation and streamflow data from the PSRB between 1939–2020, to identify (a) the spatial variability of average patterns and extreme thresholds, (b) trends from average values and extremes, and (c) their relationship with urban growth and socioeconomic development.

2. Materials and Methods
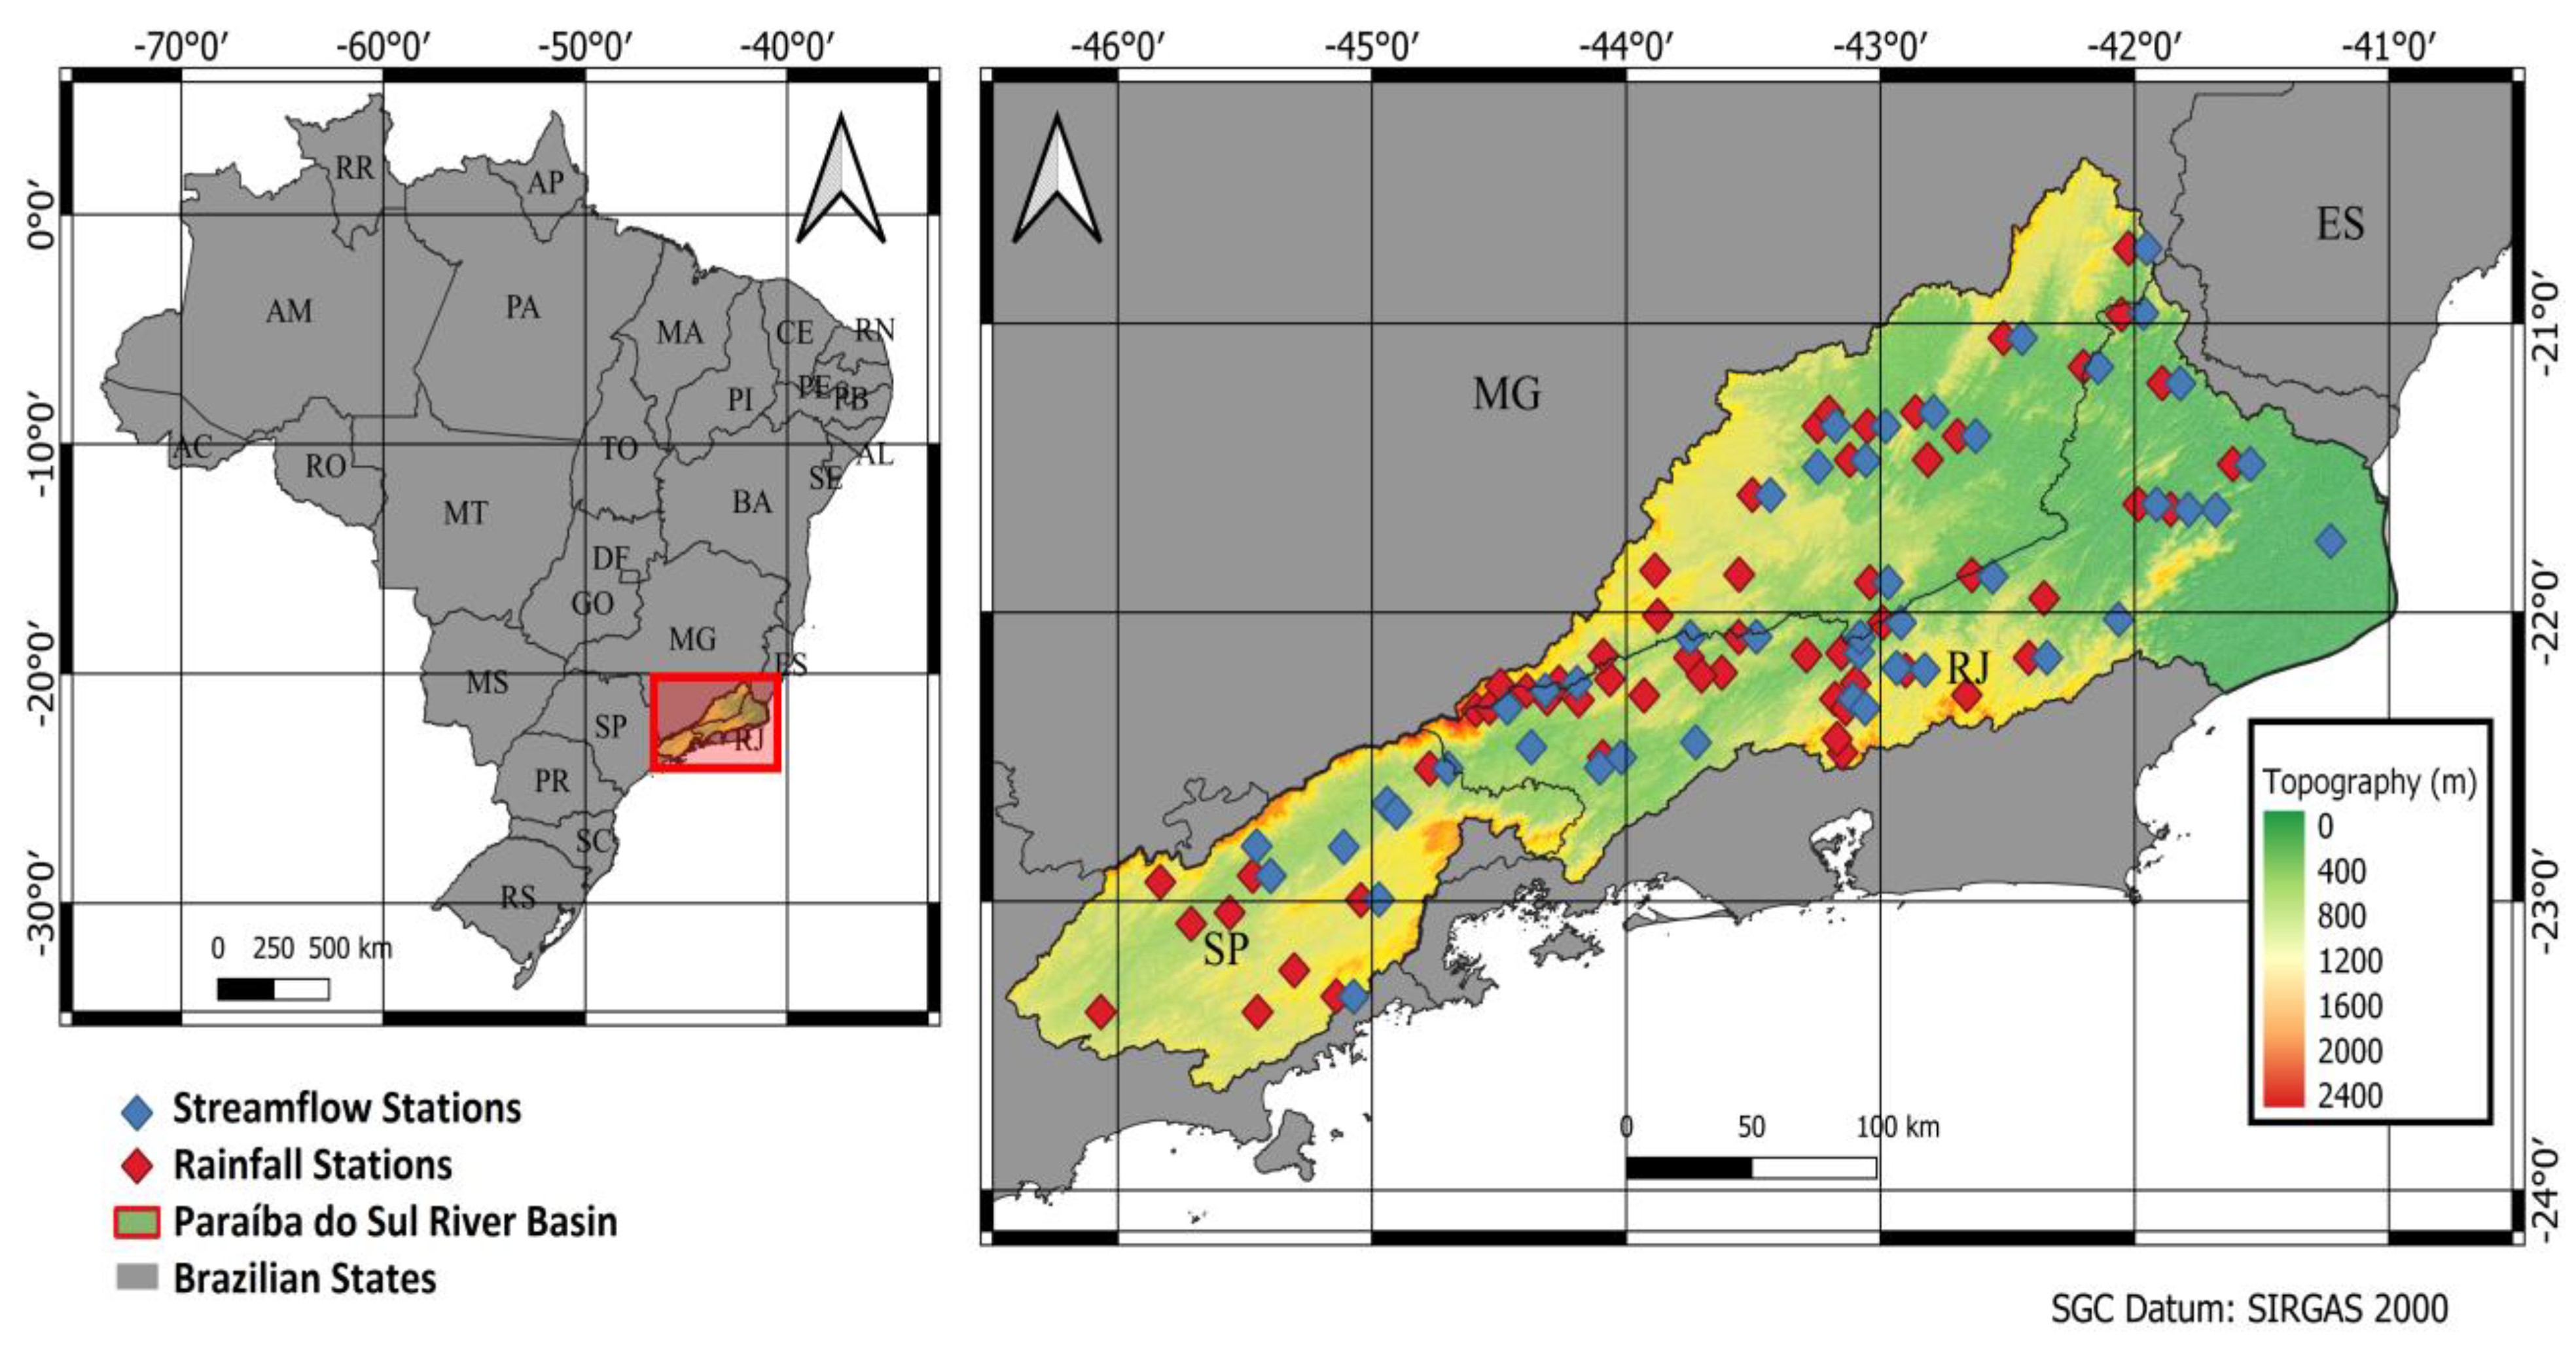
2.1. Study Area

The PSRB has an elongated shape, with a length about three times greater than its maximum width. Its main river is the Paraiba do Sul, which extends for 1130 km [11]. The PSRB covers approximately 55,500 km2 and includes a total of 184 municipalities, with 88 in Minas Gerais, 57 in Rio de Janeiro, and 39 in São Paulo [21,22]. It also contains approximately 120 hydroelectric plants in operation, with large, medium, and small generators [23]. The PSRB features important reservoirs, such as Paraibuna-Paraitinga, Santa Branca, Funil, Picada, Sobragi, Simplício, Ilha dos Pombos, Nova Maurício, and Barra do Braúna, mainly used for hydroelectric power generation and water-flow regulation throughout the basin. Additionally, the PSRB has significant water-transfer projects. One of them involves diverting approximately 120 m3/s of water from the Paraiba do Sul River to the Guandu River Basin, supplying water to over six million people and meeting industrial demands [21].
The PSRB is part of the hydrographic region known as the Southeast Atlantic, which is divided into eight water planning units [10]. The climate in the basin is predominantly hot and humid, influenced by altitude and marine winds [22]. The annual average temperature ranges between 18 °C and 24 °C [18]. The PSRB is located in the southeast region, characterized by rainy summers and dry winters, a typical pattern of the South American monsoon system (SAMS) [24,25]. During the wet season of the SAMS, the dynamic of the atmosphere indicates that the northeast trade winds are intense and transport moisture, especially through the low-level jets (LLJ), from the Tropical Atlantic Ocean to the Amazon basin and the subtropics [25,26]. Occasionally, this moisture arrives in the subtropics and helps develop a cloudiness band with a northwest/southeast orientation that extends from the south of the Amazon region to the central region of the South Atlantic [27], which defines the South Atlantic convergence zone (SACZ) [25,28]. According to [29] rainfall rates during the winter are lower due to the South American subtropical anticyclone (SASA) subsidence, which, at that time, reaches its westernmost position, extending to the southeastern region of Brazil. The most intense precipitation events during the winter can occur when frontal systems and subtropical and extratropical cyclones overlap with the SASA.
Regarding the physiography of the PSRB, the topography of the region is shown in Figure 1, where the Serra da Mantiqueira and Serra do Mar stand out. These regions have complex terrain, reaching more than 2000 m at the highest points, such as Pico da Mina (2798 m), Pico das Agulhas Negras (2791 m), and Pico dos Três Estados (2665 m) [18].

2.2. Source of Data

This study used historical daily rainfall data from 1939 to 2020, obtained from 58 rainfall stations, and daily streamflow data collected from 47 streamflow stations located within the Paraiba do Sul River Basin (PSRB) (as shown in Figure 1). These data were obtained from the National Water Resources Information System—SNIRH, available at http://www.snirh.gov.br/hidroweb/serieshistoricas. The dataset is classified based on the degree of consistency where level 1 consists of data preanalyzed for consistency (preferably used in the study) and level 2 consists of raw data (only used in this study when level 1 data were not available). More information about the rainfall and streamflow stations monitoring stations considered in this study are available in the Supplementary Materials.
The runoff rate is a direct indicator of the water-production level in the watershed. To calculate the runoff rates, the streamflow [l/s] is divided by the drainage area corresponding to that river-flow station [km2] and this calculation is used to standardize the discharge values of basins with different spatial scales.
Data from the Brazilian Institute of Geography and Statistics (Instituto Brasileiro de Geografia e Estatística, IBGE) demographic census from 1940 to 2010 was also used to track the growth of the urban population in the PSRB. The expansion of the urban area was analyzed using data from the MapBiomas Project—Collection 7.1 of the Annual Series of Land Use and Coverage Maps in Brazil. The data was obtained through the following link: http://mapbiomas.org.
To assess the water demand, data on the consumptive use of water in Brazil available at https://metadados.snirh.gov.br/ were used. This data captures the amount of water that is removed and consumed, without returning directly to the water body. The consumption by sectors evaluated included human supply (urban and rural), animal supply, the transformation industry, mining, thermoelectricity, irrigated agriculture, and liquid evaporation from reservoirs. Data from 1931 to 2021 (diagnosis) and projections up to 2040 (prognosis) were used.

2.3. Methodology

The spatial and temporal variability of precipitation and runoff rates recorded throughout the PSRB was evaluated based on calculations of (a) average patterns, (b) thresholds for extreme events, and (c) trends using the MK. Monthly and annual accumulated precipitation values were obtained for each site and then averaged over all rainfall stations to represent the entire basin. The average monthly values of the basin were used to define the rainy and dry seasons in the PSRB.
The technique of quantile analysis [30] was used to define rainfall and runoff rates’ thresholds for extremes during the rainy and dry seasons. Percentiles 95 and 99 (p95 and p99) were used as thresholds, following [31]. To compute percentiles, only days with precipitation (above 1 mm) were considered. This technique has been previously used by studies such as [32] for precipitation data and [33,34] for streamflow extremes. The number of days per year with records above those thresholds in each site was also calculated for the rainy and dry seasons.
Spatial fields of the annual total and extreme precipitation were constructed using the inverse distance weighting (IDW) interpolation method [35]. For the annual average patterns and extreme threshold values of runoff, the technique of proportional punctual symbols [36] was used, which allows for viewing the average annual runoff recorded in the area of drainage of each subbasin.
To verify trends and their statistical significance, the MK [37,38] was used on precipitation and runoff rates data. The MK is a nonparametric test recommended by the World Meteorological Organization (WMO) to estimate trends of climatological data. The MK was applied to identify trends in (a) monthly values of precipitation and runoff rates and (b) the number of days per year above the thresholds established for extreme precipitation and runoff rates at each site for the rainy and dry seasons.
To analyze the influence of the urban areas on the average patterns and trends observed through the runoff-rates data, the urban development was defined and calculated as the percentage of urban areas by the total area of PSRB over time, using the MapBiomas Dataset. The water-demand data was also used to analyze the development of the PSRB throughout the decades and its perspectives into the future.

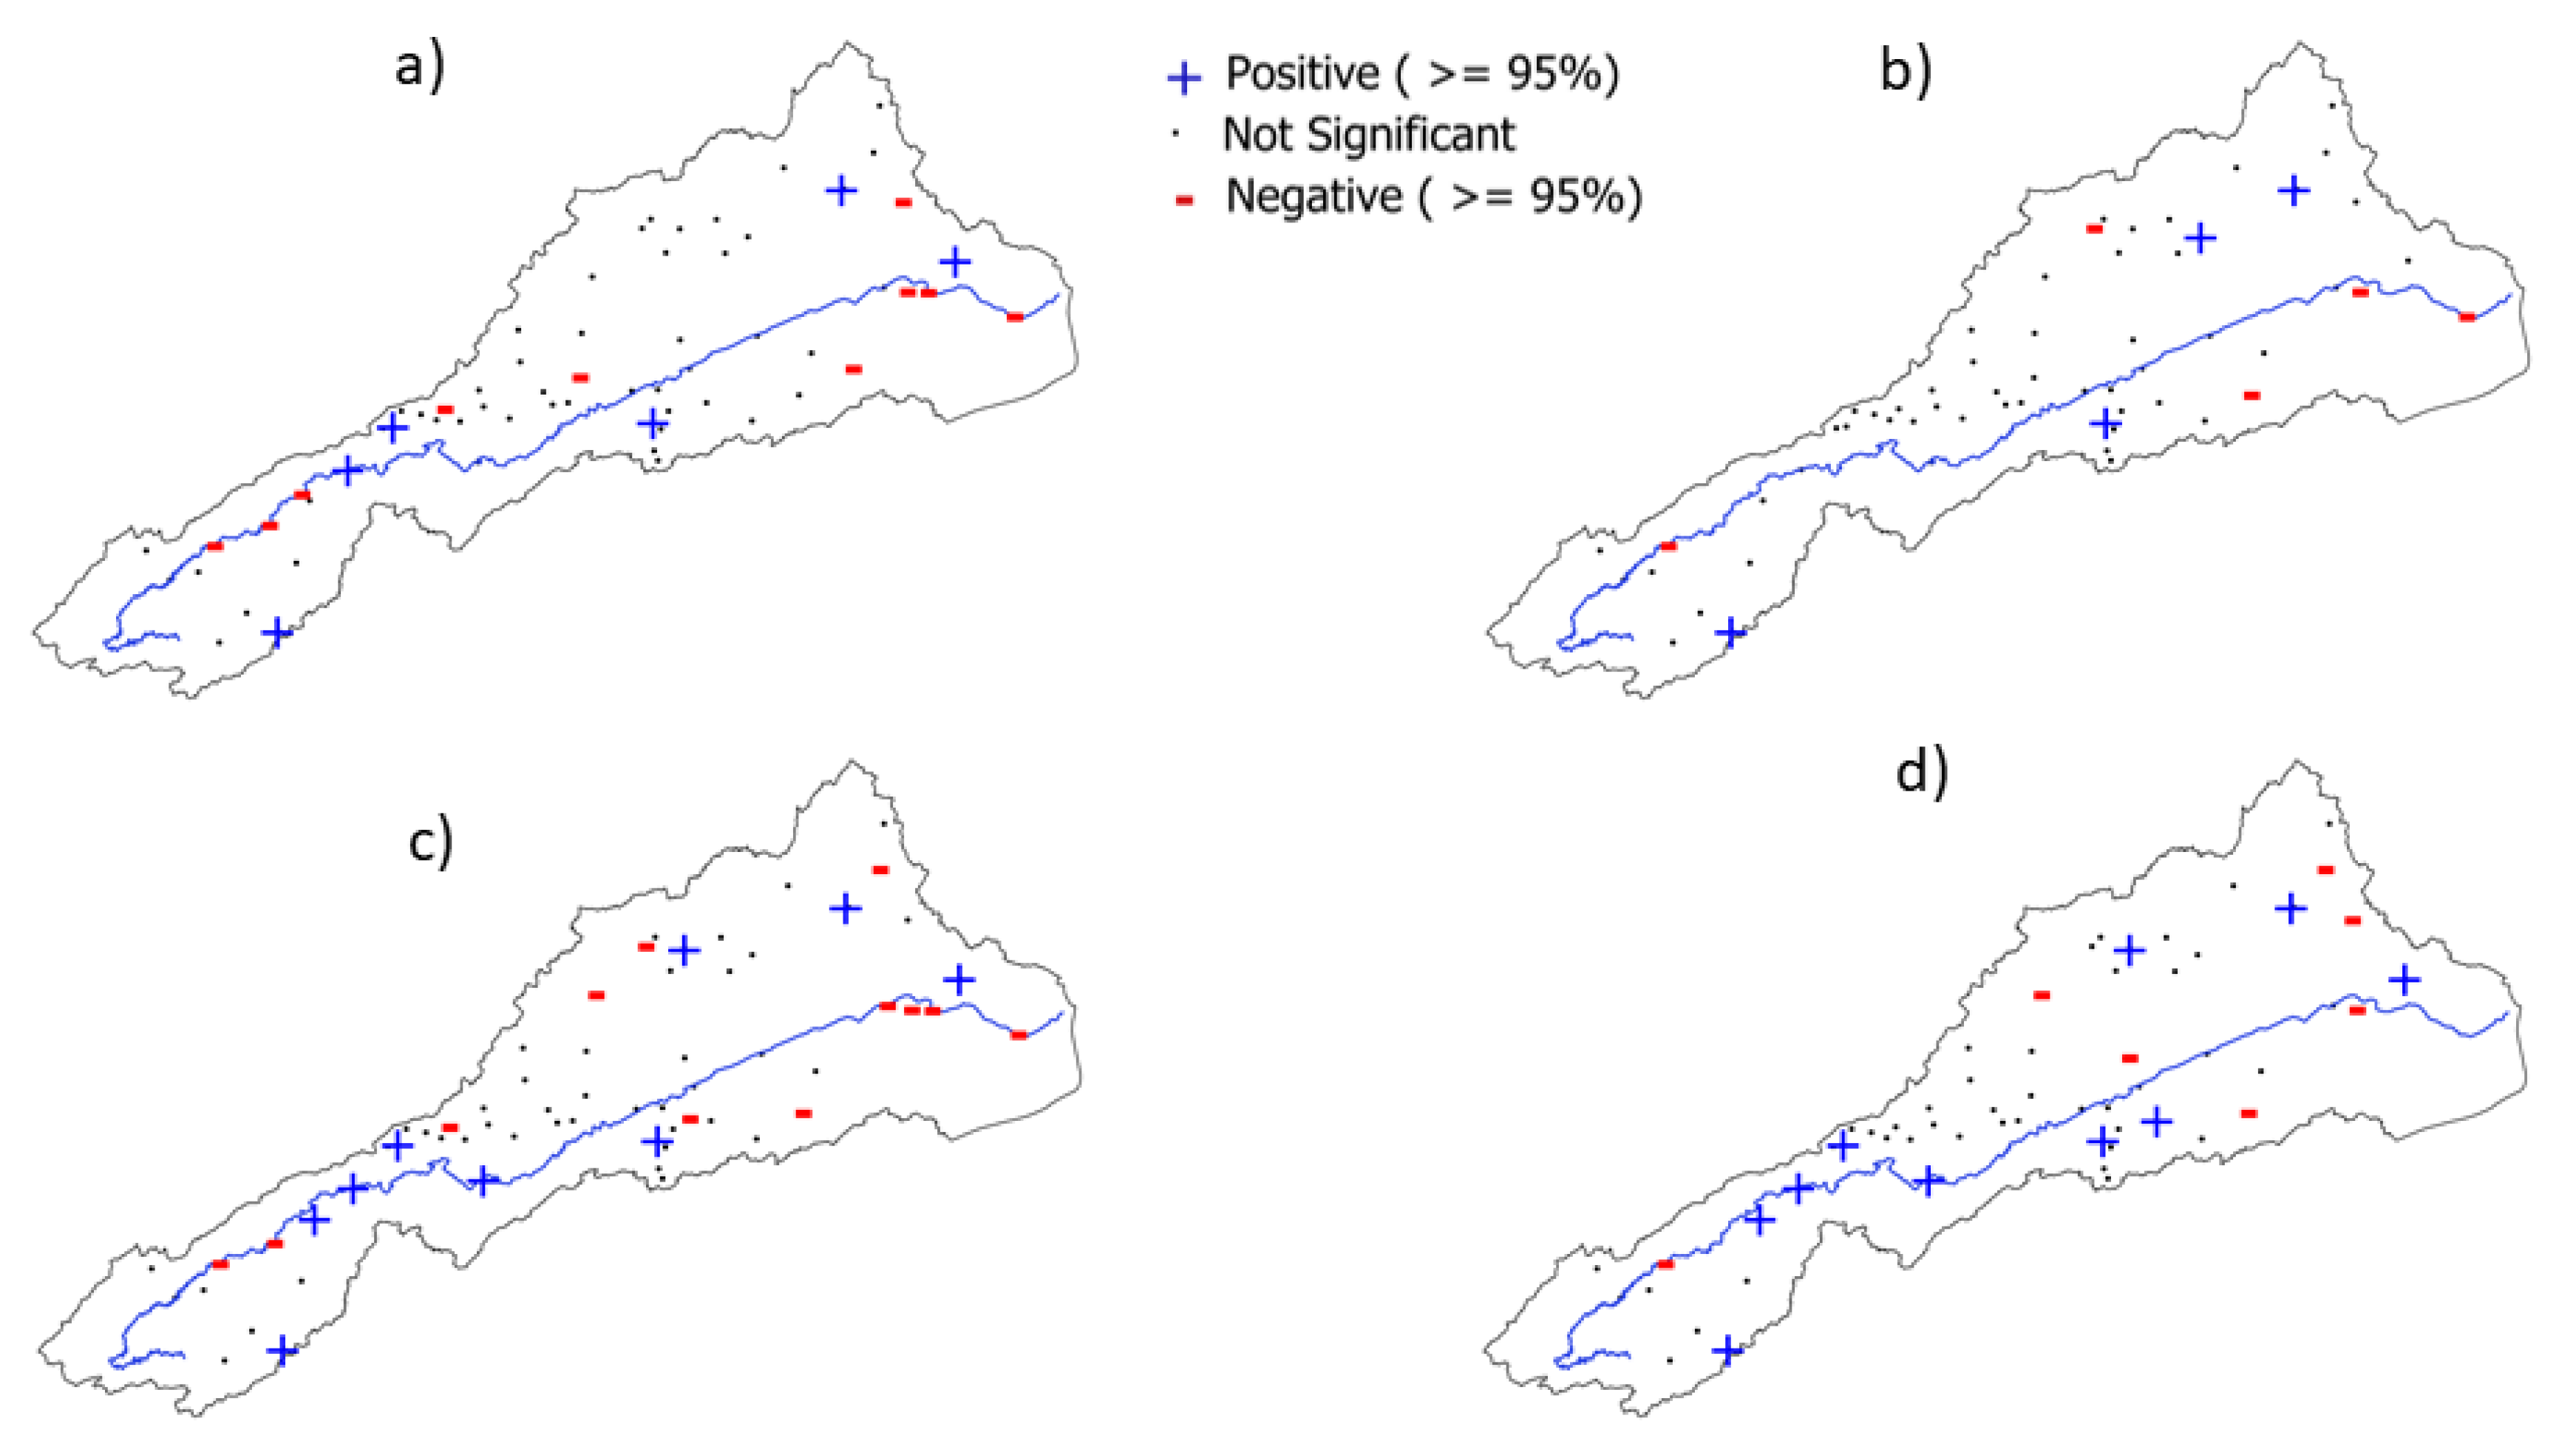
3. Results and Discussion

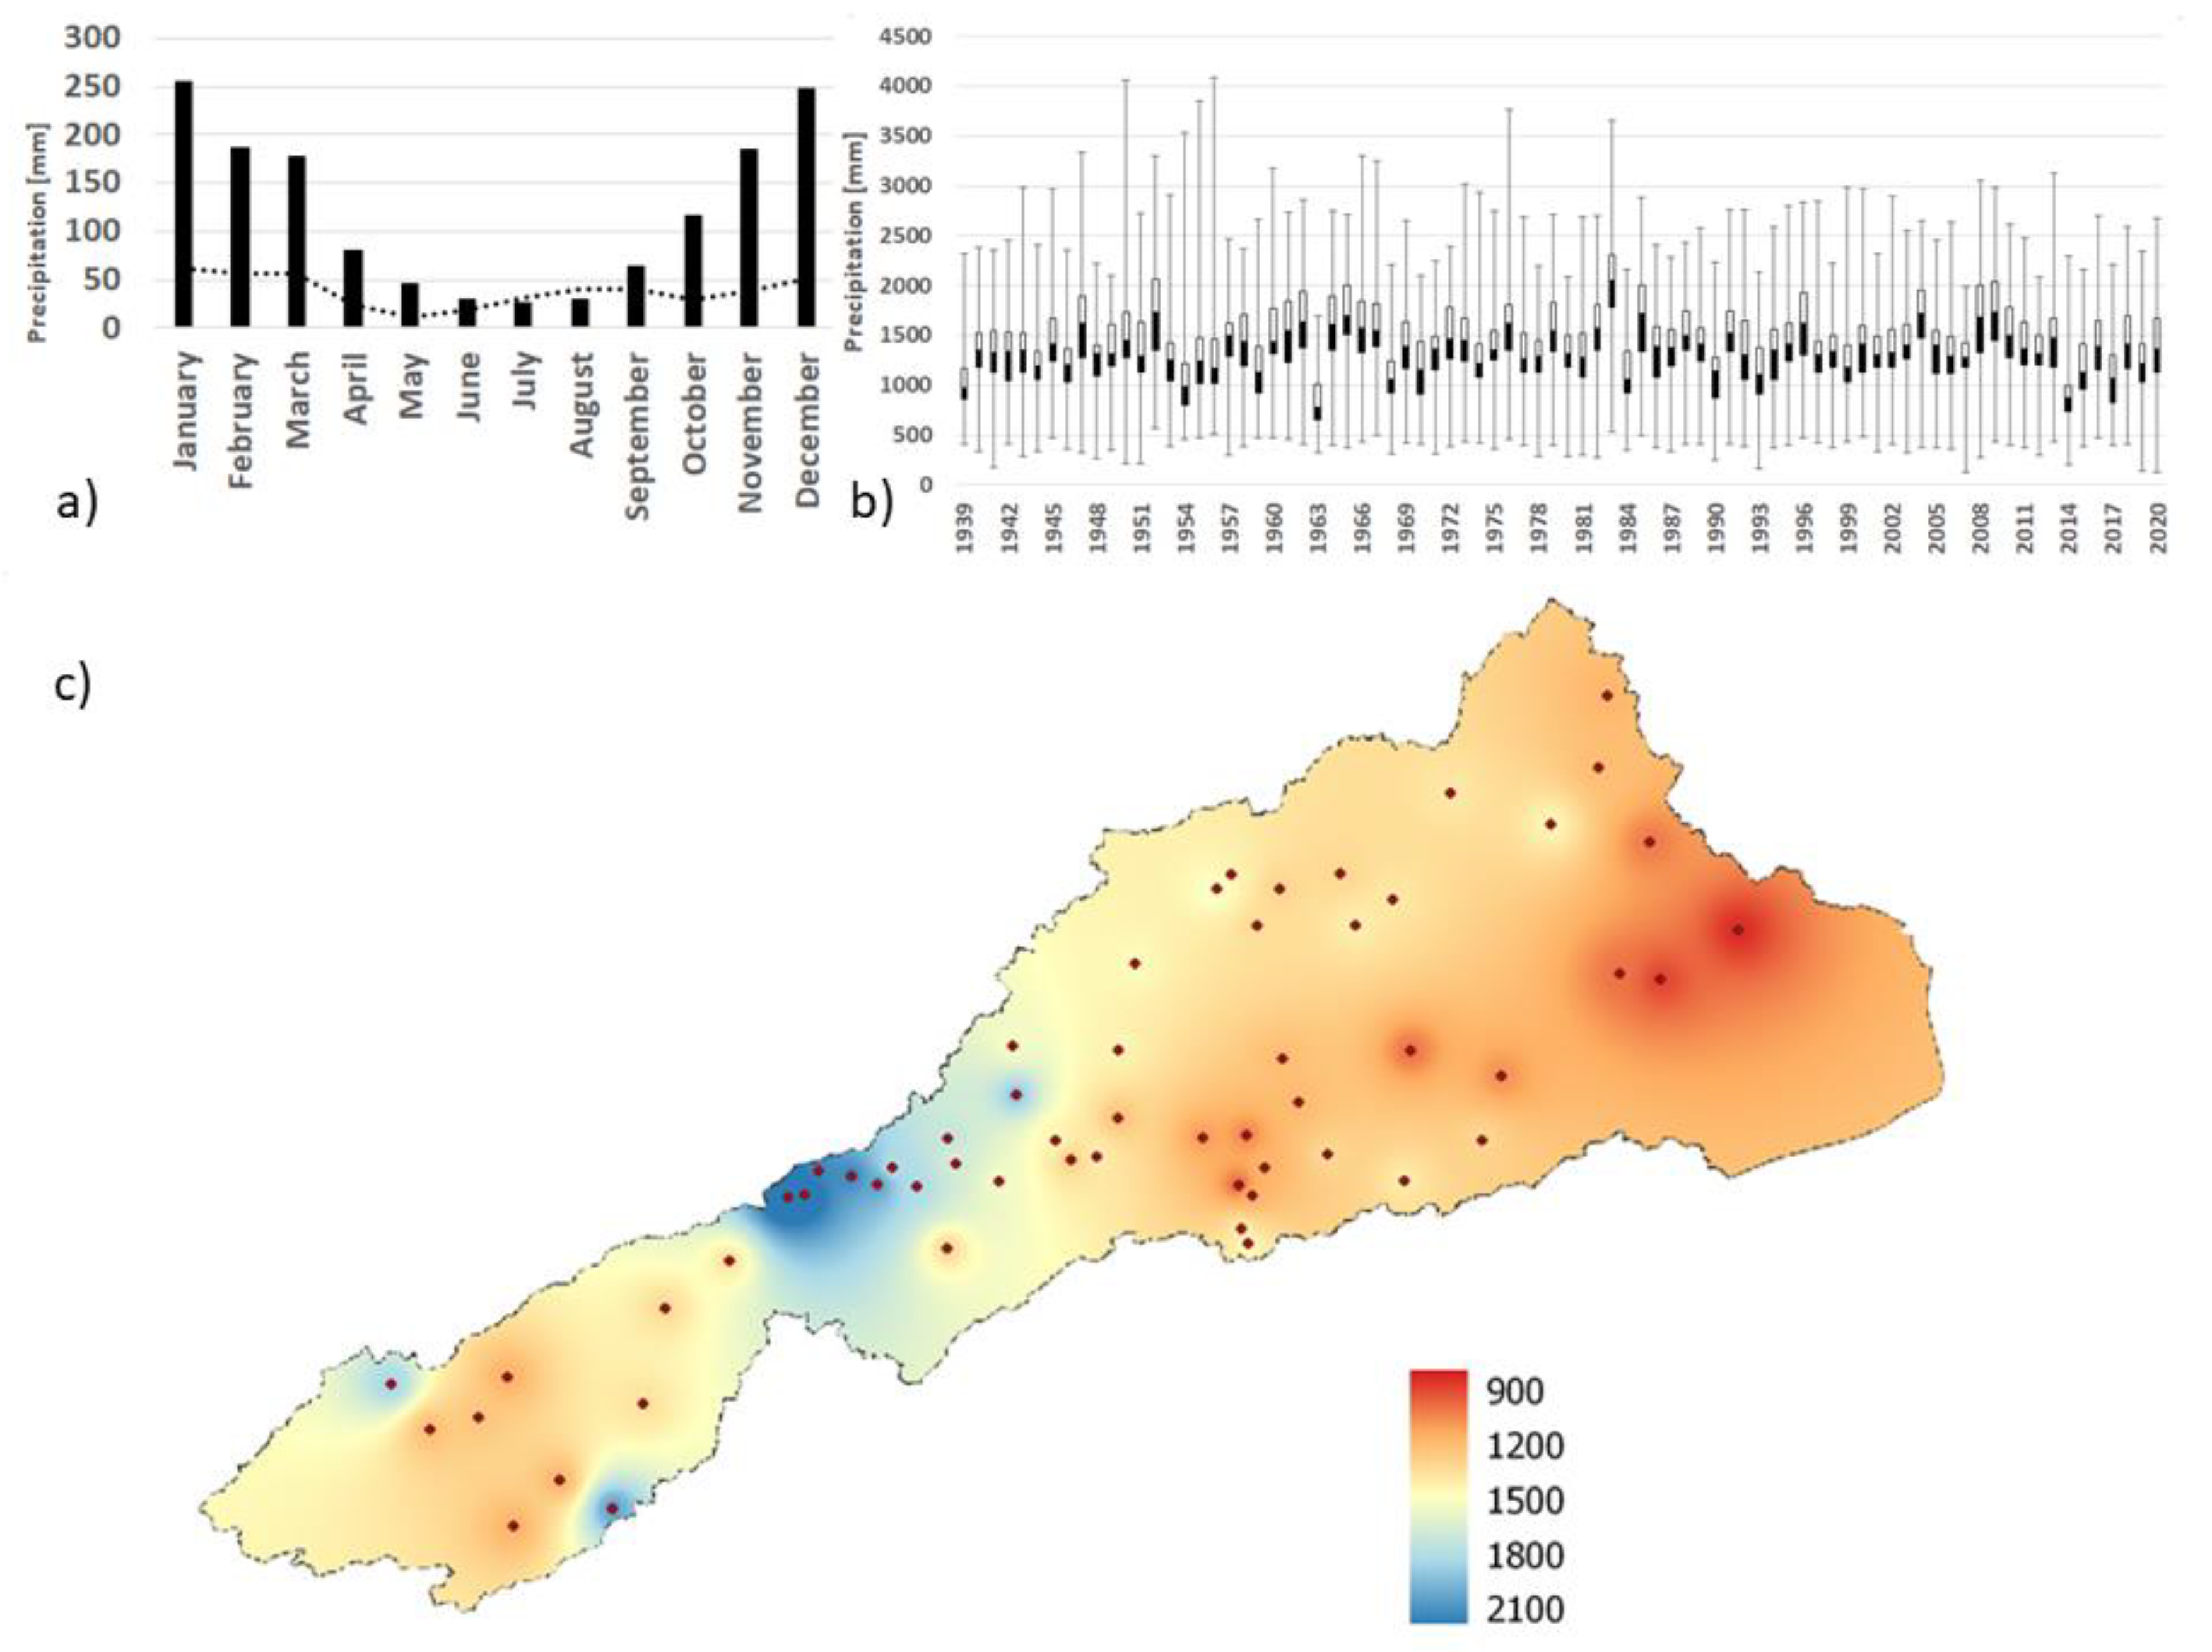
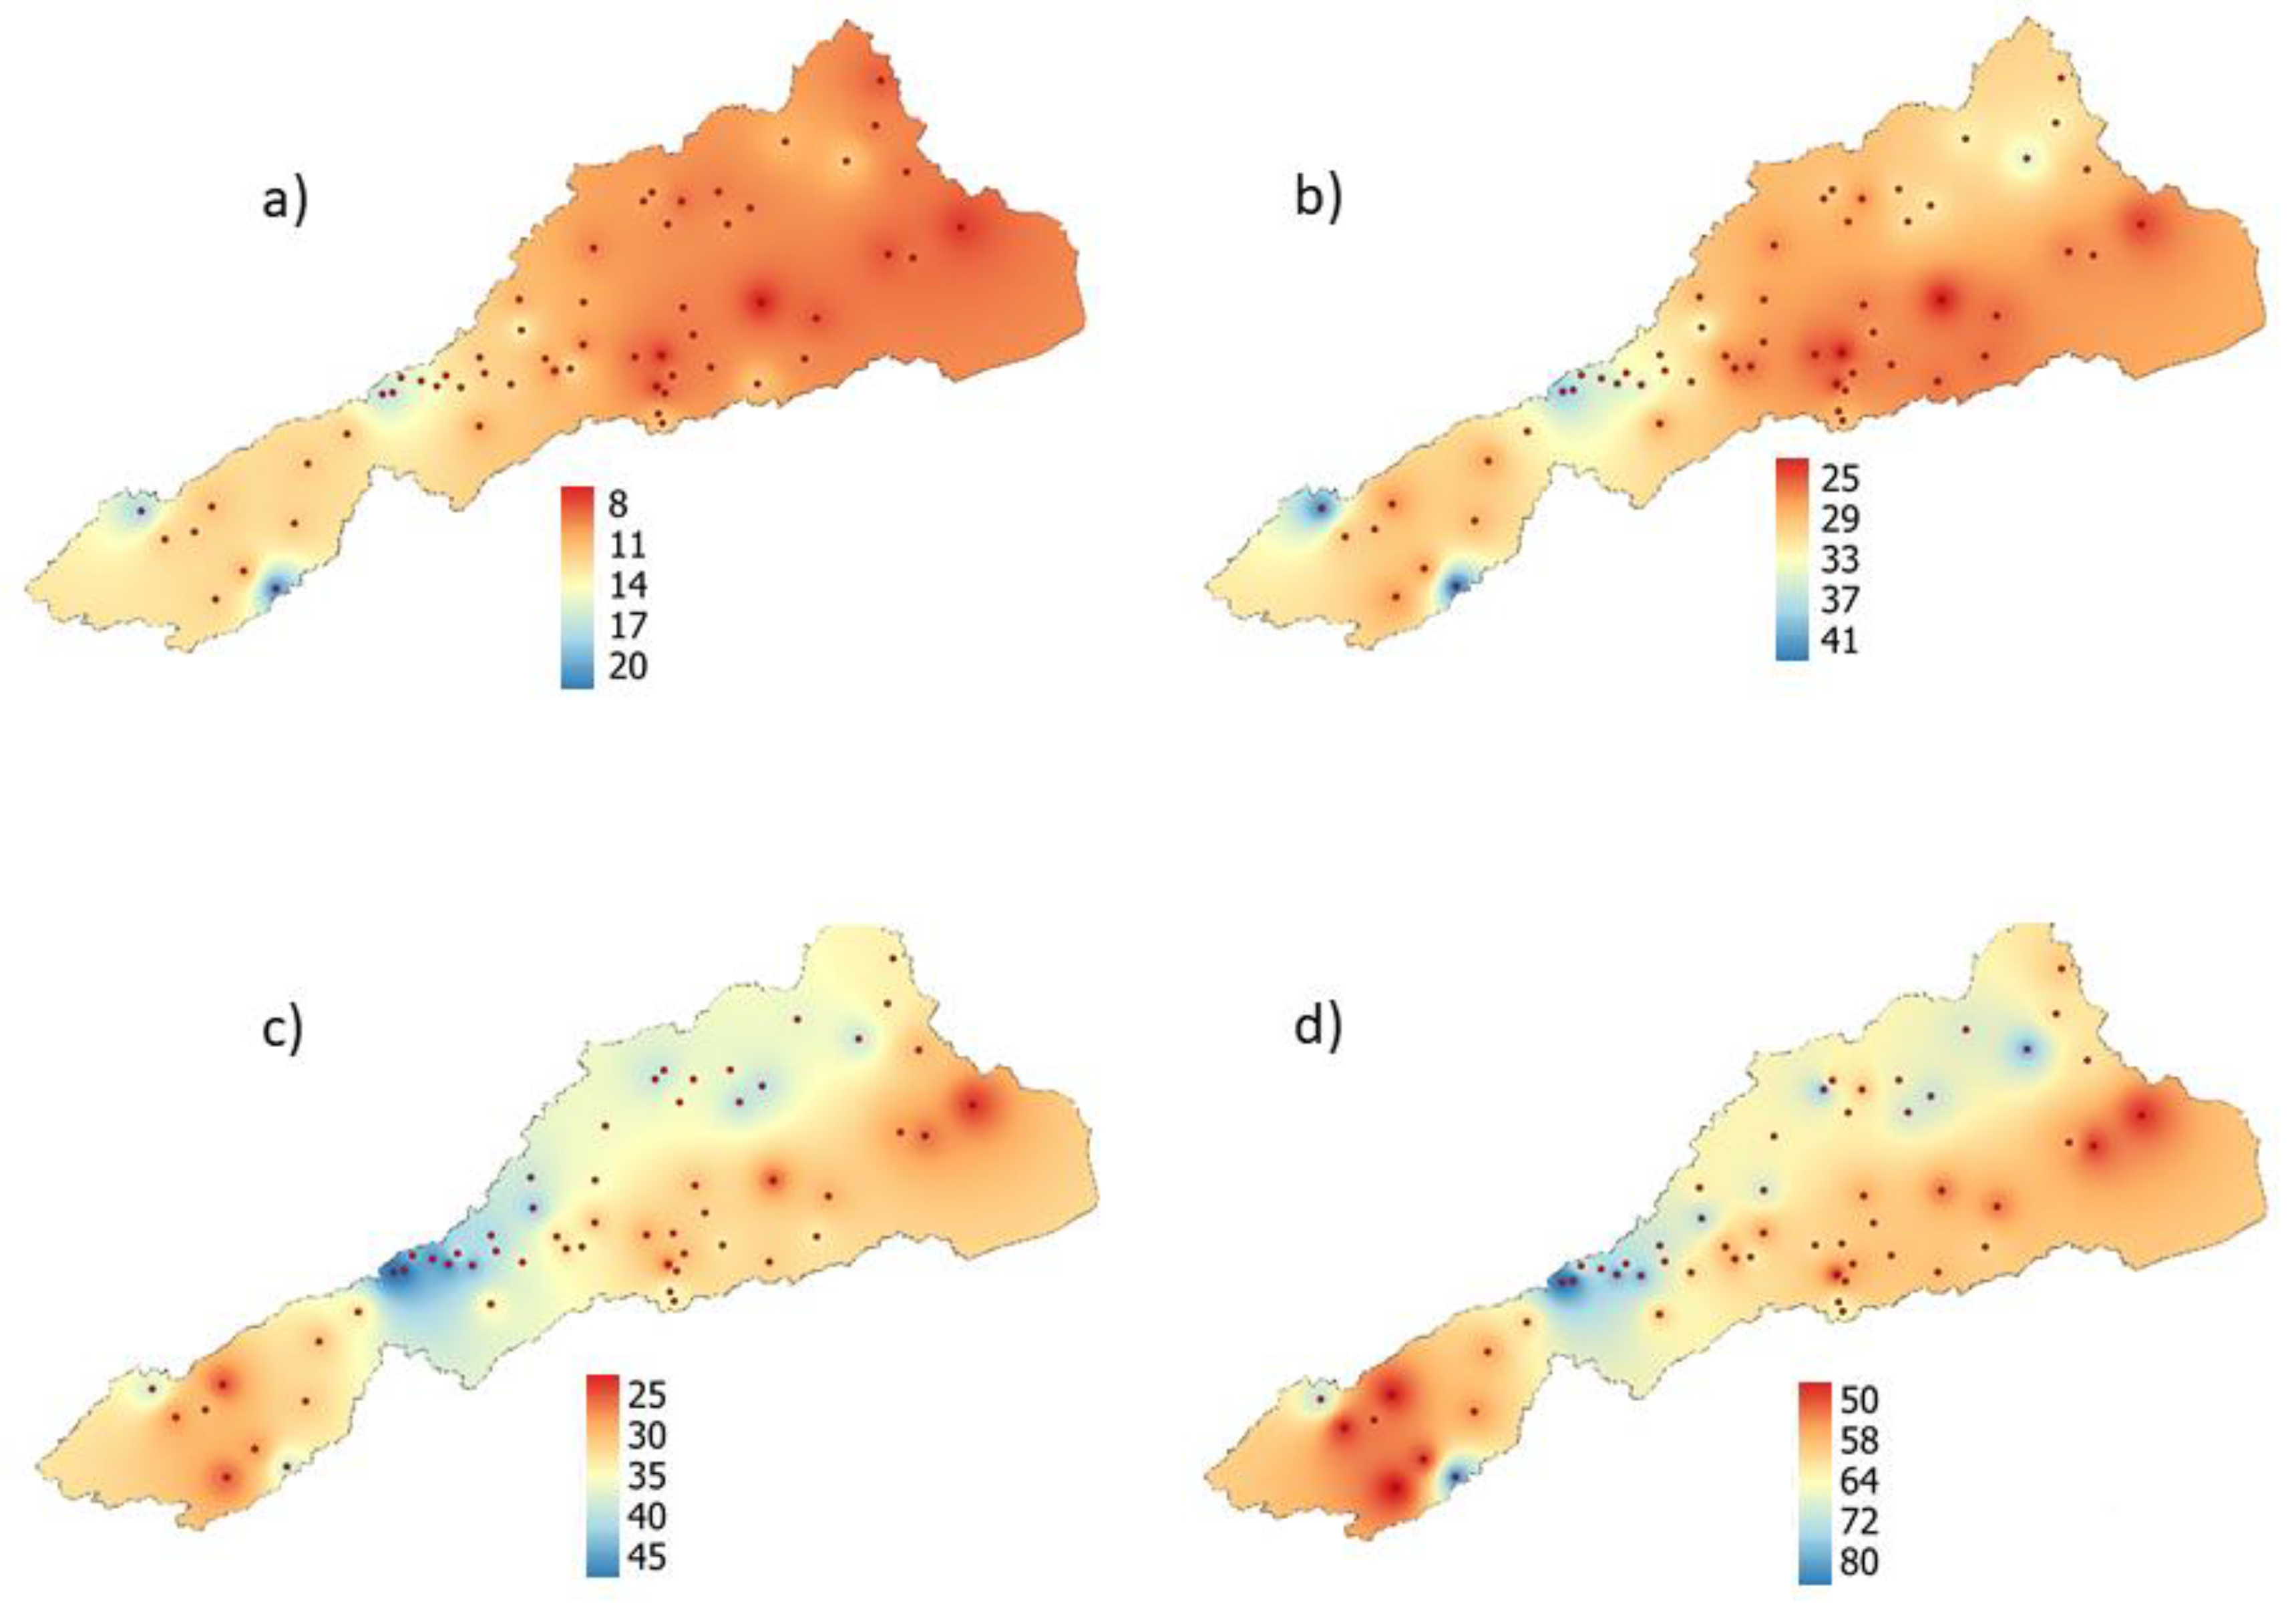
3.1. Precipitation Data Analysis

Figure 2 shows the annual and monthly precipitation patterns, as well as the spatial distribution of precipitation in the PSRB between 1939 and 2020. The average and standard deviation of the monthly accumulated precipitation values (Figure 2a) shows the influence of the South American monsoon regime, with rainy summers and dry winters. This corroborates several studies, such as [29,39,40,41]. Based on the results, the dry season was defined by months in which the average accumulated precipitation was below 150 mm (April–October) and the wet season by those with values above 150 mm (November–March). During the austral winter, for instance, in JJA, precipitation rates in the PSRB were below 50 mm, while in the austral summer, in DJF, values above 200 mm were identified. These results follow those found by [42], who revealed the monsoon regime in South America with a well-defined annual precipitation cycle where some regions in Central and Eastern Brazil, and the Andes Mountains receive 50% of the total annual precipitation during the austral summer and less than 5% of its total annual precipitation during the austral winter.
The box plot shows the annual accumulated precipitation values in the PSRB from 1939 to 2020 in Figure 2b. Years with lower accumulated precipitation rates, such as 1963 and 2014, had values below 1000 mm/year. Both years were also highlighted by [43,44] as extremely dry years for the southeastern region of Brazil. In 2014, Ref. [45] found that one of the factors that contributed to the significant deficit of precipitation during the 2013/2014 summer was the early end of the wet season and [12] point out that the 2013/2014 and 2014/2015 summers in Southeastern Brazil showed significant precipitation deficits, leading to reduced flows and drought conditions, impacting water availability for users of different economic and societal sectors. On the other hand, the biennium 1982/1983 stands out for significantly above-average accumulated precipitation and is reported in the literature for intense precipitation anomalies over parts of South America, particularly in the Southern and Southeastern regions of Brazil, associated with the El Niño of 82/83 [46].
The spatial distribution of the average annual precipitation rates in the PSRB (Figure 2c) indicates that the highest values (higher than 2100 mm/year) are recorded on the border between the states of São Paulo, Rio de Janeiro, and Minas Gerais. The highest average annual values of accumulated precipitation were recorded in mountainous regions, such as Fazenda Agulhas Negras with 2385 mm (1242 m) and Visconde de Mauá with 2234 mm (1030 m), both in the Serra da Mantiqueira, a mountainous region. These results agree with those presented by [47] who associated higher precipitation values with sites located at altitudes higher than 2000 m. However, the region of the Baixo Paraíba do Sul, located in the north and northwest of Rio de Janeiro, and characterized as a depression region, registers annual precipitation values below 1000 mm/year (Figure 1). The difference in annual accumulated values of precipitation can be associated on a broader scale by the valley–mountain circulation, where precipitation occurs due to orographic forcing and presents an intense gradient towards regions with higher altitudes. The spatial precipitation patterns are in line with the results of [19,47], through different datasets.
Figure 3 displays the spatial distribution of p95 and p99 thresholds for extreme and very extreme rainfall events during the dry and wet seasons. Based on the analysis of the annual precipitation totals, the highest threshold values are concentrated in regions with higher altitudes, including Serra da Mantiqueira. In some locations, the threshold for extreme events recorded during the wet season is more than twice the threshold for the dry season, which is a typical characteristic of the South American monsoon precipitation regime. The p95 threshold in the PSRB ranges from 8 to 20 mm per day during the dry season and from 25 to 45 mm per day during the wet season. The values for very extreme events verified through the p99 thresholds follow the same spatial distribution. During the dry season, it varies from 25 to 41 mm per day, while in the wet season, it ranges from 50 to 80 mm per day, with values above 80 mm/day concentrated in the Serra da Mantiqueira region. Throughout the SEB, where the PSRB is located, a significant variability regarding extreme thresholds can be seen in other studies such as [12,32,48].
Sites with a significant (positive or negative) MK trend calculated through the accumulated monthly rainfall rates for the dry and wet seasons are shown in Figure 4. Out of the 58 rainfall stations, only 9 stations exhibited a significant trend during the dry season (Figure 4a). Among these, eight sites indicated an increase in precipitation rates, with three of them located in the highest altitude region of the state of Rio de Janeiro. The remaining stations were spread across the basin in the states of Minas Gerais and São Paulo, near the upper limit of the basin. Only one rainfall station exhibited a negative trend, while most of the stations did not exhibit any trends. During the wet season (Figure 4b), 14 stations revealed significant trends: eight negatives and six positives. No clear trend, particularly during the wet season, was found. This was also confirmed by other studies that analyze rainfall trends in the PSRB such as [19], which used data from 92 rainfall stations covering the period from 1970 to 2018, and [2], which used data from 86 rainfall stations spanning from 1988 to 2018. However, we can highlight the positive trends in monthly precipitation rates in the mountainous region of Rio de Janeiro during the dry and wet seasons, particularly in the Serra dos Órgãos region, close to the municipalities of Três Rios, Teresópolis, and Petropólis. That region recorded 119 natural disasters in the period between 2001 and 2016, caused by heavy rainfall events with records over 100 mm/day [49]. The complex terrain and land use of the area, especially the high occupation in hillsides, potentiate the risks of economic damage and loss of life associated with heavy rainfall rates. For instance, on 15 February 2022, an accumulation of 210 mm of rain in 3 h led to landslides and flash floods which caused 233 deaths and made 800 people homeless in Petropolis [50]. Hence, positive precipitation trends can indicate higher risks for this region.
Figure 5 shows the MK trends associated with the number of days per year above the p95 and p99 thresholds for the dry and wet seasons (as shown in Figure 3). In all the analyses, most sites do not present a significant trend. However, notably, there were more trends for very intense extremes (p99) than for intense extremes (p95). During the dry season, the p95 threshold shows only four stations with a significant trend: two with an increase and two with a decrease. For the wet season, locations with a positive trend of extreme events above the p95 threshold were mainly concentrated in two regions: the extreme north of the basin, in the state of Minas Gerais, and the central part of the basin which includes the municipalities of Juiz de Fora, in Minas Gerais, and Petropolis, in Rio de Janeiro. Five stations with negative trends did not show a clear proximity pattern. In contrast, the p99 threshold, which evaluates the occurrence of very extreme precipitation events, showed 11 locations with a significant trend during the dry season, with the majority of events exhibiting increasing trends and being located in the central part of the PSRB. This suggests that the number of intense rainfall events in this region is becoming more frequent. Similarly, in the wet season, rainfall stations with a positive trend of extreme events above p99 were also found. The most northeastern region of the basin, in the state of Minas Gerais, stood out with the highest concentration of stations exhibiting a positive trend of very intense events above 64 mm/day. Negative trends, on the other hand, were concentrated in the south of the basin, specifically in the state of São Paulo. Ref. [2] indicate an increase of 10% in the probability of extreme events occurring throughout the basin while [18] showed a greater spatial variability when analyzing the extreme precipitation in the area.

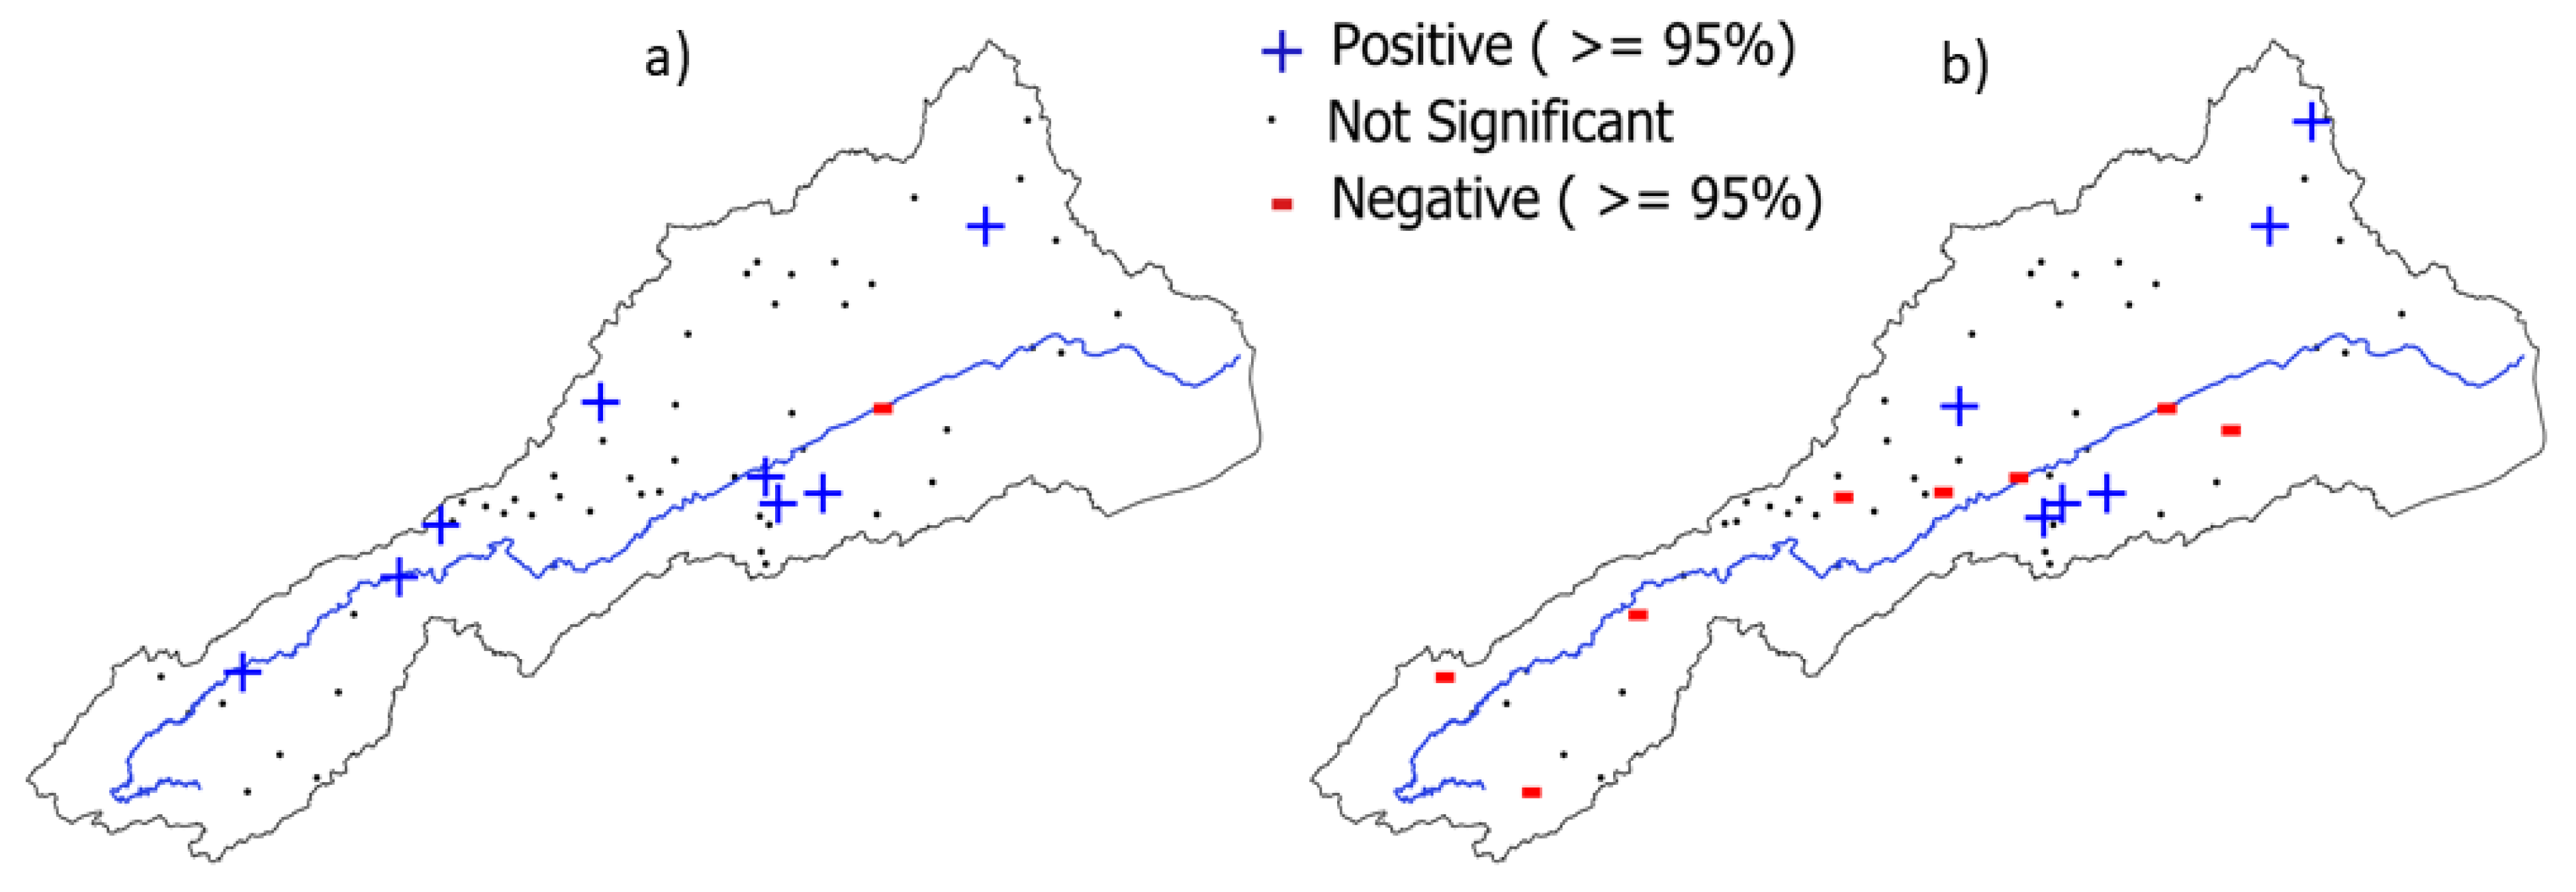
3.2. Runoff Rates Analysis

In Figure 6, the distribution of the annual average of runoff rates, a hydrological variable related to the streamflow and the area of the hydrographic basin, is presented. Across most of the basin, including the Paraiba do Sul River’s main river, the runoff rates vary between 12 and 19 [l/s/km2]. In the central portion of the basin, two clusters have slightly higher runoff rates, above 19.7 [l/s/km2], one in the state of Minas Gerais and the other in the state of Rio de Janeiro. The region of the basin with the highest values is concentrated in sites at higher altitudes, which also registered the highest accumulated precipitation rates, in the Serra da Mantiqueira, where three streamflow stations showed an annual average greater than 42 [l/s/km2].
The values of extreme events for the average runoff, assuming p95 and p99 thresholds for the dry and wet seasons, are calculated and shown in Figure 7. During the dry season, for most streamflow stations, the p95 values do not exceed 21 [l/s/km2]. However, in sites with a higher annual average, the extreme value can reach 42 [l/s/km2], especially at higher altitudes where the highest annual precipitation is registered. For the wet season, the extreme values are higher, revealing significant seasonal variability. The minimum threshold p95 for the wet season is above 35 [l/s/km2] and, at higher altitudes close to the Mantiqueira Mountains, it can be above 144 [l/s/km2]. The p99 threshold presents extreme values over 230 [l/s/km2] but, in most sites of the PSRB, p99 extremes are above 115 [l/s/km2].
In contrast to the precipitation trends, the MK trend analysis applied to the monthly runoff rates (Figure 8) reveals that many sites have a significant trend (almost 50%), mostly negative, during the dry and wet seasons. Most sites with negative trends are located along the Paraiba do Sul River, where large urban areas with high populations and economic activities that consume water, such as industries and agriculture, are situated. This finding is consistent with the study by [18], who suggested that the low levels of the Paraiba do Sul streamflow could be due to greater water demand and not a clear sign of climate change since the precipitation trends do not show similar results. Ref. [51] also concluded that the hydrological behavior of most of the PSRB presented a decrease in water availability between land use scenarios from 1986 to 2015. Section 3.3 of this paper will further examine the influence of the urbanization process and consequent higher water demand on the negative trends observed. One of the hypotheses that we also consider was the influence of the reservoirs and the transposition of water to the Guandu system on some of the negative trends identified. Streamflow sites close to the Funil Reservoir, one downstream and two upstream, showed negative trends during the wet season, but only one upstream, during the dry season. The site closest to where the transposition to the Guandu system takes place only showed negative trends during the dry season. Although some of those stations presented negative trends, it is still not possible to infer the direct influence of the reservoir and the transposition of the water since there are other sites along that area without any significant trends and also because most of the data is from after the construction of those systems. Regarding the river-flow stations with a positive runoff trend, only two records were observed during the wet season, and in the dry season, some sites were concentrated, particularly in the north of Rio de Janeiro State.
Figure 9 displays trends in extreme runoff rates (as shown in Figure 7) for the PSRB. The trends are analyzed separately for the dry and wet seasons. Results show that the number of locations with significant trends is lower during the dry season compared to the wet season. This could be attributed to the climate patterns of the region, where convective systems associated with heavy rainfall events are more frequent during the wet season. During the wet season, a significant number of locations in the central part of the PSRB showed a positive trend for extreme specific flow events. This mountainous region includes the cities of Petropolis and Teresopolis and is known for several episodes of floods and landslides [49,52]. Therefore, it is important to investigate whether flood and landslide events are related to the extreme runoff-rate events or other factors, such as soil characteristics and/or land-use changes. Land use changes, such as deforestation and urbanization, can significantly affect the hydrological cycle and increase the likelihood of flood and landslide events. These changes can lead to the reduction of infiltration capacity, an increase in surface runoff, and the modification of river channels and floodplains, all of which can contribute to the occurrence of extreme events [53]. Understanding the drivers of extreme runoff-rate events and their relationship with floods and landslides is crucial for the development of effective strategies and policies to mitigate the impacts of these events on society and the environment. This requires interdisciplinary research efforts that bring together expertise from hydrology, climatology, ecology, and social sciences to provide a comprehensive understanding of the complex interactions between the natural and human systems in the PSRB.

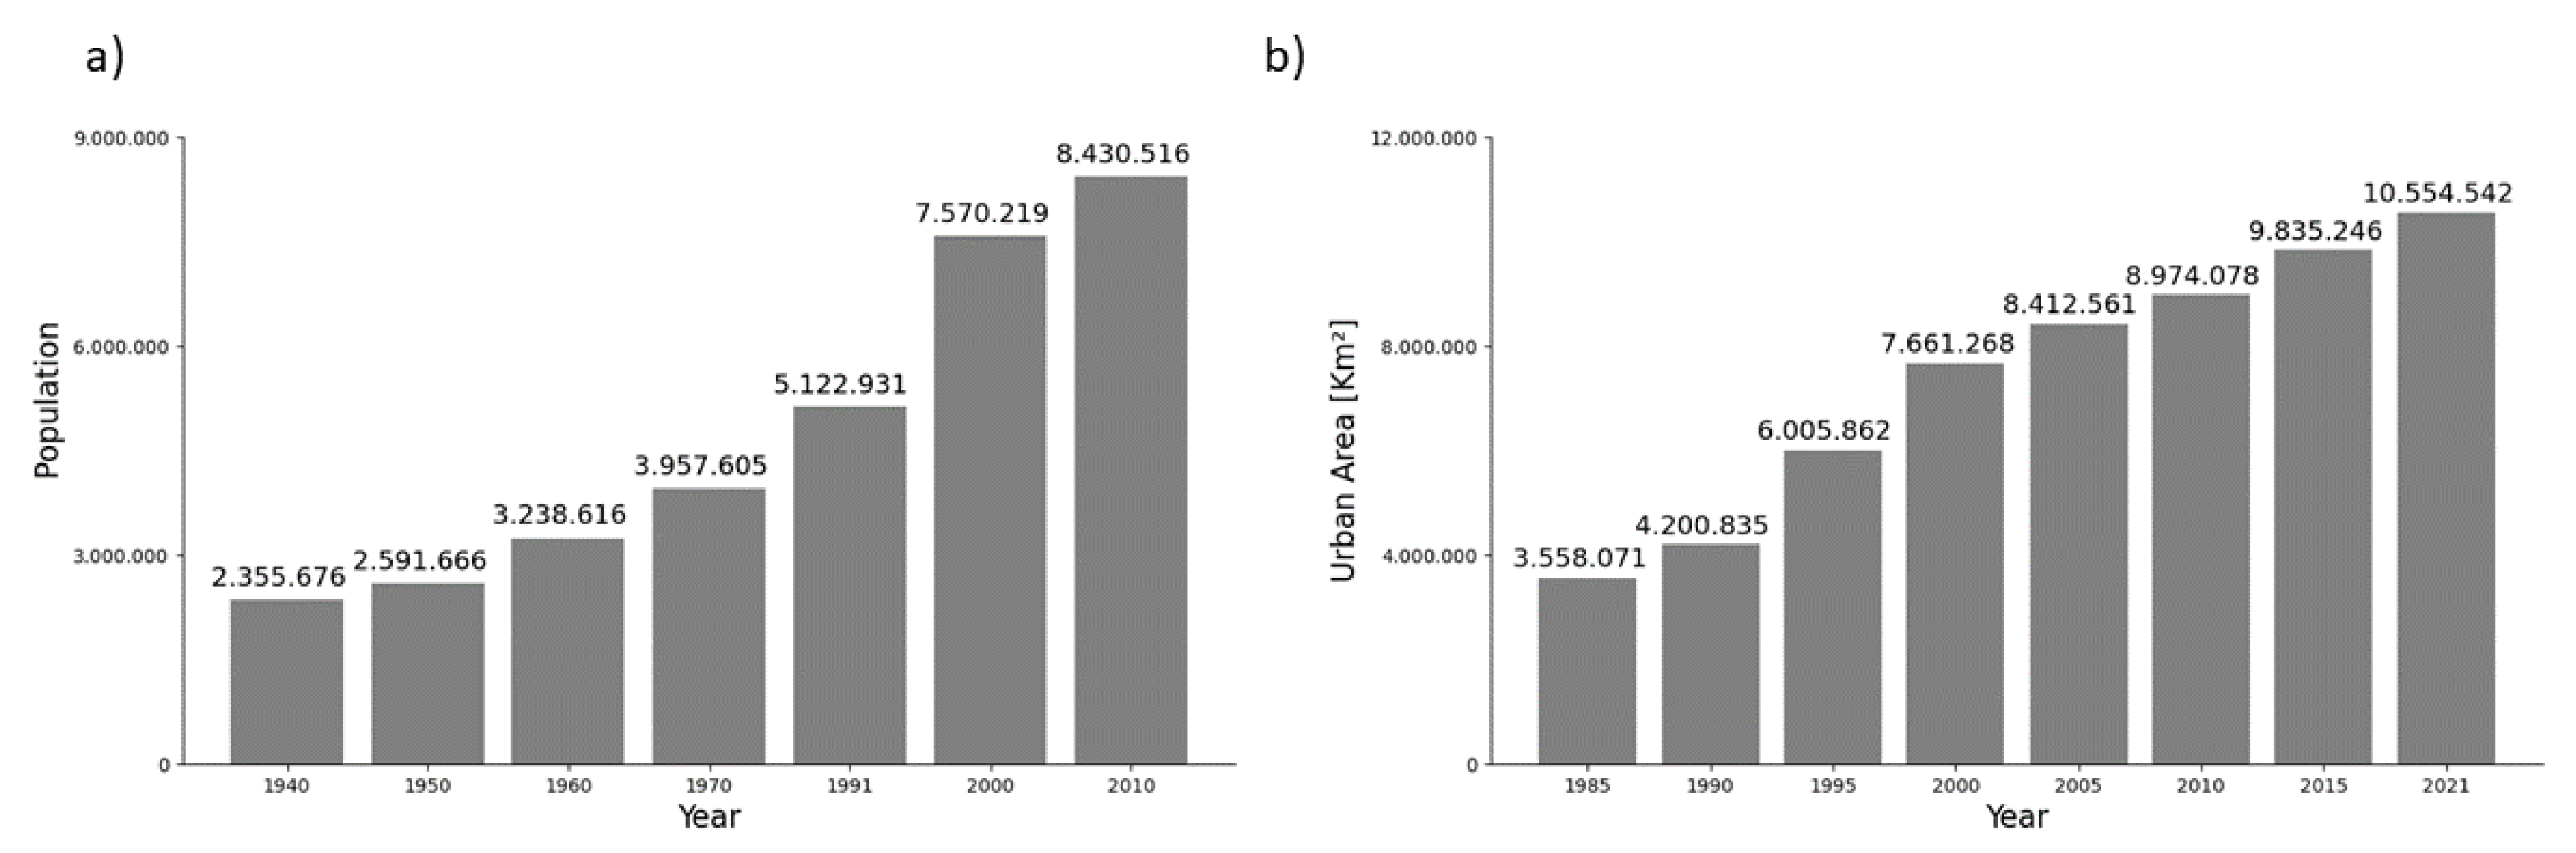
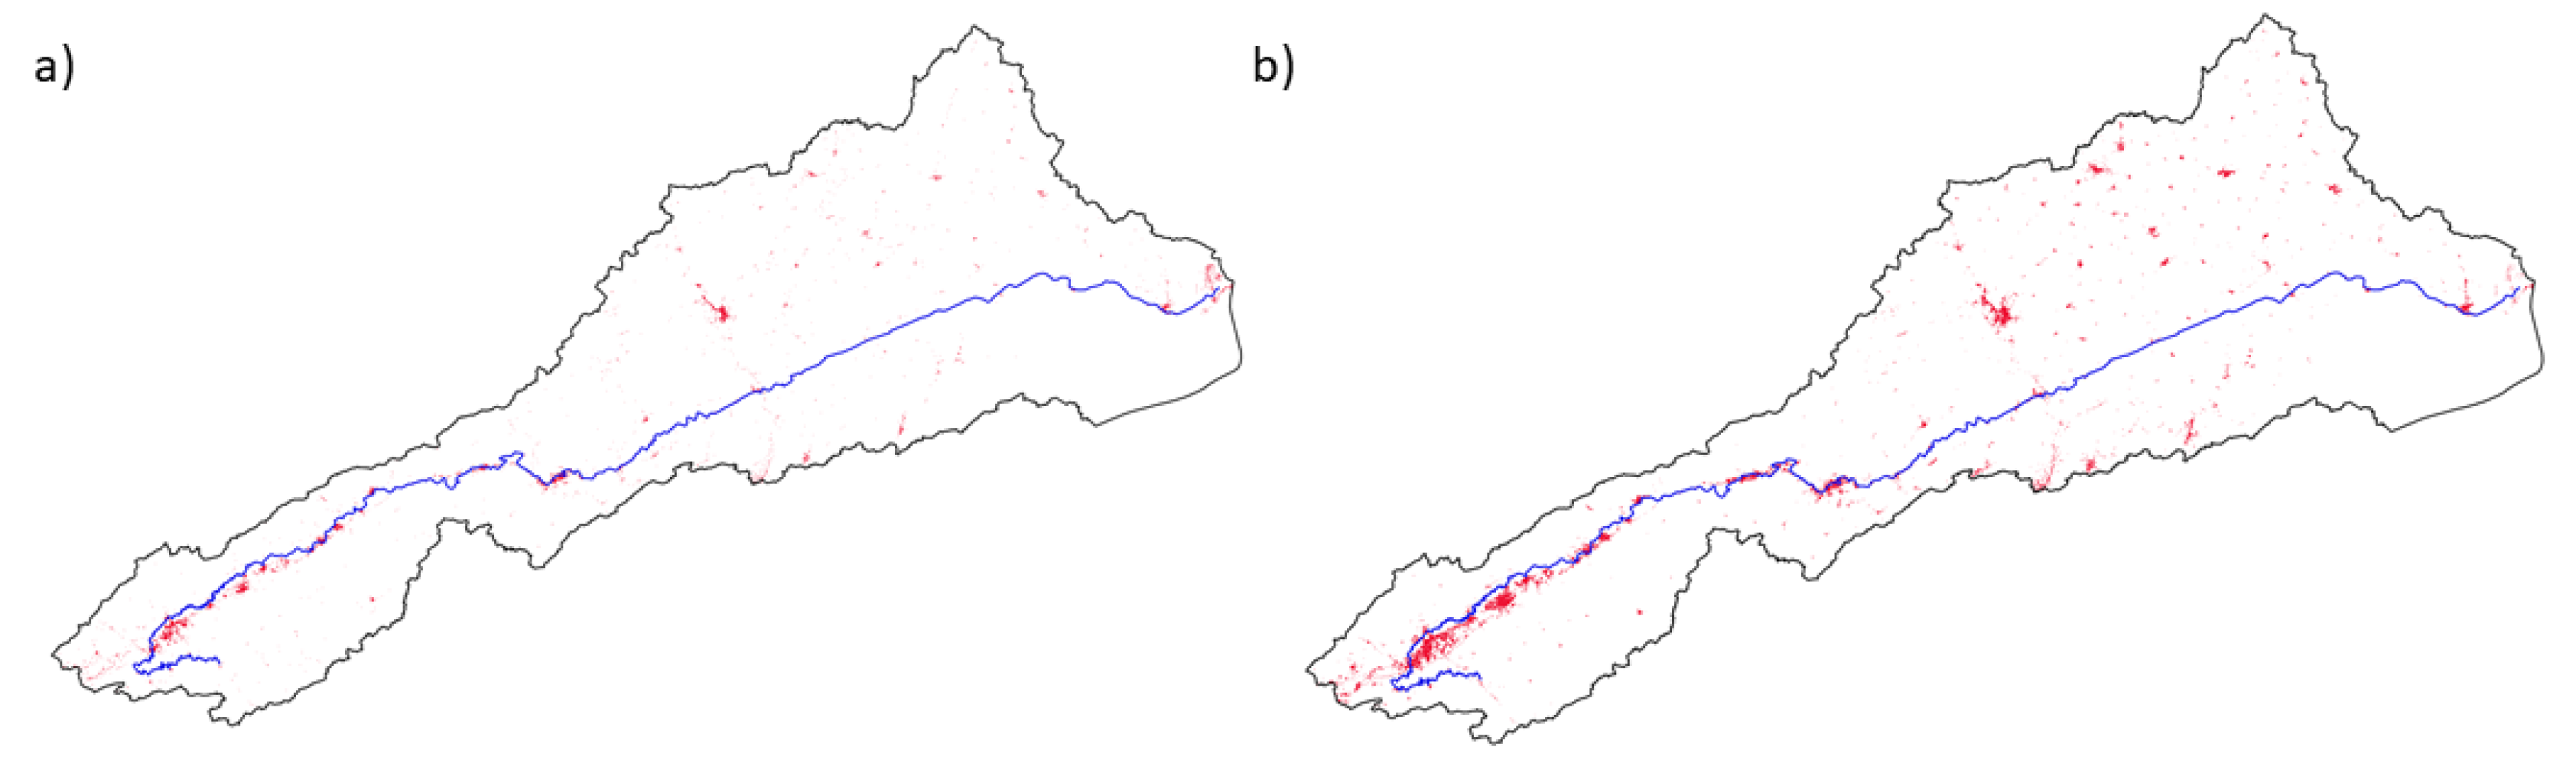
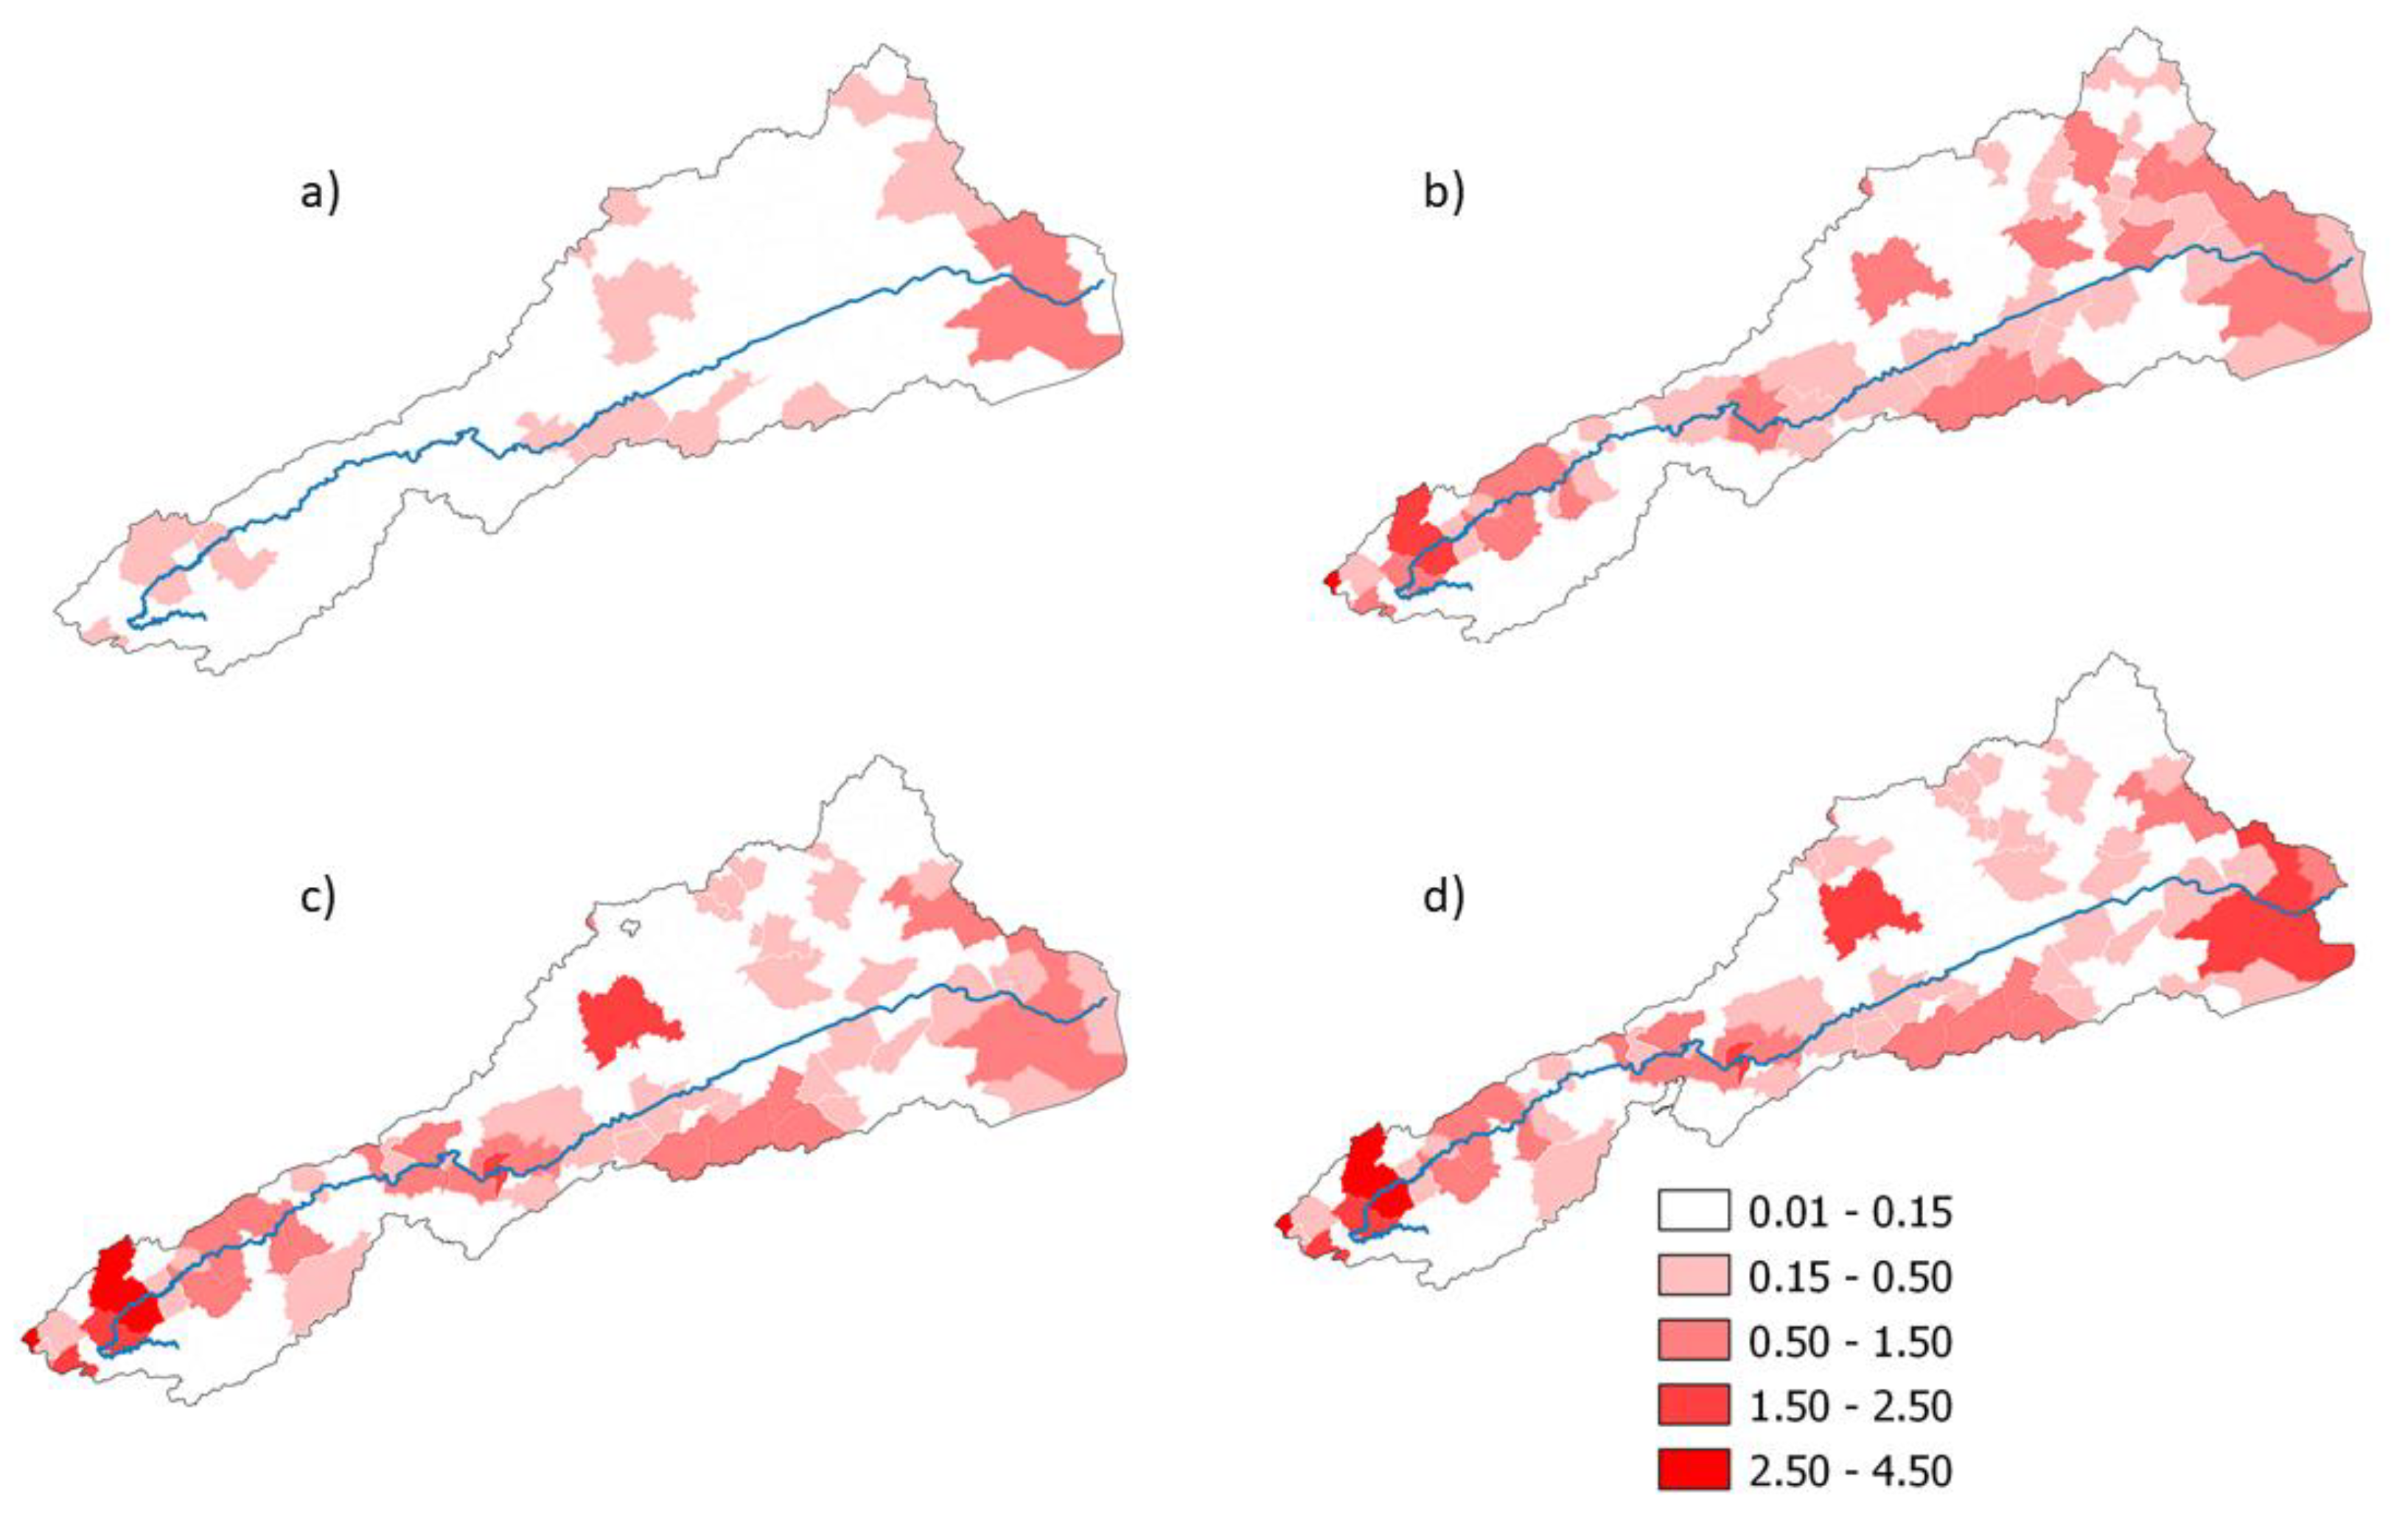
3.3. Urban Influence

Previous sections have shown that most sites in the Paraiba do Sul River Basin did not exhibit statistically significant precipitation trends at a 95% confidence level, although the runoff rates from the area presented almost 50% of sites with negative trends. However, the impact of urban growth on hydrology in the basin has been suggested, as the urban population in the area has significantly increased in recent decades [18,53]. According to the IBGE [54], the total population of the basin, which includes all municipalities within it, even those partially located outside its boundaries, was approximately 2.3 million people in 1940. This number increased to about 5.1 million in 1991 and reached approximately 8.4 million in 2010. The growth of urban areas can be attributed to various factors, including migration resulting from industrialization and economic development. Figure 10a,b illustrate the evolution of population and urban areas in the Paraiba do Sul River Basin, respectively. In 1985, the urban area in the region covered 3,558,071 km2, which increased to 10,554,542 km2 in 2021, predominantly concentrated around the Paraiba do Sul River, particularly in the lower portion of the basin in São Paulo State (Figure 11). According to the Integrated Water Resources Management Plan of the PSRB [22], the average population density in the basin is approximately 123 inhabitants per square kilometer, with an urbanization rate of 91.8%.
Figure 8 showed a decreasing trend of runoff alongside the basin, especially at the central portion. In light of Figure 10 and Figure 11, the role of urbanization may be a determinant driver of changing patterns in water usage, especially where the signal from changes in the precipitation patterns becomes unclear. Figure 12 presents the water demand in the PSRB from 1940–2020 (history) and 2040 (projection), according to [10]. The steep increase in water demand was clear, especially between 1940–1980 (Figure 12a,b), with the beginning of heavy industrialization [55]. Between 1980–2020 (Figure 12b,c), a period of settlement of industrial activity and population burst, the water demand showed some advances, especially in the midportion of the PSRB.
Throughout the literature, modifications in streamflow regimes due to urbanization were extensively studied, especially in North America [56,57,58]. Ref. [59] investigated urbanization effects on streamflow regimes in the Indiana Basin (North America) and the authors showed that urban intensity has a significant effect on their hydrological variables. Their results point to a decrease in the fraction of time that daily streamflow exceeds mean streamflow, and an increase in the frequency of high-flow events due to urbanization. Those findings corroborate with the ones shown in Figure 8 and Figure 9, where negative trends in runoff overlay areas of intensified positive trends of extreme events. In terms of climate change, such results corroborate with future trends in urban sprawl, where peak flows are expected to increase in frequency in the near future [60]. Ref. [61] investigated the relationship between streamflow and urbanization in the Las Vegas metropolitan area. The authors suggested an abrupt increase in peak flows since the mid-1990s and they point to a shift in flood seasonality due to the interactions between hydrometeorological drivers and urbanization. Moreover, the El Niño Southern Oscillation was depicted as an important agent of modulation in the streamflow regime as a consequence of its impacts on extreme precipitation in the region.
In contrast, ref. [62] highlight that the assumption that reductions in baseflow from urbanization may not be a valid premise in all urbanizing watersheds. Their results showed that despite population growth, no statistically significant trend was detected between 1967 and 2010 in the Hinkson Creek watershed (Missouri, USA); however, the baseflows showed a slightly insignificant trend downwards. In general, the offsetting contributions to baseflow (e.g., irrigation, sewer lines, and wastewater effluents) may potentially distort fundamental changes in hydrologic pathways. Such nonlinearity and complexity demand further investigations and caution in evaluating anthropogenic effects on hydrological variables.

4. Conclusions

The analysis of precipitation and streamflow data in the PSRB between 1939 and 2020 has provided valuable insights into the hydrological characteristics of the region. The study reveals clear seasonal patterns in precipitation, with rainy summers and dry winters, indicating the influence of the South American monsoon regime, and spatial variations in precipitation and streamflow within the PSRB. The mountainous regions, particularly the Serra da Mantiqueira, exhibit the highest average annual precipitation values, emphasizing their importance in the overall water balance of the basin. The distribution of runoff across the basin also shows higher average values at higher altitudes.
Furthermore, the Mann–Kendall analysis of the runoff rates, obtained through the streamflow data, indicates a concerning decrease in many sites along the Paraiba do Sul River, mainly in urban areas with high water demands. This is contrary to the results of the Mann–Kendall trends calculated with the precipitation data which, mostly, do not present any significant trends. This raises concerns about the sustainability of water resources in these areas and emphasizes the need for effective water-management strategies to mitigate the potential impacts of water scarcity.
Overall, the findings of this study contribute to a better understanding of the hydrological dynamics in the Paraíba do Sul River Basin. This knowledge is crucial for water resource planning, allocation, and management in the region, particularly in the face of the increasing water demand and potential climate change impacts. Further research and monitoring efforts are warranted to continue assessing and addressing the complex challenges associated with water availability and sustainability in the PSRB.

Supplementary Materials

The following supporting information can be downloaded at: https://www.mdpi.com/article/10.3390/cli11070138/s1.

Author Contributions

Data curation, D.M.d.O.; Formal analysis, D.M.d.O.; Methodology, D.M.d.O. and V.S.B.C.; Software, D.M.d.O.; Writing—original draft, D.M.d.O. and B.d.C.; Writing—review & editing, V.S.B.C., B.C.d.S. and M.S.R. All authors have read and agreed to the published version of the manuscript.

Funding

This research was funded by Associação Pró-Gestão das Águas da Bacia Hidrográfica do Rio Paraíba do Sul (AGEVAP, Paraíba do Sul River Basin Management Association).

Data Availability Statement

Not applicable.

Acknowledgments

We gratefully acknowledge the support of the Associação Pró-Gestão das Águas da Bacia Hidrográfica do Rio Paraíba do Sul (AGEVAP, Paraíba do Sul River Basin Management Association), Coordenação de Aperfeiçoamento de Pessoal de Nível Superior (CAPES, Coordination for the Improvement of Higher Education Personnel), and Conselho Nacional de Desenvolvimento Científico e Tecnológico (CNPq, National Council for Scientific and Technological Development). We would like to extend our sincere appreciation to the Agência Nacional de Águas (ANA, National Water Agency) for generously providing the data from rainfall stations, streamflow stations, and consumptive use data for the Paraíba do Sul River Basin.

Conflicts of Interest

The authors declare no conflict of interest.

References

  1. Masson-Delmotte, V.; Zhai, P.; Pirani, A.; Connors, S.L.; Péan, C.; Berger, S.; Caud, N.; Chen, Y.; Goldfarb, L.; Gomis, M. Climate Change 2021: The Physical Science Basis. Contribution of Working Group I to the Sixth Assessment Report of the Intergovernmental Panel on Climate Change; Cambridge University Press: Cambridge, UK; New York, NY, USA, 2021; Volume 2. [Google Scholar]
  2. Gomes, F.B.R.; Vargas, I.S.; Procópio, A.S.; Castro, S.R.; de Melo Ribeiro, C.B. Estudo da Variabilidade Espaço-Temporal e Tendências de Precipitação na Bacia Hidrográfica Do Rio Paraíba do Sul. Rev. Bras. Climatol. 2021, 28, 365–390. [Google Scholar] [CrossRef]
  3. Fisch, G.; Santos, T.A.d.; Silva, R.C.d. Water security in the Vale do Paraiba´ s basin: Future scenarios. Rev. Ambiente Água 2017, 12, 881–887. [Google Scholar]
  4. Marengo, J.A.; Valverde, M.C. Caracterização do clima no Século XX e Cenário de Mudanças de clima para o Brasil no Século XXI usando os modelos do IPCC-AR4. Rev. Multiciênc. 2007, 8, 5–28. [Google Scholar]
  5. Tabari, H. Climate change impact on flood and extreme precipitation increases with water availability. Sci. Rep. 2020, 10, 1–10. [Google Scholar] [CrossRef] [PubMed]
  6. O’Gorman, P.A. Precipitation extremes under climate change. Curr. Clim. Chang. Rep. 2015, 1, 49–59. [Google Scholar] [CrossRef] [PubMed] [Green Version]
  7. Wilcox, C.; Vischel, T.; Panthou, G.; Bodian, A.; Blanchet, J.; Descroix, L.; Quantin, G.; Cassé, C.; Tanimoun, B.; Kone, S. Trends in hydrological extremes in the Senegal and Niger Rivers. J. Hydrol. 2018, 566, 531–545. [Google Scholar] [CrossRef]
  8. Chug, D.; Pathak, A.; Indu, J.; Jain, S.K.; Jain, S.K.; Dimri, A.; Niyogi, D.; Ghosh, S. Observed evidence for steep rise in the extreme flow of western Himalayan rivers. Geophys. Res. Lett. 2020, 47, e2020GL087815. [Google Scholar] [CrossRef]
  9. Demanboro, A.C. Gestão ambiental e sustentabilidade na macrometrópole paulista-Bacia do Rio Paraíba do Sul. Soc. Nat. 2015, 27, 515–529. [Google Scholar] [CrossRef] [Green Version]
  10. ANA. Conjuntura dos Recursos Hídricos no Brasil 2019: Informe Anual; Agência Nacional de Águas: Brasília, Brazil, 2019. [Google Scholar]
  11. Cavalcanti, B.S.; Marques, G.R.G. Recursos hídricos e gestão de conflitos: A bacia hidrográfica do rio Paraíba do Sul a partir da crise hídrica de 2014–2015. Rev. Gestão Países Língua Port. 2016, 15, 4–16. [Google Scholar]
  12. Da Costa, L.F.; De Farias Júnior, J.E.F.; Johnson, R.M.F.; Petrungaro, A.C.N.; Ramos, N.P. Análise da precipitação da bacia do rio Paraíba do Sul com enfoque nos anos de 2014 a 2017. In Proceedings of the III Simpósio de Recursos Hídricos da Bacia do rio Paraíba do Sul, Juiz de Fora, Brazil, 27–29 August 2018. [Google Scholar]
  13. Vasconcelos, N.d.A.; Formiga-Johnsson, R.M.; Ribeiro, N.B. Impactos da crise hídrica 2014–2016 sobre os principais usuários do Sistema Hidráulico das Bacias dos rios Paraíba do Sul e Guandu. Rev. Gestão Água Am. Lat. 2019, 16, e14. [Google Scholar]
  14. Neves, A.d.O.; Vilanova, M.R.N. Caracterização da seca histórica da década de 2010 na Bacia do Rio Paraíba do Sul, Estado de São Paulo, Brasil. Eng. Sanit. Ambient. 2021, 26, 339–349. [Google Scholar] [CrossRef]
  15. Mendonça, J.C.; Sousa, E.d.; André, R.G.B.; Silva, B.d.; Ferreira, N.d.J. Assessment of evapotranspiration in North Fluminense Region, Brazil, using Modis products and Sebal algorithm. Evapotranspir.-Remote Sens. Model. 2012, 1, 1–18. [Google Scholar]
  16. Brasiliense, C.S. Chuvas Intensas Associadas a Inundações Na Bacia do Rio Paraíba do Sul em Janeiro/2000. In Proceedings of the II IPTMU—Encontro Sobre Impactos Potenciais de Desastres Naturais em Infraestruturas de Transporte e Mobilidade Urbana, São José dos Campos, Brasil, 4–6 October 2016. [Google Scholar]
  17. Campos, B.d. Sensibilidade de Parametrizações de Convecção Cúmulus e Microfísica de Nuvens em Eventos Extremos de Precipitação na Bacia do Rio Paraíba do Sul. Master’s Thesis, Universidade Federal de Itajubá, Itajubá, Brazil, 2022. [Google Scholar]
  18. Marengo, J.A.; Alves, L.M. Tendências hidrológicas da bacia do rio Paraíba do Sul. Rev. Bras. Meteorol. 2005, 20, 215–226. [Google Scholar]
  19. de Almeida Santana, G.R.; Santos, E.B.; da Silva, M.G.A.J. Caracterização Espaço-Temporal das Secas na Bacia do Rio Paraíba do Sul. Anuário Inst. Geociênc. 2020, 43, 364–375. [Google Scholar]
  20. Kumler, L.M.; Lemos, M.C. Managing waters of the Paraíba do Sul river basin, Brazil: A case study in institutional change and social learning. Ecol. Soc. 2008, 13. [Google Scholar]
  21. AGEVAP. Plano de Recursos Hídricos da Bacia do rio Paraíba do Sul: Diagnóstico dos Recursos Hídricos-Relatório Final; Laboratório de Hidrologia e Estudos de Meio Ambiente: Francisco, CA, USA, 2006. [Google Scholar]
  22. AGEVAP. Plano Integrado de Recursos Hídricos da Bacia Hidrográfica do rio Paraíba do Sul e Planos de Recursos Hídricos das Bacias Afluentes: Caracterização Sócio-Econômica. 2013. Available online: www.ceivap.org.br/conteudo/relatorio-diagnostico-rp6-tomo3.pdf (accessed on 20 September 2022).
  23. Ioris, A.A. Os limites políticos de uma reforma incompleta: A implementação da Lei dos Recursos Hídricos na Bacia do Paraíba do Sul. Rev. Bras. Estud. Urbanos Reg. 2008, 10, 61. [Google Scholar] [CrossRef] [Green Version]
  24. Grimm, A.M.; Vera, C.S.; Mechoso, C.R. The South American Monsoon System. In The Global Monsoon System: Research and Forecast, Proceedings of the International Committee of the Third International Workshop on Monsoons (IWMIII), Hangzhou, China, 2–6 November 2004; Chang, C.-P., Wang, B., Lau, N.-C.G., Eds.; WMO/TD No 1266 (TMRP Report No 70); World Scientific: Singapore, 2005; pp. 219–238. [Google Scholar]
  25. Reboita, M.S.; Teodoro, T.A.; Ferreira, G.; Souza, C. Ciclo de vida do sistema de monção da América do Sul: Clima presente e futuro. Rev. Bras. Geogr. Física 2022, 15, 343–358. [Google Scholar]
  26. Duran-Quesada, A.M.; Reboita, M.; Gimeno, L.; Nieto, R. The role of the tropics in the global water cycle: Precipitation and moisture transport in Tropical America. Earth Obs. Water Cycle Sci. 2009, 674, 34. [Google Scholar]
  27. Lenters, J.D.; Cook, K. Simulation and diagnosis of the regional summertime precipitation climatology of South America. J. Clim. 1995, 8, 2988–3005. [Google Scholar] [CrossRef]
  28. Kodama, Y. Large-scale common features of subtropical precipitation zones (the Baiu frontal zone, the SPCZ, and the SACZ) Part I: Characteristics of subtropical frontal zones. J. Meteorol. Soc. Jpn. Ser. II 1992, 70, 813–836. [Google Scholar] [CrossRef] [Green Version]
  29. Reboita, M.S.; Gan, M.A.; Rocha, R.P.d.; Ambrizzi, T. Regimes de precipitação na América do Sul: Uma revisão bibliográfica. Rev. Bras. Meteorol. 2010, 25, 185–204. [Google Scholar] [CrossRef]
  30. Wilks, D.S. Statistical Methods in the Atmospheric Sciences; Academic Press: Cambridge, MA, USA, 2011; Volume 100. [Google Scholar]
  31. Costa, R.L.; de Mello Baptista, G.M.; Gomes, H.B.; dos Santos Silva, F.D.; da Rocha Júnior, R.L.; de Araújo Salvador, M.; Herdies, D.L. Analysis of climate extremes indices over northeast Brazil from 1961 to 2014. Weather Clim. Extrem. 2020, 28, 100254. [Google Scholar] [CrossRef]
  32. Silva Dias, M.A.; Dias, J.; Carvalho, L.M.; Freitas, E.D.; Silva Dias, P.L. Changes in extreme daily rainfall for São Paulo, Brazil. Clim. Chang. 2013, 116, 705–722. [Google Scholar] [CrossRef]
  33. Pedron, I.T.; Silva Dias, M.A.; de Paula Dias, S.; Carvalho, L.M.; Freitas, E.D. Trends and variability in extremes of precipitation in Curitiba–Southern Brazil. Int. J. Climatol. 2017, 37, 1250–1264. [Google Scholar] [CrossRef]
  34. Gudmundsson, L.; Leonard, M.; Do, H.X.; Westra, S.; Seneviratne, S.I. Observed trends in global indicators of mean and extreme streamflow. Geophys. Res. Lett. 2019, 46, 756–766. [Google Scholar] [CrossRef] [Green Version]
  35. Abou Rafee, S.A.; Freitas, E.D.; Martins, J.A.; Martins, L.D.; Domingues, L.M.; Nascimento, J.M.P.; Machado, C.B.; Santos, E.B.; Rudke, A.P.; Fujita, T.; et al. Spatial Trends of Extreme Precipitation Events in the Paraná River Basin. J. Appl. Meteorol. Climatol. 2020, 59, 443–454. [Google Scholar] [CrossRef]
  36. Meirelles, I. Design for Information: An Introduction to the Histories, Theories, and Best Practices behind Effective Information Visualizations; Rockport Publishers: Beverly, MA, USA, 2013. [Google Scholar]
  37. Mann, H.B. Nonparametric tests against trend. Econom. J. Econom. Soc. 1945, 13, 245–259. [Google Scholar] [CrossRef]
  38. Kendall, M. Rank Correlation Methods; Charles Griffin: London, UK, 1975. [Google Scholar]
  39. Marengo, J.; Liebmann, B.; Grimm, A.; Misra, V.; Silva Dias, P.d.; Cavalcanti, I.; Carvalho, L.; Berbery, E.; Ambrizzi, T.; Vera, C.S. Recent developments on the South American monsoon system. Int. J. Climatol. 2012, 32, 1–21. [Google Scholar] [CrossRef] [Green Version]
  40. Wang, B.; Jin, C.; Liu, J. Understanding future change of global monsoons projected by CMIP6 models. J. Clim. 2020, 33, 6471–6489. [Google Scholar] [CrossRef]
  41. Alves Teodoro, T.; Simões Reboita, M.; Juan Escobar, G.C. Principais Padrões de Verão da Pressão ao Nível do Mar sobre a Região da América do Sul no Clima Presente e em Projeções Futuras. Anu. Inst. Geocienc. 2022, 45, 40597. [Google Scholar]
  42. Silva, V.B.; Kousky, V.E. The South American monsoon system: Climatology and variability. Mod. Climatol. 2012, 123, 152. [Google Scholar]
  43. Silva, V. Eventos de Seca na Região Sudeste do Brasil: Ocorrências Temporais e Comportamento Futuro. Master’s Thesis, Universidade Federal de Lavras, Lavras, Brasil, 2018. [Google Scholar]
  44. Nobre, C.A.; Marengo, J.A.; Seluchi, M.E.; Cuartas, L.A.; Alves, L.M. Some characteristics and impacts of the drought and water crisis in Southeastern Brazil during 2014 and 2015. J. Water Resour. Prot. 2016, 8, 252–262. [Google Scholar] [CrossRef] [Green Version]
  45. Coelho, C.A.; Cardoso, D.H.; Firpo, M.A. A seca de 2013 a 2015 na região sudeste do Brasil. Rev. Climanalise 2016, 55–66. [Google Scholar]
  46. Kayano, M.T.; Moura, A.D. O El Niño de 1982-83 e a precipitação sobre a América do Sul. Braz. J. Geophys. 2018, 4, 201–214. [Google Scholar] [CrossRef]
  47. Brasiliense, C.S.; Dereczynski, C.P.; Satyamurty, P.; Chou, S.C.; Calado, R.N. Climatologias da Temperatura do Ar e da Precipitação na Bacia do Rio Paraíba do Sul, Região Sudeste do Brasil. Anuário Inst. Geociênc. 2020, 43, 355–365. [Google Scholar]
  48. dos Reis, A.L.; Silva, M.S.; Regis, M.V.; da Silveira, W.W.; de Souza, A.C.; Reboita, M.S.; Silveira, V. Climatologia e eventos extremos de precipitação no estado de Minas Gerais (Climatology and extreme rainfall events in the state of Minas Gerais). Rev. Bras. Geogr. Física 2018, 11, 652–660. [Google Scholar]
  49. Alves, G.J.; Mello, C.R.; Guo, L.; Thebaldi, M.S. Natural disaster in the mountainous region of Rio de Janeiro state, Brazil: Assessment of the daily rainfall erosivity as an early warning index. Int. Soil Water Conserv. Res. 2022, 10, 547–556. [Google Scholar] [CrossRef]
  50. Alcântara, E.; Marengo, J.A.; Mantovani, J.; Londe, L.R.; San, R.L.Y.; Park, E.; Lin, Y.N.; Wang, J.; Mendes, T.; Cunha, A.P.; et al. Deadly disasters in southeastern South America: Flash floods and landslides of February 2022 in Petrópolis, Rio de Janeiro. Nat. Hazards Earth Syst. Sci. 2023, 23, 1157–1175. [Google Scholar] [CrossRef]
  51. Andrade, M.P.d.; Ribeiro, C.B.d.M. Impacts of land use and cover change on Paraíba do Sul whatershed streamflow using the SWAT model. RBRH 2020, 25, e12. [Google Scholar] [CrossRef] [Green Version]
  52. de Assis Dias, M.C.; Saito, S.M.; dos Santos Alvalá, R.C.; Stenner, C.; Pinho, G.; Nobre, C.A.; de Souza Fonseca, M.R.; Santos, C.; Amadeu, P.; Silva, D. Estimation of exposed population to landslides and floods risk areas in Brazil, on an intra-urban scale. Int. J. Disaster Risk Reduct. 2018, 31, 449–459. [Google Scholar] [CrossRef]
  53. da Encarnação Paiva, A.C.; Nascimento, N.; Rodriguez, D.A.; Tomasella, J.; Carriello, F.; Rezende, F.S. Urban expansion and its impact on water security: The case of the Paraíba do Sul River Basin, São Paulo, Brazil. Sci. Total Environ. 2020, 720, 137509. [Google Scholar] [CrossRef]
  54. Altmann, W. Censo IBGE 2010 e Religião (IBGE 2010 Census and Religion). Horizonte-Rev. Estud. Teol. Ciênc. Relig. 2012, 10, 1122–1129. [Google Scholar]
  55. Vieira, E.T. Industrialização e as políticas de desenvolvimento regional: Estudo do Vale do Paraíba paulista no período de 1970 a 2000. REDES Rev. Desenvolv. Reg. 2014, 19, 77–97. [Google Scholar]
  56. Viger, R.J.; Hay, L.E.; Markstrom, S.L.; Jones, J.W.; Buell, G.R. Hydrologic effects of urbanization and climate change on the Flint River basin, Georgia. Earth Interact. 2011, 15, 1–25. [Google Scholar] [CrossRef]
  57. Gerard, A.; Martinaitis, S.M.; Gourley, J.J.; Howard, K.W.; Zhang, J. An overview of the performance and operational applications of the MRMS and FLASH systems in recent significant urban flash flood events. Bull. Am. Meteorol. Soc. 2021, 102, E2165–E2176. [Google Scholar]
  58. Kaufmann, R.K.; Seto, K.C.; Schneider, A.; Liu, Z.; Zhou, L.; Wang, W. Climate response to rapid urban growth: Evidence of a human-induced precipitation deficit. J. Clim. 2007, 20, 2299–2306. [Google Scholar] [CrossRef]
  59. Yang, G.; Bowling, L.C.; Cherkauer, K.A.; Pijanowski, B.C.; Niyogi, D. Hydroclimatic response of watersheds to urban intensity: An observational and modeling-based analysis for the White River Basin, Indiana. J. Hydrometeorol. 2010, 11, 122–138. [Google Scholar] [CrossRef] [Green Version]
  60. Zhao, G.; Gao, H.; Cuo, L. Effects of urbanization and climate change on peak flows over the San Antonio River Basin, Texas. J. Hydrometeorol. 2016, 17, 2371–2389. [Google Scholar] [CrossRef]
  61. Yu, G.; Miller, J.J.; Hatchett, B.J.; Berli, M.; Wright, D.B.; McDougall, C.; Zhu, Z. The Nonstationary Flood Hydrology of an Urbanizing Arid Watershed. J. Hydrometeorol. 2023, 24, 87–104. [Google Scholar] [CrossRef]
  62. Hubbart, J.A.; Zell, C. Considering streamflow trend analyses uncertainty in urbanizing watersheds: A baseflow case study in the central United States. Earth Interact. 2013, 17, 1–28. [Google Scholar] [CrossRef]
Figure 1. Representation of the study area with the location of the PSRB in Brazil (left side) and the PSRB region with altitude information and location of the streamflow (blue dots) and rainfall (red dots) stations considered (right side).
Climate 11 00138 g001
Figure 2. (a) Monthly average precipitation and standard deviation, (b) box plot of the annual precipitation totals of the rainfall stations, and (c) spatial distribution of the average annual precipitation totals recorded at rainfall stations (red dots) in the PSRB between 1939 and 2020.
Climate 11 00138 g002
Figure 3. Spatial distribution of the extreme daily precipitation thresholds (a) p95 and (b) p99 [mm] for the dry season, and (c) p95 and (d) p99 for the wet season. The red dots show the location of the rainfall stations.
Climate 11 00138 g003
Figure 4. Trend of the monthly precipitation totals at the rainfall stations from 1939 to 2020 considering the (a) dry and (b) wet seasons.
Climate 11 00138 g004
Figure 5. Trend on the number of days above (a) p95 and (b) p99 thresholds during the dry season, and (c) p95 and (d) p99 thresholds during the wet season.
Climate 11 00138 g005
Figure 6. Spatial distribution of monthly average runoff rates [l/s/km2] recorded at the streamflow stations between 1939–2020.
Climate 11 00138 g006
Figure 7. Spatial distribution of extreme runoff values [l/s/km2] for the dry season in percentiles (a) p95 and (b) p99, and for the wet season in (c) p95 and (d) p99.
Climate 11 00138 g007
Figure 8. Trend of monthly average daily runoff rates at the streamflow stations from 1939 to 2020 for (a) dry season and (b) wet season.
Climate 11 00138 g008
Figure 9. Trend of occurrence of extreme runoff rates events at the streamflow stations above the percentile thresholds of (a) p95 and (b) p99 during the dry season, and above the percentile thresholds of (c) p95 and (d) p99 during the wet season.
Climate 11 00138 g009
Figure 10. (a) Population in the PSRB from 1940 to 2010 (IBGE, 2010) and (b) urban area [km2] from 1985–2021 (MapBiomas, 2021).
Climate 11 00138 g010
Figure 11. Urban area (in red) of the PSRB in (a) 1985 and (b) 2021. The blue line marks the course of the Paraiba do Sul River.
Climate 11 00138 g011
Figure 12. Water demand [m3/s] in PSRB; this data captures the amount of water that is removed and consumed, without returning directly to the water body in (a) em 1940, (b) 1980, (c) 2020, and (d) 2040 (prognosis).
Climate 11 00138 g012
Disclaimer/Publisher’s Note: The statements, opinions and data contained in all publications are solely those of the individual author(s) and contributor(s) and not of MDPI and/or the editor(s). MDPI and/or the editor(s) disclaim responsibility for any injury to people or property resulting from any ideas, methods, instructions or products referred to in the content.

