Abstract
Floods are the most common and costliest natural hazard in Australia. However, the Flood Resilience Assessments (FReAs) employed to manage them lack a focus on adaptive capacity and tend not to be incorporated into established flood risk frameworks. This leaves potential for Australian FReAs to make better use of a methodology which holistically incorporates more accurate flood resilience characterisations into flood risk frameworks. In this study, a FReA and mapping for the Hawkesbury-Nepean Catchment (HNC), a flood-prone region in Australia, were conducted. Nine flood resilience indicators were selected to derive the Flood Resilience Index (FReI). Results demonstrated that Statistical Areas Level 2 (SA2s) on or near the floodplain, located near the eastern border of the HNC, present moderate to very high levels of resilience due to increased socio-economic development and urbanisation in the region. Ultimately, this novel FReI can contribute to knowledge bolstering flood resilience in the HNC, as well as assist in flood risk reduction. Additionally, the developed scalable and replicable methodology can be applied to other flood-prone regions of Australia.
1. Introduction
Flood hazards are some of the most dangerous and destructive natural hazards that communities across the globe endure [1]. A flood is described by the Australian Bureau of Meteorology (BoM) as “an overflow of water beyond the normal limits of a watercourse” [2], and is often experienced in three main forms: fluvial (the overflow of a water body), pluvial (a result of extreme rainfall, otherwise known as flash-flooding), and coastal inundation (caused by storm surge) [3]. Flood events in Australia between 2020 and 2022 have been notably extreme [4]. In 2022 alone, along the east coast of Australia, particularly in southern Queensland (QLD), northern Victoria, and New South Wales (NSW), fluvial and pluvial floods have devastated communities and taken lives. It has become clear that research into flood resilience in particular is critical to inform future flood management plans, especially in these severely affected areas.
Australia’s widely varying hydroclimate has historically subjected several regions to heavy precipitation events that result in flooding [5]. In many wetland ecosystems, fluvial and pluvial flooding are a regular occurrence which can, in turn, offer ecological benefits. Such benefits include the distribution of sediments and nutrients across vegetated areas, which greatly benefits agriculture, for example [6,7]. It is when human communities begin to inhabit such areas, and hence their assets become more greatly exposed, that devastating losses from flood events are felt. This has become a major concern in Australia ever since colonisation commonly resulted in settlement on floodplains [8]. The recurring destruction that ensues in these now fully established communities has meant that pluvial and fluvial floods have become Australia’s costliest natural hazards [9]. In the most recent instances, the Insurance Council of Australia has estimated that, in the first five months of 2022 (i.e., not including the widespread inland spring floods), flood events resulted in approximately $3.3 AUD billion in insured losses along the country’s eastern coast [10].
Torrential rainfall events in Australia, particularly in communities of NSW, have increasingly become a cause for concern, with research suggesting that their intensity is growing [11,12]. A number of factors contribute to the augmenting of pluvial floods, including natural climate drivers such as the Indian Ocean Dipole, the Southern Annular Mode, the Madden–Julian Oscillation, and notably the El Niño Southern Oscillation (ENSO) [13]. In particular, the negative phase of ENSO, La Niña, is strongly associated with heavy rainfall across eastern and northeastern Australia [14]. When accompanied by the presence of anthropogenic climate change, which can contribute 7% more moisture to the atmosphere with each degree of warming, the impact of La Niña events has the potential to become more intense [15,16]. This intensification has highlighted the need for a more proactive approach to flood resilience assessment.
Flood Resilience Assessments (FReAs) explore capacities for growth by investigating post-flood conditions for local communities. By doing so, FReAs can act as independent resources for flood resilience analyses, while also contributing to the understandings brought about by Flood Risk Assessments (FRAs) despite not typically being associated with risk calculations in the literature. This ultimately brings about healthier and safer lifestyles in a rapidly changing future landscape affected by climate change. Ultimately, the assessment of community resilience within the HNC is largely encompassed by risk assessment, and in particular, the NSW Government Flood Impact and Risk Assessment Flood Risk Management Guide [17]. This guide is intended for use by government authorities and consultancy agencies, in order to produce Flood Impact and Risk Assessment reports, which typically identify and analyse impacts upon proposed developments. This report, however, is largely hazard-centric, and provides data mainly on conditions of the flood waters themselves (e.g., flood depth, peak flood velocity, and peak flood extents), as opposed to community vulnerability and exposure factors [17]. A key resource which investigates resilience—as a less hazard-focused approach—is the 2020 Australian Natural Disaster Resilience Index (the ANDRI or ADRI), created by the Bushfire and Natural Hazards Cooperative Research Centre (Bushfire and Natural Hazards CRC). The ANDRI provides “a snapshot of the capacities for disaster resilience in Australian communities” [18], by quantifying such resilience through an index-based methodological framework. This index, however, is non-specific to flood hazards and encompasses all categories of natural hazard. Although the ANDRI is not flood-specific and has notable constraints, it was a key resource for this study’s flood resilience analysis. Its indicators and their respective datasets are strong proof-of-concept proxies, but, perhaps more importantly, the ANDRI represents Australia’s most comprehensive resilience index output, and its methodology is robust and defensible.
A recent study by Chen [19] sought to incorporate flood resilience into the established Natural Hazard Risk Triangle (NHRT) framework to establish relationships between hazard, exposure, vulnerability, and resilience (hazard is the flood hazard itself, exposure is what stands to be lost, and vulnerability refers to the environmental conditions which may exacerbate the flood event). In their paper, Chen [19] posits a conceptual FRA framework for Sheffield, UK, built upon a novel resilience-integrated NHRT. Ultimately, this model implies that flood resilience can decrease flood risk.
Taking into account resilience and its capacity to decrease overall risk, there then exists a mathematical relationship between flood resilience and risk (Equation (1)).
Overall Risk = (Hazard ∗ Exposure ∗ Vulnerability) − Resilience
The Intergovernmental Panel on Climate Change (IPCC) describes resilience (this can be applied to flood resilience) as “bouncing back and returning to a previous state after a disturbance … not just the ability to maintain essential function, identity and structure, but also the capacity for transformation” [20]. Additionally, the majority of the literature in this space defines flood resilience in three major ways: coping, returning to normality, and adapting or transforming (e.g., [21,22,23].
This study defines flood resilience by utilising a conceptualisation offered by [24]. Thus, for this study, flood resilience can be said to be characterised by actions that decrease flood vulnerability into the future if a similar flood event were to occur. It is also acknowledged that a decrease in flood vulnerability may in turn decrease exposure; however, resilience is being defined here through its direct link to vulnerability. This definition aligns with the aforementioned resilience-integrated NHRT. It is important to distinguish between flood vulnerability (within flood risk) and resilience. Flood vulnerability encompasses pre-flood conditions which may heighten or lessen impacts: it is the predisposition to harm in the presence of a flood hazard event. In contrast, flood resilience concerns post-flood conditions related to restoration and growth.
Our study asks the research question: How can the inland flood resilience of at-risk communities be most accurately assessed using an index-based approach? The aim of this proof-of-concept was to develop and map a Flood Resilience Index (FReI) for the Hawkesbury-Nepean Catchment (HNC). An additional novelty in the production of this index was the scale at which it was produced. A catchment scale for this assessment tailors the approach to flood-specific resilience, as it takes into account areas subjected to high flood risk. Ultimately, this study aligned with the strategic objectives of the Climate Risk and Early Warning Systems (CREWS) Initiative that has global members working to increase at-risk community resilience to natural hazards.
2. Materials and Methods
2.1. Study Area and Scope
The spatial basis of this research was the HNC, which lies to the west of Sydney in NSW, Australia. It spans over 21,700 square kilometres, containing twenty-six Local Government Areas (LGAs), and is NSW’s longest coastal catchment, stretching from Goulburn, through the Blue Mountains, to the latitude of Newcastle (Figure 1 and Figure 2).
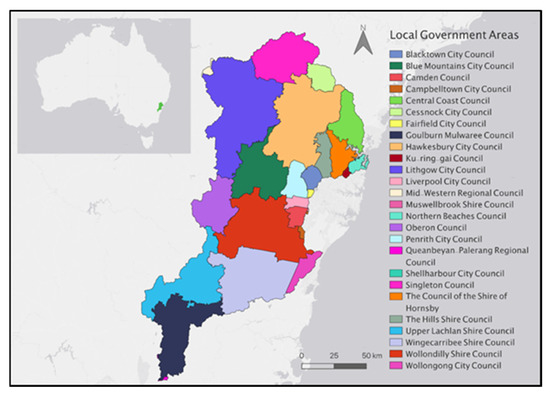
Figure 1.
Australia’s Hawkesbury-Nepean Catchment, visualised through its twenty-six Local Government Areas (LGAs) as of 2022. Made using QGIS 3.24 software.
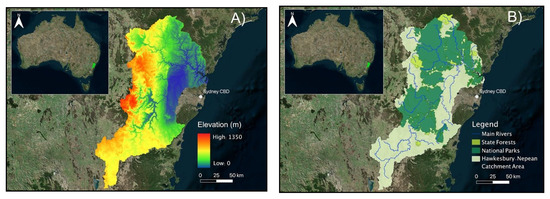
Figure 2.
Topographical and river outline maps of the Hawkesbury-Nepean Catchment region. (A) illustrates the topography, and (B) depicts the conservation areas and river system. Made using ArcMap 10.7 software.
The HNC is widely considered to have the highest flood risk in NSW, if not potentially all of Australia [25]. This is in part due to the fact that a well-known ‘bathtub effect’ is observed in the heart of the catchment in the Hawkesbury River [25]. This occurs because there are four major tributaries that feed into the Hawkesbury River (Figure 2B)-the Warragamba, Nepean, Grose, and South Creek tributaries, in addition to other smaller contributing waterways. Crucially, instead of widening closer to the sea, the Hawkesbury River features several tight choke points, which can quickly cause inundation of the flat floodplain when heavy rainfall events occur, and overwhelm the river system. Figure 2A highlights the low-lying and flat nature of this central floodplain area, as well as the several surrounding higher-elevated areas that drain into it. Thus, this region is particularly susceptible to flood hazard events in the wake of extreme rainfall. This, in combination with the highly developed nature of the floodplain area, especially with some parts being of lower average socio-economic status, combines to create a catchment with a particularly high risk of flood impacts. This flood risk is set to increase into the future, with projections outlining a doubling in this catchment’s risk by 2041 due to worsening climate change [26].
Flood resilience is concerned with coping during a flood and adaptation after a flood, which affects future flood vulnerability. It should be noted that this research also scoped socio-economic flood resilience—that is, indicators chosen which relate to local communities and their built environments. Doing so also provides an insight into human health and livelihoods in the catchment, which was a key priority for this research. Finally, this study prioritised inland flood hazards rather than coastal inundation.
2.2. Flood Resilience Indicators and Data
Following assessment of many indicators, nine were chosen to characterise flood resilience, acting as suitable proxies. It is important to note that, although the nine indicators were comparatively less comprehensive than those of other studies in terms of their data collection over the case study area, for this study, they existed as suitable and helpful placeholders for the Flood Resilience Index. Importantly, other than the flood project density indicator, all of these indicators were based upon the 2020 Australian Natural Disaster Resilience Index (ANDRI) measures, which provide a snapshot of natural hazard resilience capacities throughout Australia, including but not limited to flood resilience analyses.
All indicators, except for the unemployment rate indicator, were positively correlated with flood resilience.
The indicators selected were:
- Government grant density
- Motor vehicle density
- Index of Economic Resources
- Unemployment rate
- Tertiary qualification rate
- Community service workers
- Internet access
- Median personal income
- Flood project density.
Where possible, the Australian Bureau of Statistics (ABS) was prioritised as the source of data for indicators due to its comprehensive, robust, and recent datasets. All data were collected at the Local Government Area (LGA) level because this achieved a balance between suitable data availability and spatial resolution. Data were also converted to a 0–1 range for ease of subsequent calculations.
Government grant density
The government grant density indicator was calculated by dividing a government grant value by land area (kilometres squared) for a given LGA. Importantly, this ensured that the indicator was standardised between LGAs of significantly different land areas. For this study, government grant data were obtained from a 2019 Local Government National Report by the Department of Infrastructure, Transport, Regional Development and Communications. Such data specifically referred to the general purpose grant component of the actual total grant entitlement under the Financial Assistance Grant program (the actual total grant entitlement included both general purpose grants and local road grants).
This indicator was an important input for the Flood Resilience Index (FReI) because it can be expected that an LGA which receives more access to more resources becomes more resilient to inland flooding. Ultimately, general government grants are suitable proxies for government financial assistance sought by LGAs, and hence how strengthened they are in the presence of natural hazards.
Motor vehicle density
The motor vehicle density indicator was calculated by dividing the total registered motor vehicles value (in a given year) by land area for a given LGA; this again standardised between LGAs of different sizes. Motor vehicle data were obtained from 2020 Regional Statistics through the ABS.
Conceptually, an LGA with a higher value for this indicator has more motor vehicles available for urgent evacuation along transport routes during a flood event. Motor vehicles are also proxies for ease of access to resources and emergency services, as well as general insights into how infrastructurally robust an LGA may be. This results in increased flood resilience for the LGA.
Index of economic resources
Data for the Index of Economic Resources (IER) indicator were directly obtained from the ABS’s 2016 Socio-Economic Indexes for Areas (SEIFA) product, which ranks areas in Australia by relative socio-economic advantage and disadvantage (as mentioned previously), based on a calculated score for each LGA. IER is one of four indices in the SEIFA.
IER was included as an indicator in this analysis because it is currently one of the strongest means to capture data on economic development (advantages and disadvantages) for LGAs in Australia. Economic development is tied to flood resilience in that an LGA with more economic capital can more easily cope and adapt to a flood event.
Unemployment rate
The unemployment rate indicator was obtained from the Australian Government’s National Skills Commission via a 2021 Small Area Labour Markets (SALM) dataset.
Like the IER, this indicator is tied to a community’s capital for a given LGA, in that an LGA with a relatively higher unemployment rate is more likely to be less resilient. This is because less social capital (labour) can be dedicated to the flood emergency response as well as general community development, post-flood event.
Tertiary qualification rate
This indicator was sourced from the ABS via a 2016 Education and Employment dataset. Importantly, tertiary qualifications were described as being postgraduate degrees, graduate diplomas, graduate certificates, bachelor degrees, advanced diplomas and diplomas, and general certificates.
For this study, it can be understood that tertiary qualifications produce greater educational opportunities; this supports industry and other services and, in turn, results in LGAs being more resilient to flood hazards. This can be juxtaposed against the unemployment rate indicator, which implies less resilience with its increase.
Community service workers
This indicator was sourced from the ABS via the same 2016 dataset as that of the tertiary qualification rate indicator. Data on community and personal service workers were sought.
An LGA with a greater amount of community service workers has greater social capital, and thus is more resilient to flood hazards. This can come from volunteering or key healthcare services such as elderly care.
Internet access
The internet access indicator was sourced from Torrens University’s Public Health Information Development Unit (PHIDU), and within this, the ‘Social Health Atlases of Australia’. Data from 2016 were available for the number of private dwellings where the internet could be accessed, in relation to the total number of private dwellings for each LGA. This indicator was presented in percentage units.
It was important to capture an internet access indicator within the FReI because internet access corresponds to more effective communication, learning, and knowledge sharing during an emergency response to rainfall and riverine flooding, which in turn results in increased resilience. Importantly, internet access can also provide an insight into which demographics, such as the elderly, are particularly less resilient to flood hazards.
Median personal income
This indicator was sourced from the ABS via a 2016 Estimates of Personal Income dataset. A given value for this indicator represents the median personal income for the entirety of a given LGA, between 2015 and 2016. It should be noted that data for this input excluded any government pensions or allowances.
Median personal income provides another socio-economic insight into LGAs of the HNC, in which LGAs with greater incomes are more resilient to floods.
Flood project density
This indicator was constructed by extracting data from the NSW State Emergency Service’s (SES) 2022 Flood Data Portal. Importantly, according to the Flood Data Portal, flood projects are “studies [or] plans which have been developed as a part of the Floodplain Risk Management Process, to determine flood affectation and its effects, over a defined study area” [27]. Flood project density was initially measured in units of ‘number of flood projects per LGA’; data for the indicator were then standardised by land area, so as to account for differently sized LGAs.
This indicator captures more of a flood-specific resilience input for the FReI. It is an insight into the landscape of NSW flood management. Valuable insights can be sought by relating trends from this indicator to LGA locations in relation to key streams and tributaries in the HNC. As can be understood, LGAs with greater flood project densities show increased flood resilience.
Metadata for each flood resilience indicator are also presented in Table 1.

Table 1.
Metadata for each flood resilience indicator in the study design.
2.3. Index Calculation and Mapping
Data, having been collected, were also presented as 0–1 values for ease of subsequent calculations. This was done by adopting the following equation, or variations of it:
0–1 value = (value of interest) − (lowest value)/(highest value) − (lowest value)
The data in the FReI were then standardised using fuzzy logic methods. This involves a two-step process which makes use of fuzzy membership and fuzzy gamma overlay functions present in ArcMap 10.7 software. Fuzzy membership refers to the weighting of data based on the level of membership assigned to the class that the data is standardised within; specific midpoint and spread values are associated with this process. All indicator datasets were standardised via fuzzy large membership, except for unemployment rate, which required fuzzy small. They were then processed using fuzzy gamma overlay to form the final FReI (Appendix A). Fuzzy gamma overlay is a function which combines different datasets which have already been standardised through fuzzy membership (a general gamma value of 0.9 was used, as this is the industry standard).
3. Results
The FReI values were presented in quintile classes with labels as per Table 2 in accordance with prior literature [28,29].
Table 2.
Breaks assigned to fuzzy values for flood resilience indicator maps as well as the overall index map.
Below are results of the map outputs related to each flood resilience indicator proxy.
The three maps which represent Government Grant, Motor Vehicle Access, and Index of Economic Resources resilience are presented in Figure 3, Figure 4 and Figure 5, respectively.

Figure 3.
Government Grant Resilience after standardising using fuzzy membership processing. Resilience measured from Very Low (light pink) to Very High (dark pink).
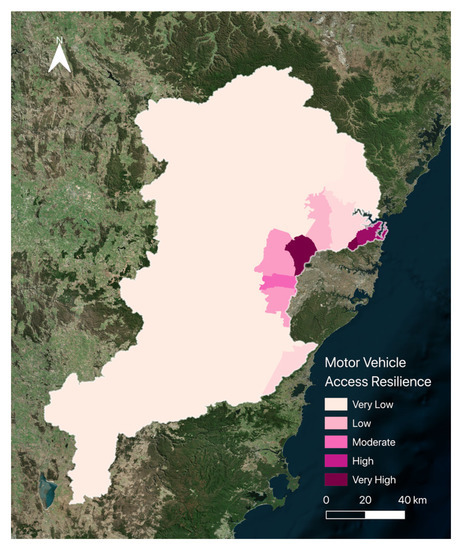
Figure 4.
Motor Vehicle Access Resilience after standardising using fuzzy membership processing. Resilience measured from Very Low (light pink) to Very High (dark pink).
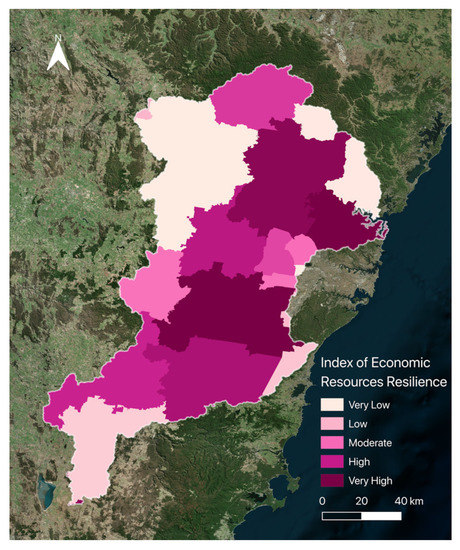
Figure 5.
Map of Index of Economic Resources Resilience after standardising using fuzzy membership processing. Resilience measured from Very Low (light pink) to Very High (dark pink).
Tertiary qualification rate
All LGAs throughout the catchment presented moderate, high, or very high resilience for this indicator. No LGA presented very low or low resilience. There was, again, no clear trend related to LGAs on or near the floodplain showing increased resilience. In a similar manner to the unemployment rate, this indicator provides information on the educated population and how effectively communities can recover and adapt after a flood.
Government grant density
Most LGAs in the catchment presented very low resilience; however, LGAs along the eastern boundaries on or near the floodplain presented higher resilience (low, moderate, high, and very high). Fairfield City Council and Blacktown City Council—both on the floodplain—were the only LGAs with very high resilience. It is important to note that this indicator only scoped general-purpose government grants.
Motor vehicle density
The majority of LGAs in the catchment presented very low resilience. Meanwhile, LGAs along the eastern boundaries on or near the floodplain again presented relatively higher resilience levels (low, moderate, high, and very high). Fairfield City Council, Blacktown City Council, and Ku-ring-gai Council (Ku-ring-gai Council being near the floodplain, to its east) were the only LGAs with very high resilience. This indicator assists the final index because motor vehicle access, for example, can not only reflect a household’s socio-economic status, but can also indicate ease of transport during an emergency situation; this reveals novel insights.
Index of economic resources (IER)
LGAs closer to the floodplain to the east of the catchment presented the highest resilience for the IER indicator. An exception existed in the Fairfield City Council LGA, which presented very low resilience, even though it lies on the floodplain. The IER indicator was of great value to the resilience index because it is an existing SEIFA product, containing already well-established insights and trends.
The three maps which represent Unemployment Rate, Tertiary Qualification, and Community Service Workers resilience are presented in Figure 6, Figure 7 and Figure 8, respectively.
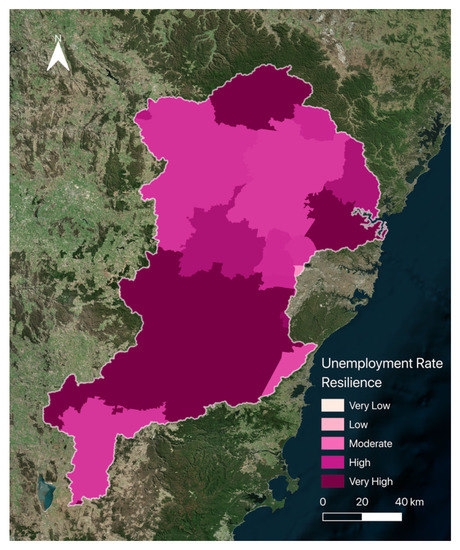
Figure 6.
Unemployment Rate resilience after standardising using fuzzy membership processing. Resilience measured from Very Low (light pink) to Very High (dark pink).
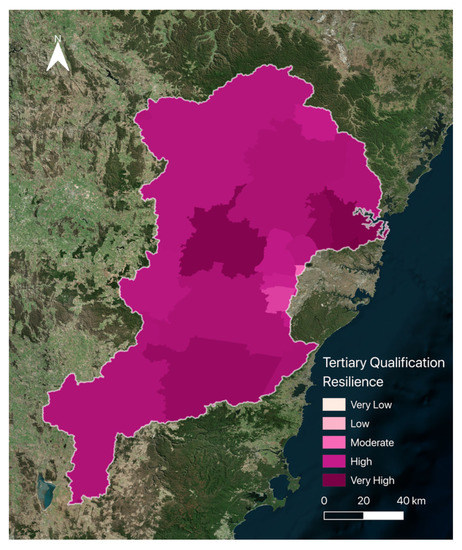
Figure 7.
Tertiary Qualification Resilience after standardising using fuzzy membership processing. Resilience measured from Very Low (light pink) to Very High (dark pink).
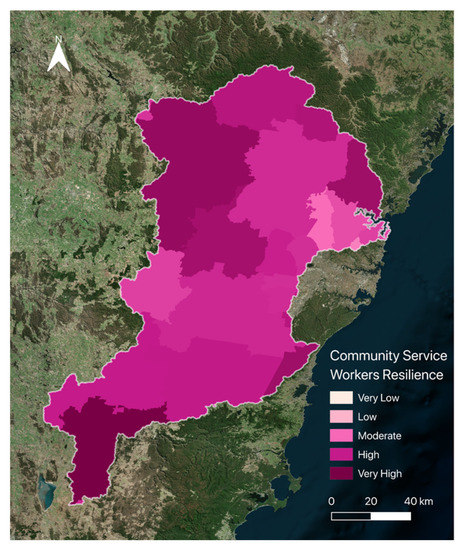
Figure 8.
Community Service Workers Resilience after standardising using fuzzy membership processing. Resilience measured from Very Low (light pink) to Very High (dark pink).
Unemployment rate
Most LGAs throughout the catchment presented moderate, high, or very high resilience for this indicator. An exception existed in the Fairfield City Council LGA, which presented low resilience, even though it exists on the floodplain. No LGA presented very low resilience. There was no clear trend in LGAs on or near the floodplain having relatively high resilience compared to those outside the floodplain. The unemployment rate indicator provides information on the labour force, and, in turn, how economically equipped given communities are to deal with floods.
Community service workers
This output presented significant variation. Most LGAs throughout the catchment presented moderate, high, or very high resilience. Two LGAs presented low resilience: Ku-ring-gai Council and the Hills Shire Council (both not on, but near, the floodplain, to its east). No LGA presented very low resilience. For this indicator, it appeared that there was a trend in LGAs further away from the floodplain having increased resilience. Importantly, this indicator had the capacity to represent those in the community who volunteer and contribute to community capital during flood-related emergency situations.
The three maps which represent Internet Access, Median Income, and Flood Project resilience are presented in Figure 9, Figure 10 and Figure 11, respectively.
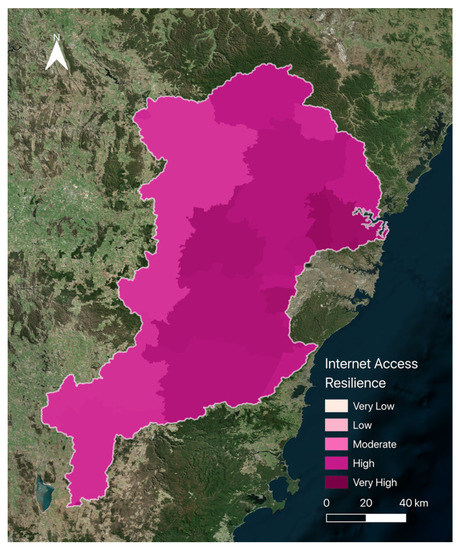
Figure 9.
Internet Access Resilience after standardising using fuzzy membership processing. Resilience measured from Very Low (light pink) to Very High (dark pink).
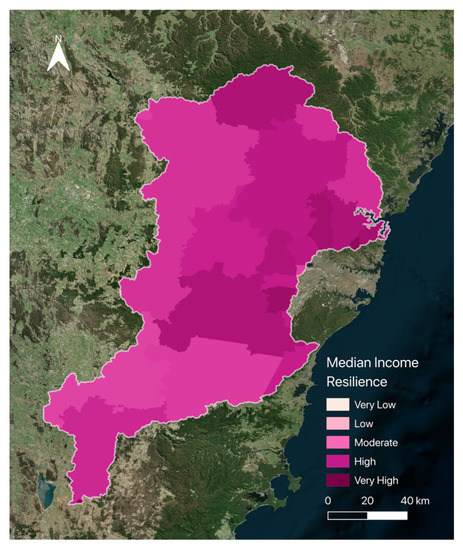
Figure 10.
Median Income Resilience after standardising using fuzzy membership processing. Resilience measured from Very Low (light pink) to Very High (dark pink).
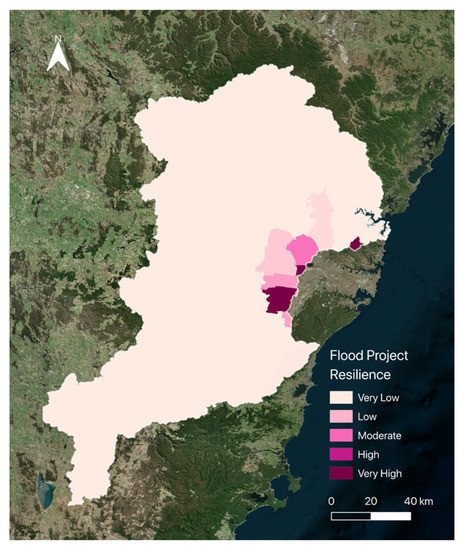
Figure 11.
Flood Project Resilience after standardising using fuzzy membership processing. Resilience measured from Very Low (light pink) to Very High (dark pink).
Internet access
All LGAs throughout the catchment presented moderate, high, or very high resilience for this indicator. No LGA presented very low or low resilience. Once more, LGAs closer to the floodplain to the east appeared to present increased (very high) resilience. Including this indicator in the index was essential because internet access remains a high priority during a flood emergency for knowledge sharing and distribution of key resources.
Median personal income
All LGAs throughout the catchment presented moderate, high, or very high resilience for this indicator. No LGA presented very low or low resilience. One could suggest that LGAs closer to the floodplain presented increased resilience for this indicator; however, trends are not as clear. This indicator was heavily tied to community socio-economic status.
Flood project density
Nearly all LGAs in the catchment outside of the floodplain presented very low resilience for this indicator. LGAs on the floodplain to the east of the catchment presented low, moderate, high, or very high resilience. It appeared that LGAs closer to the Sydney CBD in Greater Western Sydney (GWS) presented the highest resilience. By making use of the NSW SES Flood Data Portal, this manually constructed indicator provided recent and accurate information which positively contributed to the final index.
The final FReI map is presented in Figure 12.
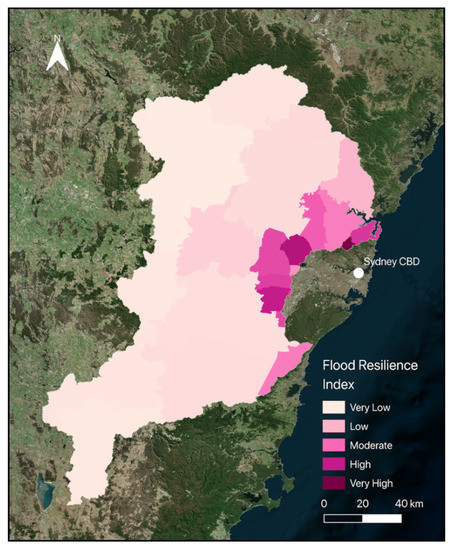
Figure 12.
The Flood Resilience Index for the Hawkesbury-Nepean Catchment. Darker areas indicate greater flood resilience.
4. Discussion
4.1. Indicators
Ultimately, LGAs closer to the urbanised Greater Western Sydney (GWS) region of the HNC saw increased resilience due to greater socio-economic development.
4.1.1. Government Grant Density
Fairfield City Council and Blacktown City Council presented very high resilience, which correlates with significant government grant funding of approximately AUD 7.5 and 13.5 million, respectively (2019 data). Both of these LGAs are located within the GWS and are close to the Sydney CBD, implying that LGAs in the urbanised GWS region receive more funding due to more socio-economic development demand overall.
4.1.2. Motor Vehicle Density
Very high motor vehicle resilience was observed in the Fairfield City Council, Blacktown City Council, and Ku-ring-gai Council LGAs. These LGAs presented motor vehicle density values of approximately 1360, 1012, and 970 registered motor vehicles per kilometre squared (2020 data). These LGAs are again in the urbanised floodplain of the HNC.
4.1.3. Index of Economic Resources and Unemployment Rate
Other than the very high resilience seen throughout LGAs in the GWS, a noticeable finding for these indicators existed in Fairfield City Council, which presented very low resilience for both maps. This LGA possessed an IER score (2016 data) of 943 (with most other surrounding LGAs having approximately 1000). It also had an unemployment rate (2021 data) of approximately 9.3% (with most surrounding LGAs having less than 6.0%). This may imply that Fairfield City Council is relatively less economically developed, regardless of the significant government funding it receives, as -previously mentioned. It is important to note that, for the two previous indicators, a density analysis and the smaller land area for this LGA may have also produced higher values which do not represent true conditions for Fairfield City Council; however, this limitation should be dismissed because a density analysis was the best method to account for differently sized LGAs within the case study area.
4.1.4. Community Service Workers
For this indicator, the Ku-ring-gai Council and the Hills Shire Council LGAs were notable in that they presented very low levels of resilience. These LGAs had community service worker proportions of 7.2% and 7.8%, respectively (relative to the total Estimated Resident Population or ERP within the 2016 dataset). This was low in comparison to values for most other LGAs, which exceeded 10%. This may indicate less social capital for both of these LGAs; this is an interesting insight because it may imply that some LGAs around the urbanised floodplain may be economically developed, but less so socially, in the context of flood resilience (according to the study design).
4.1.5. Flood Project Density
LGAs around the floodplain of the catchment presented relatively high resilience (low to very high) in comparison to others (very low). Although more than half of the LGAs had flood project densities of less than 0.100 flood projects/km2, those around the floodplain possessed significantly greater flood project resilience (for example, 9.022 for the Council of the City of Shellharbour and 7.786 for Ku-ring-gai Council). This is because these LGAs tend to display higher flood impacts, and so are encouraged to develop more robust (or simply more) flood management plans.
4.2. Index
One key finding from the FReI was that the eastern part of the HNC tends to be the most highly affected. It is this region that also sees the highest density of human dwellings and infrastructure [30]. Figure 12 exhibits the highest resilience levels found in the Ku-ring-gai Council LGA. Ku-ring-gai Council is spatially one of the closest LGAs in the catchment to the Sydney CBD. It can therefore be expected that this area would see a higher population relative to that of LGAs which lie further from inner Sydney suburbs, as these inner areas hold some of the highest population density in the state [31,32]. Closer to the Sydney CBD, and more specifically the eastern coast, the relative disadvantage of LGAs tends to decrease [33]. This is reaffirmed by economic resilience indicators which give an insight into the ability for communities to cope and recover from flood events. In Figure 12, areas within approximately 40 km of the Sydney CBD tend to contain LGAs that have compounding high IER, motor vehicle density, accessible internet, high median income, and low unemployment rates. This correlates highly with population density in this area, and is a trend that can be seen in many Australian capital city areas [34].
In contrast, areas that are considered more rural, and farther from the metropolitan area of the Sydney CBD, display low to very low values for resilience. These areas include those which are largely composed of national and state park terrain, such as the Blue Mountains. LGAs that exhibit the lowest resilience values comprise the majority of the FReI map, and are situated mainly to the west of the Sydney CBD. These low resilience values are largely a result of the relatively low population density in these areas, which is especially true for the lowest value, found in Lithgow City Council, which has a population of 20,854 (compared with Ku-ring-gai Council with a population of 124,659). In communities with smaller populations, the flood exposure levels of residents and infrastructure tend to be lower [30]. Therefore, one can see low resilience levels in these areas, as they need little to no capacity to cope or recover from a flood hazard.
Additionally, as highlighted by Munawar et al. [35], the growing population of Sydney and its outer suburbs is a cause for concern when assessing community flood hazard resilience. This is because many of these data have the potential to be skewed by population density, which is forecast to increase within the low-lying areas of the HNC [35]. This becomes more concerning within areas that experience fewer socio-economic advantages. A particular area of concern lies in the LGA of Fairfield City Council. This area showed low resilience levels, despite it being within 40 km of the Sydney CBD. This is partially influenced by its relative disadvantage [33]. Fairfield has an IRSD score of 857, which is 14.3% below the average score for Australia (1000) [36]. This relative disadvantage is highlighted in some of the flood resilience indicators, such as IER, tertiary qualification rate, and unemployment rate. These indicators represented the lowest resilience values for Fairfield City Council, resulting in low resilience in the final index.
Data that is relevant to flood resilience that were able to be accessed for the Flood Resilience Index were heavily skewed by land area or ERP for any given LGA. The flood resilience indicators that were chosen introduced different constraints to the study, depending on how these indicators were standardised. For example, the government grants indicator was standardised by land area, which meant that smaller LGAs presented higher resilience due to having their respective grant values divided by smaller land areas when calculating government grant density. However, at first, this indicator was standardised by ERP, meaning that LGAs with higher ERPs presented lower flood resilience because their grant values were divided by higher ERPs when calculating government grant density. Thus, one can see that there is an added element of subjectivity that can result in skew either way. Therefore, it is important to present such indicators in the most accurate way possible, in order to reflect true conditions for the study area based on data selection supported by strong evidence. Doing so makes the FReI more robust, and, in turn, replicable.
4.3. Future Research Opportunities
For future work, further flood-specific and HNC-specific resilience indicators should be chosen for the FReI. Doing so also takes advantage of, rather than being limited by, subjectivity in analysis. Practically, this would result in indicators chosen for the flood resilience index being more relevant to unique conditions within the HNC, thus producing a better understanding of the flood resilience of this catchment in particular. As some examples, tailored flood resilience indicators may include, but are not limited to:
- Radius of dam protection area (describing which communities are more resilient post-flood hazard events due to the presence of dams)
- Ratio between dam height and inundation extent (such as flood water depth)
- Location of mitigation infrastructure (such as dams, levees, barrages, causeways, cuttings, and embankments)
- Evacuation capacity as a first response to flood resilience. Studies such as Yazdani et al. [37] reveal the importance of integrated approaches to these responses.
Indicators within the FReI should also equally consider coping and adaptive capacities (most indicators in the ANDRI, for example, focus on coping capacity, with very few considering adaptive capacity). This is because, as mentioned, ‘building back better’ after a flood hazard ensures that the same destruction, harm, and cost is not experienced, were a similar flood to occur in the future. Other examples of adaptive capacity-tailored indicators could relate to rehousing or migration rates, for example. Adaptive capacity is already beginning to be investigated more in the relevant literature. For example, a recent study by Elrick-Barr et al. [38], which investigates adaptive capacity in the context of resilient urban development in the presence of natural hazards [38], suggests different ‘generations’ of adaptive capacity.
Importantly, future research may consider multiple perspectives on resilience, rather than the predominantly socio-economic perspective that this study assumes. For example, an alternative such as psychological resilience in the context of inland rainfall or riverine flooding in the HNC, and the psychological indicators that would accompany them, would reveal new and valuable insights. Studies such as Nel et al., 2014 [39] and Linka et al., 2018 [40] also provide novel insights such as ‘hardening’ the landscape, for example through ecosystem-based management, in order to improve resilience over time.
Finally, it should be noted that the Flood Resilience Index can be incorporated into, and considered alongside, established flood risk indices such as those constructed by [30,33]. Considering both flood resilience and risk indices is important for a temporally robust flood management understanding in the HNC. For example, the work of [41] considered the outcome of incorporating the Flood Resilience Index into a Flood Risk Index, essentially subtracting flood resilience from risk to examine the areas that are most at risk. A similar implementation could be considered for this resilience index, which has the potential to improve the understanding of flood risk and resilience in a given study area.
5. Conclusions
The aim of this study was to create and map a scalable and replicable proof-of-concept Flood Resilience Index for New South Wales’s Hawkesbury-Nepean Catchment (HNC). Indicators chosen for the Flood Resilience Index were based on resilience proxies presented in previous studies, which focus not only on coping capacity but also on adaptive capacity. Although the flood resilience indicators used for this study suggest that the HNC is generally resilient, recent destructive events such as the March 2021 and 2022 flood events demonstrate the need for further resilience measures in Australia.
This study demonstrates a novel simplistic method that is unseen in the Australian FRA landscape. The index also demonstrates novelty by accounting for resilience in a larger calculation of risk. It is hoped that both the methodology and key findings of this research can be applied elsewhere in Australia and abroad, so that relevant stakeholders can prioritise those communities at highest risk from more frequent and intense flood occurrences. This study presents a contribution to the discussion of flood mitigation and adaptation in Australia, and can be used as a framework for further index-based flood assessment approaches.
Logical next steps for the Flood Resilience Index involve considering indicators more specific to flood hazard events while also emphasising adaptive capacity. A validity assessment for the index can also be employed to increase the accuracy of the methodology and in turnkey findings.
Author Contributions
Conceptualisation, I.S., M.Z., M.K., AW. and Y.K.; methodology, I.S., M.Z. and Y.K.; software, I.S. and M.Z.; validation, I.S. and M.Z.; formal analysis, I.S. and M.Z.; investigation, I.S. and M.Z.; resources, Y.K.; data curation, I.S. and M.Z.; writing—original draft preparation, I.S. and M.Z.; writing—review and editing, I.S., M.Z. and Y.K.; visualization, I.S. and M.Z.; supervision, A.B.W. and Y.K.; project administration, Y.K.; funding acquisition, Y.K. All authors have read and agreed to the published version of the manuscript.
Funding
This research received no external funding.
Data Availability Statement
Not applicable.
Acknowledgments
The authors express sincere gratitude to colleagues from the Climate Risk and Early Warning Systems (CREWS) team at the Australian Bureau of Meteorology and Monash University for their helpful advice and guidance. Three anonymous reviewers provided valuable comments which helped us to improve quality of the manuscript.
Conflicts of Interest
The authors declare no conflict of interest.
Appendix A. Fuzzy sum and fuzzy product Equations Used in the fuzzy Gamma Overlay Function via ArcMap 10.7 Software
Fuzzy Gamma Overlay mathematical equations used to calculate final drought risk index maps from hazard, vulnerability, and exposure index maps.
The Fuzzy Gamma Overlay function uses the algebraic product of fuzzy SUM and fuzzy PRODUCT effects, both raised to the power of gamma (a generic gamma value of 0.9 was used). Equations 4 and 5 outline the mathematics involved.
μgamma = (μsum)γ × (μproduct) 1−γ,
Table A1.
Fuzzy standardising metadata for the Flood Resilience Index (via ArcMap 10.7 software).
Table A1.
Fuzzy standardising metadata for the Flood Resilience Index (via ArcMap 10.7 software).
| Indicator | Membership Type | Midpoint Value (0–1) | Spread Value |
|---|---|---|---|
| Government grant density | Fuzzy Large | 0.048 | 2 |
| Motor vehicle density | Fuzzy Large | 0.0485 | 2 |
| Index of Economic Resources (IER) | Fuzzy Large | 0.429 | 2 |
| Unemployment rate | Fuzzy Small | 0.505 | 2 |
| Tertiary qualification rate | Fuzzy Large | 0.825 | 2 |
| Community service workers | Fuzzy Large | 0.740 | 2 |
| Internet access | Fuzzy Large | 0.858 | 2 |
| Median personal income | Fuzzy Large | 0.788 | 2 |
| Flood project density | Fuzzy Large | 0.042 | 2 |
References
- Jongman, B. The Fraction of the Global Population at Risk of Floods Is Growing. Nature 2021, 596, 37–38. [Google Scholar] [CrossRef] [PubMed]
- Australian Bureau of Meteorology (BoM). Special Climate Statement 74–Extreme Rainfall and Flooding in Eastern and Central Australia in March 2021; Australian Government Bureau of Meteorology: Melbourne, Australia, 2021. [Google Scholar]
- Bates, P.D.; Quinn, N.; Sampson, C.; Smith, A.; Wing, O.; Sosa, J.; Savage, J.; Olcese, G.; Neal, J.; Schumann, G.; et al. Combined Modeling of US Fluvial, Pluvial, and Coastal Flood Hazard Under Current and Future Climates. Water Resour. Res. 2021, 57, e2020WR028673. [Google Scholar] [CrossRef]
- Davidson, C. The Floods Are Rising and so Are We. Guardian 2022, 1–4. [Google Scholar] [CrossRef]
- McMahon, G.M.; Kiem, A.S. Large Floods in South East Queensland, Australia: Is It Valid to Assume They Occur Randomly? Australas J. Water Resour. 2018, 22, 4–14. [Google Scholar] [CrossRef]
- Suchara, I. The Impact of Floods on the Structure and Functional Processes of Floodplain Ecosystems. J. Soil Plant Biol. 2019, 1, 28–44. [Google Scholar] [CrossRef]
- O’Mara, K.; Olley, J.M.; Fry, B.; Burford, M. Catchment Soils Supply Ammonium to the Coastal Zone—Flood Impacts on Nutrient Flux in Estuaries. Sci. Total Environ. 2019, 654, 583–592. [Google Scholar] [CrossRef]
- Warner, R.F. The Impacts of Flood-Mitigation Structures on Floodplain Ecosystems: A Review of Three Case Studies from Australia and France. Aust. Geogr. 2022, 53, 265–295. [Google Scholar] [CrossRef]
- FitzGerald, G.; Du, W.; Jamal, A.; Clark, M.; Hou, X.-Y. Flood Fatalities in Contemporary Australia (1997–2008). Emerg. Med. Australas 2010, 22, 180–186. [Google Scholar] [CrossRef]
- Insurance Council of Australia. Catastrophe 212: March Floods NSW and SE Queensland; Insurance Council of Australia: Sydney, Australia, 2021. [Google Scholar]
- Evans, J.P.; Boyer-Souchet, I. Local Sea Surface Temperatures Add to Extreme Precipitation in Northeast Australia during La Niña. Geophys. Res. Lett. 2012, 39, L10803. [Google Scholar] [CrossRef]
- Sharma, A.; Wasko, C.; Lettenmaier, D.P. If Precipitation Extremes Are Increasing, Why Aren’t Floods? Water Resour. Res. 2018, 54, 8545–8551. [Google Scholar] [CrossRef]
- Guimarães Nobre, G.; Muis, S.; Veldkamp, T.I.E.; Ward, P.J. Achieving the Reduction of Disaster Risk by Better Predicting Impacts of El Niño and La Niña. Prog. Disaster Sci. 2019, 2, 100022. [Google Scholar] [CrossRef]
- Dey, R.; Lewis, S.C.; Arblaster, J.M.; Abram, N.J. A Review of Past and Projected Changes in Australia’s Rainfall. WIREs Clim. Chang. 2019, 10, e577. [Google Scholar] [CrossRef]
- Giorgi, F.; Im, E.-S.; Coppola, E.; Diffenbaugh, N.S.; Gao, X.J.; Mariotti, L.; Shi, Y. Higher Hydroclimatic Intensity with Global Warming. J. Clim. 2011, 24, 5309–5324. [Google Scholar] [CrossRef]
- Allan, R.P.; Barlow, M.; Byrne, M.P.; Cherchi, A.; Douville, H.; Fowler, H.J.; Gan, T.Y.; Pendergrass, A.G.; Rosenfeld, D.; Swann, A.L.S.; et al. Advances in Understanding Large-Scale Responses of the Water Cycle to Climate Change. Ann. N. Y. Acad. Sci. 2020, 1472, 49–75. [Google Scholar] [CrossRef]
- State of NSW and Department of Planning and Environment. Flood Impact and Risk Assessment Flood Risk Management Guide LU0; State of NSW and Department of Planning and Environment: Parramatta, NSW, Australia, 2022; p. 30. [Google Scholar]
- Australian Institute for Disaster Resilience (AIDR). Australian Disaster Resilience Guideline; Australian Institute for Disaster Resilience (AIDR): East Melbourne, VIC, Australia, 2017; pp. 1–30. [Google Scholar]
- Chen, I.-H. New Conceptual Framework for Flood Risk Assessment in Sheffield, UK. Geogr. Res. 2021, 59, 465–482. [Google Scholar] [CrossRef]
- Intergovernmental Panel on Climate Change (IPCC). Summary for Policymakers in Climate Change 2022: Impacts, Adaptation and Vulnerability; IPCC: Geneva, Switzerland, 2022. [Google Scholar]
- Gourbesville, P.; Batica, J. Flood Resilience Index—Methodology And Application. In Proceedings of the 11th International Conference on Hydroinformatics HIC 2014, New York, NY, USA, 17–21 August 2014. [Google Scholar]
- Chen, K.-F.; Leandro, J. A Conceptual Time-Varying Flood Resilience Index for Urban Areas: Munich City. Water 2019, 11, 830. [Google Scholar] [CrossRef]
- Sen, M.K.; Dutta, S.; Kabir, G. Modelling and Quantification of Time-Varying Flood Resilience for Housing Infrastructure Using Dynamic Bayesian Network. J. Clean. Prod. 2022, 361, 132266. [Google Scholar] [CrossRef]
- Batica, J.; Gourbesville, P. From Catstrophe to Resilience. In Advances in Hydroinformatics; Springer: Berlin, Germany, 2020; pp. 121–133. ISBN 9789811554353. [Google Scholar]
- Infrastructure New South Wales (NSW). Flooding in the Hawkesbury Nepean Valley; Infrastructure New South Wales: Sydney, NSW, Australia, 2018. [Google Scholar]
- New South Wales (NSW) Government. NSW Flood Inquiry, Volume One: Summary Report; New South Wales (NSW) Government: Sydney, Australia, 2022. [Google Scholar]
- NSW Government State Emergency Service. NSW Flood Data Portal. Available online: https://flooddata.ses.nsw.gov.au (accessed on 10 September 2022).
- Rezende, O.M.; Miranda, F.M.; Haddad, A.N.; Miguez, M.G. A Framework to Evaluate Urban Flood Resilience of Design Alternatives for Flood Defence Considering Future Adverse Scenarios. Water 2019, 11, 1485. [Google Scholar] [CrossRef]
- Scherzer, S.; Lujala, P.; Rød, J.K. A Community Resilience Index for Norway: An Adaptation of the Baseline Resilience Indicators for Communities (BRIC). Int. J. Disaster Risk Reduct. 2019, 36, 101107. [Google Scholar] [CrossRef]
- Ziegelaar, M.; Kuleshov, Y. Flood Exposure Assessment and Mapping: A Case Study for Australia’s Hawkesbury-Nepean Catchment. Hydrology 2022, 9, 193. [Google Scholar] [CrossRef]
- Rickwood, P.; Glazebrook, G.; Searle, G. Urban Structure and Energy—A Review. Urban Policy Res. 2008, 26, 57–81. [Google Scholar] [CrossRef]
- SoE Map Viewer. Available online: https://webmap.environment.nsw.gov.au/PlanningHtml5Viewer/?viewer=SoE.View&map=1.3 (accessed on 5 October 2022).
- Schwarz, I.; Kuleshov, Y. Flood Vulnerability Assessment and Mapping: A Case Study for Australia’s Hawkesbury-Nepean Catchment. Remote Sens. 2022, 14, 4894. [Google Scholar] [CrossRef]
- Australian Bureau of Statistics. Census of Population and Housing Destination Zones, August 2016. Available online: https://www.abs.gov.au/statistics/people/population/census-population-and-housing-destination-zones/latest-release (accessed on 5 October 2022).
- Munawar, H.S.; Mojtahedi, M.; Hammad, A.W.A.; Ostwald, M.J.; Waller, S.T. An AI/ML-Based Strategy for Disaster Response and Evacuation of Victims in Aged Care Facilities in the Hawkesbury-Nepean Valley: A Perspective. Buildings 2022, 12, 80. [Google Scholar] [CrossRef]
- Australian Bureau of Statistics. Socio-Economic Indexes for Areas (SEIFA). 2016. Available online: https://www.abs.gov.au/AUSSTATS/abs@.nsf/Lookup/2033.0.55.001Main+Features12016?OpenDocument (accessed on 16 June 2022).
- Yazdani, M.; Mojtahedi, M.; Loosemore, M.; Sanderson, D.; Dixit, V. An integrated decision model for managing hospital evacuation in response to an extreme flood event: A case study of the Hawkesbury-Nepean River, NSW, Australia. Saf. Sci. 2022, 155, 105867. [Google Scholar] [CrossRef]
- Elrick-Barr, C.E.; Plummer, R.; Smith, T.F. Third-Generation Adaptive Capacity Assessment for Climate-Resilient Development. Clim. Dev. 2022, 1–4. [Google Scholar] [CrossRef]
- Nel, J.L.; Maitre, D.C.L.; Nel, D.C.; Reyers, B.; Archibald, S.; van Wilgen, B.W.; Forsyth, G.G.; Theron, A.K.; O’Farrell, P.J.; Kahinda, J.-M.M.; et al. Natural Hazards in a Changing World: A Case for Ecosystem-Based Management. PLoS ONE 2014, 9, e95942. [Google Scholar] [CrossRef]
- Links, J.M.; Schwartz, B.S.; Lin, S.; Kanarek, N.; Mitrani-Reiser, J.; Sell, T.K.; Watson, C.R.; Ward, D.; Slemp, C.; Burhans, R.; et al. COPEWELL: A Conceptual Framework and System Dynamics Model for Predicting Community Functioning and Resilience After Disasters. Disaster Med. Public Health Prep. 2018, 12, 127–137. [Google Scholar] [CrossRef]
- Ahmed, N.; Hoque, M.A.-A.; Howlader, N.; Pradhan, B. Flood Risk Assessment: Role of Mitigation Capacity in Spatial Flood Risk Mapping. Geocarto Int. 2021, 1–23. [Google Scholar] [CrossRef]
Disclaimer/Publisher’s Note: The statements, opinions and data contained in all publications are solely those of the individual author(s) and contributor(s) and not of MDPI and/or the editor(s). MDPI and/or the editor(s) disclaim responsibility for any injury to people or property resulting from any ideas, methods, instructions or products referred to in the content. |
© 2023 by the authors. Licensee MDPI, Basel, Switzerland. This article is an open access article distributed under the terms and conditions of the Creative Commons Attribution (CC BY) license (https://creativecommons.org/licenses/by/4.0/).