Article

Compound Extremes of Air Temperature and Precipitation in Eastern Europe

Institute of Natural and Technical Systems, 299011 Sevastopol, Russia
*
Author to whom correspondence should be addressed.
Climate 2022, 10(9), 133; https://doi.org/10.3390/cli10090133
Submission received: 21 July 2022 / Revised: 22 August 2022 / Accepted: 1 September 2022 / Published: 5 September 2022
(This article belongs to the Special Issue Natural Disasters and Extreme Hazards under Changing Climate)

Abstract

:
The spatial distribution of compound extremes of air temperature and precipitation was studied over the territory of Eastern Europe for the period 1950–2018. Using daily data on air temperature and precipitation, we calculated the frequency and trends of the four indices—cold/dry (CD), cold/wet (CW), warm/dry (WD) and warm/wet (WW). The connection between these indices and large-scale patterns in the ocean–atmosphere system, such as the North Atlantic Oscillation (NAO), the East Atlantic (EA) and Scandinavia (SCAND) patterns, was also studied. The positive and statistically significant trends in the region were observed for the warm extremes (especially the WW index) in all seasons, with maximum values in the winter season, while negative trends were obtained for the cold extremes. The NAO index has a strong positive and statistically significant correlation with the warm compound indices (WD and WW) in the northern part of Eastern Europe in winter like the EA pattern, but with smaller values. The spatial distribution of the correlation coefficients between compound extremes and the SCAND index in the winter season is opposite to the correlation coefficients with the NAO index.

1. Introduction

Simultaneous or consecutive occurrences of several extreme phenomena (events) in climatology are referred to as compound extreme events. Over the last decade, these events have been attracting the attention of the scientific community due to their increased impacts on nature and society [1,2,3,4,5,6]. Extreme precipitation and temperature values, which are two of the key variables in climatology and hydrology, are multidimensional phenomena, and they can occur at different synoptic periods (e.g., blocking anticyclones with droughts and heatwaves) [7,8]. Changes in temperature and precipitation are often physically linked; for example, droughts and heatwaves in 2003 and 2015 in Europe, in 2010 in Russia, and 2012–2014 in California. These events featured extreme temperature and precipitation (the lack of thereof) that resulted in significant casualties and economic effects [9,10,11,12,13]. In a changing climate, a change in the frequency of compound extremes is likely if the component of the extreme has a tendency; for example, an increase in surface air temperature can lead to an increase in compound extremes including it [14].
Extreme temperature and precipitation are considered independently using one-dimensional statistical methods [15,16,17,18,19]. There are several approaches to the analysis of compound extremes [20]. The statistical methods include the following [20]: empirical, multivariate distribution [21,22], indicator approach [23], quantile regression [24], and Markov chain model [25]. The empirical approach to the analysis of compound extremes is manifested in the calculation of the number of simultaneous or consecutive occurrences of several extremes. Beniston [26] suggested using the combination of air temperature and precipitation values exceeding the set thresholds (the 25th and 75th percentiles) in the empirical analysis of compound extremes. The joint distribution of the two weather variables like the temperature and precipitation is a rational indicator of weather conditions and their stability [27,28]. Compound distributions reflect weather conditions better than the statistics for the temperature or precipitation alone [4,28]. The study of compound extremes using this technique was carried out for many regions, such as North America [29,30,31], China [32], India [33], some parts of Europe (Spanish mountains, Serbia, central Europe) [34,35,36,37], Australia [38] and on the global scale [39].
Air temperature and precipitation variability and their extremes in the European region are affected by interannual large-scale circulation patterns in the ocean–atmosphere system, such as the North Atlantic Oscillation (NAO) [40], the East Atlantic pattern (EA) [41,42], the Scandinavia pattern (SCAND) [41,43], and the East Atlantic/West Russia pattern (EA/WR) [41]. The impacts of these patterns were covered by many researchers from different regions of the world [44,45]. Analysis of the influence of the large-scale circulation patterns on compound extremes was carried out for the regions of Switzerland [27], the highlands of the Mediterranean basin [46], and China [32,47]. Understanding the frequency of occurrence and possible causes of compound extremes will allow developing strategies to reduce their dangerous impact on society and ecosystems.
The goal of this work is to analyze the compound extremes of air temperature and precipitation in Eastern Europe for the period 1950–2018, as well as studying the connection between these indices and large-scale patterns in the ocean–atmosphere system.

2. Materials and Methods

2.1. Climatic Characteristics of the Study Region

The study region (Figure 1) includes the large part of Eastern Europe (25–45° E, 42–61° N).
The region is characterized by a variety of climatic conditions. In the north of the European part of Russia, the continental climate prevails. Marine air masses cause mild winters with frequent thaws and moderately warm, sometimes cool summers. The average temperature in January is −8… −11 °C; in July, +16… +19 °C. The amount of precipitation per year is 600–700 mm. To the south, there is an increase in the average air temperature and a decrease in the amount of precipitation. The climate of the Central Federal District of Russia is temperate continental, the average temperature in January is from −7 to −14 °C; in July—from +16 to +22 °C. Precipitation falls 500–600 mm per year. The rainiest time is the end of summer and autumn [48].
The territory of the south of the European part of Russia can be conditionally divided into three parts: flat, foothill and mountainous. They differ in their topography, climate, soil and vegetation. In most of this area, the climate is temperate continental. In this regard, the climate is characterized by warm and long summers—the average July temperature ranges from +20 °C to +24 °C. The average January temperature ranges from −5 °C to −2 °C. The average annual precipitation decreases from 400 to 600 mm in the west to 200–400 mm in the east [49,50].
The subtropical type of climate is characteristic of the Black Sea coast of the Caucasus. The spurs of the Caucasus Mountains protect the coast from the penetration of cold air masses from the East European Plain in winter. The average January temperature in this area is positive. Summer is warm and long. The average temperature in July is between +22 °C and +26 °C. The climate of the coast is both warm and humid. On average, the total precipitation is about 800 mm, which is a relatively even distribution throughout the year [51].
The western coast of the Black Sea (the territory of the countries of Bulgaria, Romania and Moldova) is one of the driest in Eastern Europe, with a total precipitation below 300 mm per year in some areas, especially at the confluence of the Danube into the Black Sea [52]. Annual rainfall reaches 700 mm per year in the south of the region. Average monthly air temperatures throughout the year are predominantly positive, especially in the south, with maximums up to +24 °C in July or August and minimums in January (–2 °C to +2 °C) [53].
Ukraine is characterized by noticeable climatic differences across the country. The territory of Ukraine is located in the temperate continental climate zone. The average temperature of the coldest month (January) is negative (from −7.5 °C to −2 °C), the average temperature in July ranges from +17.5 °C to +22 °C [49]. Precipitation is unevenly distributed, large amounts fall in the west (the region of the Carpathian Mountains with precipitation up to 1600 mm per year) and north (700–750 mm per year), in smaller quantities—in the east and southeast (300–350 mm per year). Winters vary from cool along the Black Sea to cold in the interior of the country, summers are warm in most of the country and hot in the south [54].
The climate of Latvia and Estonia is maritime and humid, with cool summers and moderate winters [55]. The average annual air temperature in Latvia ranges from +4.9 to +7.1 °C for the period 1961–2010, which is due to the influence of continentality and remoteness from the Baltic Sea. The average annual rainfall varies from 576 to 757 mm. The least amount of precipitation occurs in the spring, and the most in the summer [56]. The average annual temperature in Estonia is 6.4 °C, and the average precipitation is about 667 mm per year [57]. Lithuania is characterized by a transitional climate from maritime to continental, with humid and temperate summers and winters [58].
Belarus is characterized by a temperate continental climate with cold winters and cool, rainy summers. The average air temperature ranges from +6.4 °C in the northeast to +7.7 °C in the southwest. The average January temperature is around –4 °C, and the average July temperature is around +19 °C. The average annual rainfall range is 600–750 mm. About 70% of precipitation falls during the warm season [59].

2.2. Data and Methods

In this work, we used the data on daily average surface (2 m) air temperature and precipitation amounts over the period of 1950–2018 in Eastern Europe. The data were taken from the reanalysis E-obs 20.0 (with a spatial resolution of 0.25° × 0.25°) [60]. This dataset is based on observations from over 20,000 meteorological stations across Europe. The data availability maps showed enough data at the grid nodes (more than 80%) over the period 1950–2018.
To characterize compound extremes, combined air temperature and precipitation indices were used [26]. The cold/wet (CW) index was calculated as a combination of the number of days with the average temperature below the 25th percentile (T25) and the daily precipitation amount higher than the 75th percentile (R75) at the same time. The same procedures were applied to calculate other indices, such as the cold/dry days (CD—T25/R25), warm/dry days (WD—T75/R25), and warm/wet days (WW—T75/R75). We use 25th and 75th percentiles to identify a large number of compound extreme events for air temperature and precipitation [26]. These percentiles characterize moderate extremes.
The threshold values for air temperature and precipitation were calculated based on daily data for each of the seasons over the base climate period of 1961–1990 at each node of the regular grid. The precipitation percentiles were determined from daily data. Precipitation time series have used precipitation values above 1 mm. The compound temperature and precipitation extreme were identified if the specific extremes occurred on the same day in 1950–2018. After that, the total number of such coincidences per month/season/year was counted. Calculations were performed for all seasons. Winter corresponds to January and February of the current year, and December of the previous year. The results are presented for each reanalysis point in the form of raster maps without spatial interpolation.
To analyze the correlations between the compound extreme indices and circulation patterns, the North Atlantic Oscillation, East Atlantic pattern, and Scandinavia pattern over the period of 1950–2018 were used. The indices were taken from the Climate Explorer website (https://climexp.knmi.nl, access on 8 March 2022).
The values of linear trend coefficients were determined using the least-squares method. The non-parametric Mann–Kendall test was used to obtain the statistical significance of trends (with a significance level of 95%). The Pearson’s correlation coefficient was calculated, and its statistical significance using Student’s criterion (95% significance) was obtained between compound extremes indices and circulation patterns.

3. Results

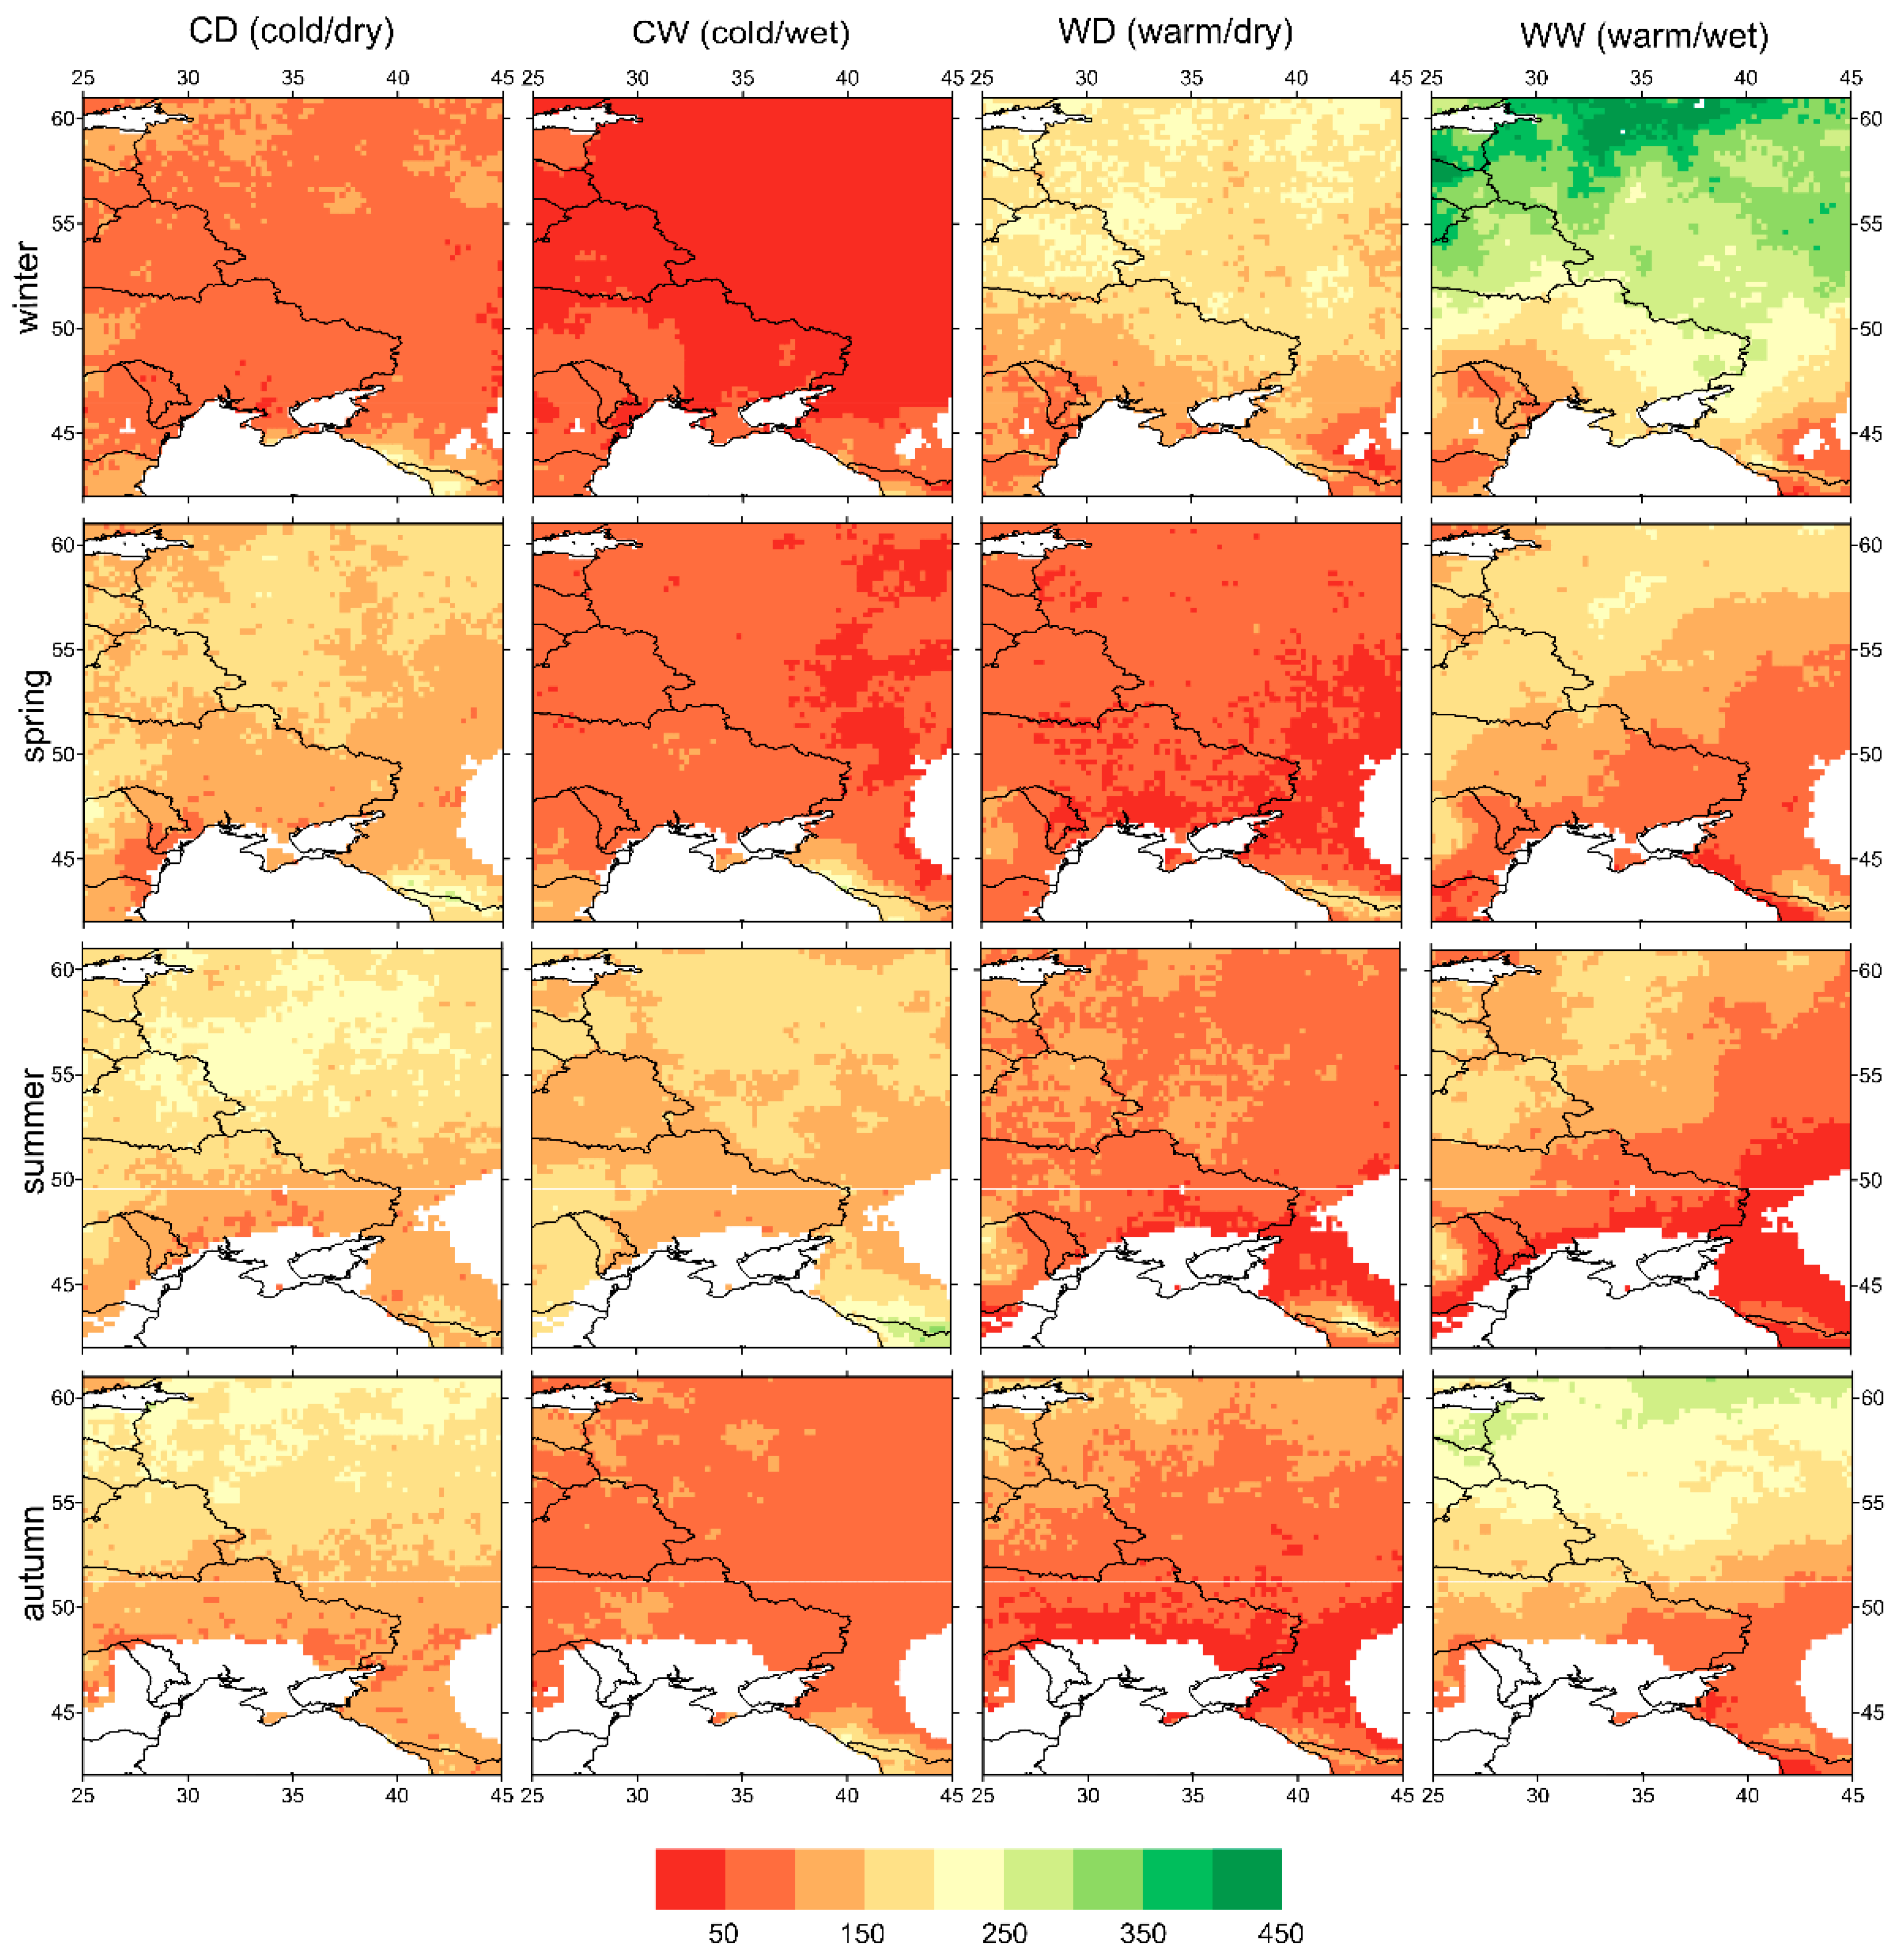
3.1. Frequency of Compound Indices

The total number of days with index CD in winter for most of the region is in the interval 50–100 with an increase of up to 150 days for the entire study period in the north of the region and on the western coast of the Black Sea (Figure 2). An increase of the compound extreme index is noticeable in high-mountainous regions—the Carpathians, and the Crimean and Caucasian mountains (up to 250 days). The CW (cold/wet) combination occurred up to 50–100 days for the whole period. The compound WD index above 50 latitude reaches 250 days. The WW index has the highest values in the winter season; in the north of the region, its values reach 450 days for the period 1950–2018.
The number of days with the compound air temperature and precipitation extremes in spring is lower than in winter. The total number of days with indices CD and WW reach 200–250 days in the northern regions of the study region. At the same time, the CW and WD indices have values no higher than 100 days, with the exception of the Caucasus Mountains region, where an increase of up to 250 days is observed.
In the summer season, the greatest number of days is typical for the cold-dry combination (index CD) in the northern regions, where the sum of days reaches 250 days. The CW index in most of the study region is in the interval of 100–200 days, an increase of compound extremes is observed in the region of the Caucasus Range (up to 300 days). The sum of days with the WD index for the most of the region does not exceed 150 days with an increase to 250 in the highlands of the Carpathians and the Caucasus. The WW index increases from southeast to northwest from 50 to 200 days over the period 1950–2018.
The distribution of the CD index in the autumn season is similar to that in the summer season. The sum of days of the CW index does not exceed 100 days per season throughout the region, with a slight increase on the Black Sea coast of the Caucasus (up to 250 days). The number of days with the CW index increases in a northerly direction and reaches 200 days. The sum of the WW index also increases northward, but with larger values relative to the CW index. In the northern regions, the number of days with warm and wet conditions reaches 300 days.
Zhou and Liu [47] showed that correlations between temperature and precipitation (positive or negative) have a direct impact on the likelihood of compound climate events occurring: the stronger the correlation, the higher the probability of a compound extreme. Therefore, we built correlation maps of monthly air temperature and precipitation in all seasons (Figure 3). In winter, the positive statistically significant correlation is typical to the south of European Russia (excluding the North Caucasus), the southeast regions of Ukraine and all of the region to the north of the 52 degrees latitude. While negative statistically significant correlation between the air temperature and precipitation rates can be observed on the western coast of the Black Sea (in Romania, Ukraine, and Moldova). In spring, the entire region is characterized by a positive (significant) relationship between air temperature and precipitation throughout the region, except for a narrow strip of negative correlations on the eastern coast of the Black Sea. The summer season is characterized by a statistically significant negative correlation between air temperature and precipitation throughout the region, with maximum values in the southeast (correlation coefficient reaches −0.8). The correlation coefficients in the autumn have the lowest values. Negative statistically significant correlations were found on the entire coast of the Black Sea, and positive ones—in the north of the region. Our results are consistent with those obtained by Trenberth and Shea [61]: a strong negative correlation between the monthly average temperature and the precipitation rates over continents in the summer in both of the hemispheres and opposite in winter. This means that areas with high positive correlations tend towards cold/dry or warm/wet conditions, and vice versa, negative correlations lead to the dominance of compound dry/warm or wet/cold extremes [32]. In our case, high positive correlations between temperature and precipitation explain the more frequent WW index on the northern part of the region in the winter season, and the bigger sum of days of CD and WW indices in spring and autumn seasons (Figure 2).
At the same time, for the summer, we obtained a strong negative correlation for the entire region, however, in this regard, the large values of indices combining warm/dry or cold/wet conditions were not detected. An increase in the frequency of the index CW is observed on the Black Sea coast of the Caucasus and in the region of the Caucasus Range, which corresponds to the area with the maximum correlation coefficients between air temperature and precipitation. Such a relationship may be explained by several physically different mechanisms: changes in cloud cover or changes in precipitation and the consequent changes in the heat balance of the region. The reason for this phenomenon remains to be elucidated.

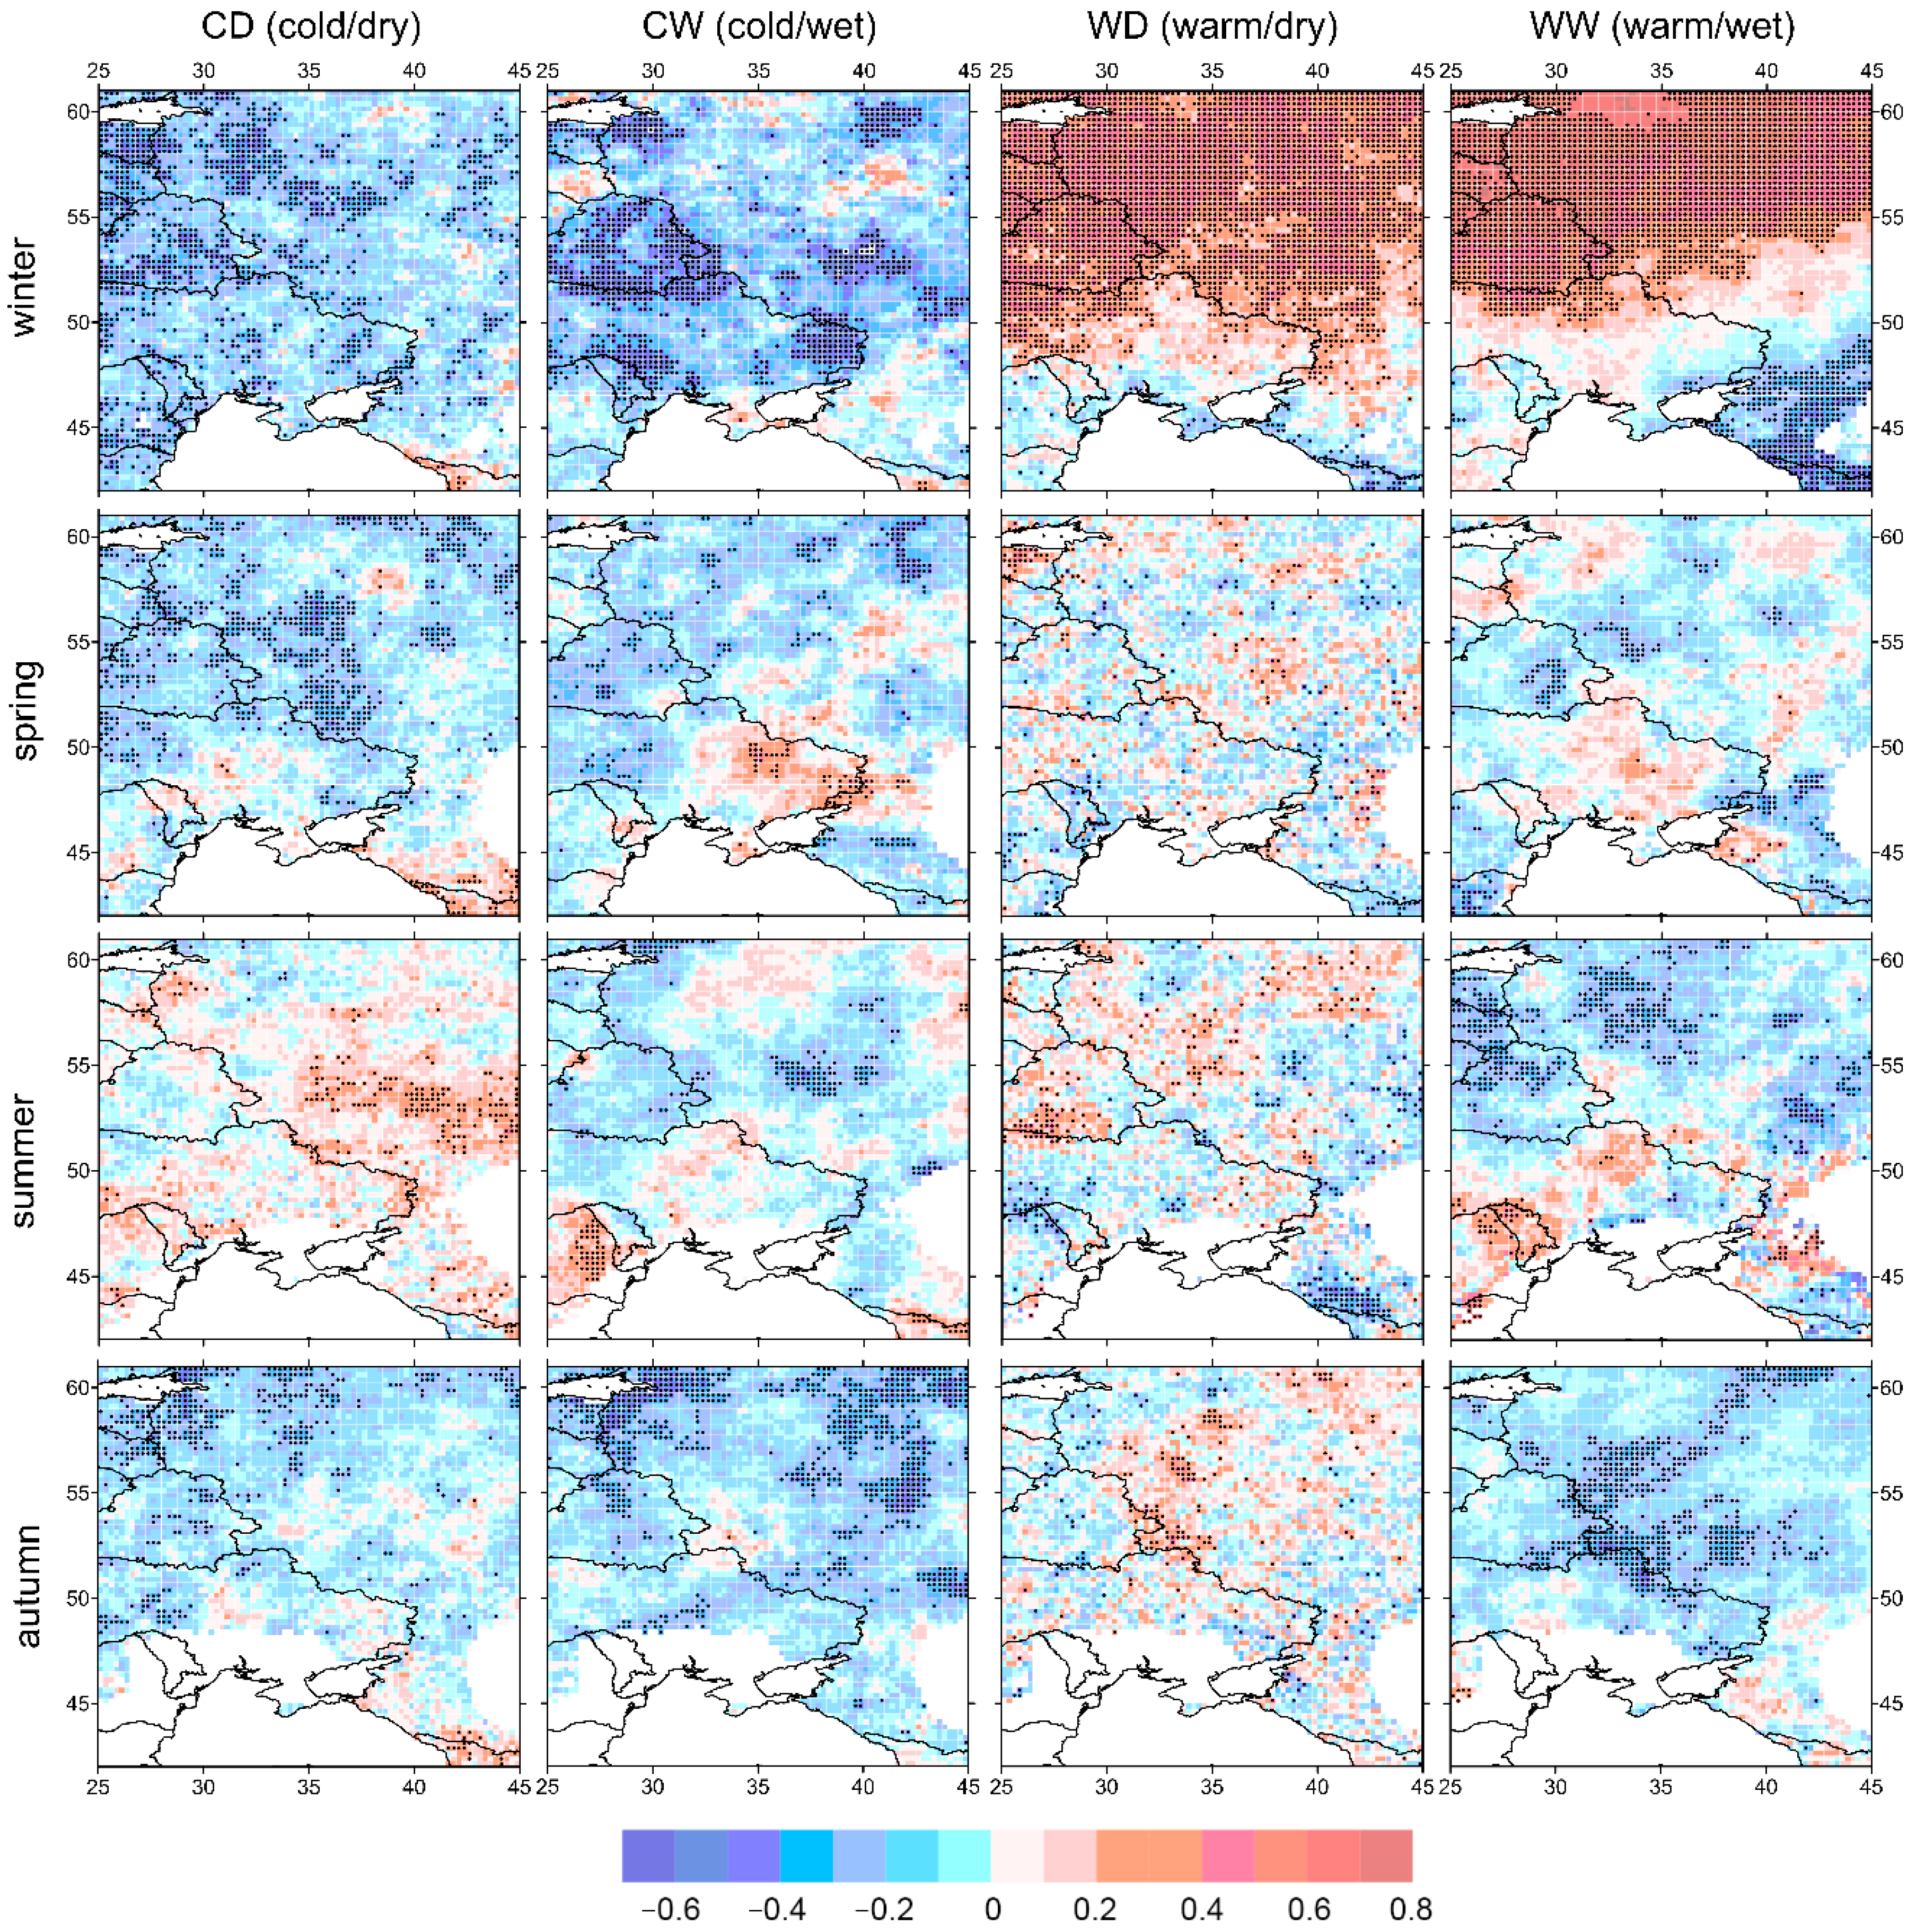
3.2. The Compound Extreme Indices Trends

The features that are characteristic of indices rather than seasons are highlighted when analyzing trends in indices of compound extremes (Figure 4). Thus, the CD index, which includes temperature and precipitation below the 25th percentile, is characterized by predominantly negative trends throughout the study region in all seasons. The area of a statistically significant decrease in the number of days with this index is located in the southeast of the region in all seasons, and for summer—throughout the region.
The distribution of the trend coefficients of the CW index is mixed. It is necessary to single out the region of the Caucasus Range, where there is a negative statistically significant trend in the number of days with the index in all seasons. In the summer season, negative values of the coefficients of the linear trend prevail. The WD index is also characterized by a mixed spatial distribution of the linear trend coefficients, but with a predominance of positive values. In the summer season, the western part of the region has a statistically significant increase in the number of days with compound index WD.
The index, which includes temperature and precipitation above the 75th percentile, i.e., warm and wet conditions (WW), shows positive trends throughout the region in all seasons. The trend is the largest and reaches 1 day/10 years in the north of the region in the winter season. The statistically significant areas of increasing the number of days with WW index are located in the central part of the region. In the transitional seasons (spring and autumn), and in the summer season—throughout the region.
Based on the analysis of linear trends, it can be concluded that there is a general trend towards an increase in the frequency of warm extremes and a decrease in the frequency of cold ones. The increase in air temperature has led to an increase in warm extremes in other regions of Europe [34,35,52,62,63,64], in other countries [32], and around the globe [65]. Studies differ in time period, threshold values for determining extremes, and initial data, but they all show similar results.

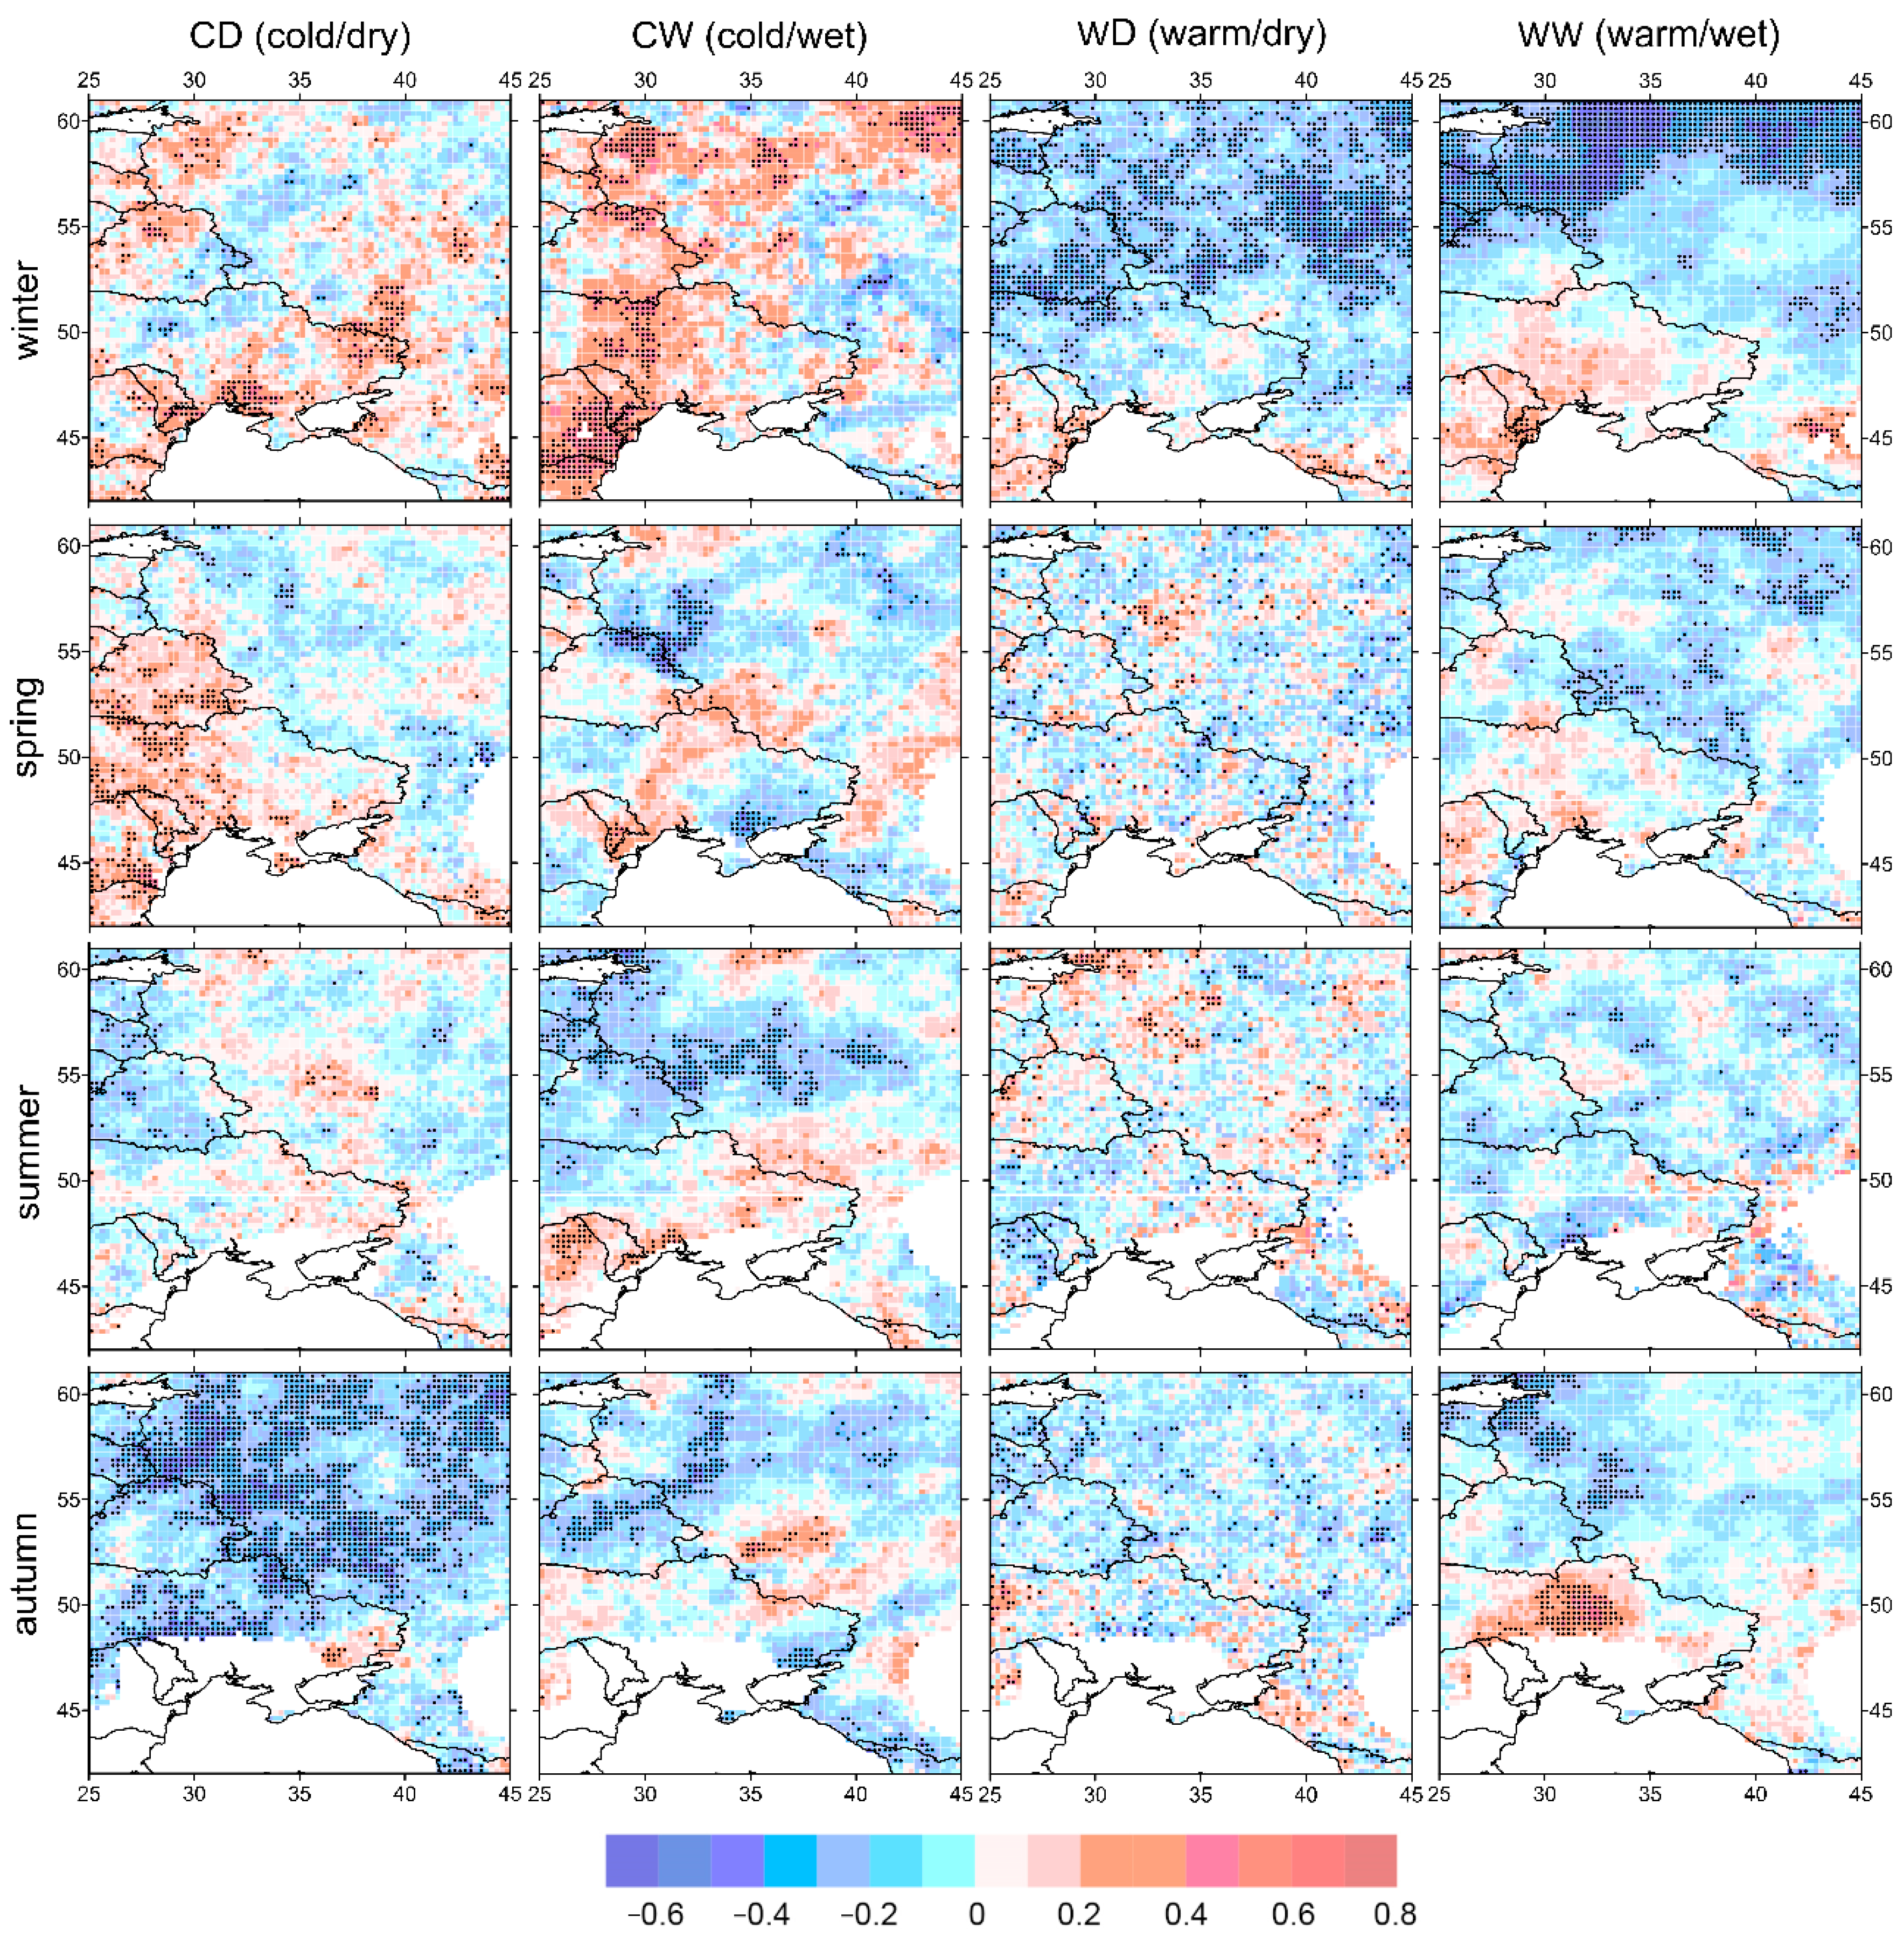
3.3. Correlation of Compound Indices and Large-Scale Patterns

The Pearson’s correlation coefficient was calculated between the compound extreme indices and corresponding seasonal signal indices for each season. The NAO phase changes lead to a significant change in the atmospheric circulation in the Atlantic–European region [45,66]. The correlation analysis of the compound extreme indices and the NAO index in winter produced the following results (Figure 5). Negative correlations were found between the NAO index and the “cold” CD and CW indices across the region and the 95% statistically significant indices in Belarus, Eastern Ukraine, and the Black Earth Regions. The warm indices (WD and WW) showed a statistically significant positive correlation (up to +0.8) with the winter NAO index above the 50th parallel. A negative correlation was observed between the WW and the NAO indices in the North Caucasus and the Caucasus ridge (up to –0.8, p < 0.05). In contrast to [46], who found no statistically significant connection with the winter NAO index in the Caucasus Mountains. Apparently, this is due to the use of other data (simulations from 10 global circulation models), a shorter data series (1950–2006) and using the 40th and 60th percentile to highlight the extreme.
In spring, cold indices demonstrate a negative correlation with the NAO index throughout almost the entire region. For the CD index, positive correlation coefficients were observed near the Caucasus, and in eastern Ukraine for the CW index. The compound extreme WW index and the NAO index have a statistically significant correlation in Belarus, Bulgaria, and some parts of Russia.
In summer, the CD index is characterized by a predominantly positive relationship with the summer NAO index. The CW and WW indices have a predominantly negative relationship with the NAO index. For the WW index, it is statistically significant in the north of the study region. In autumn, all indices (except WD) have a negative (with small statistically significant areas) relationship with the NAO index throughout the region.
The distribution of the correlation coefficient between the WD index and the spring, summer and autumn indices of the NAO is characterized by great spatial heterogeneity. The NAO has the greatest impact on Europe, especially in winter [67,68,69], which is associated with changes in cyclone trajectories in the Atlantic–European region [70]. Our results showed the strongest relationship with the NAO in the winter season.
The East Atlantic pattern is the second mode of low frequency variability over the North Atlantic. The anomaly centers of the EA are shifted to the southeast relative to the centers of the NAO [41]. The positive phase of EA is associated with higher average surface temperatures in Europe in all months, above average precipitation in northern Europe and below average in southern Europe [41]. The correlation between the CD index and the winter EA index is negative throughout the region with little statistically significant areas (Figure 6). The CW index features a mainly positive correlation with the EA index above the 50th parallel, while on the Black Sea coast of the Caucasus, the correlation is negative and statistically significant. The warm compound extreme indices (WD and WW) have a positive correlation with the winter EA index throughout almost the entire region. The WW index features a statistically significant correlation in Belarus, the Baltic, and the northern part of European Russia.
The correlation between the CD index and the spring EA index is demonstrate a spatial heterogeneity with predominance of negative correlations. The CW index has a positive correlation with the EA index in the left-bank region of Ukraine and the northeast of the region. Negative correlation coefficients were found in Romania and Moldova. The WW index is characterized by the positive values of the correlation coefficient across the region with statistically significant values on the north.
In summer, the CD index is characterized by a negative correlation with the summer EA index throughout the region of Eastern Europe, and it is statistically significant, with the exception of the eastern part of the region (the Ciscaucasia and the Black Earth region of Russia). The CW index and the EA index have a negative relationship throughout the study region with small areas of statistically significant values. The WD index demonstrates a strong spatial heterogeneity, similar to the distribution of correlation coefficients between the indices of compound extremes and the NAO indices for the spring, summer and autumn seasons. However, the area with a statistically significant positive relationship in the west of the region (right-bank Ukraine, Belarus, Romania, Latvia) should be noted, as well as the Black Sea coast of the Caucasus. The spatial distribution of the correlation coefficients between the WW index and the summer EA index is characterized by positive statistically significant values (up to 0.9) for almost the entire study region, with the exception of the eastern regions of Ukraine and Ciscaucasia.
The spatial distribution of the correlation coefficients between the indices of compound extremes and the EA index in the autumn season is similar to the summer season, but with smaller values of the coefficients.
The Scandinavia pattern (SCAND) is associated with anomalies in heights over Scandinavia and western Russia [41]. During the positive phase of SCAND, temperatures are below average in central Russia and western Europe, and precipitation is above average in central and southern Europe. These positive and negative precipitation anomalies are in good correspondence with intensification and reduced storm-track activity [43]. The correlation between the cold indices of CD and CW and the winter SCAND index is quite heterogeneous (Figure 7). There are areas with a positive statistically significant correlation on the western coast of the Black Sea (Bulgaria, Romania, Moldova, and a part of Ukraine), as well as in the north of the region. The warm indices (WD and WW) feature a largely negative correlation with the winter SCAND index with statistically significant values in the north of the region.
Ukraine, Belarus, as well as the western and eastern coasts of the Black Sea, are characterized by positive correlation coefficients for the spring CD and the spring SCAND indices. A negative statistically significant correlation between the CW index and the spring SCAND index was observed in the southeast of Ukraine, and a positive correlation was observed in central Ukraine. The WW index in the spring season has a predominantly negative correlations throughout the region, but they are predominantly not significant.
The spatial distribution of correlation coefficients in the summer season between the CD and WD indices and the summer SCAND index is characterized by strong spatial heterogeneity. There is a negative statistically significant relationship with the CW index in the north of the region, while in the southern half of the region, it is positive. The relationship between the WW index and the SCAND index in summer is mostly negative, but not significant.
The CD index in the autumn season has a negative statistically significant relationship with the autumn SCAND index throughout the region. The CW and WW indices have a similar structure of the spatial distribution of correlation coefficients: negative values in the north of the region and separate areas with a positive statistically significant relationship (the central part of Ukraine).

4. Discussion

The overall increase in the frequency and intensity of extreme events associated with the air temperature and precipitation requires that this problem should be studied in more detail. Extensive research on the extreme trends in air temperatures and precipitation rates in the study region has been conducted. They include the data on Russia [71,72], Georgia [73], the western coast of the Black Sea [52,74], Ukraine [75], etc. The research works differ in the methods used and the observation period. However, the key outcome of the majority of works is a statistically significant increase in the air temperature and its extreme values, as well as the heterogeneous precipitation values [76].
We conducted a detailed analysis of the frequency and trends of compound extremes, and the connection with the circulation patterns of the territory covering most of Eastern Europe. The positive and statistically significant trends in the region are typical of the combinations with the temperatures above the 75th percentile, i.e., the warm extremes (especially the WW index) in all seasons, with maximum values in the winter season. The negative trends were obtained for the cold extremes, most pronounced for the CD index. The resulting growth trends of warm indices are associated with an increase in the average air temperature over the past decades.
The results obtained correlate with those obtained previously by other researchers. Despite the use of different data, time period and thresholds to identify extremes, studies show a clear increase in the frequency of warm indices and a decrease in cold ones. The compound extremes in European countries and regions show that the warm combinations (warm/dry and warm/wet) are growing, while the cold combinations are decreasing [26,34,62]. The observations and ERA5 reanalysis data demonstrate that the 95th percentile precipitation increases against the growth of temperatures in winter all over Russia [71]. The global research [39] based on the CRU data also showed the increase in WD and WW extremes in Russia in the second half of the 20th century. The comparison of compound extremes produced using the CRU data and CMIP5 project models showed correlation, which allows for the further use of the CMIP project results for global climate modeling to assess any possible changes in compound extremes in the future. According to the IPCC experts, the frequency and intensity of extremes associated with air temperature and precipitation will increase in the future [77]. The analysis performed using various models and scenarios for the European regions [78,79] and for the whole world [65] confirms this claim.
The increase in the occurrence rates of the extremes combining high temperature and a lack of precipitation may result in droughts similar to the weather conditions observed in Russia and Central Europe in 2010, 2015, and 2021. Such conditions may provoke forest fires [5] and aggravate their effects, e.g., the smog and air pollution. Positive trends for the WW combination can be attributed to the intensification of cyclonic activity and consequently lead to heavy rains and floods. These may include the flood in Krymsk (Krasnodar Krai) of 2015 when 2–5 monthly rainfall fell over a short period, the flooding of the cities on the Black Sea coast of the Caucasus and the east of the Crimean Peninsula in 2021, and the 2021 floods in Germany. This kind of research remains vital and requires further efforts due to the ongoing climate changes.
We used the NAO, EA, and SCAND indices as circulation patterns. According to various authors, they impact the air temperatures and precipitation in Eastern Europe [80,81,82,83]. The analysis of the impacts of the large-scale processes in the oceans–atmosphere system showed that the NAO index has a strong positive and statistically significant correlation with the warm compound indices (WD and WW) in the northern part of Eastern Europe in winter. This is consistent with the above statement about the greatest NAO influence in the winter season. During a pronounced positive phase of the NAO, above-average air temperatures and precipitation are detected in northern Europe in the winter season [41]. The correlation between the WW compound extremes index and the EA index is positive in all seasons, with the highest values in summer. It should be noted that the CD index has a strong negative correlation with the EA index in summer and autumn. The spatial distribution of correlation coefficients between compound extremes and the SCAND index in the winter season is opposite to the NAO index: a negative relationship with warm indices (WD and WW) and a positive relationship with cold ones (CD and CW). The distribution of the correlation coefficient between the WD index and the spring indices of large-scale circulation is characterized by great spatial heterogeneity.
The North Atlantic oscillation and Scandinavia pattern have an impact on the northern regions of Europe, while the southern ones (including Mediterranean) do not show statistically significant results, as shown in another work [62]. The circulation types change and storm-track activities shift during various signal phases, which impacts the occurrence and distribution of compound extremes of air temperatures and precipitation in the Eastern Europe region. Differences in the results of different authors, such as the effect of the winter NAO on the occurrence of compound extremes in the Caucasus, may be due to the use of a different study period, at which the phases of the modes are shifted into a positive or negative phase [45,62].

5. Conclusions

We used the empirical approach to define the compound extremes of the air temperature and precipitation and analyze their spatial and temporal distribution over 1950–2018 in Eastern Europe. We evaluated the frequency and trends of the compound extremes in all seasons. Based on the analysis of linear trends, it can be concluded that there is a general trend towards an increase in the frequency of “warm” extremes (WD and WW indices) and a decrease in the frequency of “cold” ones (CD and CW indices).
We used three signals that affect the structure of air temperature and precipitation in the region (NAO, EA, and SCAND). An analysis to identify the influence of circulation patterns on compound extremes showed that the NAO plays a significant role in the formation of warm extremes in the winter season in the north of the study region, and the situation is reversed for SCAND. The correlation between warm compound extremes and the EA index is positive in all seasons with the highest values in summer.
The changes observed in the occurrence and frequency of compound extremes are affecting and shall continue affecting various areas of life including healthcare, agriculture, transportation, infrastructure, power industry, etc. Since the region is distinguished by a variety of climatic conditions, the results obtained on the trends of joint extremes can be both positive and negative. For example, a decrease in cold extremes in the northern parts of the region may have a beneficial effect on some areas of the economy, such as a northward shift in the zone suitable for cultivating certain crops, or a decrease in residential heating costs. At the same time, the increase in warm extremes in the south of the region is rather negative due to the increase in aridity in an already insufficiently humid region.
The work can be continued with the study of the influence of other circulation patterns, as well as their joint influence on the distribution of compound extremes. The results obtained can be used to develop adaptations to climate changes, compound extremes in particular.

Author Contributions

Conceptualization, E.V. and O.S.; methodology, O.S.; formal analysis, O.S.; investigation, E.V. and O.S.; data curation, O.S.; writing—original draft preparation, E.V.; writing—review and editing, E.V. and O.S.; visualization, E.V.; supervision, E.V. All authors have read and agreed to the published version of the manuscript.

Funding

The study was supported by state assignment of Institute of natural and technical systems (Project Reg. No. 121122300072-3).

Data Availability Statement

The initial time series of daily data of the average air temperature, precipitation and circulation patterns indices are on the website Climate Explorer (European Climate Assessment & Dataset) https://climexp.knmi.nl/start.cgi (accessed on 8 March 2022).

Acknowledgments

The authors are grateful to the anonymous reviewers for the remarks and comments which led to improve the paper.

Conflicts of Interest

The authors declare no conflict of interest.

References

  1. Beniston, M.; Stephenson, D.B.; Christensen, O.B.; Ferro, C.A.T.; Frei, C.; Goyette, S.; Halsnaes, K.; Holt, T.; Jylhä, K.; Koffi, B.; et al. Future extreme events in European climate: An exploration of regional climate model projections. Clim. Chang. 2007, 81, 71–95. [Google Scholar] [CrossRef]
  2. Seneviratne, S.I.; Nicholls, N.; Easterling, D.; Goodess, C.M.; Kanae, S.; Kossin, J.; Luo, Y.; Marengo, J.; McInnes, K.; Rahimi, M.; et al. Changes in climate extremes and their impacts on the natural physical environment. In Managing the Risks of Extreme Events and Disasters to Advance Climate Change Adaptation; A Special Report of Working Groups I And II of the Intergovernmental Panel on Climate Change (IPCC); Field, C.B., Barros, V., Stocker, T.F., Eds.; Cambridge University Press: Cambridge, UK, 2012; pp. 109–230. [Google Scholar]
  3. Trenberth, K.E.; Dai, A.; van der Schrier, G.; Jones, P.D.; Barichivich, J.; Briffa, K.R.; Sheffield, J. Global warming and changes in drought. Nat. Clim. Chang. 2014, 4, 17–22. [Google Scholar] [CrossRef]
  4. Zscheischler, J.; Westra, S.; van den Hurk, B.J.J.M.; Seneviratne, S.I.; Ward, P.J.; Pitman, A.; AghaKouchak, A.; Bresch, D.N.; Leonard, M.; Wahl, T.; et al. Future climate risk from compound events. Nat. Clim. Chang. 2018, 8, 469–477. [Google Scholar] [CrossRef]
  5. AghaKouchak, A.; Chiang, F.; Huning, L.S.; Love, C.A.; Mallakpour, I.; Mazdiyasni, O.; Moftakhari, H.; Papalexiou, S.M.; Ragno, E.; Sadegh, M. Climate Extremes and Compound Hazards in a Warming World. Annu. Rev. Earth Planet Sci. 2020, 48, 519–548. [Google Scholar] [CrossRef]
  6. Haqiqi, I.; Grogan, D.S.; Hertel, T.W.; Schlenker, W. Quantifying the impacts of compound extremes on agriculture. Hydrol. Earth Syst. Sci. 2021, 25, 551–564. [Google Scholar] [CrossRef]
  7. Röthlisberger, M.; Martius, O. Quantifying the local effect of northern hemisphere atmospheric blocks on the persistence of summer hot and dry spells. Geophys. Res. Lett. 2019, 46, 10101–10111. [Google Scholar] [CrossRef]
  8. Zscheischler, J.; Martius, O.; Westra, S.; Bevacqua, E.; Raymond, C.; Horton, R.M.; van den Hurk, B.; AghaKouchak, A.; Jézéquel, A.; Mahecha, M.D.; et al. A typology of compound weather and climate events. Nat. Rev. Earth Environ. 2020, 1, 333–347. [Google Scholar] [CrossRef]
  9. Fink, A.H.; Brucher, T.; Kruger, A.; Leckebusch, G.C.; Pinto, J.G.; Ulbrich, U. The 2003 European summer heatwaves and drought—synoptic diagnosis and impacts. Weather 2004, 59, 209–216. [Google Scholar] [CrossRef]
  10. Barriopedro, D.; Fischer, E.M.; Luterbacher, J.; Trigo, R.M.; García-Herrera, R. The hot summer of 2010: Redrawing the temperature record map of Europe. Science 2011, 332, 220–224. [Google Scholar] [CrossRef]
  11. Trenberth, K.E.; Fasullo, J.T. Climate extremes and climate change: The Russian heat wave and other climate extremes of 2010. J. Geophys. Res. Atmos. 2012, 117, D17103. [Google Scholar] [CrossRef]
  12. Diffenbaugh, N.S.; Swain, D.L.; Touma, D. Anthropogenic warming has increased drought risk in California. Proc. Natl. Acad. Sci. USA 2015, 112, 3931–3936. [Google Scholar] [CrossRef]
  13. Horton, R.M.; Mankin, J.S.; Lesk, C.; Coffel, E.; Raymond, C. A review of recent advances in research on extreme heat events. Curr. Clim. Chang. Rep. 2016, 2, 242–259. [Google Scholar] [CrossRef]
  14. Kopp, R.; Easterling, D.R.; Hall, T.; Hayhoe, K.; Horton, R.; Kunkel, K.; LeGrande, A. Potential surprises—Compound extremes and tipping elements. In Climate Science Special Report: A Sustained Assessment Activity of the U.S. Global Change Research Program; Wuebbles, D.J., Fahey, D.W., Hibbard, K.A., Dokken, D.J., Stewart, B.C., Maycock, T.K., Eds.; U.S. Global Change Research Program: Washington, DC, USA, 2017; pp. 608–635. [Google Scholar]
  15. Cooley, D.; Nychka, D.; Naveau, P. Bayesian spatial modeling of extreme precipitation return levels. J. Am. Stat. Assoc. 2007, 102, 824–840. [Google Scholar] [CrossRef]
  16. Katz, R. Statistics of extremes in climate change. Clim. Chang. 2010, 100, 71–76. [Google Scholar] [CrossRef]
  17. AghaKouchak, A.; Nasrollahi, N. Semi-parametric and parametric inference of extreme value models for rainfall data. Water Resour. Manag. 2010, 24, 1229–1249. [Google Scholar] [CrossRef]
  18. Zhang, X.; Alexander, L.; Hegerl, G.C.; Jones, P.; Klein Tank, A.; Peterson, T.C.; Trewin, B.; Zwiers, F.W. Indices for monitoring changes in extremes based on daily temperature and precipitation data. WiRes-Clim. Chang. 2011, 2, 851–870. [Google Scholar] [CrossRef]
  19. Alexander, L.V. Global observed long-term changes in temperature and precipitation extremes: A review of progress and limitations in IPCC assessments and beyond. Weather Clim. Extrem. 2016, 11, 4–16. [Google Scholar] [CrossRef]
  20. Hao, Z.; Singh, V.P.; Hao, F. Compound Extremes in Hydroclimatology: A Review. Water 2018, 10, 718. [Google Scholar] [CrossRef]
  21. Schöelzel, C.; Friederichs, P. Multivariate non-normally distributed random variables in climate research–introduction to the copula approach. Nonlinear Process Geophys. 2008, 15, 761–772. [Google Scholar] [CrossRef]
  22. Estrella, N.; Menzel, A. Recent and future climate extremes arising from changes to the bivariate distribution of temperature and precipitation in Bavaria, Germany. Int. J. Climatol. 2013, 33, 1687–1695. [Google Scholar] [CrossRef]
  23. Gallant, A.J.; Karoly, D.J.; Gleason, K.L. Consistent trends in a modified climate extremes index in the United States, Europe, and Australia. J. Clim. 2014, 27, 1379–1394. [Google Scholar] [CrossRef]
  24. Quesada, B.; Vautard, R.; Yiou, P.; Hirschi, M.; Seneviratne, S.I. Asymmetric European summer heat predictability from wet and dry southern winters and springs. Nat. Clim. Chang. 2012, 2, 736–741. [Google Scholar] [CrossRef]
  25. Shaby, B.A.; Reich, B.J.; Cooley, D.; Kaufman, C.G. A Markova-switching model for heat waves. Ann. Appl. Stat. 2016, 10, 74–93. [Google Scholar] [CrossRef]
  26. Beniston, M. Trends in joint quantiles of temperature and precipitation in Europe since 1901 and projected for 2100. Geophys. Res. Lett. 2009, 36, L07707. [Google Scholar] [CrossRef]
  27. Beniston, M.; Goyette, S. Changes in variability and persistence of climate in Switzerland; exploring 20th century observations and 21st century simulations. Glob. Planet Chang. 2007, 57, 1–15. [Google Scholar] [CrossRef]
  28. Beniston, M.; Uhlmann, B.; Goyette, S.; Lopez-Moreno, J.I. Will snow-abundant winters still exist in the Swiss Alps in an enhanced greenhouse climate? Int. J. Climatol. 2011, 31, 1257–1263. [Google Scholar] [CrossRef]
  29. Tencer, B.; Weaver, A.; Zwiers, F. Joint Occurrence of Daily Temperature and Precipitation Extreme Events over Canada. J. Appl. Meteor. Climatol. 2014, 53, 2148–2162. [Google Scholar] [CrossRef]
  30. Martin, J.-P.; Germain, D. Large-scale teleconnection patterns and synoptic climatology of major snow-avalanche winters in the Presidential Range (New Hampshire, USA). Int. J. Climatol. 2017, 37, 109–123. [Google Scholar] [CrossRef]
  31. Hao, Z.; Hao, F.; Singh, V.P.; Xia, Y.; Shi, C.; Zhang, X. A multivariate approach for statistical assessments of compound extremes. J. Hydrol. 2018, 565, 87–94. [Google Scholar] [CrossRef]
  32. Wu, X.; Hao, Z.; Hao, F.; Zhang, X. Variations of compound precipitation and temperature extremes in China during 1961–2014. Sci. Total Environ. 2019, 663, 731–737. [Google Scholar] [CrossRef] [PubMed]
  33. Dash, S.; Maity, R. Revealing alarming changes in spatial coverage of joint hot and wet extremes across Indian. Sci. Rep. 2021, 11, 18031. [Google Scholar] [CrossRef]
  34. Morán-Tejeda, E.; Herrera, S.; López-Moreno, J.I.; Revuelto, J.; Lehmann, A.; Beniston, M. Evolution and frequency (1970–2007) of combined temperature–precipitation modes in the Spanish mountains and sensitivity of snow cover. Reg. Environ. Chang. 2013, 13, 873–885. [Google Scholar] [CrossRef]
  35. Arsenovic, P.; Tosic, I.; Unkasevic, M. Trends in combined climate indices in Serbia from 1961 to 2010. Meteorol. Atmos. Phys. 2015, 127, 489–498. [Google Scholar] [CrossRef]
  36. Malinovic-Milicevic, S.; Radovanovic, M.M.; Stanojevic, G.; Milovanovic, B. Recent changes in Serbian climate extreme indices from 1961 to 2010. Theor. Appl. Climatol. 2016, 124, 1089–1098. [Google Scholar] [CrossRef]
  37. Sedlmeier, K.; Feldmann, H.; Schädler, G. Compound summer temperature and precipitation extremes over central Europe. Theor. Appl. Climatol. 2018, 131, 1493–1501. [Google Scholar] [CrossRef]
  38. Gallant, A.J.E.; Karoly, D.J. A combined climate extremes index for the Australian region. J. Clim. 2010, 23, 6153–6165. [Google Scholar] [CrossRef]
  39. Hao, Z.; AghaKouchak, A.; Phillips, T.J. Changes in concurrent monthly precipitation and temperature extremes. Environ. Res. Lett. 2013, 8, 034014. [Google Scholar] [CrossRef]
  40. Hurrell, J.W.; Deser, C. North Atlantic climate variability: The role of the North Atlantic Oscillation. J. Mar. Syst. 2010, 79, 231–244. [Google Scholar] [CrossRef]
  41. Barnston, A.G.; Livezey, R.E. Classification, seasonality and persistence of low-frequency atmospheric circulation patterns. Mon. Weather. Rev. 1987, 115, 1083–1126. [Google Scholar] [CrossRef]
  42. Moore, G.W.K.; Renfrew, I.A. Cold European winters: Interplay between the NAO and the East Atlantic mode. Atmos. Sci. Lett. 2012, 13, 1–8. [Google Scholar] [CrossRef]
  43. Bueh, C.; Nakamura, H. Scandinavian pattern and its climatic impact. Q. J. R. Meteorol. Soc. 2007, 133, 2117–2131. [Google Scholar] [CrossRef]
  44. Nesterov, E.S. East Atlantic oscillation of the atmospheric circulation. Russ. Meteorol. Hydrol. 2009, 34, 794–800. [Google Scholar] [CrossRef]
  45. Mellado-Cano, J.; Barriopedro, D.; García-Herrera, R.; Trigo, R.M.; Hernandez, A. Examining the North Atlantic Oscillation, East Atlantic Pattern, and Jet Variability since 1685. J. Clim. 2019, 32, 6285–6298. [Google Scholar] [CrossRef]
  46. López-Moreno, J.I.; Vicente-Serrano, S.M.; Morán-Tejeda, E.; Lorenzo-Lacruz, J.; Kenawy, A.; Beniston, M. Effects of the North Atlantic Oscillation (NAO) on combined temperature and precipitation winter modes in the Mediterranean mountains: Observed relationships and projections for the 21st century. Glob. Planet. Chang. 2011, 77, 62–76. [Google Scholar] [CrossRef]
  47. Zhou, P.; Liu, Z. Likelihood of concurrent climate extremes and variations over China. Environ. Res. Lett. 2018, 13, 094023. [Google Scholar] [CrossRef]
  48. Chernokulsky, A.; Kozlov, F.; Zolina, O.; Bulygina, O.; Mokhov, I.; Semenov, V. Observed changes in convective and stratiform precipitation in Northern Eurasia over the last five decades. Environ. Res. Lett. 2019, 14, 045001. [Google Scholar] [CrossRef]
  49. Vyshkvarkova, E.; Voskresenskaya, E.; Martin-Vide, J. Spatial distribution of the daily precipitation concentration index in Southern Russia. Atmos. Res. 2018, 203, 36–43. [Google Scholar] [CrossRef]
  50. Aleshina, M.A.; Toropov, P.A.; Semenov, V.A. Temperature and humidity regime changes on the Black sea coast in 1982-2014. Russ. Meteorol. Hydrol. 2018, 43, 235–244. [Google Scholar] [CrossRef]
  51. Grinevetsky, S.R.; Zonn, I.S.; Zhiltsov, S.S.; Kosarev, A.N.; Kostianoy, A.G. The Black Sea Encyclopedia; Springer: Berlin/Heidelberg, Germany; 889p. [CrossRef]
  52. Croitoru, A.-E.; Chiotoroiu, B.-C.; Ivanova Todorova, V.; Torică, V. Changes in precipitation extremes on the Black Sea Western Coast. Glob. Planet. Chang. 2013, 102, 10–19. [Google Scholar] [CrossRef]
  53. Corobov, R.; Sheridan, S.; Overcenco, A.; Terinte, N. Air temperature trends and extremes in Chisinau (Moldova) as evidence of climate change. Clim. Res. 2010, 42, 247–256. [Google Scholar] [CrossRef]
  54. Didovets, I.; Krysanova, V.; Hattermann, F.F.; del Rocío Rivas Lopez, M.; Snizhko, S.; Schmied, H.M. Climate change impact on water availability of main river basins in Ukraine. J. Hydrol. Reg. Stud. 2020, 32, 100761. [Google Scholar] [CrossRef]
  55. Rutgersson, A.; Jaagus, J.; Schenk, F.; Stendel, M. Observed changes and variability of atmospheric parameters in the Baltic Sea region during the last 200 years. Clim. Res. 2014, 61, 177–190. [Google Scholar] [CrossRef]
  56. Avotniece, Z.; Aniskevich, S.; Malinovskis, E. Climate Change Scenarios for Latvia; Report Summary; State Ltd. Latvian Environment, Geology and Meteorology Centre: Riga, Latvia, 2017; p. 17. [Google Scholar]
  57. Tõnisson, H.; Suursaar, Ü.; Orviku, K.; Jaagus, J.; Kont, A.; Willis, D.A.; Rivis, R. Changes in coastal processes in relation to changes in large-scale atmospheric circulation, wave parameters and sea levels in Estonia. J. Coast. Res. 2011, 57, 701–705. [Google Scholar]
  58. Bukantis, A.; Rimkus, E. Climate variability and change in Lithuania. Acta Zool. Litu. 2005, 15, 100–104. [Google Scholar] [CrossRef]
  59. Danilovich, I.; Geyer, B. Estimates of current and future climate change in Belarus based on meteorological station data and the EURO-CORDEX-11 dataset. Meteorology Hydrology and Water Management. Res. Oper. Appl. 2021, 9, 1–30. [Google Scholar] [CrossRef]
  60. Haylock, M.R.; Hofstra, N.; Klein Tank, A.M.G.; Klok, E.J.; Jones, P.D.; New, M. A European daily high-resolution gridded data set of surface temperature and precipitation for 1950–2006. J. Geoph. Res. 2008, 113, D20119. [Google Scholar] [CrossRef]
  61. Trenberth, K.; Shea, D.J. Relationships between precipitation and surface temperature. Geophys. Res. Lett. 2005, 32, L14703. [Google Scholar] [CrossRef]
  62. Lemus-Canovas, M. Changes in compound monthly precipitation and temperature extremes and their relationship with teleconnection patterns in the Mediterranean. J. Hydr. 2022, 608, 127580. [Google Scholar] [CrossRef]
  63. Manning, C.; Widmann, M.; Bevacqua, E.; Van Loon, A.F.; Maraun, D.; Vrac, M. Increased probability of compound long-duration dry and hot events in Europe during summer (1950–2013). Environ. Res. Lett. 2019, 14, 094006. [Google Scholar] [CrossRef]
  64. Vogel, J.; Paton, E.; Aich, V.; Bronstert, A. Increasing compound warm spells and droughts in the Mediterranean Basin. Weather. Clim. Extrem. 2021, 32, 100312. [Google Scholar] [CrossRef]
  65. Meng, Y.; Hao, Z.; Feng, S.; Zhang, X.; Hao, F. Increase in compound dry-warm and wet-warm events under global warming in CMIP6 models. Glob. Planet. Chang. 2022, 210, 103773. [Google Scholar] [CrossRef]
  66. Hurrell, J.W.; Kushnir, Y.; Ottersen, G.; Visbeck, M. An overview of the North Atlantic Oscillation: The North Atlantic Oscillation: Climatic significance and environmental impact. Geophys. Monogr. 2003, 134, 1–35. [Google Scholar]
  67. Hurrell, J.W.; van Loon, H. Decadal variations in climate associatedwith the North Atlantic Oscillation. Clim. Chang. 1997, 36, 301–326. [Google Scholar] [CrossRef]
  68. Haylock, M.; Goodess, C. Interannual variability of Europeanextreme winter rainfall and links with mean large-scale circulation. Int. J. Climatol. 2004, 24, 759–776. [Google Scholar] [CrossRef]
  69. Busuioc, A.; Dobrinescu, A.; Birsan, M.-V.; Dumitrescu, A.; Orzan, A. Spatial and temporal variability of climate extremes in Romania and associated large-scale mechanisms. Int. J. Climatol. 2015, 35, 1278–1300. [Google Scholar] [CrossRef]
  70. Riviere, G.; Orlanski, I. Characteristics of the Atlantic storm-track eddy activity and its relation with the North Atlantic Oscillation. J. Atm. Sci. 2007, 64, 241–266. [Google Scholar] [CrossRef]
  71. Aleshina, M.; Semenov, V.A.; Chernokulsky, A. A link between surface air temperature and extreme precipitation over Russia from station and reanalysis data. Environ. Res. Lett. 2021, 16, 105004. [Google Scholar] [CrossRef]
  72. Vyshkvarkova, E. Changes in extreme precipitation over the North Caucasus and the Crimean Peninsula during 1961–2018. Idojaras 2021, 125, 321–336. [Google Scholar] [CrossRef]
  73. Keggenhoff, I.; Elizbarashvili, M.; Amiri-Farahani, A.; King, L. Trends in daily temperature and precipitation extremes over Georgia, 1971–2010. Weather. Clim. Extrem. 2014, 4, 75–85. [Google Scholar] [CrossRef]
  74. Croitoru, A.-E.; Piticar, A.; Burada, D.C. Changes in precipitation extremes in Romania. Quat. Int. 2016, 415, 325–335. [Google Scholar] [CrossRef]
  75. Boychenko, S.; Voloshchuk, V.; Movchan, Y.; Serdjuchenko, N. Features of climate change on Ukraine: Scenarios, consequences for nature and agroecosystems. Adv. Aerosp. Technol. 2016, 4, 96–113. [Google Scholar] [CrossRef]
  76. Cardell, M.F.; Amengual, A.; Romero, R.; Ramis, C. Future extremes of temperature and precipitation in Europe derived from a combination of dynamical and statistical approaches. Int. J. Climatol. 2020, 40, 1–28. [Google Scholar] [CrossRef]
  77. Lee, J.-Y.; Marotzk, J.; Bala, G.; Cao, L.; Corti, S.; Dunne, J.P.; Engelbrecht, F.; Fischer, E.; Fyfe, J.C.; Jones, C.; et al. 2021: Future Global Climate: Scenario-Based Projections and NearTerm Information. In Climate Change 2021: The Physical Science Basis. Contribution of Working Group I to the Sixth Assessment Report of the Intergovernmental Panel on Climate Change; Masson-Delmotte, V.P., Zhai, A., Pirani, S.L., Connors, C., Péan, S., Berger, N., Caud, Y., Chen, L., Goldfarb, M.I., Gomis, M., et al., Eds.; Cambridge University Press: Cambridge, UK; New York, NY, USA; pp. 553–672. [CrossRef]
  78. Khlebnikova, E.I.; Rudakova, Y.L.; Shkolnik, I.M. Changes in precipitation regime over the territory of Russia: Data of regional climate modeling and observations. Rus. Met. Hydrol. 2019, 44, 431–439. [Google Scholar] [CrossRef]
  79. Kjellström, E.; Nikulin, G.; Strandberg, G.; Christensen, O.B.; Jacob, D.; Keuler, K.; Lenderink, G.; van Meijgaard, E.; Schär, C.; Somot, S.; et al. European climate change at global mean temperature increases of 1.5 and 2C above pre-industrial conditions as simulated by the EURO-CORDEX regional climate models. Earth Syst. Dynam. 2018, 9, 459–478. [Google Scholar] [CrossRef]
  80. Cioffi, F.; Lall, U.; Rus, E.; Krishnamurthyd, C.K.B. Space-time structure of extreme precipitation in Europe over the last century. Int. J. Climatol. 2015, 35, 1749–1760. [Google Scholar] [CrossRef]
  81. Zubiate, L.; McDermott, F.; Sweeney, C.; O’Malley, M. Spatial variability in winter NAO–wind speed relationships in western Europe linked to concomitant states of the East Atlantic and Scandinavian patterns. Q. J. RMets 2017, 143, 552–562. [Google Scholar] [CrossRef]
  82. Tsanis, I.; Tapoglou, E. Winter North Atlantic Oscillation impact on European precipitation and drought under climate change. Theor. Appl. Climatol. 2019, 135, 323–330. [Google Scholar] [CrossRef]
  83. Latonin, M.M.; Lobanov, V.A.; Bashmachnikov, I.L. Discontinuities in Wintertime Warming in Northern Europe during 1951–2016. Climate 2020, 8, 80. [Google Scholar] [CrossRef]
Figure 1. The study region (purple rectangle). Numbers correspond to the countries included in the study region: 1—Estonia, 2—Latvia, 3—Lithuania, 4—Belarus, 5—Ukraine, 6—Moldova, 7—Romania, 8—Bulgaria, 9—Georgia, 10—Russia.
Climate 10 00133 g001
Figure 2. The spatial distribution of total number of days with compound air temperature and precipitation extremes over the period 1950–2018.
Climate 10 00133 g002
Figure 3. The spatial distribution of Pearson’s correlation coefficients for the monthly air temperature and precipitation in 1950–2018. Statistically significant correlation coefficients (p < 0.05) are shown as black dots.
Climate 10 00133 g003
Figure 4. The spatial distribution of linear trend coefficients for compound air temperature and precipitation extremes over the period 1950–2018. Statistically significant trends (p < 0.05) are shown as black dots.
Climate 10 00133 g004
Figure 5. The spatial distribution of correlation coefficients for compound extreme indices and the NAO. Statistically significant correlation coefficients (p < 0.05) are shown as black dots.
Climate 10 00133 g005
Figure 6. The spatial distribution of correlation coefficients for compound extreme indices and the EA. Statistically significant correlation coefficients (p < 0.05) are shown as black dots.
Climate 10 00133 g006
Figure 7. The spatial distribution of correlation coefficients for compound extreme indices and the SCAND. Statistically significant correlation coefficients (p < 0.05) are shown as black dots.
Climate 10 00133 g007
Publisher’s Note: MDPI stays neutral with regard to jurisdictional claims in published maps and institutional affiliations.

