Article

Evaluating the Influence of CAM5 Aerosol Configuration on Simulated Tropical Cyclones in the North Atlantic

1
School of Marine and Atmospheric Sciences, State University of New York at Stony Brook, Stony Brook, NY 11794, USA
2
Climate and Global Dynamics Laboratory, National Center for Atmospheric Research, Boulder, CO 80301, USA
3
Lawrence Berkeley National Laboratory, Berkeley, CA 94720, USA
*
Author to whom correspondence should be addressed.
Climate 2022, 10(9), 130; https://doi.org/10.3390/cli10090130
Submission received: 1 July 2022 / Revised: 23 August 2022 / Accepted: 27 August 2022 / Published: 31 August 2022
(This article belongs to the Special Issue Climate and Weather Extremes)

Abstract

:
This study examines the influence of prescribed and prognostic aerosol model configurations on the formation of tropical cyclones (TCs) in the North Atlantic Ocean in Community Atmosphere Model version 5 (CAM5). The impact of aerosol parameterization is examined by investigating storm track density, genesis density, potential intensity, and genesis potential index. This work shows that both CAM5 configurations simulate reduced storm frequency when compared to observations and that differences in TC climatology between the model configurations can be explained by differences in the large-scale environment. The analysis shows that simulation with the prognostic aerosol parameterization scheme reasonably captures the observed interannual variability in tropical cyclones and aerosols (i.e., dust) in the North Atlantic, while simulation with the prescribed configuration (climatology) is less favorable. The correlation between dust and TCs in observations (i.e., reanalysis and satellite datasets) is shown to be negative, and this relationship was also found for the prognostic aerosol configuration despite an overall decrease in the frequency of TCs. This indicates that, to accurately replicate certain aspects of TC interannual variability, the aerosol configuration within CAM5 needs to account for the appropriate dust variability.

1. Introduction

Using high-resolution (i.e., less than 30 km grid spacing) general circulation models (GCMs), tropical cyclones (TCs) can be directly simulated (e.g., Refs. [1,2,3,4,5]). However, biases arise in TC regions of formation, intensity, and size in these high-resolution GCMs for a variety of reasons, including due to model parameterization (e.g., Refs. [6,7,8]) and model dynamical cores [9,10]. Several GCMs have been used to simulate global and regional TCs, with differing results based on tracking schemes and parameterizations, indicating that there is a wide range in the ability to simulate TCs’ frequency and spatial distribution [11]. In recent years, the GCM community has also made strides in aerosol parameterizations (discussed in Section 2), and many modeling centers now include prognostic aerosol configurations for conventional modeling studies, such as those part of the Coupled Model Intercomparison Project (CMIP) [12]. For example, the Earth system models (ESMs) in CMIP include prognostic aerosols in their calculations. These aerosol modeling capabilities are now being used in high-resolution TC-permitting GCM simulations [13,14], offering a potential tool to explore the influences aerosols have on the formation of TCs in the North Atlantic, including the potential impacts of African dust.
Understanding the environmental and climate controls on the formation of tropical cyclones (TCs) in the North Atlantic is of great societal importance given the vulnerability of coastal communities to landfalling TCs. Previous work provides an overview of the typical environmental conditions that favor TC formation, such as warm sea surface temperatures (SSTs), low values of vertical wind shear, moderate mid-level relative humidity, and sufficient relative vorticity [15]. The relative role of individual environmental components on TC formation is less understood; however, genesis potential indices can be used as a proxy for the significance of each environmental component [16,17,18]. In addition, large-scale variations in these ingredients, such as those that occur during El Nino, can modulate storm frequency in the North Atlantic [19,20]. While warmer SSTs will likely cause increased wind speeds in the most intense storms, the exact impact of climate change on these TC-related environmental conditions at the basin scale remains uncertain, particularly as it pertains to the frequency of named TCs [5,8,21,22,23].
Other environmental conditions, such as aerosols, may also have an influence on the formation of TCs, particularly in the North Atlantic [24]. African dust from intense dust outbreaks that occur over the Saharan Desert is transported westward across the North Atlantic. These outbreaks of African dust have implications for the atmosphere in the North Atlantic for a variety of reasons. Previous work has discussed the direct impacts of African dust on radiation, as well as the indirect effect of the dust through affecting ice nuclei [25]. The Saharan air layer (SAL) develops when warm, dry air (often in association with African dust outbreaks) is advected westward across the Atlantic Ocean from the African continent [26]. Dunion and Velden [27] described three ways that the SAL may affect formation of TCs through limiting convection, increasing vertical shear, and stabilization of the atmosphere by aerosol heating. Convection is limited by the SAL due to dry air being ingested by the TC, leading to reduced convective available potential energy. Vertical shear can be increased in the SAL depending on the strength of the mid-level jet. Satellite observations have been used to explore the potential connection between dust and TC development over the North Atlantic. A case study examining two observed tropical depressions has shown that, under high dust and low dust, formation can still occur in the Eastern Atlantic Ocean [28]. However, work has shown that African easterly waves (AEWs) that develop into TCs are about four to five degrees south of AEWs that do not develop into TCs off the coast of Africa in the aerosol-climate model ECHAM6-HAM [29]. This study concluded that this is a result of warmer SSTs southward, less shear, and less dust, allowing for more TCs to form south of the SAL. Evan et al. [30] demonstrated that dust observations over a region west of Africa are negatively correlated with TC activity, and recent high-resolution climate modeling studies have simulated similar negative correlations between dust and TCs [14,31,32]. While Dunion and Velden [27] introduced mechanisms by which the SAL and African dust could inhibit TC formation, other research has proposed different hypotheses for SAL–TC interaction. Braun [33] argues that, even though the SAL is dry and suppresses convection, convection necessary to support TCs may still exist, especially along the southern border of the SAL. Overall, the exact impact of the SAL and African dust on TC activity in the North Atlantic remains an open research question.
Interactions between African dust, AEWs, and the African easterly jet (AEJ) are all important for the formation and development of TCs. Modeling work using Weather Research and Forecasting (WRF) configured with and without Saharan dust for the summer of 2006 has found that African dust impacts the AEJ, causing a stronger core and northward shift, as well as AEW tracks shifting north and propagating further westward [34]. Additional work with WRF showed the AEJ shifted equatorward during linear growth and nonlinear stabilization stages of the AEW life cycle because moist convection was excluded, but the AEJ did have a stronger jet core when including the effects of dust [35]. The use of interactive aerosols in NASA’s Goddard Earth Observing System (GEOS-5) has been shown to provide a better representation of the AEJ when dust is present over the region, as well as more accurate radiative interactions [36,37]. These radiative interactions can have direct effects on TCs as dust can modulate the AEJ in a manner that shifts the intertropical convergence zone and the TC genesis region northward in the MDR [38].
The focus of this study is to examine the potential impact of different model representations of aerosols, and, therefore, African dust, on the North Atlantic environment and TCs in the Community Atmosphere Model (CAM5). The TC resolving ability of the Community Atmosphere Model has been shown in idealized studies at various horizontal resolutions [39], with a grid spacing of approximately 25 km, showing many realistic features of TCs. Similar versions of CAM in more realistic configurations have also been shown to reproduce the theoretical relationship between wind and pressure [40], as well as to reasonably represent TC dynamical structure [41,42,43]. Differences in the simulated environment may lead to differences in the formation and distribution of the TCs in this region. Comparisons will be made between observations and CAM5 simulations of TCs and aerosol distributions and variability, as well as the large-scale environment. The CAM5 simulations use two different aerosol parameterization schemes described in further detail in the next section. The broader goal of this work is to demonstrate that TC-permitting climate models provide a new tool to explore potential interactions between TCs and dust given the incorporation of state-of-the-art aerosol models. Section 2 describes the observational datasets, CAM5, the two aerosol parameterizations, and methodologies used for this study. Section 3 discusses the differences between the two CAM5 simulations described in Section 2, as well as their impact on the formation of TCs. Section 4 provides the study’s conclusions, with some broader discussion.

2. Data and Methodology

2.1. Model Description

The Community Earth System Model (CESM) incorporates global atmosphere, ocean, land, and sea ice components [44]. The atmospheric component of CESM is Community Atmosphere Model version 5 (CAM5) [45]. This study uses the finite volume (FV) dynamical core, which uses a high-order, flux form, mass-conserving transport scheme [46,47]. CAM5 with FV has been used to directly simulate TCs globally at a horizontal resolution of approximately 25 km (e.g., Refs. [4,8,10]), and, in previous work, CAM5 has been run with two different aerosol parameterization configurations. The first configuration uses the Bulk Aerosol Model (BAM) [48] with prescribed aerosol concentrations set to a climatological mean with a seasonal cycle. The AOD in BAM can fluctuate slightly year-to-year due to changes in the large-scale environment (i.e., humidity). The second configuration is the Modal Aerosol Model (MAM), which uses fully prognostic aerosols emissions [49,50]. Early studies with CAM5 at these high-horizontal resolutions used the BAM configuration [4,22] as a more computationally efficient option for such exploratory simulations. More recently, with the continued growth of super computing, high-resolution CAM5 simulations use the MAM setup [10,14], which has typically been utilized in conventional fully coupled CESM simulations (typically performed at lower resolutions) but requires a substantial increase (roughly 65%) in computational resources per simulation. For the remainder of this analysis, these two different CAM5 configurations will be referred to as BAM and MAM. The horizontal resolution of the BAM and MAM runs is approximately 25 km. There are also historical runs from 1980 to 2005; however, this study is focusing on 1982–2005 (24 years; to coincide with available observational aerosol datasets). A shorter ensemble of the BAM configuration will also be utilized to analyze the robustness of interannual variability and correlations. This ensemble subset includes 5 members that are 11 years each (1995–2005) and are created by initial perturbations to the initial condition files.
The simulations discussed here follow the Atmospheric Model Intercomparison Project (AMIP) [51] protocols for sea ice, ozone, surface temperature, and greenhouse gases. The model output contains monthly averaged 3D standard variables, including aerosol optical depth, which will be used to explore the North Atlantic environment. In addition, 2D variables are available at 3 hourly frequencies to detect and track individual TCs, as described in Ref. [3].

2.2. Observational Datasets

Observational data are used as a benchmark for model comparison in this study. The Advanced Very High Resolution Radiometer (AVHRR) Pathfinder Atmospheres-Extended (PATMOS-X) dataset is used to provide observed aerosol optical thickness (AOT) at 630 nm [52]. Throughout this study, AOT and AOD will be used interchangeably, referring to the total amount of aerosols in the atmosphere in a vertical column. A comparison between the full AVHRR dataset (i.e., total AOD) used throughout this analysis and the AVHRR dust dataset (i.e., dust only AOD) [53] suggests that the full AVHRR (which covers a larger domain) is a good proxy for dust distribution in the North Atlantic (not shown). The main focus is on dust aerosols transported off the western coast of Northern Africa over the North Atlantic from 1982 to 2005. Given that the hurricane season for the North Atlantic runs from June through November, seasonal averages for this time period are used for the investigation. Note, 1998 is omitted from the AVHRR dataset due to a temporary gap in satellite observations.
For additional comparison, aerosol and meteorological data are also used from the Modern-Era Retrospective Analysis for Research and Applications version 2 (MERRA-2), reanalysis satellite data [54,55]. MERRA-2 also includes the use of assimilated aerosols [56]. The AEJ is shifted northward and higher in the troposphere with the use of assimilated aerosols, corresponding better to observations [36]. The assimilated aerosols allow for better understanding of the direct radiative effects of African dust, and have been shown to make the environment less favorable for TC development [57]. Finally, the International Best Track Archive for Climate Stewardship (IBTrACS) is used for observed TCs in the North Atlantic each year during the previously mentioned time period [58]. IBTrACS is used over tracking TCs in MERRA-2 as research has shown that, despite improvements in recent years, TCs tracked via reanalysis datasets, such as MERRA-2, underestimate intensity, especially for weaker TCs [59]. In this study, a TC is only included in the analysis if it reaches tropical storm strength (33 knots) to match the wind speed threshold tracking algorithm.

2.3. Methods

Seasonal (June–November) climatologies are calculated for 1982 to 2005 for both the model simulations and observations. These climatologies are computed for the North Atlantic region, defined as 0–60 N and 100–0 W, with the main development region (MDR) defined as 10–20 N and 80–20 W. Pearson correlations are calculated at lag 0 between the observations and simulations, as well as the TC tracks and AOD. This correlation is then tested against a two-sided Student’s t-test to see if a given level (e.g., 95%) significance was exceeded. TC tracks (both observed and modeled) are limited to the hurricane season (June–November) for the analysis.

3. Results

3.1. Tropical Cyclone Climatology

Variations in the simulated climatology occur between both models and observations. The track density, genesis density, potential intensity, and genesis potential index for BAM, MAM, and observations (IBTrACS and MERRA-2) are shown in Figure 1. The densities are calculated based on the lifetime TC track and TC genesis location (first and second rows) within five degrees of a given point per year (as in Ref. [60]). Both models simulate TCs (as shown in Figure 1) in the North Atlantic, and the spatial distributions compare reasonably well to observations, as discussed in previous CAM5 studies [4,22]. Both versions of the model underestimate North Atlantic TC count, 8.96 and 6.25 per year in BAM and MAM, respectively, compared to 11.46 per year from IBTrACS for June–November from 1982 to 2005. The low North Atlantic TC count is also reflected in the track density maps shown in Figure 1. While neither model accurately simulates the number of cyclones, the BAM simulated track density (Figure 1) compares well with IBTrACS, including comparable densities in the eastern portion of the main development region (MDR). MAM also has a similar spatial distribution of TCs to BAM, but the magnitude is smaller when compared to both BAM and IBTrACS.
When comparing genesis density (Figure 1, second row), TC genesis in observations (IBTrACS) is located throughout the MDR and near the United States coastline. BAM and MAM have maximum genesis densities in similar regions, but there is a noticeable reduction in simulated genesis (consistent with the lower number of simulated storm counts) compared to IBTrACS. In particular, the location of simulated BAM and MAM genesis is highly concentrated directly off the coast of West Africa, while IBTrACS extends more evenly throughout the MDR. This is attributed, in part, to the definition of a TC in the detecting algorithm. Note that IBTrACS also has high genesis in the Gulf of Mexico and off the Southeastern coast, which is not well simulated in CAM5 (due to model resolution limitations and storm formation mechanisms in this region), but we focus on the MDR for this study.
The potential intensity (PI) and genesis potential index (GPI) are shown in Figure 1, third and fourth rows. These two metrics are useful in determining the theoretical wind maximum of a TC [61] and the favorable area of development for TC genesis [62] from large-scale environmental conditions. The PI is calculated (using the algorithm from ftp://texmex.mit.edu/pub/emanuel/TCMAX/; dated 23 April 2013) at each grid point for each month of the year. The maximum potential intensity (MPI) is calculated as the average seasonal MPI at each grid point (from the monthly output). The average seasonal MPI is defined by computing the maximum values from the PI of June–November each year at each grid point and then averaging over all years. The MPI calculation includes dissipative heating, pseudoadiabatic ascent, and 0.7 for the ratio of surface exchange coefficients, as in Ref. [63], with a surface reduction of approximately 0.854 and 0.821 for the models and MERRA-2 (following the approach of Ref. [41]), respectively. The monthly potential intensity in combination with monthly environmental variables is used to calculate monthly GPI to create a seasonal averaged GPI. To make an accurate comparison between the models and observations, the model grid was coarsened to match the reanalysis and a five-degree smoothing was applied to the GPI field. For observations and both model runs, the MPI has a similar distribution, with maximum values observed along roughly 10–20 N. This similarity in MPI is expected given that the CAM5 simulations are prescribed with observed SSTs by the AMIP design. It should be mentioned that research has shown that the PI is affected by the thermodynamic equilibrium at the ocean surface, meaning surface fluxes are different when using a prescribed SST than they would be otherwise [64]. However, the GPI is noticeably different in the models compared to the observations. The most notable difference is in the Gulf of Mexico, where the GPI is larger in observations compared to both models (again not the focus here). The simulations and observations produce a local GPI maximum off the coast of Africa, which expands throughout the MDR. Figure 1 indicates that the GPI (and, therefore, the large-scale environment) is a good proxy for the location of genesis in both the observations and model simulations used in this study.
Figure 2 shows the difference (%) between the two model configurations for the variables shown in Figure 1. In the MDR, the BAM simulation is again shown to have a 20–50% higher track and genesis density than in MAM throughout much of the North Atlantic. The MPI in both models is quite similar (<10% difference) for the North Atlantic, particularly in the MDR, where the differences are less than 2% for much of the region. BAM has a higher GPI throughout the domain, especially in the eastern MDR (up to about 30% in some regions). This large GPI difference is consistent with the genesis densities for both models, with BAM having a much higher genesis density in that same region compared to MAM.
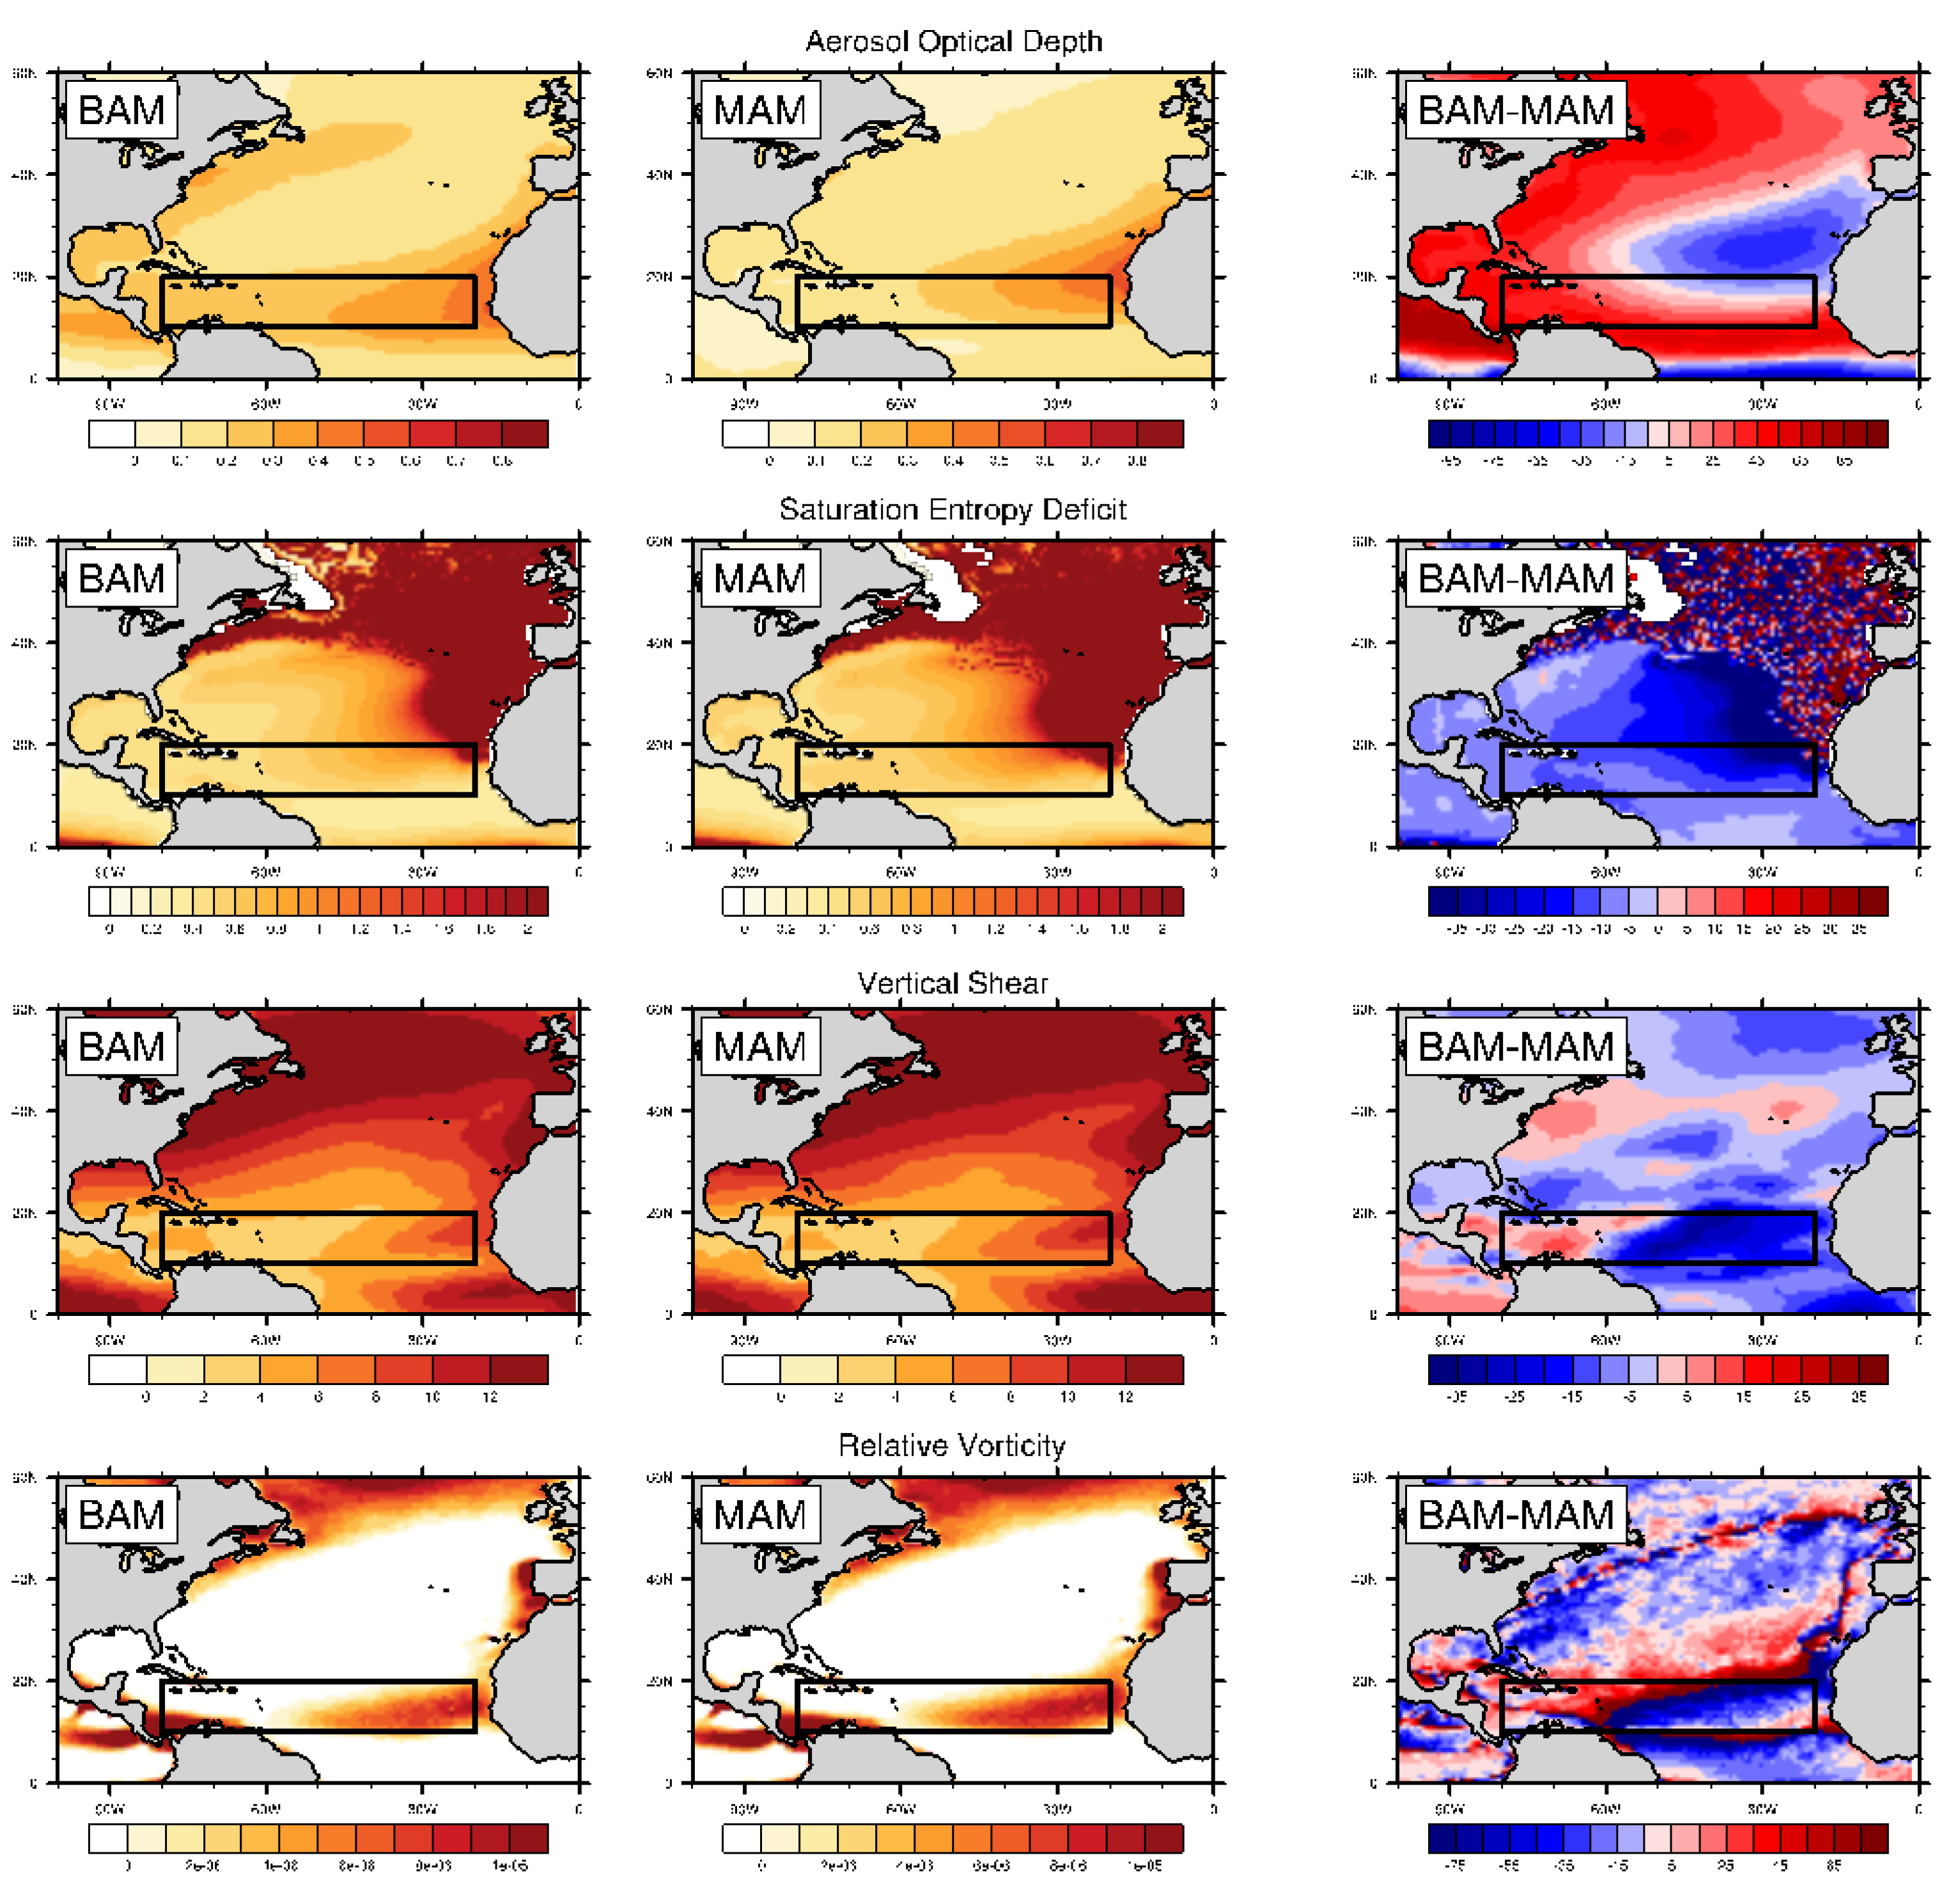
TC formation requires that environmental conditions be favorable for development [16,17,18,19]. The seasonal climatology of AOD, saturation entropy deficit, shear between 850 and 200 hPa, and relative vorticity at 850 hPa (that latter three are used in the GPI calculation) are examined for both BAM and MAM in Figure 3 (recall that, since SST is prescribed, surface air temperature differences are minimal). The last column shows the change (%) between the two models (BAM/MAM). Figure 3 demonstrates that the BAM configuration has higher AOD concentrations in the majority of the MDR, except for the northeastern edge. For saturation entropy deficit and shear, the values in the MAM are larger for most of the MDR than in BAM. There is a noticeable shift in the region of maximum relative vorticity values between the two simulations. However, the larger shear in MAM is likely a significant cause of the lower GPI in MAM, specifically in the eastern MDR (Figure 1). Given the differences in the simulated environmental conditions important for tropical cyclogenesis, differences in the TC climatology (as shown above) between the two simulations would be expected.
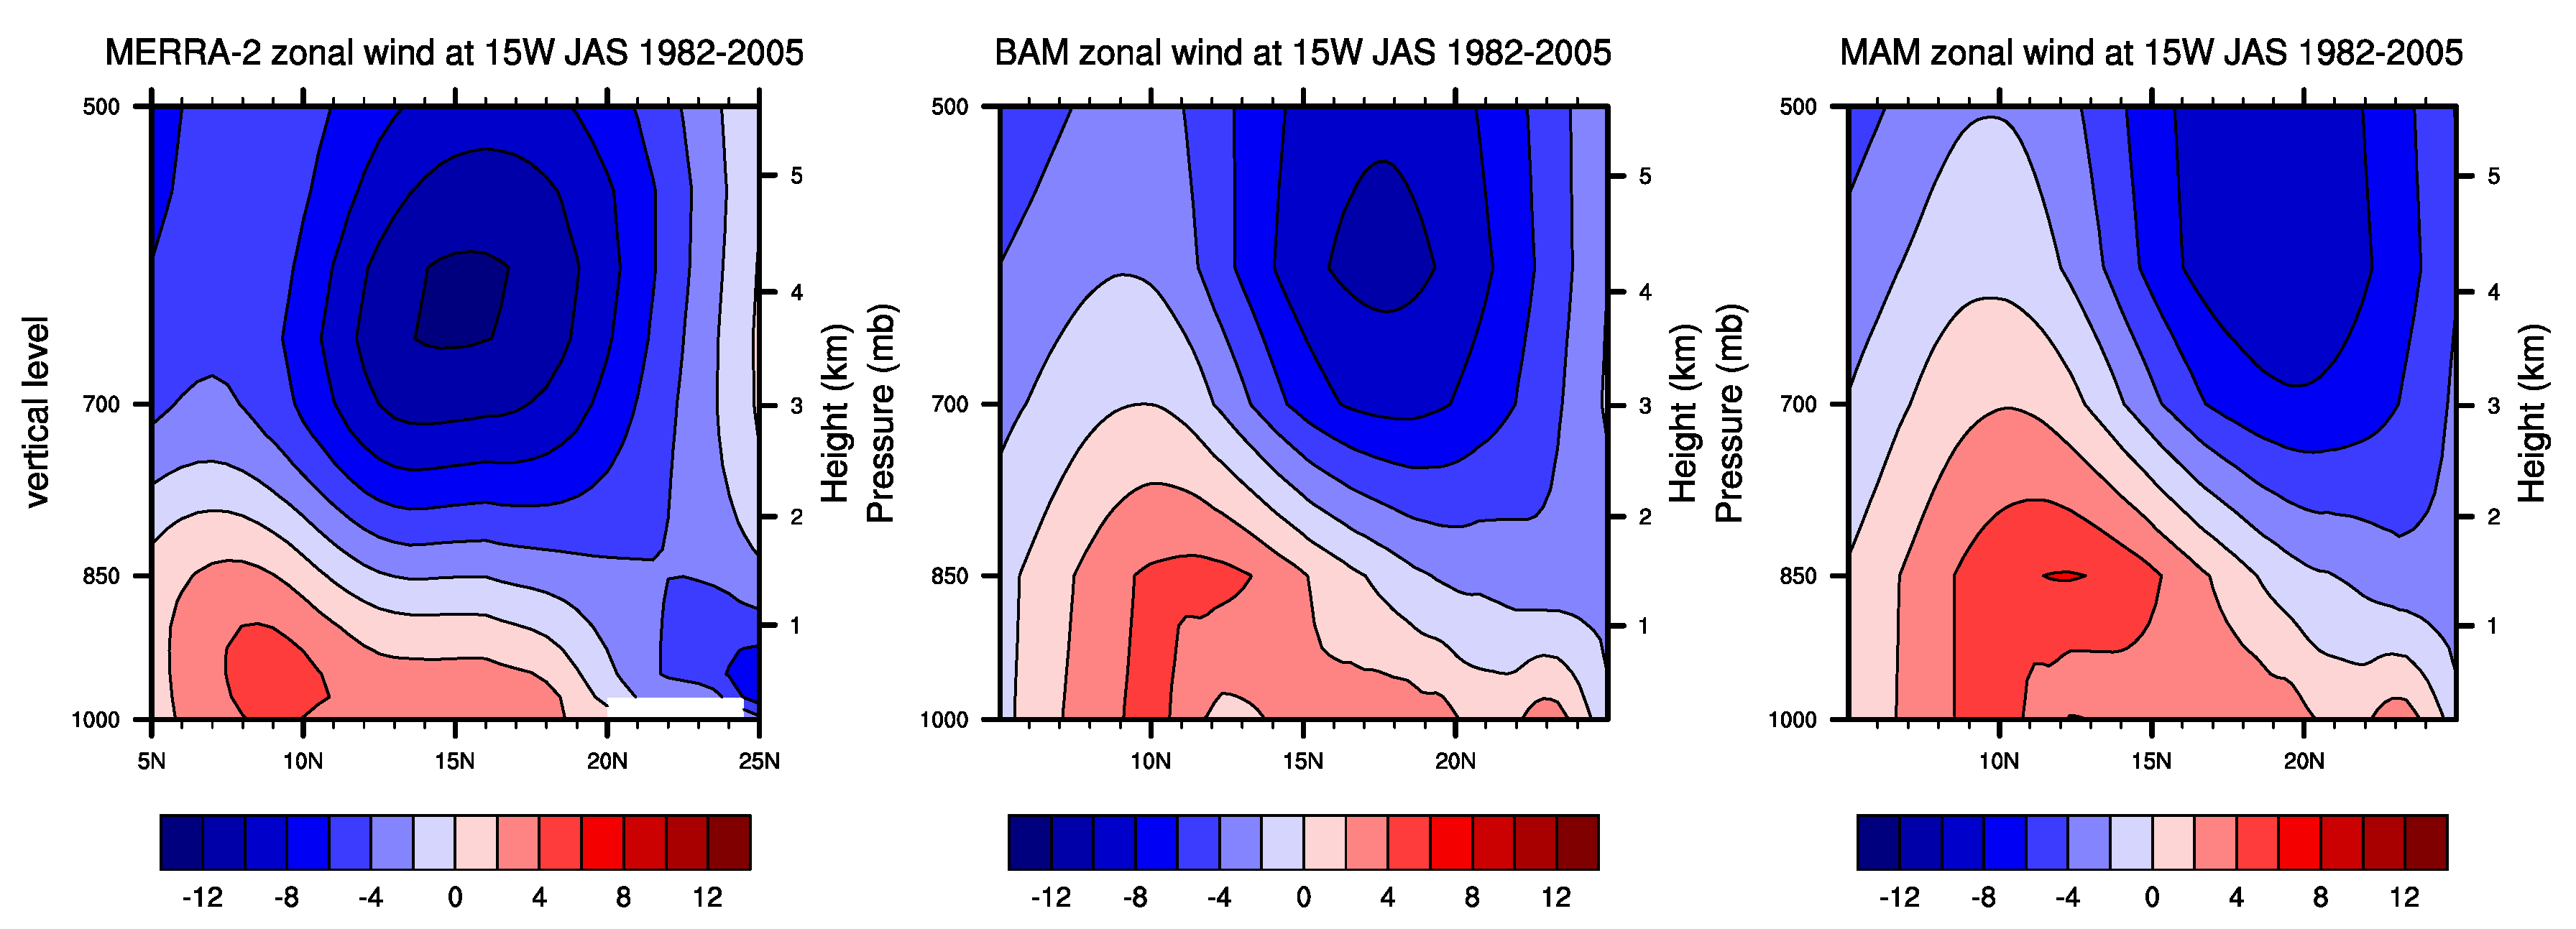
Given the differences in relative vorticity and wind shear in the two CAM5 simulations, one might expect these to be due to differences in the local circulation in, or around, the MDR. The African Easterly Jet (AEJ) is defined as a maximum in easterly winds at the mid-levels in the atmosphere [65] and has been shown to be important for simulated TC activity in the North Atlantic in global models [66]. The models (BAM and MAM) and observation-based reanalysis MERRA-2 have maximum easterly wind values at different vertical heights in the atmosphere in West Africa. Figure 4 displays vertical wind cross-sections at 15 W for July, August, and September (JAS) and explores the latitudinal differences and strength of the AEJ. The AEJ in reanalysis covers more latitudinal extent, and the jet is strongest around 600 mb compared to the models that have a narrower extent. From Figure 4, it is evident that BAM and MAM have different latitudinal locations for the AEJ. The MAM configuration simulates an AEJ that is further to the north of the BAM configuration and weaker in intensity. The difference in vorticity and higher shear (in the middle of the MDR) values for the MAM (Figure 3) can be attributed, in part, to this northward shift in the AEJ compared to BAM. Upon further investigation, a weaker temperature gradient is present at 850 hPa in MAM, which corresponds to a weaker AEJ in MAM. The larger shear in MAM is a result of weaker winds at 850 hPa and stronger winds at 200 hPa compared to BAM. The only difference between BAM and MAM is the parameterization of the aerosols, indicating that this change leads to more shear in MAM. It is unclear from these simulations if this is a result of direct or indirect effects of African dust, but such an analysis would be better suited for future analysis with a more controlled simulation design. Compared to the observed AEJ in MERRA-2, both models are further north and weaker than observed. In MAM, it seems that the further north AEJ influences the transport of dust (treated as a prognostic) over the North Atlantic, as shown in Figure 3, with a shift in the location of the maximum AOD.

3.2. Tropical Cyclone Interannual Variability

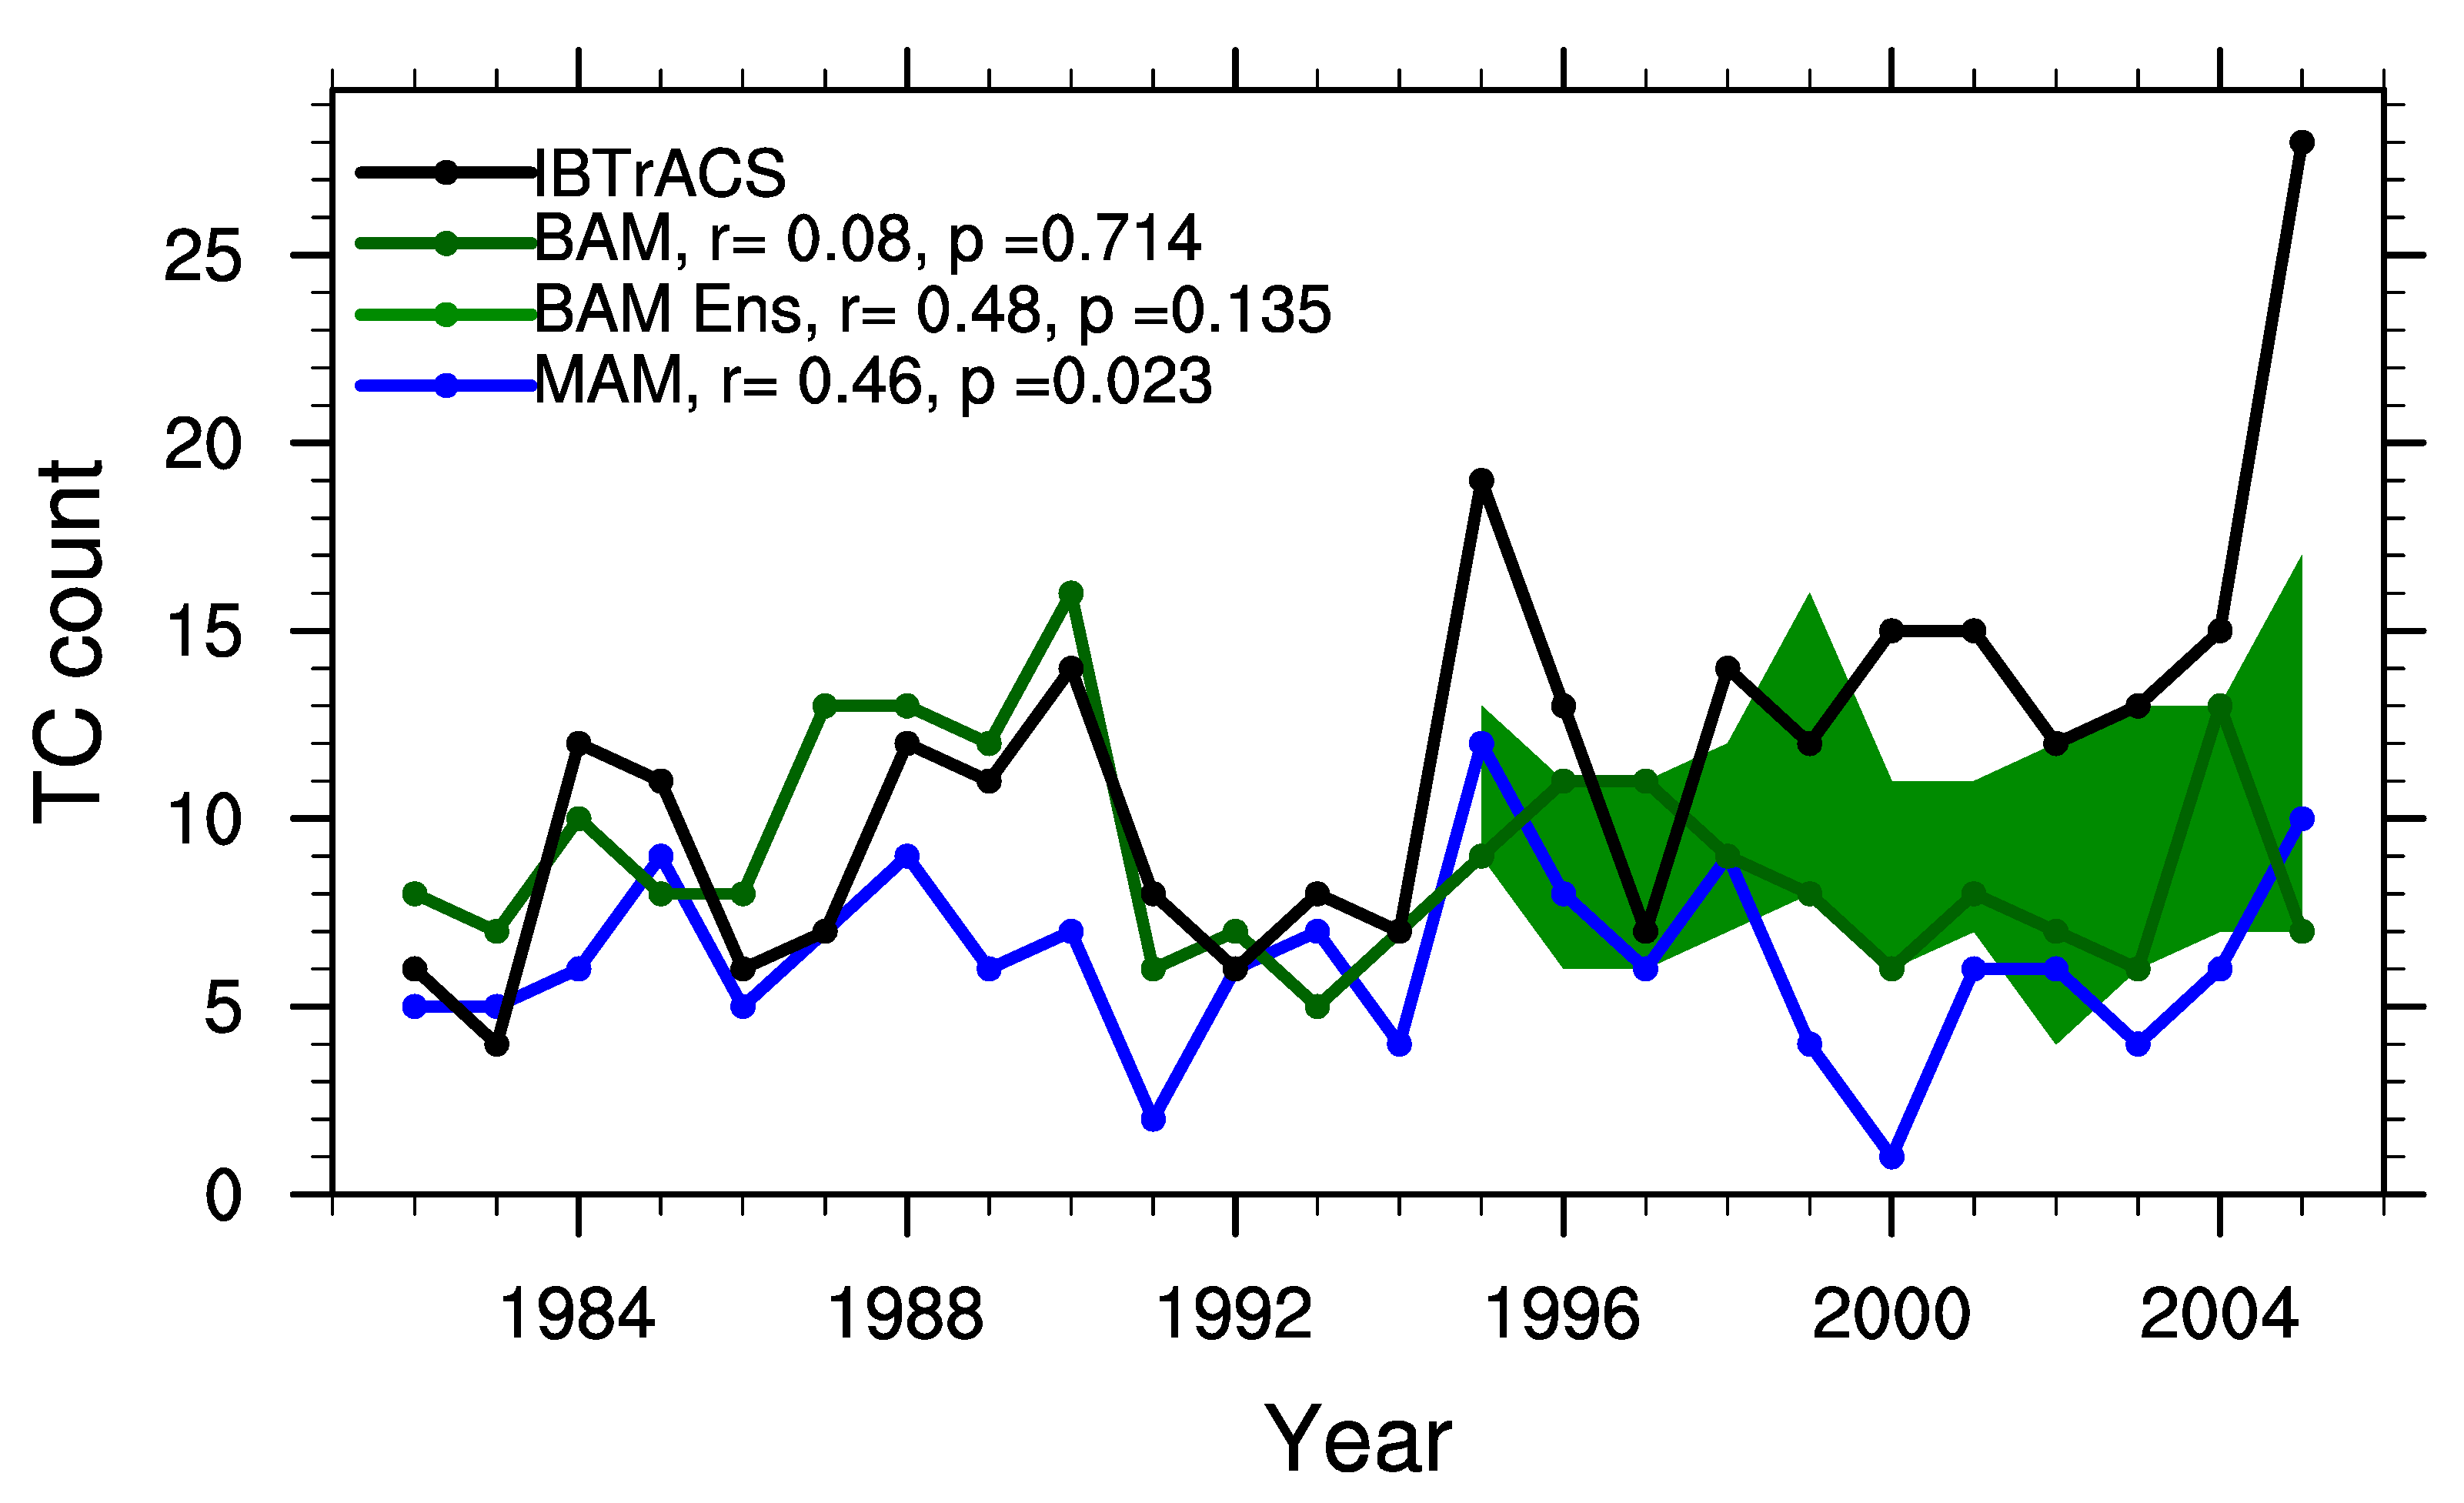
To investigate the potential implications of differences in environmental conditions on TC formation in CAM5, the interannual variability of TC counts is shown in Figure 5 for IBTrACS, BAM, and MAM. Over the North Atlantic, MAM shows some skill in reproducing the observed interannual variability (p < 0.05) over the full 1982–2005 period, while BAM shows no skill. We note that, during the first 18 years of the simulation (1980–1997), BAM preformed reasonably well in capturing interannual variability (e.g., Refs. [4,8]), but, even in this period, MAM outperforms BAM (not shown). Other global models show varying skill in simulating the interannual variability over the North Atlantic [11]. However, it is important to note that the simulations presented in this study represent only a control simulation for each model configuration and there is uncertainty in the interannual variability due to internal variability for the full 1982–2005 time period. In an attempt to shed light on this uncertainty, a small ensemble of BAM runs (1995–2005; 5 members) is included in Figure 5 as a range of maximum and minimum TC counts each year across the ensemble with the correlation representation of the ensemble mean. This ensemble spread provides a simple quantification of the internal variability that occurs in the BAM configuration, and the use of the ensemble mean does demonstrate an improvement in the correlation with observations over a shorter time period. Despite the uncertainty in TC variability, the results of Figure 1 and Figure 5 through differences in storm frequency, distribution, and interannual variability hint at a potential connection between North Atlantic aerosols and TCs given that the only significant difference between the two CAM5 simulations is the aerosol configuration.
The remaining question is how well the MAM configuration represents variability in aerosols in the MDR as the interannual variability of AOD can fluctuate substantially depending on large-scale circulations and the environment. Figure 6 shows the interannual variability of AOD averaged over the MDR for observations and models. A large source of AOD variability is due to volcanic activity, which is clearly visible in the 1982 and 1991 observational datasets in Figure 6. It is evident that BAM (i.e., prescribed aerosol concentration climatology) AOD has little variability (e.g., due to humidity changes), while the magnitude of fluctuations in the MAM simulation is more comparable to observations (both MERRA-2 and AVHRR), except for volcanic activity. The correlation analysis shows that MAM reproduces some of the observed variability, while BAM does not reproduce this variability and has a negative correlation. MAM is also shown to be statistically significant with MERRA-2 AOD in Figure 6. MAM better captures dust variability and TC variability over the MDR compared to BAM, suggesting that a relationship might be present between dust and TCs.
To explore the potential impact of dust on TCs, we now investigate potential relationships between the environment and TC climatologies. Figure 7 shows the variability in MDR TC counts along with area-averaged AOD over the MDR as a time series (1982–2005) for observations, BAM, and MAM. When analyzing AVHRR and MERRA-2 compared to IBTrACS, there is a negative correlation (r = −0.43 and r = −0.49, respectively), indicating an increase in TCs when there is a decrease in aerosols in the North Atlantic. Both BAM- and MAM-simulated TC counts are negatively correlated with average AOD, but MAM is much closer to observations (r = −0.34) compared to BAM (r = −0.07). This suggests that the MAM simulation, which is better at capturing the observed interannual variability in TC frequency (Figure 5), is doing so, at least in part, because of an improved simulation of aerosol and dust activity. The low correlation between BAM aerosols and tracks is likely a result of a basically flat line of aerosol values (Figure 6). The change in aerosols in BAM is quite small at approximately 0.015 (from Figure 7) during the 24 years examined in this study.
Finally, to explore this potential dust–TC relationship in more detail, Figure 8 shows a point-to-point correlation analysis over the 24-year period between track density (top row of Figure 2) and AOD (top row of Figure 4) over the MDR. From the observations (top row), it is evident that a large part of the domain has a negative correlation corresponding to the results shown in Figure 7. Parts of the western and central MDR, in both observational datasets, show this correlation to be significant at the 95% level and at the 90% level across the middle of the domain in MERRA-2. The models differ, however, with BAM showing a positive correlation (the opposite of the observed relationship) and MAM having a negative correlation throughout large areas of the MDR. The negative correlation in MAM roughly represents the distribution observed in AVHRR and MERRA-2, providing evidence that the improved representation of aerosols is providing some improvement in simulated TC variability.

4. Discussion and Conclusions

A potential connection between dust and TCs in the North Atlantic was explored by comparing two CAM5 simulations performed with different aerosol model configurations (i.e., BAM and MAM). The two models varied substantially in TC frequency in the North Atlantic. The more modern, fully prognostic aerosol model configuration, MAM, simulated fewer storms in the basin, as shown by the track and genesis density. BAM, using a prescribed climatology aerosol configuration previously used in high-resolution CAM5 configurations, simulated a slightly higher potential intensity and seasonally averaged GPI throughout most of the basin, consistent with its higher TC frequency in the region. The differences in TC climatology can be partially explained by differences in the simulated large-scale environment. An increase in vertical wind shear over the MDR, linked to changes in the AEJ and aerosols (i.e., dust) in the MAM simulation, produces an environment less favorable for TC development compared to BAM simulation, which is consistent with Dunion and Velden [27]. This is particularly evident in the eastern part of the MDR, where the increase in vertical wind corresponds well with decreases in GPI and genesis density. Again, the only difference between these simulations is the aerosols, and, therefore, dust concentrations are allowed to vary on all timescales in one configuration (MAM) and are constrained in the other (BAM), suggesting that the impact of aerosol and circulation coupling is important for regional-scale tropical cyclogenesis.
The simulated CAM5 interannual variability was also examined. Analysis demonstrated that the MAM AOD captures some of the observed variability in AOD over the MDR, while the climatological BAM AOD does not. It is also shown that the prognostic MAM configuration shows some skill (r = 0.43, p = 0.023) in reproducing TC variability, while the climatologically forced BAM configuration does not (r = 0.08, p = 0.714). Investigating this TC–AOD connection further shows that MAM can capture the observed negative correlation between average AOD over the MDR and TC count. A closer examination of the spatial correlation between AOD and track density is reasonably represented in MAM compared to observations, but not for the BAM configuration, which produces a correlation of the opposite sign for much of the MDR. Thus, we conclude that the improved representation of aerosol (i.e., dust) variability in the MDR in the MAM simulation results in an improved representation of TC variability in the North Atlantic. This work also points to the importance that aerosols must be consistent with the simulated meteorology relevant for TC formation and development (this is not the case for the BAM configuration used in this study) to capture these relationships, which has been found to be true for other extremes and regions [67]. It is important to note, however, that, more broadly, dust variability remains challenging to simulate in CMIP class models [68].
This study provides additional evidence that dust in the atmosphere has ramifications on the simulation of TC formation and development in the North Atlantic. Therefore, future global modeling studies should strongly consider including realistic aerosol concentrations and distributions when investigating TCs in the North Atlantic with both prescribed and prognostic aerosol model configurations. While the exact mechanisms for dust–TC interaction remain unclear in this work, it does suggest that current state-of-the-art high-resolution climate models can capture the observed negative correlation between tropical cyclones and dust in the North Atlantic shown previously [30,32]. Furthermore, it suggests that such TC-permitting climate models with prognostic dust offer a tool to study the dust–TC relationship, such as the hypotheses of Dunion and Velden [27] and Braun [33]. Future work could explore potential avenues for the dust–TC relationship through mechanism denial experiments. For example, more sophisticated experiments in which the interaction between the dust and CAM5 microphysics parameterizations are controlled while retaining radiative effects, or vice versa, could shed light on the relative roles of each. This work could lead to an improved understanding of the role of African dust in modulating North Atlantic TCs at both weather forecasting and climate timescales, the impact of which could be to improve seasonal forecasting and climate projections of TC activity.

Author Contributions

Conceptualization, J.J.A.H., K.A.R., J.T.B. and M.F.W.; methodology, J.J.A.H. and K.A.R.; formal analysis, J.J.A.H.; writing—original draft preparation, J.J.A.H. and K.A.R.; writing—review and editing, J.J.A.H., K.A.R., J.T.B. and M.F.W.; visualization, J.J.A.H.; supervision, K.A.R.; project administration, K.A.R.; funding acquisition, K.A.R. All authors have read and agreed to the published version of the manuscript.

Funding

US Department of Energy Office of Science Grant DE-SC0016605 supported this work through the Regional and Global Climate Modeling Program of the Office of Biological and Environmental Research. Work at LBNL was also supported by the Regional and Global Climate Modeling Program of the Office of Biological and Environmental Research in the US Department of Energy Office of Science under contract number DE-AC02-05CH11231.

Institutional Review Board Statement

Note applicable.

Informed Consent Statement

Not applicable.

Data Availability Statement

All CAM5 output used for the analysis in this study is available on NCAR’s Cheyenne computing platform. The monthly observation datasets used in this study, AVHRR and MERRA-2, are available at https://www.ncdc.noaa.gov/cdr/atmospheric/avhrr-aerosol-optical-thickness (accessed on 4 January 2016) and https://disc.sci.gsfc.nasa.gov/datasets?page=1&keywords=merra (accessed on 4 January 2016), respectively.

Acknowledgments

The National Science Foundation sponsors the National Center for Atmospheric Research (NCAR). Some model calculations were performed at the National Energy Research Supercomputing Center (NERSC) at the Lawrence Berkeley National Laboratory.

Conflicts of Interest

The authors declare no conflict of interest.

References

  1. Oouchi, K.; Yoshimura, J.; Yoshimura, H.; Mizuta, R.; Kusunoki, S.; Noda, A. Tropical cyclone climatology in a global-warming climate as simulated in a 20 km-mesh global atmospheric model: Frequency and wind intensity analyses. J. Meteorol. Soc. Jpn. 2006, 84, 259–276. [Google Scholar] [CrossRef]
  2. Bengtsson, L.; Hodges, K.I.; Esch, M.; Keenlyside, N.; Kornblueh, L.; Luo, J.-J.; Yamagata, T. How may tropical cyclones change in a warmer climate? Tellus 2007, 59, 539–561. [Google Scholar] [CrossRef]
  3. Zhao, M.; Held, I.M.; Lin, S.-J.; Vecchi, G.A. Simulations of Global Hurricane Climatology, Interannual Variability, and Response to Global Warming Using a 50-km Resolution GCM. J. Clim. 2009, 22, 6653–6678. [Google Scholar] [CrossRef]
  4. Wehner, M.F.; Reed, K.A.; Li, F.; Prabhat; Bacmeister, J.; Chen, C.-T.; Paciorek, C.; Gleckler, P.J.; Sperber, K.R.; Collins, W.D.; et al. The effect of horizontal resolution on simulation quality in the Community Atmospheric Model, CAM5.1. J. Adv. Modeling Earth Syst. 2014, 6, 980–997. [Google Scholar] [CrossRef]
  5. Bacmeister, J.T.; Reed, K.A.; Hannay, C.; Lawrence, P.; Bates, S.; Truesdale, J.E.; Rosenbloom, N.; Levy, M. Projected changes in tropical cyclone activity under future warming scenarios using a high-resolution climate model. Clim. Change 2018, 146, 547–560. [Google Scholar] [CrossRef]
  6. Reed, K.A.; Jablonowski, C. Impact of physical parameterizations on idealized tropical cyclones in the Community Atmosphere Model: Impact of Physics on Tropical Cyclones. Geophys. Res. Lett. 2011, 38, L04805. [Google Scholar] [CrossRef]
  7. Zhao, M.; Held, I.M.; Lin, S.-J. Some Counterintuitive Dependencies of Tropical Cyclone Frequency on Parameters in a GCM. J. Atmos. Sci. 2012, 69, 2272–2283. [Google Scholar] [CrossRef]
  8. Bacmeister, J.T.; Wehner, M.; Neale, R.B.; Gettelman, A.; Hannay, C.; Lauritzen, P.H.; Caron, J.M.; Truesdale, J.E. Exploratory High-Resolution Climate Simulations using the Community Atmosphere Model (CAM). J. Clim. 2014, 27, 3073–3099. [Google Scholar] [CrossRef]
  9. Reed, K.A.; Jablonowski, C. Idealized tropical cyclone simulations of intermediate complexity: A test case for AGCMs. J. Adv. Modeling Earth Syst. 2012, 4, M04001. [Google Scholar] [CrossRef]
  10. Reed, K.A.; Bacmeister, J.T.; Rosenbloom, N.A.; Wehner, M.F.; Bates, S.C.; Lauritzen, P.H.; Truesdale, J.E.; Hannay, C. Impact of the dynamical core on the direct simulation of tropical cyclones in a high-resolution global model: Dynamical core impact on TC Activity. Geophys. Res. Lett. 2015, 42, 3603–3608. [Google Scholar] [CrossRef] [Green Version]
  11. Shaevitz, D.; Camargo, S.J.; Sobel, A.; Jonas, J.A.; Kim, D.; Kumar, A.; LaRow, T.E.; Lim, Y.; Murakami, H.; Reed, K.; et al. Characteristics of tropical cyclones in high-resolution models in the present climate. J. Adv. Modeling Earth Syst. 2014, 6, 1154–1172. [Google Scholar] [CrossRef]
  12. Eyring, V.; Bony, S.; Meehl, G.A.; Senior, C.A.; Stevens, B.; Stouffer, R.J.; Taylor, K.E. Overview of the Coupled Model Intercomparison Project Phase 6 (CMIP6) experimental design and organization. Geosci. Model Dev. 2016, 9, 1937–1958. [Google Scholar] [CrossRef]
  13. Zhao, M.; Golaz, J.-C.; Held, I.M.; Ramaswamy, V.; Lin, S.-J.; Ming, Y.; Ginoux, P.; Wyman, B.; Donner, L.J.; Paynter, D.; et al. Uncertainty in Model Climate Sensitivity Traced to Representations of Cumulus Precipitation Microphysics. J. Clim. 2016, 29, 543–560. [Google Scholar] [CrossRef]
  14. Reed, K.A.; Bacmeister, J.T.; Huff, J.J.A.; Wu, X.; Bates, S.C.; Rosenbloom, N.A. Exploring the impact of dust on North Atlantic hurricanes in a high-resolution climate model. Geophys. Res. Lett. 2019, 46, 1105–1112. [Google Scholar] [CrossRef]
  15. Gray, W. The formation of tropical cyclones. Meteorol. Atmos. Phys. 1998, 67, 37–69. [Google Scholar] [CrossRef]
  16. Emanuel, K.; Nolan, D.S. Tropical Cyclone Activity and the Global Climate System. In Proceedings of the 26th Conference on Hurricanes and Tropical Meteorology, Miami, FL, USA, 3–7 May 2004. [Google Scholar]
  17. Camargo, S.J.; Emanuel, K.A.; Sobel, A.H. Use of a Genesis Potential Index to Diagnose ENSO Effects on Tropical Cyclone Genesis. J. Clim. 2007, 20, 4819–4834. [Google Scholar] [CrossRef]
  18. Bruyere, C.L.; Holland, G.J.; Towler, E. Investigating the Use of a Genesis Potential Index for Tropical Cyclones in the North Atlantic Basin. J. Clim. 2012, 25, 8611–8626. [Google Scholar] [CrossRef]
  19. Gray, W. Atlantic Seasonal Hurricane Frequency. Part I: El Nino and 30 mb Quasi-Biennial Oscillation Influences. Mon. Weather. Rev. 1984, 112, 1649–1668. [Google Scholar] [CrossRef]
  20. Patricola, C.M.; Chang, P.; Saravanan, R. Degree of simulated suppression of Atlantic tropical cyclones modulated by flavour of El Nino. Nat. Geosci. 2015, 9, 155–160. [Google Scholar] [CrossRef]
  21. Murakami, H.; Wang, Y.; Yoshimura, H.; Mizuta, R.; Sugi, M.; Shindo, E.; Adachi, Y.; Yukimoto, S.; Hosaka, M.; Kusunoki, S.; et al. Future Changes in Tropical Cyclone Activity Projected by the New High-Resolution MRI-AGCM. J. Clim. 2012, 25, 3237–3260. [Google Scholar] [CrossRef]
  22. Wehner, M.F.; Prabhat Reed, K.A.; Stone, D.; Collins, W.D.; Bacmeister, J. Resolution Dependence of Future Tropical Cyclone Projections of CAM5.1 in the U.S. CLIVAR Hurricane Working Group Idealized Configurations. J. Clim. 2015, 28, 3905–3925. [Google Scholar] [CrossRef]
  23. Zhang, W.; Vecchi, G.A.; Murakami, H.; Delworth, T.; Wittenberg, A.T.; Rosati, A.; Underwood, S.; Anderson, W.; Harris, L.; Gudgel, R.; et al. Improved simulation of tropical cyclone responses to ENSO in the western North Pacific in the high-resolution GFDL HiFLOR coupled climate model. J. Clim. 2016, 29, 1391–1415. [Google Scholar] [CrossRef]
  24. Dunstone, N.J.; Smith, D.M.; Booth, B.B.B.; Hermanson, L.; Eade, R. Anthropogenic aerosol forcing of Atlantic tropical storms. Nat. Geosci. 2013, 6, 534–539. [Google Scholar] [CrossRef]
  25. De Mott, P.J.; Sassen, K.; Poellot, M.R.; Baumgardner, D.; Rogers, D.C.; Brooks, S.D.; Prenni, A.J.; Kreidenweis, S.M. African dust aerosols as atmospheric ice nuclei: African dust Aerosols as Ice Nuclei. Geophys. Res. Lett. 2003, 30, 1732. [Google Scholar] [CrossRef]
  26. Carlson, T.N.; Prospero, J.M. The Large-Scale Movement of Saharan Air Outbreaks over the Northern Equatorial Atlantic. J. Appl. Meteorol. 1972, 11, 283–297. [Google Scholar] [CrossRef]
  27. Dunion, J.P.; Velden, C.S. The Impact of the Saharan Air Layer on Atlantic Tropical Cyclone Activity. Bull. Am. Meteorol. Soc. 2004, 85, 353–365. [Google Scholar] [CrossRef]
  28. Centeno Delgado, D.C.; Chiao, S. The footprints of Saharan air layer and lightning on the formation of tropical depressions over the eastern Atlantic Ocean. Meteorol. Atmos. Phys. 2015, 127, 17–32. [Google Scholar] [CrossRef]
  29. Bretl, S.; Reutter, P.; Raible, C.C.; Ferrachat, S.; Poberaj, C.S.; Revell, L.E.; Lohmann, U. The influence of absorbed solar radiation by Saharan dust on hurricane genesis. J. Geophys. Res. Atmos. 2015, 120, 1902–1917. [Google Scholar] [CrossRef]
  30. Evan, A.T.; Dunion, J.; Foley, J.A.; Heidinger, A.K.; Velden, C.S. New evidence for a relationship between Atlantic tropical cyclone activity and African dust outbreaks. Geophys. Res. Lett. 2006, 33, L19813. [Google Scholar] [CrossRef]
  31. Strong, J.D.O.; Vecchi, G.A.; Ginoux, P. The climatological effect of Saharan dust on global tropical cyclones in a fully coupled GCM. J. Geophys. Res.-Atmos. 2018, 123, 5538–5559. [Google Scholar] [CrossRef]
  32. Xian, P.; Klotzbach, P.J.; Dunion, J.P.; Janiga, M.A.; Reid, J.S.; Colarco, P.R.; Kipling, Z. Revisiting the relationship between Atlantic dust and tropical cyclone activity using aerosol optical depth reanalyses: 2003–2018. Atmos. Chem. Phys. 2020, 20, 15357–15378. [Google Scholar] [CrossRef]
  33. Braun, S.A. Reevaluating the Role of the Saharan Air Layer in Atlantic Tropical Cyclogenesis and Evolution. Mon. Weather. Rev. 2010, 138, 2007–2037. [Google Scholar] [CrossRef]
  34. Bercos-Hickey, E.; Nathan, T.R.; Chen, S.-H. Saharan dust and the African easterly jet-African easterly wave system: Structure, location and energetics: Saharan Dust and the African Easterly Jet-African Easterly Wave System. Q. J. R. Meteorol. Soc. 2017, 143, 2797–2808. [Google Scholar] [CrossRef]
  35. Grogan, D.F.P.; Nathan, T.R.; Chen, S.-H. Saharan Dust and the Nonlinear Evolution of the African Easterly Jet–African Easterly Wave System. J. Atmos. Sci. 2017, 74, 27–47. [Google Scholar] [CrossRef]
  36. Reale, O.; Lau, K.M.; da Silva, A. Impact of Interactive Aerosol on the African Easterly Jet in the NASA GEOS-5 Global Forecasting System. Weather. Forecast. 2011, 26, 504–519. [Google Scholar] [CrossRef]
  37. Wilcox, E.M.; Lau, K.M.; Kim, K.-M. A northward shift of the North Atlantic Ocean Intertropical Convergence Zone in response to summertime Saharan dust outbreaks: Saharan Dust Outbreaks and Atlantic Itcz. Geophys. Res. Lett. 2010, 37, L04804. [Google Scholar] [CrossRef]
  38. Pan, B.; Wang, Y.; Hu, J.; Lin, Y.; Hsieh, J.; Logan, T.; Feng, X.; Jiang, J.H.; Yung, Y.L.; Zhang, R. Impacts of Saharan Dust on Atlantic Regional Climate and Implications for Tropical Cyclones. J. Clim. 2018, 31, 7621–7644. [Google Scholar] [CrossRef]
  39. Reed, K.A.; Jablonowski, C.; Taylor, M.A. Tropical cyclones in the spectral element configuration of the Community Atmosphere Model. Atmos. Sci. Lett. 2012, 13, 303–310. [Google Scholar] [CrossRef]
  40. Chavas, D.R.; Reed, K.A.; Knaff, J.A. Physical understanding of the tropical cyclone wind-pressure relationship. Nat. Commun. 2017, 8, 1360. [Google Scholar] [CrossRef]
  41. Zarzycki, C.M.; Jablonowski, C. A multidecadal simulation of Atlantic tropical cyclones using a variable-resolution global atmospheric general circulation model. J. Adv. Modeling Earth Syst. 2014, 6, 805–828. [Google Scholar] [CrossRef]
  42. Zarzycki, C.M.; Jablonowski, C. Experimental Tropical Cyclone Forecasts Using a Variable-Resolution Global Model. Mon. Weather. Rev. 2015, 143, 4012–4037. [Google Scholar] [CrossRef]
  43. Stansfield, A.M.; Reed, K.A.; Zarzycki, C.M.; Ullrich, P.A.; Chavas, D.R. Assessing tropical cyclones’ contribution to precipitation over the eastern united states and sensitivity to the variable-resolution domain extent. J. Hydrometeorol. 2020, 21, 1425–1445. [Google Scholar] [CrossRef]
  44. Hurrell, J.W.; Holland, M.M.; Gent, P.R.; Ghan, S.; Kay, J.E.; Kushner, P.J.; Lamarque, J.-F.; Large, W.G.; Lawrence, D.; Lindsay, K.; et al. The Community Earth System Model A Framework for Collaborative Research. BAMS 2013, 94, 1339–1360. [Google Scholar] [CrossRef]
  45. Neale, R.; Gettelman, A.; Park, S.; Chen, C.-C.; Lauritzen, P.; Williamson, D.; Rasch, P.J.; Vavrus, S.J.; Taylor, M.A.; Collins, W.D.; et al. Description of the NCAR community atmosphere model (CAM 5.0). NCAR Tech. Note NCAR/TN-464+ STR 2012, 1, 282. [Google Scholar]
  46. Lin, S.-J.; Rood, R.B. Multidimensional Flux-Form Semi-Lagrangian Transport Schemes. Mon. Weather. Rev. 1996, 124, 2046–2070. [Google Scholar] [CrossRef]
  47. Lin, S.-J.; Rood, R.B. An explicit flux-form semi-Lagrangian shallow water model on the sphere. Q. J. R. Meteorol. Soc. 1997, 123, 2477–2498. [Google Scholar] [CrossRef]
  48. Kiehl, J.T.; Schneider, T.L.; Rasch, P.J.; Barth, M.C.; Wong, J. Radiative forcing due to sulfate aerosols from simulations with the National Center for Atmospheric Research Community Climate Model, Version 3. J. Geophys. Res. Atmos. 2000, 105, 1441–1457. [Google Scholar] [CrossRef]
  49. Easter, R.C.; Ghan, S.; Zhang, Y.; Saylor, R.; Chapman, E.G.; Laulainen, N.S.; Abdul-Razzak, H.; Leung, L.R.; Bian, X.; Zaveri, R. MIRAGE: Model description and evaluation of aerosols and trace gases. J. Geophys. Res. 2004, 109, D20210. [Google Scholar] [CrossRef]
  50. Ghan, S.J.; Easter, R.C. Impact of cloud-borne aerosol representation on aerosol direct and indirect effects. Atmos. Chem. Phys. 2006, 6, 4163–4174. [Google Scholar] [CrossRef]
  51. Gates, W.L.; Boyle, J.S.; Covey, C.; Dease, C.G.; Doutriaux, C.M.; Drach, R.S.; Fiorino, M.; Gleckler, P.J.; Hnilo, J.J.; Marlais, S.M.; et al. An overview of the results of the Atmospheric Model Intercomparison Project (AMIP I). Bull. Am. Meteorol. Soc. 1999, 80, 29–55. [Google Scholar] [CrossRef]
  52. Heidinger, A.K.; Foster, M.J.; Walther, A.; Zhao, X. The pathfinder atmospheres–extended avhrr climate dataset. Bull. Am. Meteorol. Soc. 2014, 95, 909–922. [Google Scholar] [CrossRef]
  53. Evan, A.T.; Heidinger, A.K.; Pavolonis, M.J. Development of a new over-water Advanced Very High Resolution Radiometer dust detection algorithm. Int. J. Remote Sens. 2006, 27, 3903–3924. [Google Scholar] [CrossRef]
  54. Bosilovich, M.G.; Akella, S.; Coy, L.; Cullather, R.; Draper, C.; Gelaro, R.; Kovach, R.; Liu, Q.; Molod, A.; Norris, P.; et al. Technical Report Series on Global Modeling and Data Assimilation, Volume 43. MERRA-2; Initial Evaluation of the Climate. Available online: http://ntrs.nasa.gov/search.jsp?R=20160005045 (accessed on 4 January 2016).
  55. Gelaro, R.; McCarty, W.; Suárez, M.J.; Todling, R.; Molod, A.; Takacs, L.; Randles, C.A.; Darmenov, A.; Bosilovich, M.G.; Reichle, R.; et al. The Modern-Era Retrospective Analysis for Research and Applications, Version 2 (MERRA-2). J. Clim. 2017, 30, 5419–5454. [Google Scholar] [CrossRef]
  56. Randles, C.A.; Da Silva, A.M.; Buchard, V.; Colarco, P.R.; Darmenov, A.; Govindaraju, R.; Smirnov, A.; Holben, B.; Ferrare, R.; Hair, J.; et al. The MERRA-2 Aerosol Reanalysis, 1980 Onward. Part I: System Description and Data Assimilation Evaluation. J. Clim. 2017, 30, 6823–6850. [Google Scholar] [CrossRef]
  57. Reale, O.; Lau, K.M.; da Silva, A.; Matsui, T. Impact of assimilated and interactive aerosol on tropical cyclogenesis. Geophys. Res. Lett. 2014, 41, 3282–3288. [Google Scholar] [CrossRef]
  58. Knapp, K.R.; Kruk, M.C.; Levinson, D.H.; Diamond, H.J.; Neumann, C.J. The international best track archive for climate stewardship (IBTrACS). Bull. Am. Meteorol. Soc. 2010, 91, 363. [Google Scholar] [CrossRef]
  59. Hodges, K.; Cobb, A.; Vidale, P.L. How Well Are Tropical Cyclones Represented in Reanalysis Datasets? J. Clim. 2017, 30, 5243–5264. [Google Scholar] [CrossRef]
  60. Done, J.M.; Holland, G.J.; Bruyère, C.L.; Leung, L.R.; Suzuki-Parker, A. Modeling high-impact weather and climate: Lessons from a tropical cyclone perspective. Clim. Change 2015, 129, 381–395. [Google Scholar] [CrossRef]
  61. Emanuel, K. Sensitivity of Tropical Cyclones to Surface Exchange Coefficients and a Revised Steady-State Model Incorporating Eye Dynamics. J. Atmos. Sci. 1995, 52, 3969–3976. [Google Scholar] [CrossRef]
  62. Emanuel, K. Tropical cyclone activity downscaled from NOAA-CIRES Reanalysis, 1908–1958. J. Adv. Modeling Earth Syst. 2010, 2, 1. [Google Scholar] [CrossRef]
  63. Tang, B.; Emanuel, K. A ventilation index for tropical cyclones. Bull. Am. Meteorol. Soc. 2012, 93, 1901–1912. [Google Scholar] [CrossRef]
  64. Emanuel, K.; Sobel, A. Response of tropical sea surface temperature, precipitation, and tropical cyclone-related variables to changes in global and local forcing. J. Adv. Modeling Earth Syst. 2013, 5, 447–458. [Google Scholar] [CrossRef]
  65. Cook, K.H. Generation of the African easterly jet and its role in determining West African precipitation. J. Clim. 1999, 12, 1165–1184. [Google Scholar] [CrossRef]
  66. Roberts, M.J.; Vidale, P.L.; Mizielinski, M.S.; Demory, M.-E.; Schiemann, R.; Strachan, J.; Hodges, K.; Bell, R.; Camp, J. Tropical cyclones in the UPSCALE ensemble of high-resolution global climate models. J. Clim. 2015, 28, 574–596. [Google Scholar] [CrossRef]
  67. Wehner, M.; Stone, D.; Shiogama, H.; Wolski, P.; Ciavarella, A.; Christidis, N.; Krishnan, H. Early 21st century anthropogenic changes in extremely hot days as simulated by the C20C+ detection and attribution multi-model ensemble. Weather. Clim. Extrem. 2018, 20, 1–8. [Google Scholar] [CrossRef]
  68. Aryal, Y.N.; Evans, S. Global dust variability explained by drought sensitivity in CMIP6 models. J. Geophys. Res. Earth Surf. 2021, 126, e2021JF006073. [Google Scholar] [CrossRef]
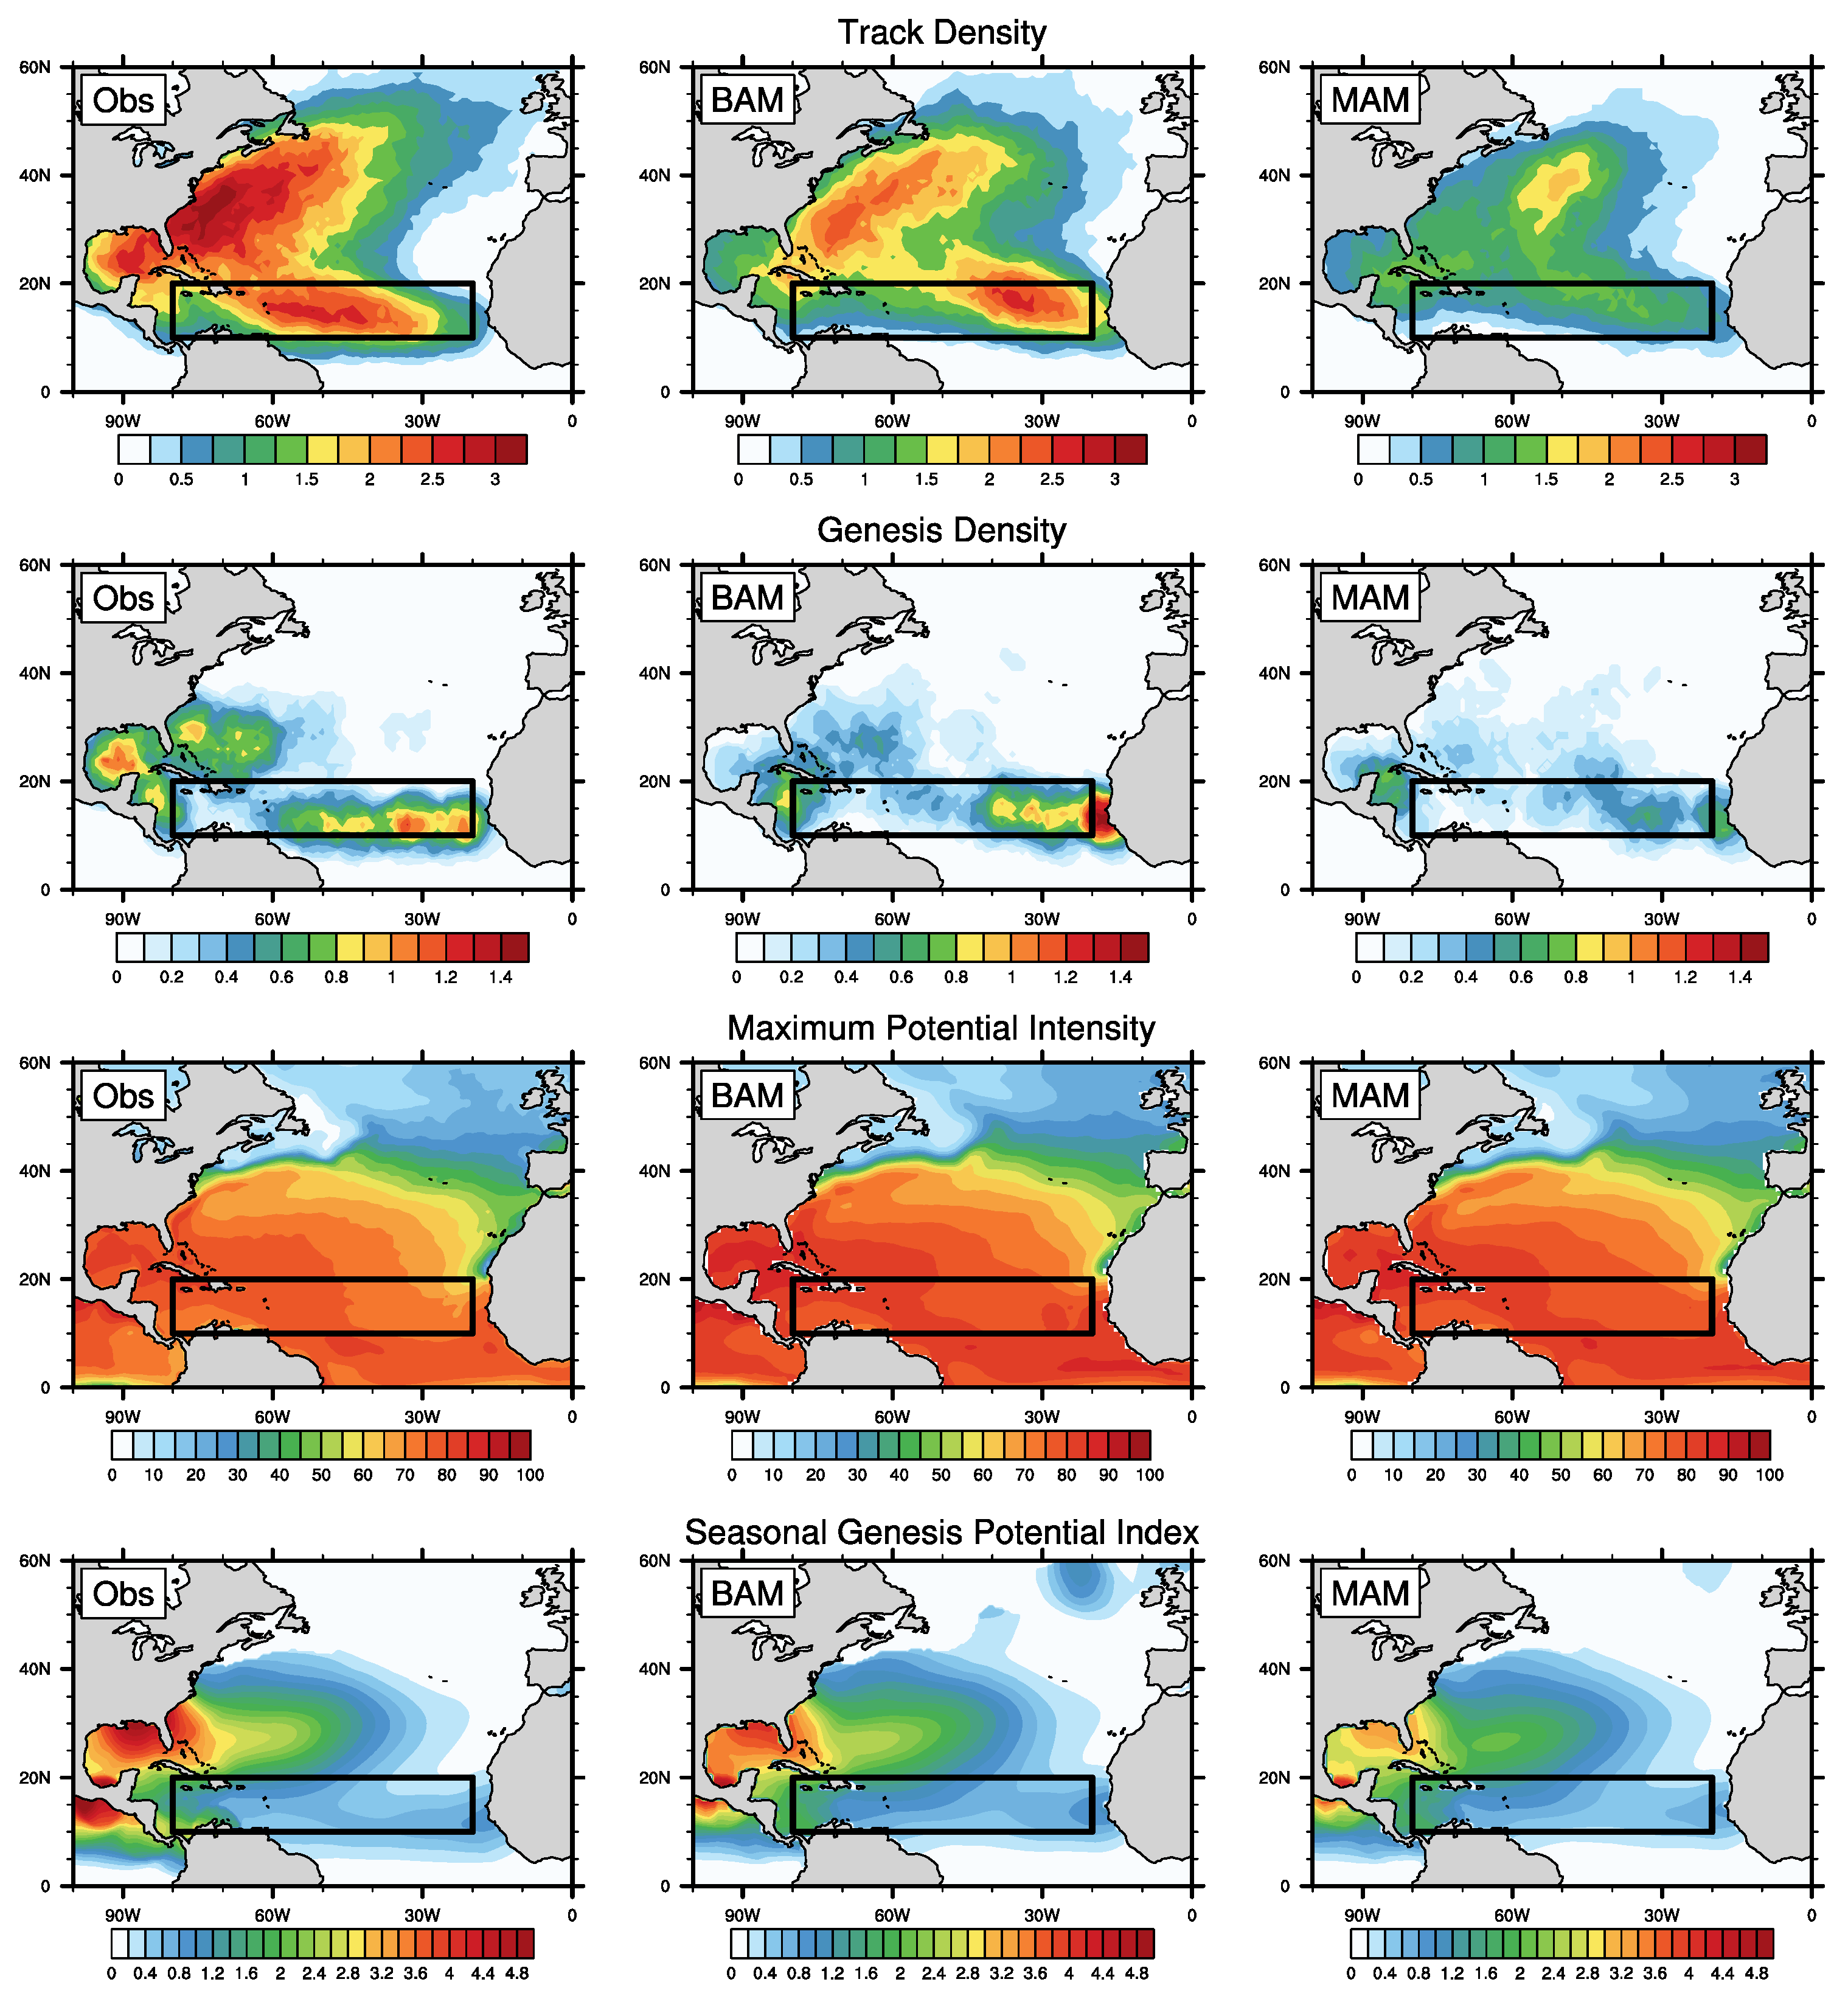
Figure 1. North Atlantic distribution of the (first row) seasonal track density, (second row) seasonal storm genesis density, (third row) seasonal maximum potential intensity (MPI, m/s), and (fourth row) seasonal average genesis potential index (GPI). These calculations are conducted for the seasonal (June–November) average from 1982 to 2005 for (left) observational reanalysis MERRA-2, (middle) BAM, and (right) MAM. The MDR is shown as the black outline.
Climate 10 00130 g001
Figure 2. North Atlantic distribution for the difference (%) between the two models (BAM minus MAM) for (first) seasonal average track density, (second) seasonal average storm genesis density, (third) seasonal maximum potential intensity, and (fourth) seasonal average genesis potential index. Calculations are conducted for seasonal (June to November) average from 1982 to 2005. The MDR is shown as the black outline.
Climate 10 00130 g002
Figure 3. Seasonal (June–November) average from 1982 to 2005 for (first row) AOD, (second row) saturation entropy deficit, (third row) vertical shear (m/s) between 850 and 200 hPa, and (fourth row) relative vorticity (1/s) at 850 hPa. The results are shown for the model simulations with (left column) BAM, with (middle column) MAM, and (right column) the percent change between the two models. The MDR is displayed as the black outline.
Climate 10 00130 g003
Figure 4. Vertical and latitudinal distribution of the AEJ (zonal wind) over the North Atlantic at 15 W. These are calculated using July, August, and September seasonal averages from 1982 to 2005 for (left) MERRA-2, (middle) BAM, and (right) MAM.
Climate 10 00130 g004
Figure 5. Interannual variability in North Atlantic TCs for IBTrACS, BAM, BAM ensemble (shaded), and MAM. The TC counts are calculated over the seasonal average (June–November) from 1982 to 2005. The correlation (r) and statistical significance (p) between the simulated TCs counts and IBTrACS are included in the legend.
Climate 10 00130 g005
Figure 6. Interannual variability in aerosol optical depth for observations, AVHRR and MERRA-2, and models, BAM and MAM. Calculated over the seasonal (June–November) and MDR from 1982 to 2005. Inset shows correlation (r) and statistical significance (p) values for observations and models.
Climate 10 00130 g006
Figure 7. Interannual variability for (top) IBTrACS count, MERRA-2, and AVHRR; (middle) BAM TC count and aerosols; (bottom) MAM TC count and aerosols. Solid lines are the TC count, and dashed lines are AOD. Calculations are seasonal (June–November) averages from 1982 to 2005. Correlation between AOD and tracks is shown in the legend. The range of values in BAM AOD is much smaller than the other two.
Climate 10 00130 g007
Figure 8. Correlations between the averaged AOD and track density over the MDR (10–20 N; 80–20 W) for (first row) observations and (second row) models. The cross hatching indicates 95% statistical significance, while the single direction hatching indicates 90% statistical significance. The AVHRR dataset excludes grid boxes that are considered land.
Climate 10 00130 g008
Publisher’s Note: MDPI stays neutral with regard to jurisdictional claims in published maps and institutional affiliations.