
Heat Vulnerability Index Mapping: A Case Study of a Medium-Sized City (Amiens)


Abstract
1. Introduction
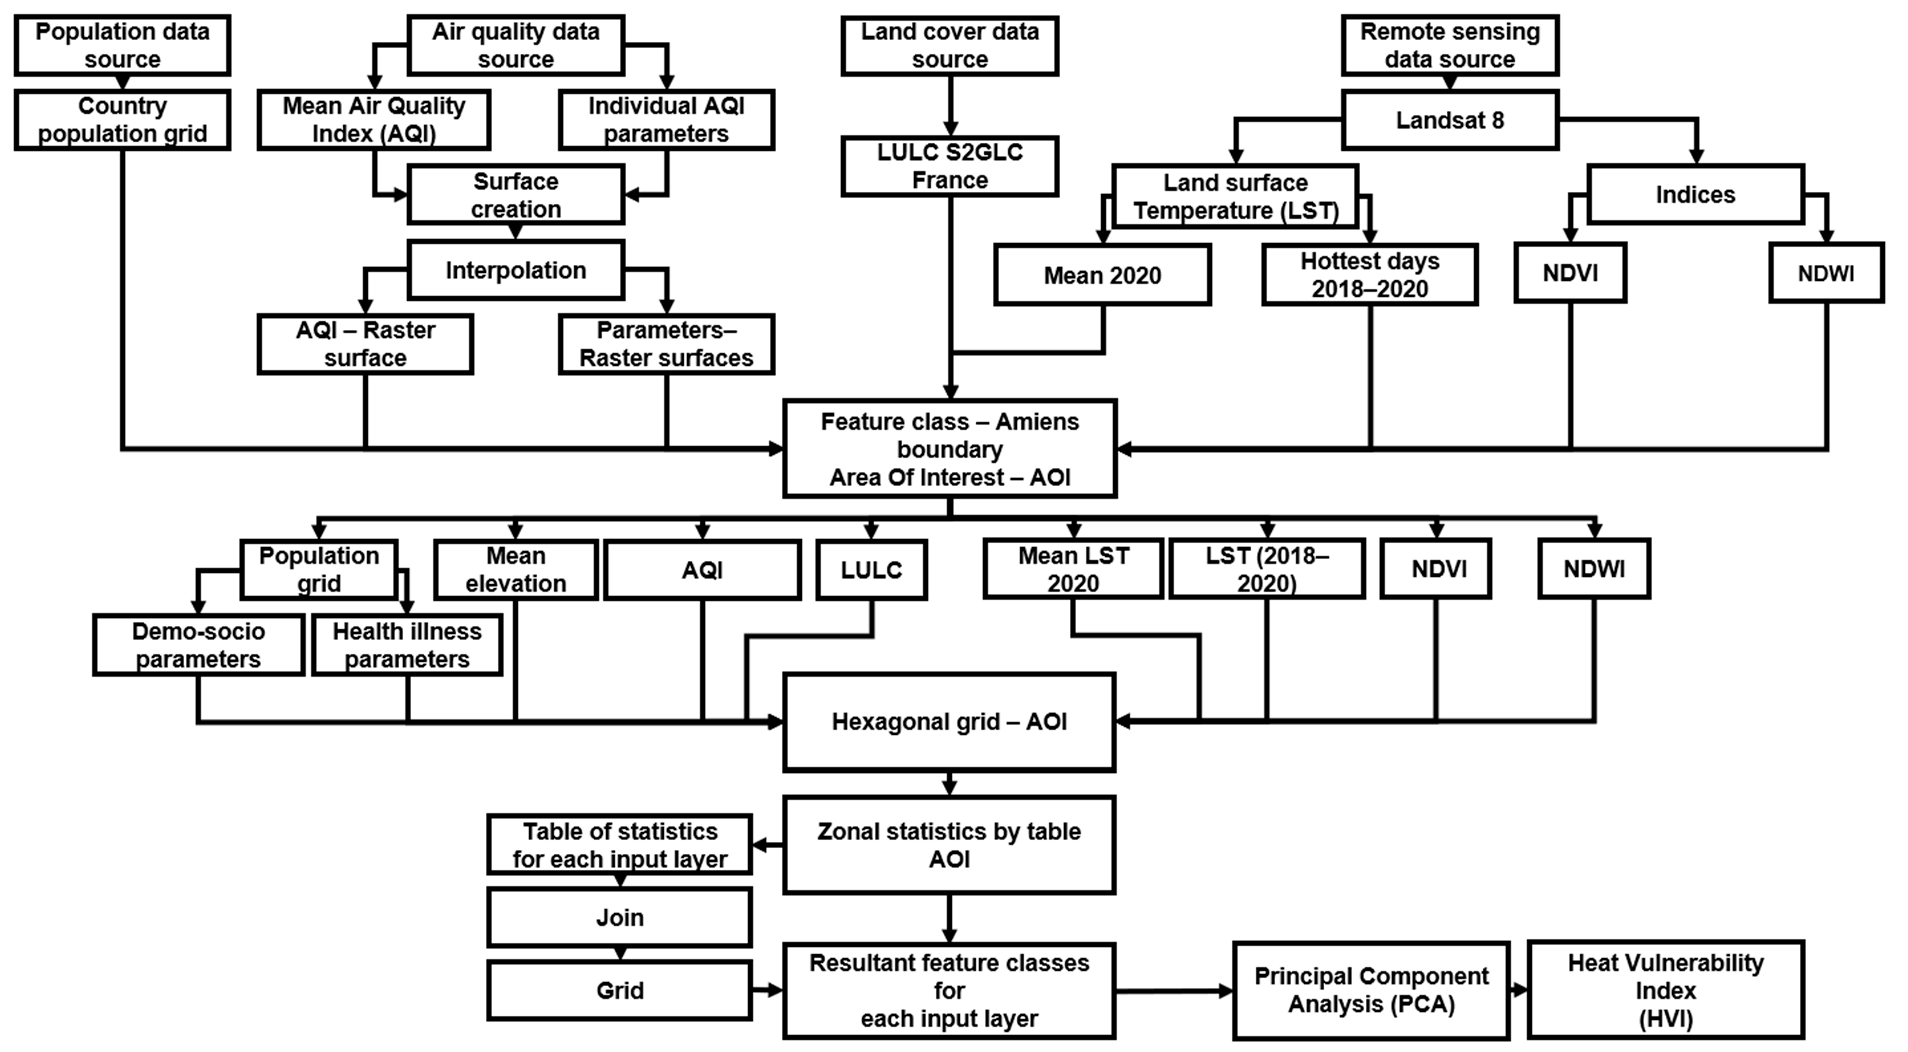
2. Materials and Methods
2.1. Identification of Risk Factors
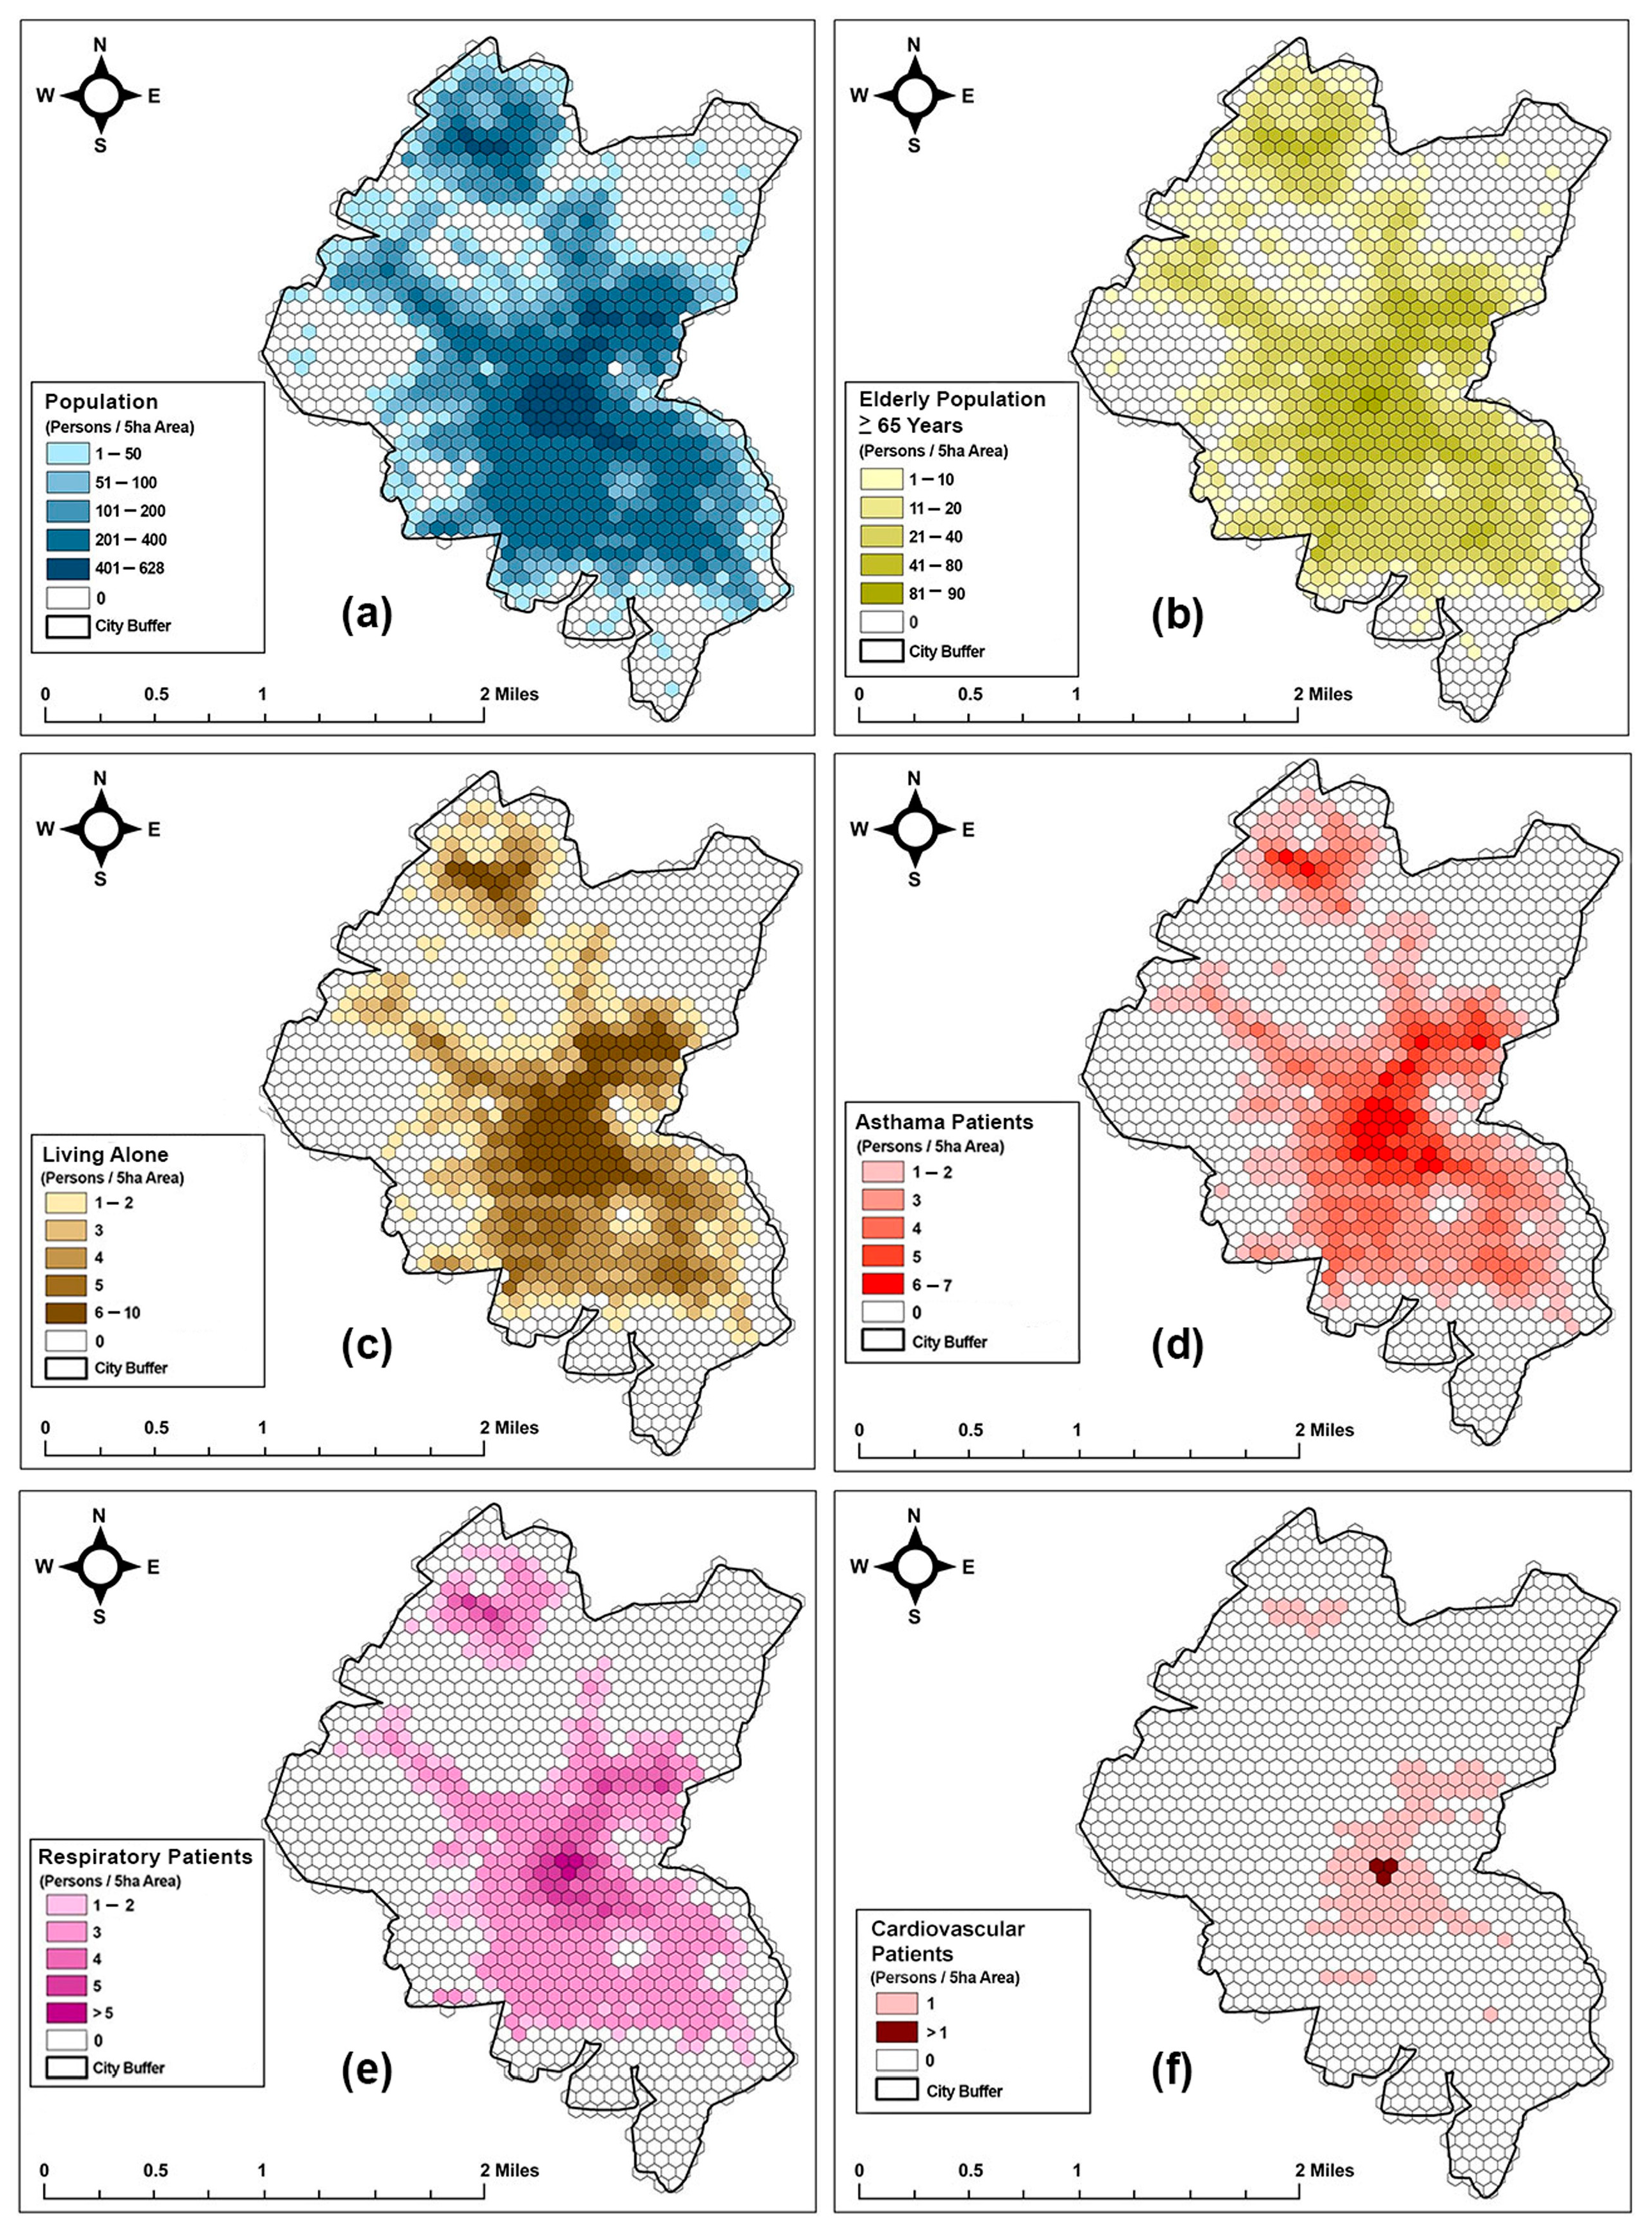
2.1.1. Social Vulnerability Factors (SVF)
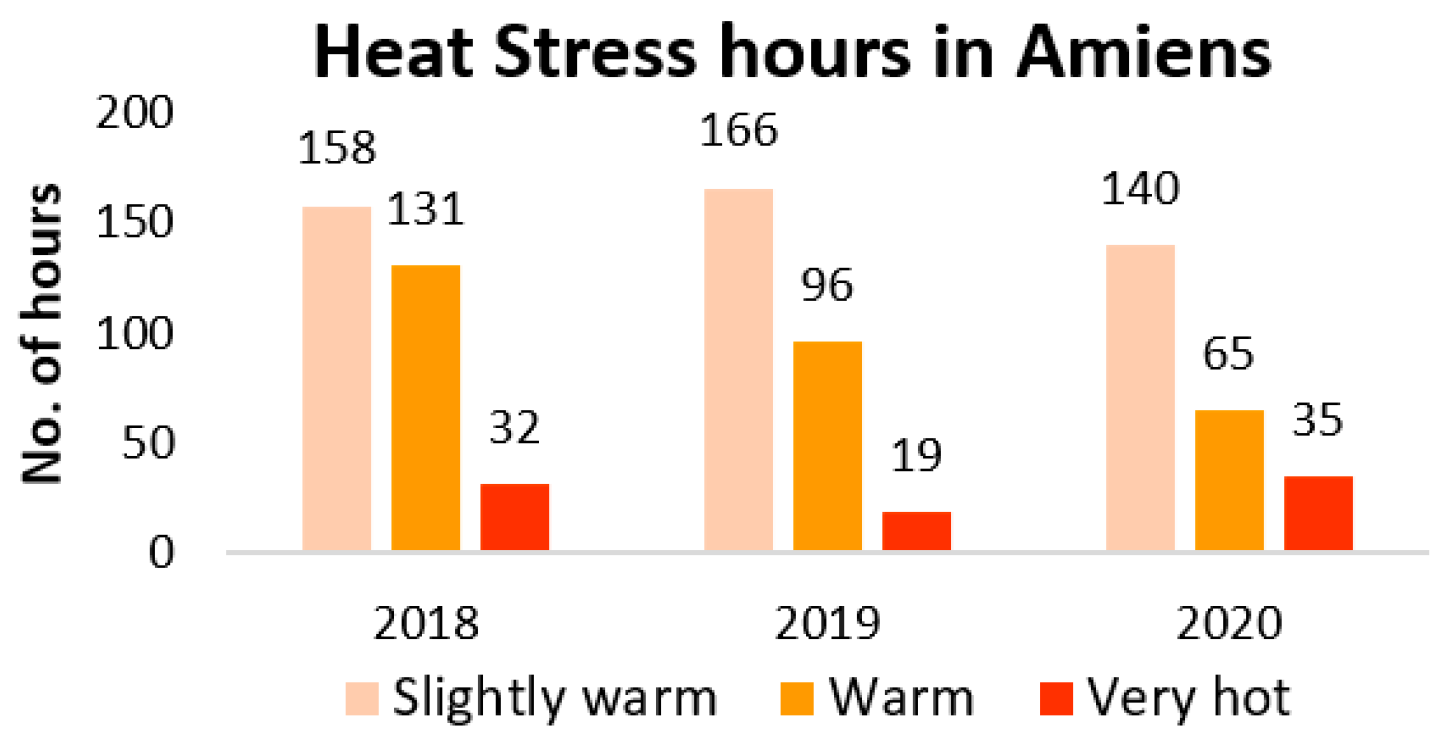
2.1.2. Extreme Event Analysis
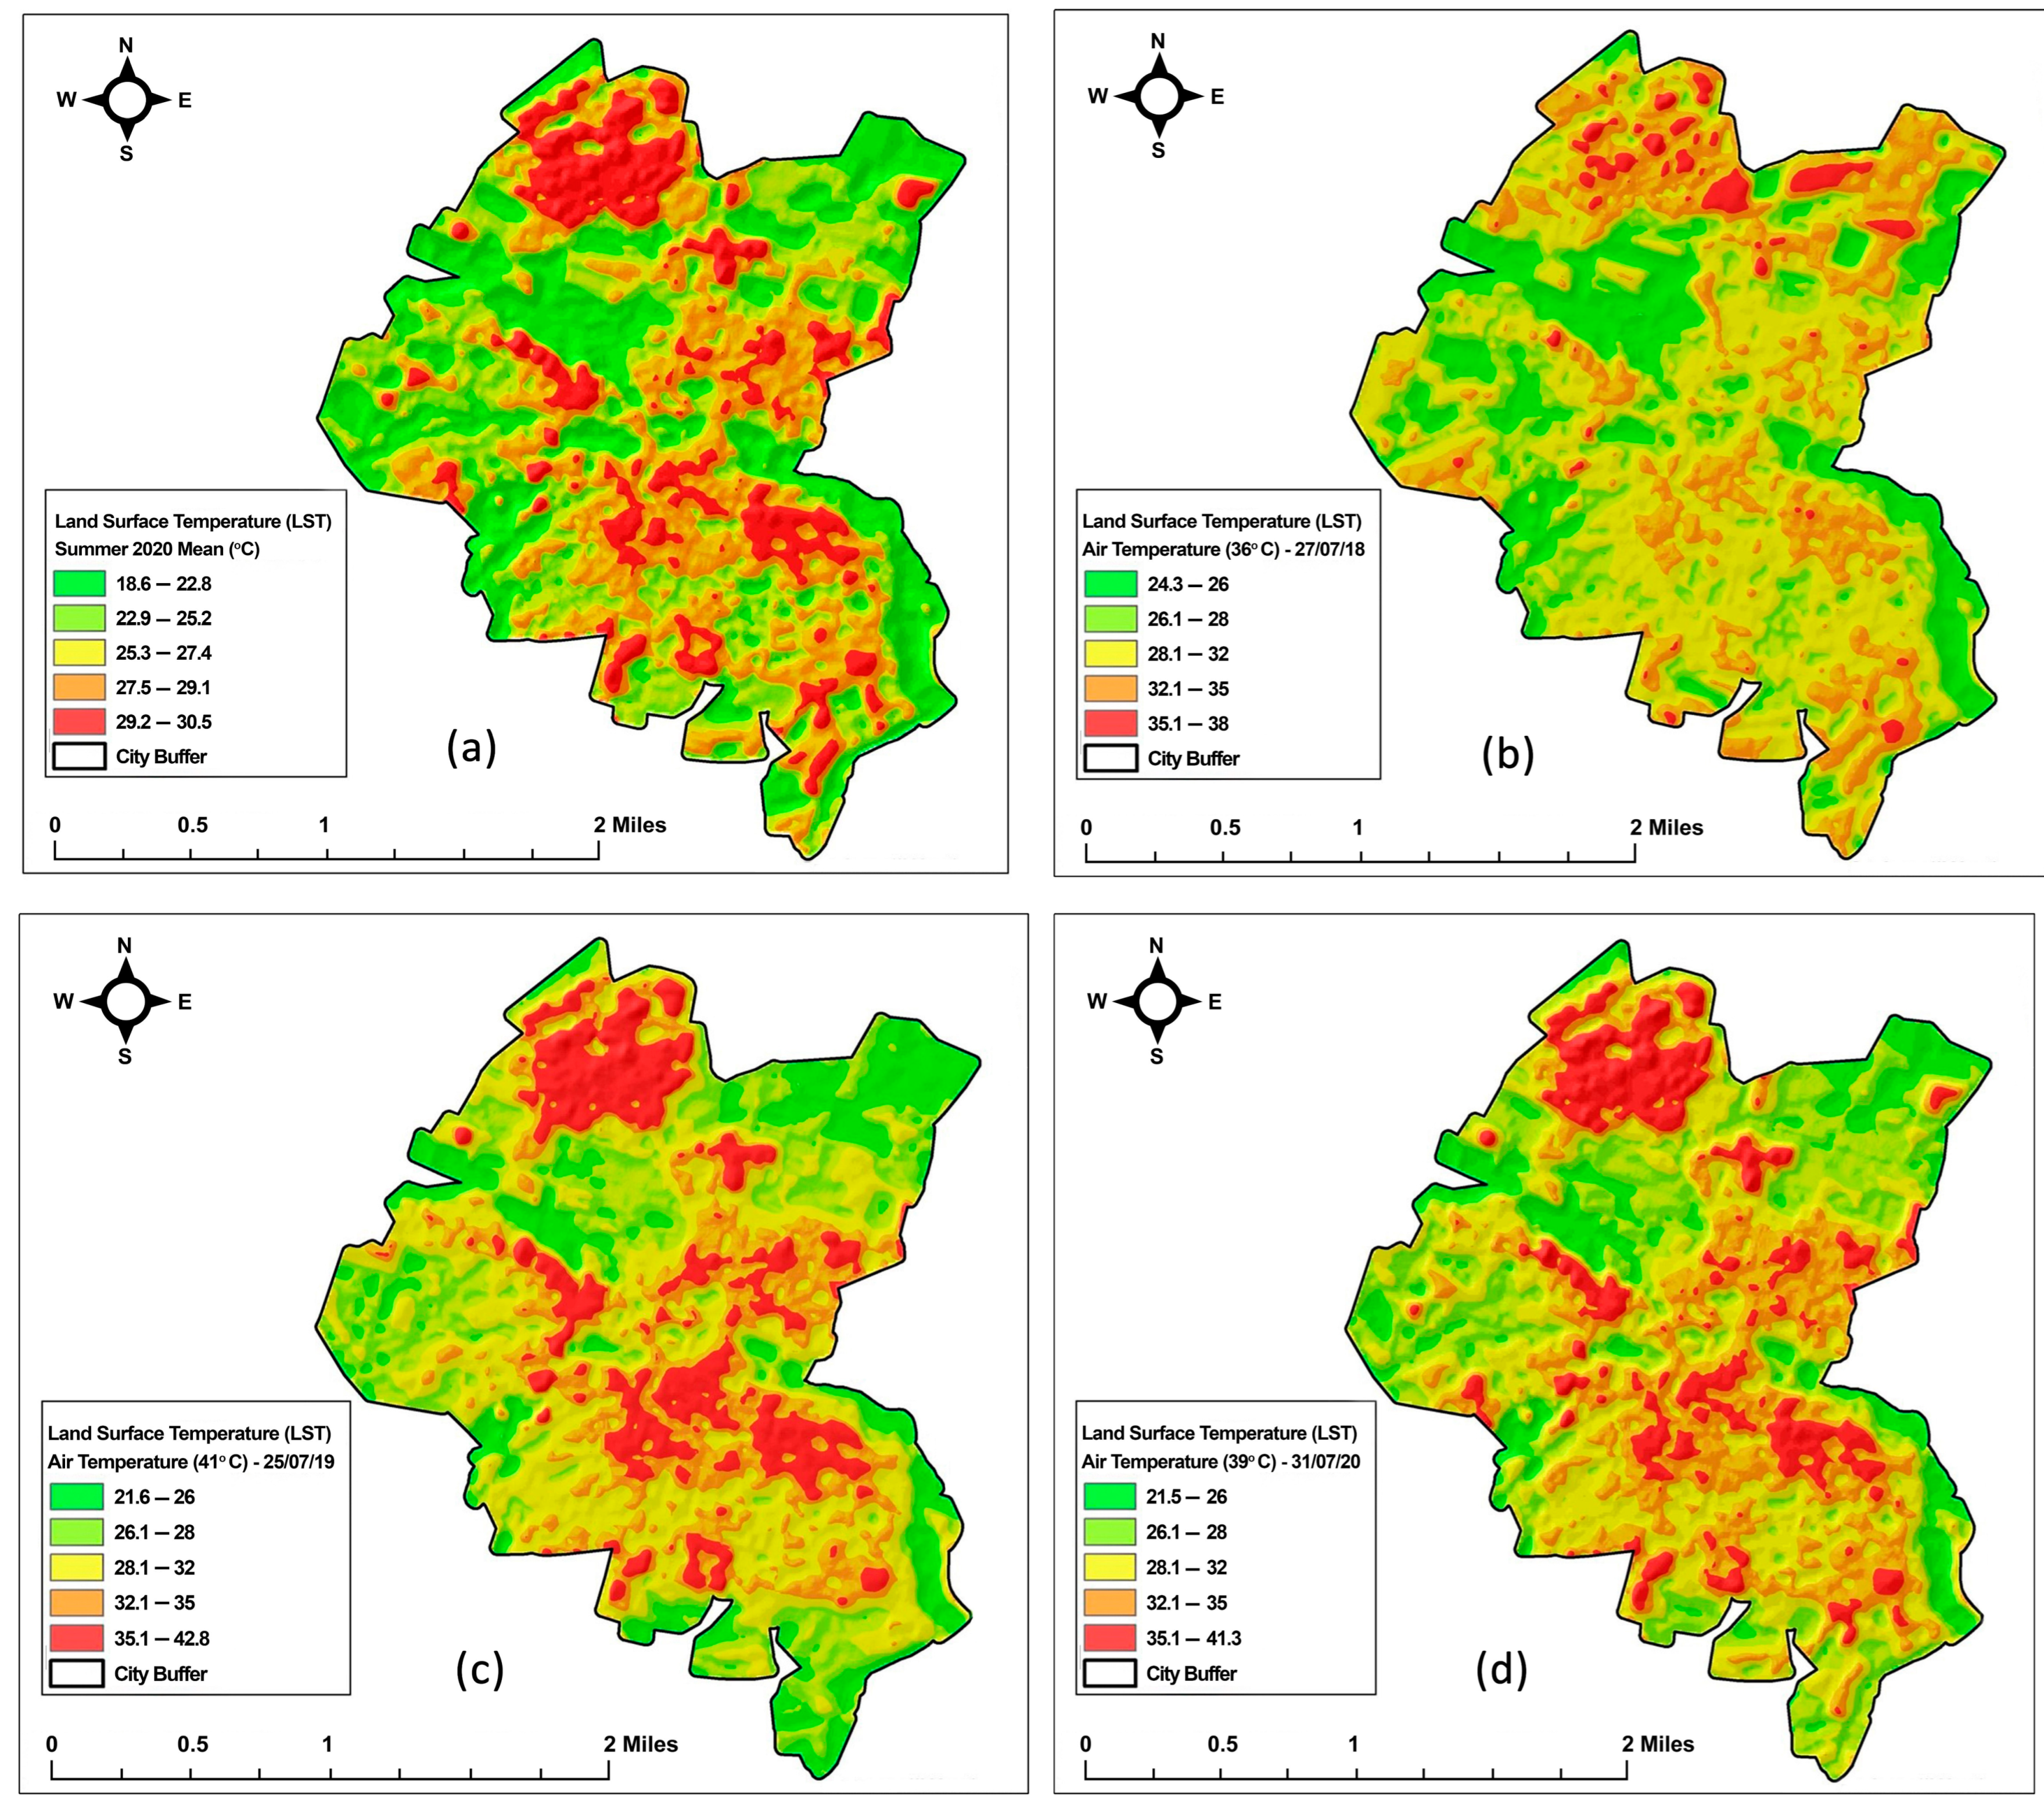
2.1.3. Environmental Risk Factors
- a.
- LST mapping of extreme heat days
- b.
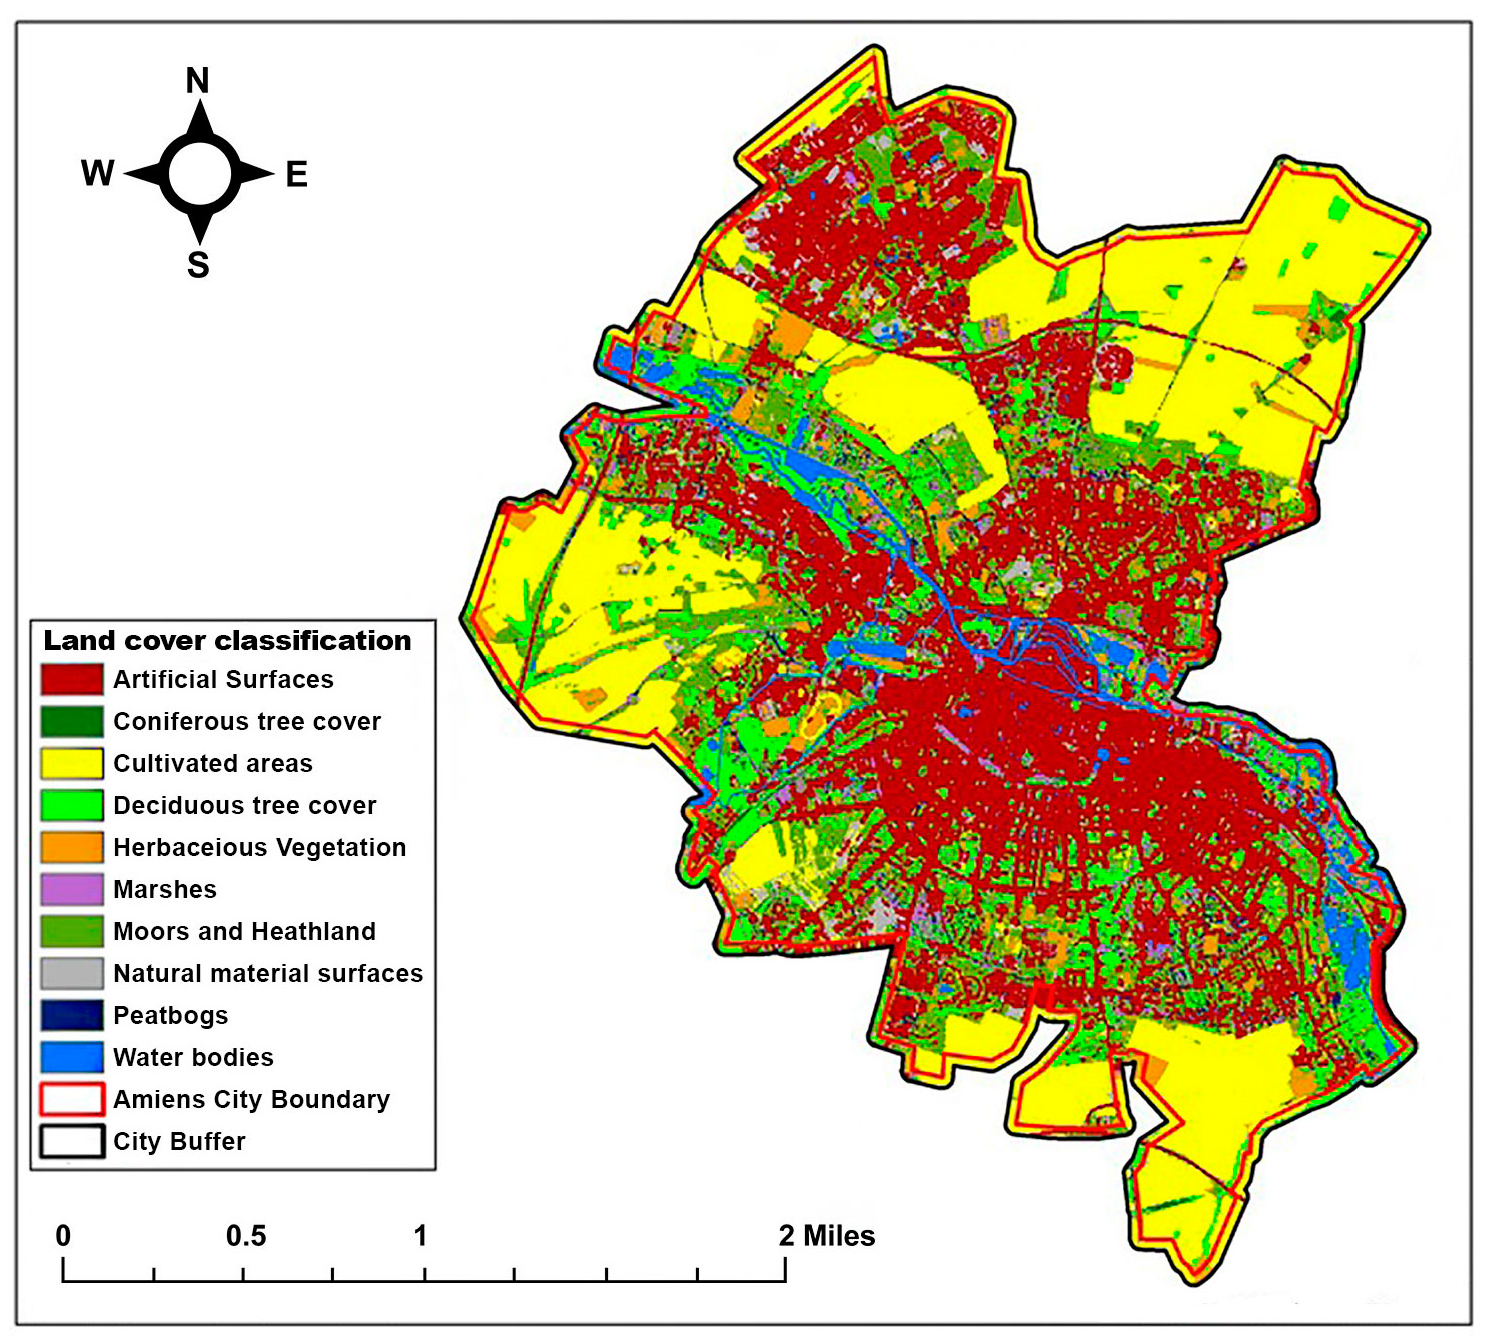
- Land use and land cover (LULC)
- c.
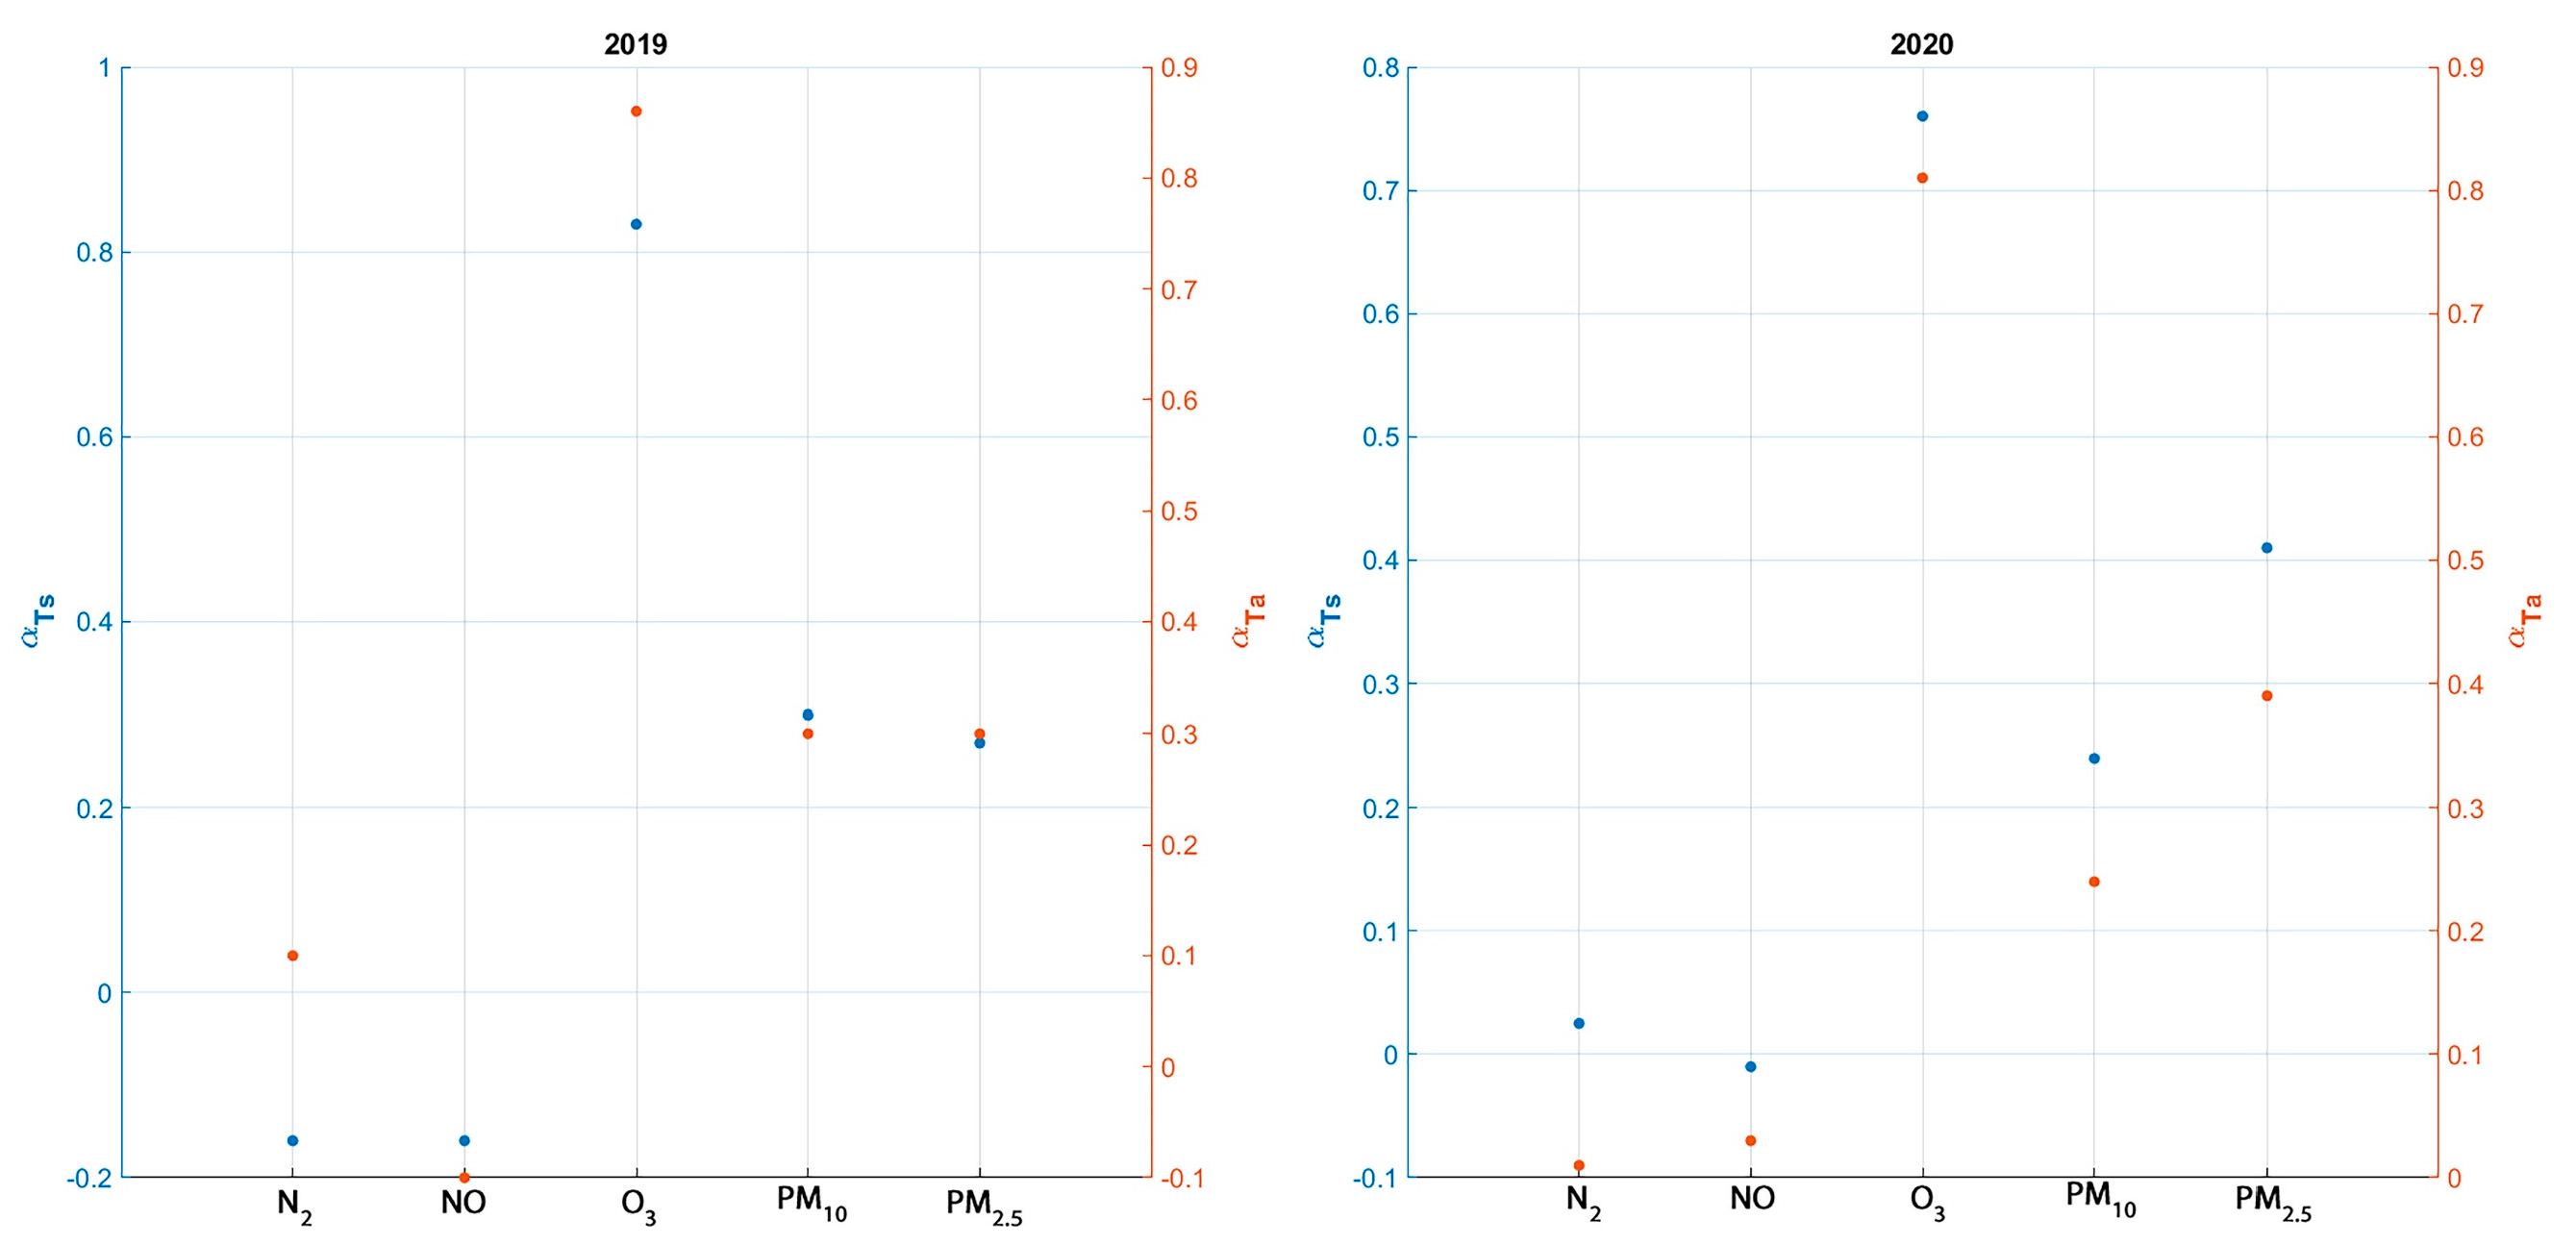
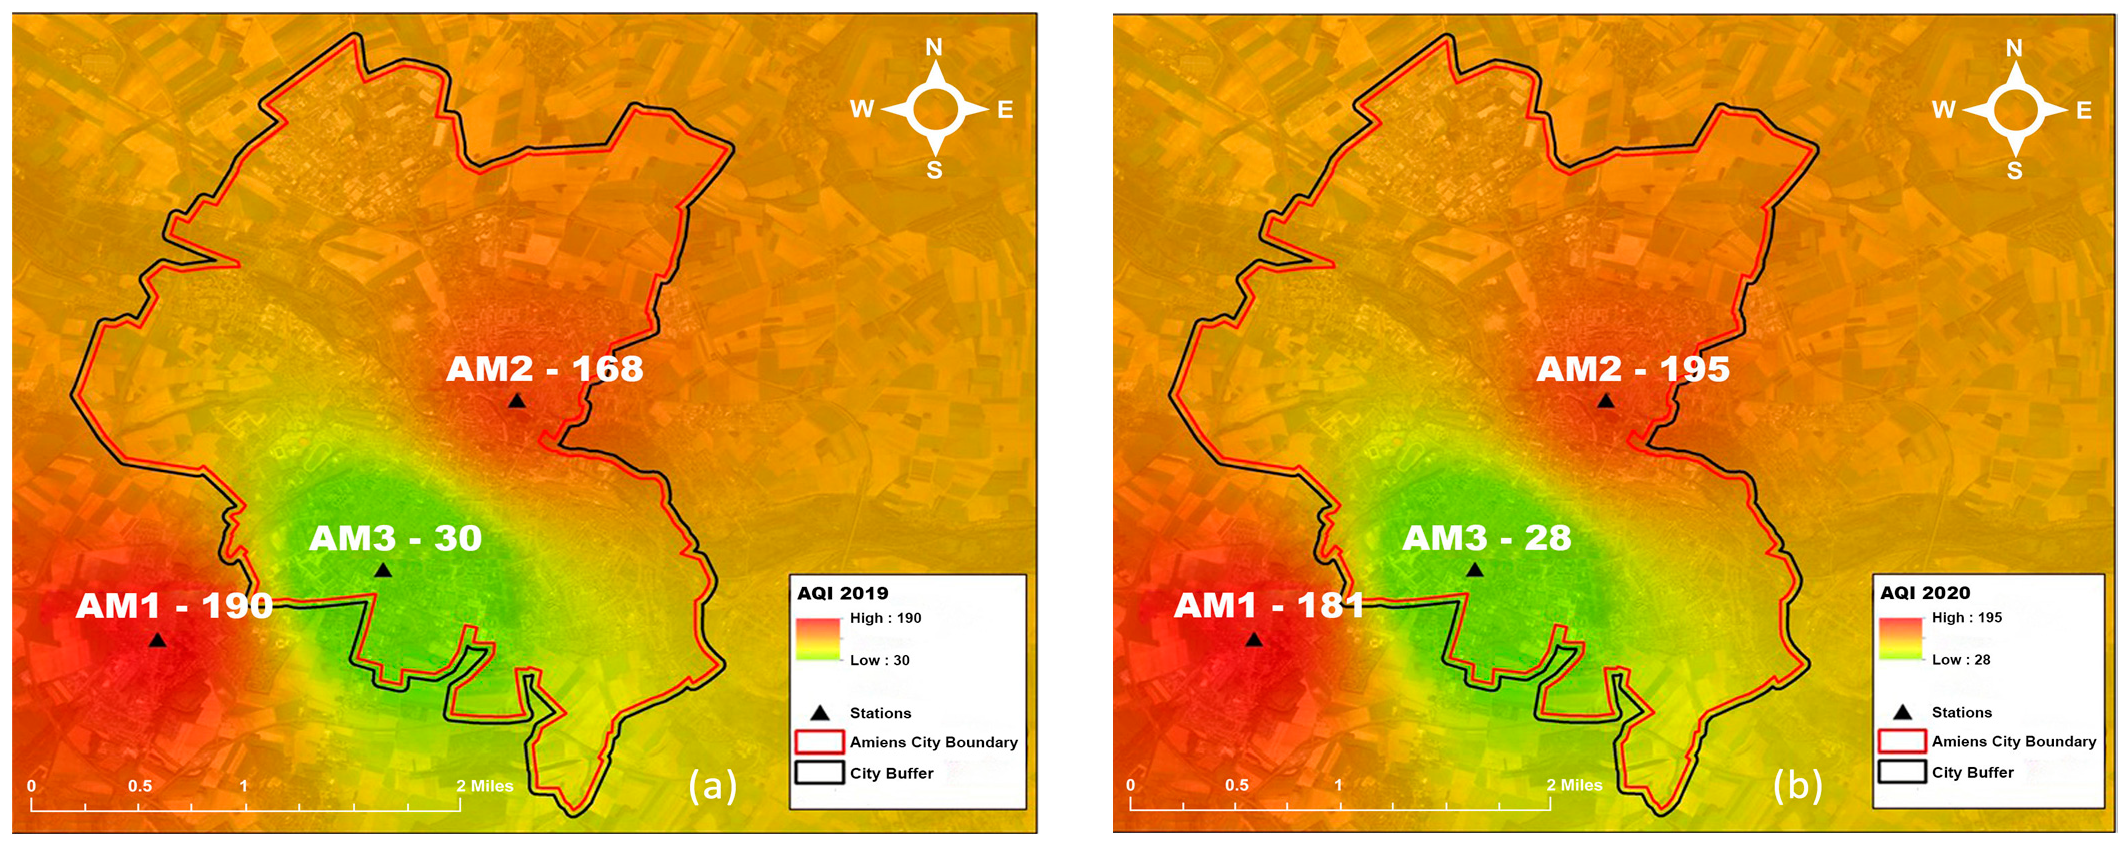
- Air quality
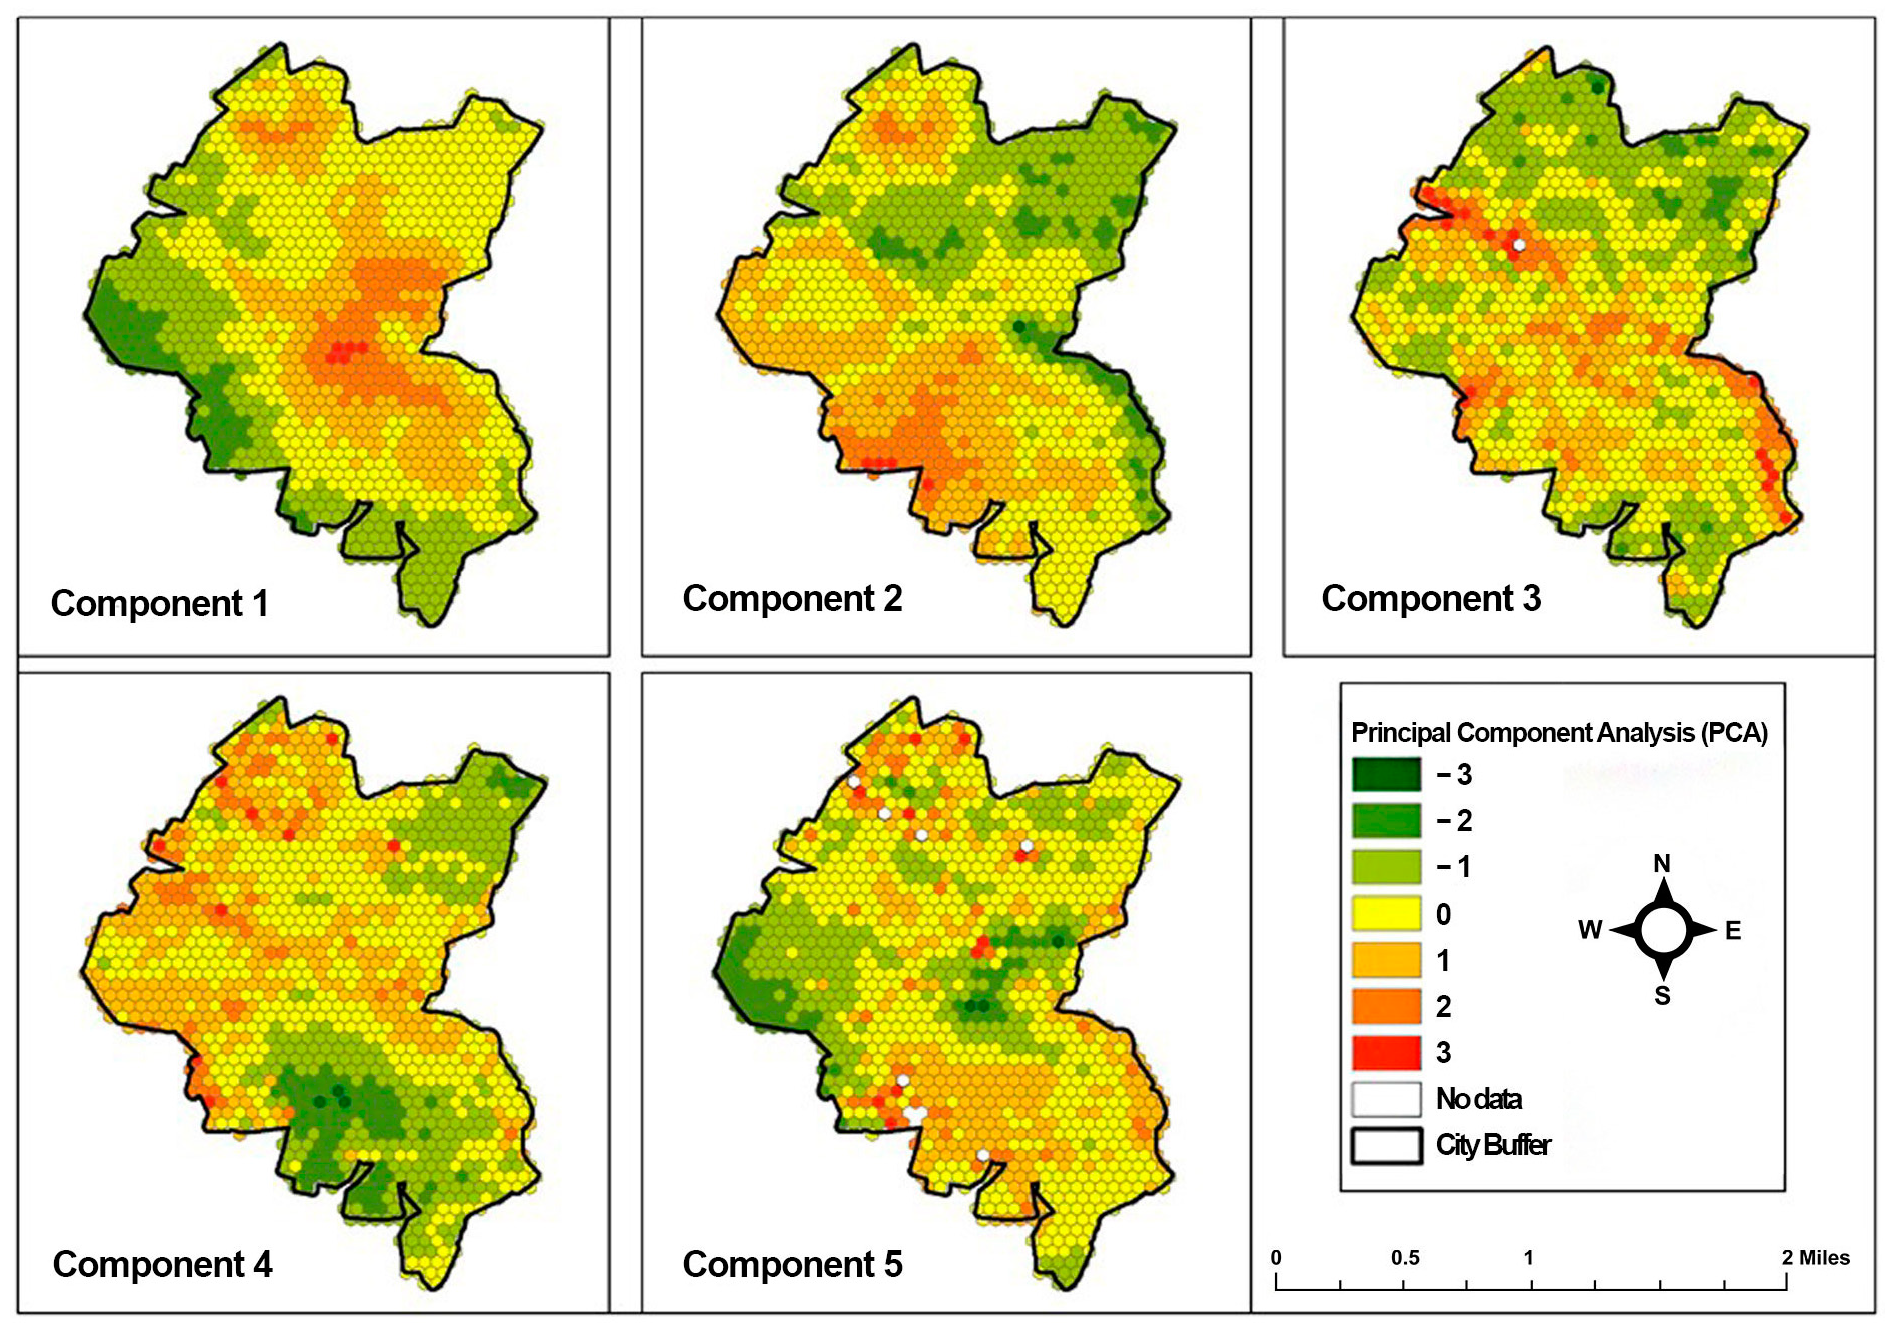
2.2. Principal Component Analysis (PCA)
3. Results
3.1. Data Analysis
3.2. Factor Scores
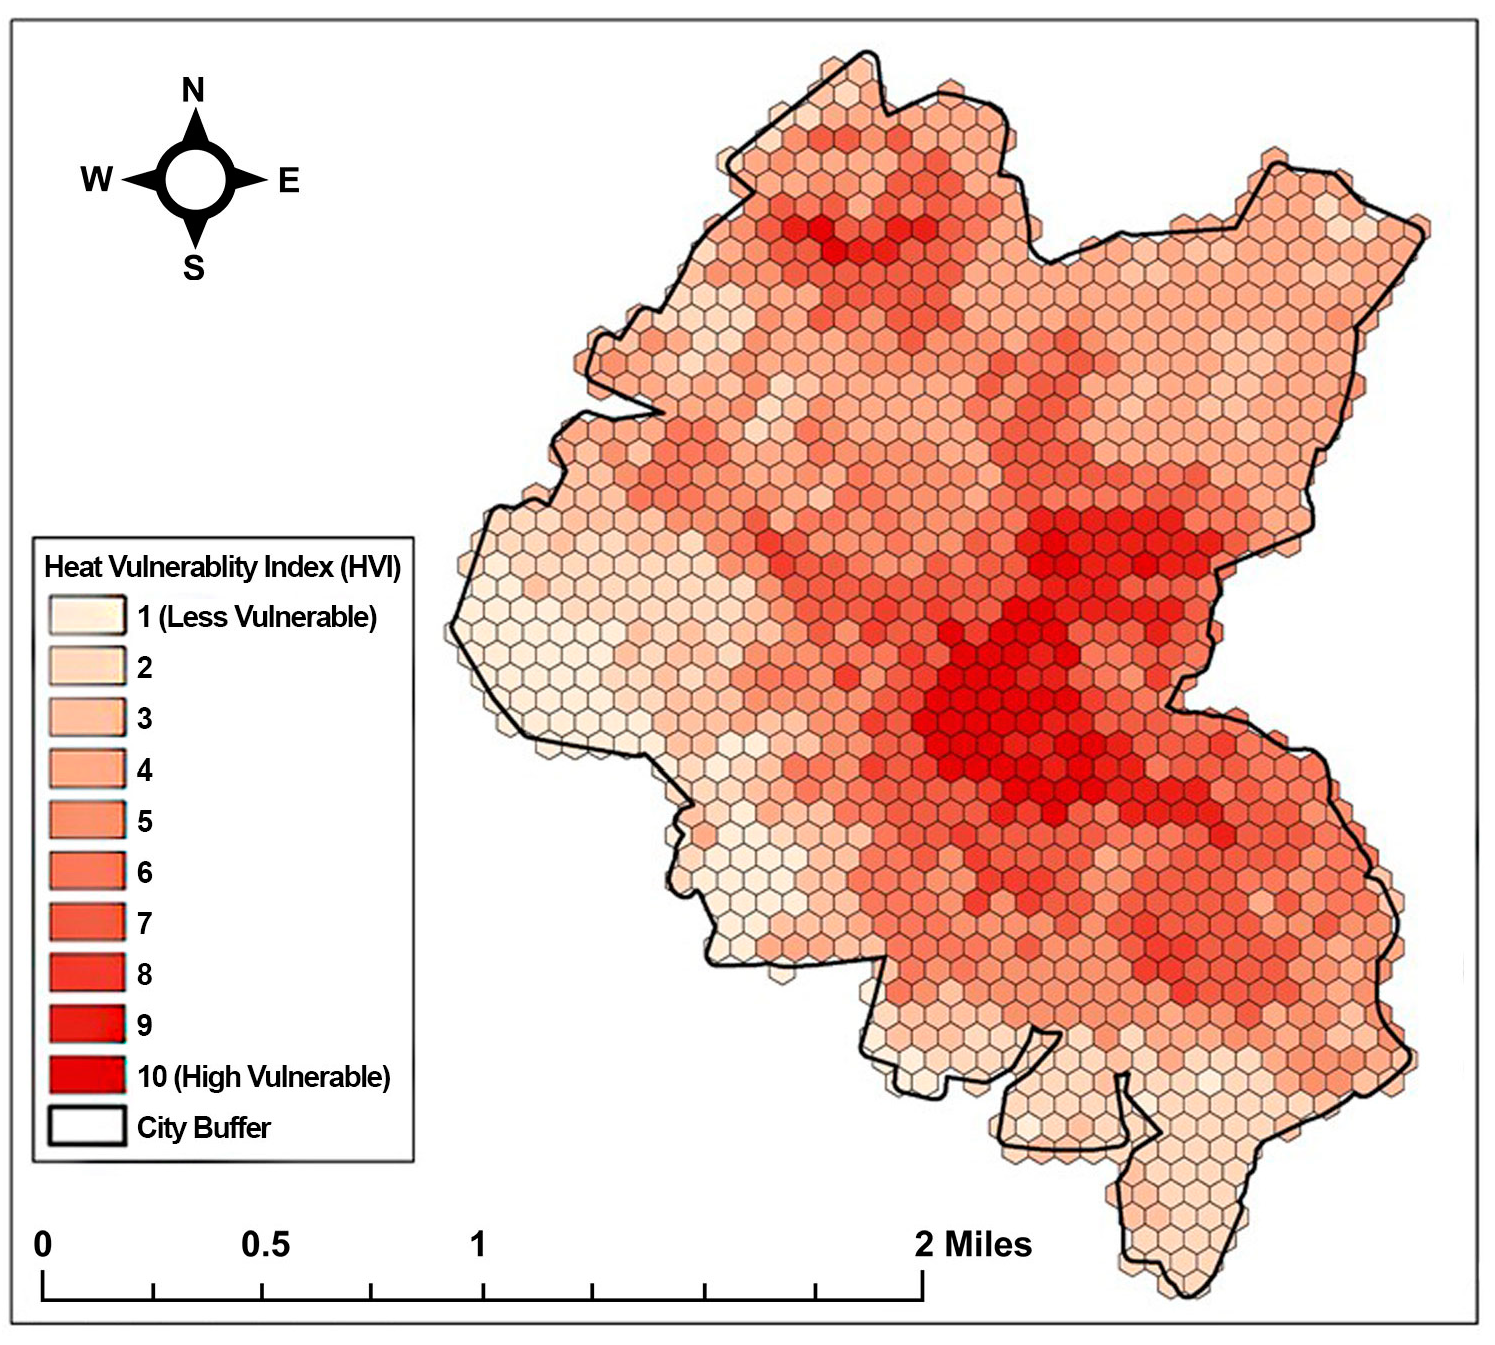
3.3. Spatial Derivation Distribution of Heat Vulnerability Index (HVI)
4. Discussion
- Irregular and limited monitoring stations of weather and air quality;
- Lack of data from heating and cooling facilities.
5. Conclusions
6. Recommendations
- Information provision to local people about heat warnings and precautions, with more attention to vulnerable people;
- Implementation of proactive adaptive practices such as shades, blue infrastructure, and greenery where the HVI score is above 6;
- Regular monitoring during the summer season in the city.
Author Contributions
Funding
Institutional Review Board Statement
Informed Consent Statement
Conflicts of Interest
Appendix A

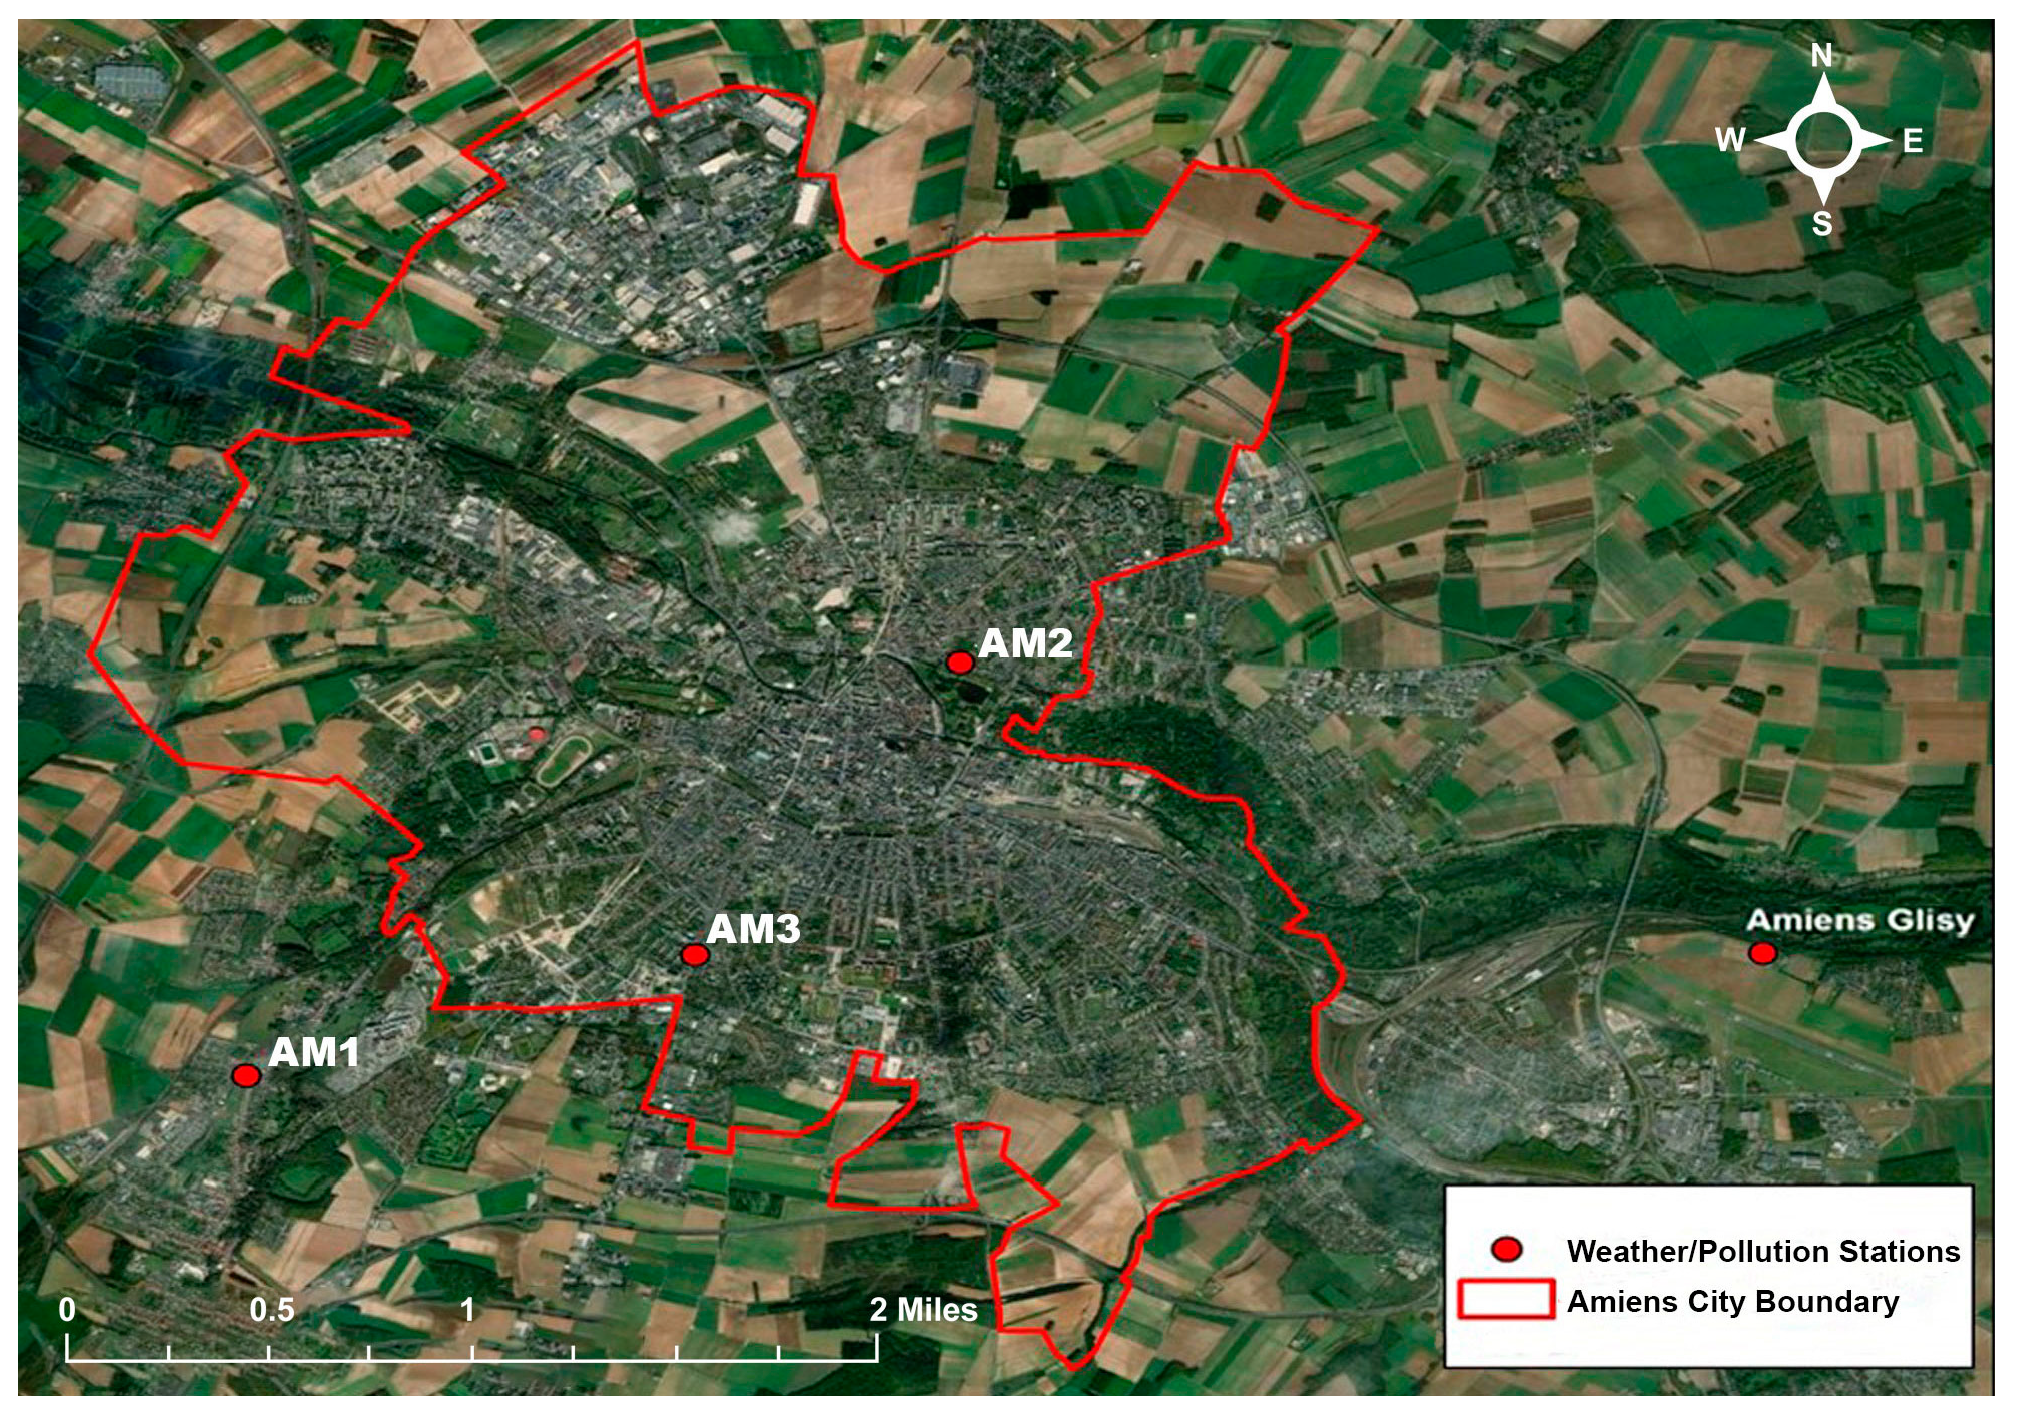
| Name Station | Address of Stations | City | Typology | Remarks |
|---|---|---|---|---|
| AM1 | Rue Anatole France | Salouël | Peri-urban | - |
| AM2 | Parc St Pierre rue Eloi Morel | Amiens | Urban dense | Stopped PM25 monitoring in 2018 |
| AM3 | Avenue du 14 Juillet | Amiens | Traffic route | Stopped PM10 and PM25 monitoring in 2018 |
| Variable | PC1 | PC2 | PC3 | PC4 | PC5 | Uniqueness |
|---|---|---|---|---|---|---|
| NDWI | −0.3153 | −0.4014 | 0.6994 | −0.0494 | 0.116 | 0.2344 |
| NDVI | −0.4412 | −0.3843 | 0.5793 | −0.2461 | 0.0486 | 0.2591 |
| Total population | 0.8145 | 0.4883 | 0.2666 | −0.0608 | −0.1032 | 0.0128 |
| Age ≥65 | 0.8145 | 0.4883 | 0.2666 | −0.0608 | −0.1032 | 0.0128 |
| Age ≥65 + asthma | 0.8145 | 0.4883 | 0.2666 | −0.0608 | −0.1032 | 0.0128 |
| Age ≥65 + respiratory | 0.8145 | 0.4883 | 0.2666 | −0.0608 | −0.1032 | 0.0128 |
| Age ≥65 + cardio | 0.8145 | 0.4883 | 0.2666 | −0.0608 | −0.1032 | 0.0128 |
| Age ≥65 + living alone | 0.8145 | 0.4883 | 0.2666 | −0.0608 | −0.1032 | 0.0128 |
| Artificial surfaces | 0.7689 | 0.4482 | 0.0143 | 0.1858 | 0.0711 | 0.1682 |
| Natural material | 0.0125 | 0.1735 | −0.1649 | 0.4099 | 0.6498 | 0.3523 |
| Water bodies | −0.0301 | −0.2768 | 0.5838 | 0.2811 | 0.113 | 0.4899 |
| Merged vegetation | −0.6601 | −0.343 | −0.2613 | −0.3114 | −0.2607 | 0.2134 |
| Wetlands | 0.0924 | −0.0937 | 0.6548 | 0.0701 | 0.2628 | 0.48 |
| 0.7961 | −0.5903 | −0.0698 | −0.0861 | 0.0679 | 0.0008 | |
| 0.7961 | −0.5903 | −0.0698 | −0.0861 | 0.0679 | 0.0008 | |
| −0.7961 | 0.5903 | 0.0698 | 0.0861 | −0.0679 | 0.0008 | |
| −0.7961 | 0.5903 | 0.0698 | 0.0861 | −0.0679 | 0.0008 | |
| −0.7877 | 0.6026 | 0.0795 | 0.0773 | −0.0605 | 0.0006 | |
| 0.7961 | −0.5903 | −0.0698 | −0.0861 | 0.0679 | 0.0008 | |
| 0.7961 | −0.5903 | −0.0698 | −0.0861 | 0.0679 | 0.0008 | |
| 0.7961 | −0.5903 | −0.0698 | −0.0861 | 0.0679 | 0.0008 | |
| −0.7961 | 0.5903 | 0.0698 | 0.0861 | −0.0679 | 0.0008 | |
| 0.8039 | −0.5772 | −0.0601 | −0.095 | 0.0762 | 0.0021 | |
| Mean elevation | −0.199 | 0.257 | −0.5217 | −0.5109 | 0.1721 | 0.3316 |
| Mean_AQI_2019 | 0.2481 | −0.6447 | −0.1689 | 0.5041 | −0.3919 | 0.0865 |
| Mean_AQI_2020 | 0.3431 | −0.6756 | −0.1677 | 0.4493 | −0.3438 | 0.0777 |
| Illiteracy | 0.8145 | 0.4883 | 0.2666 | −0.0608 | −0.1032 | 0.0128 |
| Poverty | 0.8145 | 0.4883 | 0.2666 | −0.0608 | −0.1032 | 0.0128 |
| LST hottest day 2020 | 0.5975 | 0.5702 | −0.3591 | 0.1494 | 0.1406 | 0.147 |
| LST hottest day 2019 | 0.6638 | 0.5418 | −0.2211 | 0.1996 | 0.1399 | 0.1575 |
| LST hottest day 2018 | 0.3725 | 0.3529 | −0.6882 | −0.0702 | −0.0506 | 0.2555 |
| LST summer mean 2020 | 0.509 | 0.5079 | −0.6212 | 0.0583 | 0.0474 | 0.0915 |
References
- Thompson, R.; Hornigold, R.; Page, L.; Waite, T. Associations between high ambient temperatures and heat waves with mental health outcomes: A systematic review. Public Health 2018, 161, 171–191. [Google Scholar] [CrossRef] [PubMed]
- Dosio, A.; Mentaschi, L.; Fischer, E.M.; Wyser, K. Extreme heat waves under 1.5 C and 2 C global warming. Environ. Res. Lett. 2018, 13, 054006. [Google Scholar] [CrossRef]
- Fouillet, A.; Rey, G.; Laurent, F.; Pavillon, G.; Bellec, S.; Guihenneuc-Jouyaux, C.; Clavel, J.; Jougla, E.; Hémon, D. Excess mortality related to the August 2003 heat wave in France. Int. Arch. Occup. Environ. Health 2006, 80, 16–24. [Google Scholar] [CrossRef] [PubMed]
- Maloney, S.K.; Forbes, C.F. What effect will a few degrees of climate change have on human heat balance? Implications for human activity. Int. J. Biometeorol. 2011, 55, 147–160. [Google Scholar] [CrossRef] [PubMed]
- Field, C.B.; Barros, V.; Stocker, T.F.; Qin, D.; Dokken, D.J.; Ebi, K.L.; Mastrandrea, M.D.; Mach, K.J.; Plattner, G.-K.; Allen, S.K.; et al. Managing the Risks of Extreme Events and Disasters to Advance Climate Change Adaptation: Special Report of the Intergovernmental Panel on Climate Change; Cambridge University Press: Cambridge, UK, 2012. [Google Scholar]
- Poumadere, M.; Mays, C.; Mer, S.L.; Blong, R. The 2003 heat wave in France: Dangerous climate change here and now. Risk Anal. Int. J. 2005, 25, 1483–1494. [Google Scholar] [CrossRef] [PubMed]
- Kosatsky, T. The 2003 European heat waves. Eurosurveillance 2005, 10, 3–4. [Google Scholar] [CrossRef] [PubMed]
- Pascal, M.; Wagner, V.; Corso, M.; Laaidi, K.; Ung, A.; Beaudeau, P. Heat and cold related-mortality in 18 French cities. Environ. Int. 2018, 121, 189–198. [Google Scholar] [CrossRef] [PubMed]
- Heat and Health. Available online: https://www.eea.europa.eu/data-and-maps/indicators/heat-and-health/heat-and-health-assessment-published (accessed on 22 April 2022).
- Weather Amiens, Meteo France. Available online: https://meteofrance.com/previsions-meteo-france/amiens/80000 (accessed on 16 January 2021).
- Trends in Temperature since 1900 in and around Amiens. Available online: https://do49kvm5ac8w.cloudfront.net/cititexts2019/es/Amiens.html (accessed on 6 December 2021).
- Karimi, M.; Nazari, R.; Dutova, D.; Khanbilvardi, R.; Ghandehari, M. A conceptual framework for environmental risk and social vulnerability assessment in complex urban settings. Urban Clim. 2018, 26, 161–173. [Google Scholar] [CrossRef]
- City of Philadelphia. Available online: https://www.phila.gov/2019-07-16-heat-vulnerability-index-highlights-city-hot-spots/ (accessed on 16 July 2019).
- Wolf, T.; McGregor, G. The development of a heat wave vulnerability index for London, United Kingdom. Weather. Clim. Extrem. 2013, 1, 59–68. [Google Scholar] [CrossRef]
- Bodilis, C.; Yenneti, K.; Hawken, S. (2018): Heat Vulnerability Index for Sydney. City Futures Research Centre, UNSW Sydney. Dataset. Available online: https://cityfutures.ada.unsw.edu.au/cityviz/heat-vulnerability-index-sydney/ (accessed on 12 December 2021).
- Sabrin, S.; Karimi, M.; Nazari, R. Developing Vulnerability Index to Quantify Urban Heat Islands Effects Coupled with Air Pollution: A Case Study of Camden, NJ. ISPRS Int. J. Geo-Inf. 2020, 9, 349. [Google Scholar] [CrossRef]
- Mallen, E.; Stone, B.; Lanza, K. A methodological assessment of extreme heat mortality modeling and heat vulnerability mapping in Dallas, Texas. Urban Clim. 2019, 30, 100528. [Google Scholar] [CrossRef]
- France Population. Available online: https://www.worldpop.org/geodata/summary?id=26330 (accessed on 2 July 2021).
- Muncipality of Ameins. Available online: https://www.insee.fr/fr/statistiques/2011101?geo=COM-80021 (accessed on 8 December 2021).
- City Population. Available online: https://www.citypopulation.de/en/france/somme/amiens/80021__amiens/ (accessed on 2 July 2021).
- Jounieaux, V.; Guillaume, C.; Malka, M.; Wursthorn, M.; Girod, I.; Baron-Papillon, F. Evaluation médico-économique d’un programme de prise en charge de patients asthmatiques. St. Publique 2003, 15, 449–464. [Google Scholar] [CrossRef]
- Tribouilloy, C.; Rusinaru, D.; Mahjoub, H.; Goissen, T.; Lévy, F.; Peltier, M. Impact of echocardiography in patients hospitalized for heart failure: A prospective observational study. Arch. Cardiovasc. Dis. 2008, 101, 465–473. [Google Scholar] [CrossRef] [PubMed]
- Eurostat. Available online: https://ec.europa.eu/eurostat/web/products-eurostat-news/-/edn-20210924-1 (accessed on 21 August 2020).
- Euro Statistics. Available online: https://ec.europa.eu/eurostat/statistics-explained/index.php?title=File:Share_of_the_population_reporting_that_they_had_chronic_lower_respiratory_diseases_(excluding_asthma),_2014_(%25)_Health20.png (accessed on 21 August 2020).
- Halima, The City of Amiens Watches over Our Seniors. Available online: https://france3-regions.francetvinfo.fr/hauts-de-france/picardie/somme/amiens/ville-amiens-veille-nos-aines-781919.html (accessed on 8 December 2020).
- Atmo Hauts de France. Available online: https://www.atmo-hdf.fr/ (accessed on 8 April 2021).
- ESRI, ARCGIS Software. Available online: https://www.esri.com/en-us/arcgis/products/unlock-earths-secrets (accessed on December 2021).
- USGS Science for Changing World. Available online: https://earthexplorer.usgs.gov/ (accessed on 21 October 2020).
- Landsat Collection 2 Surface Temperature. Available online: https://www.usgs.gov/landsat-missions/landsat-collection-2-surface-temperature (accessed on December 2021).
- Ivajnšič, D.; Kaligarič, M.; Žiberna, I. Geographically weighted regression of the urban heat island of a small city. Appl. Geogr. 2014, 53, 341–353. [Google Scholar] [CrossRef]
- Air Quality Index Calculator. Available online: https://www.airnow.gov/aqi/aqi-calculator-concentration/ (accessed on 10 May 2021).
- Li, L.; Liu, S.; Peng, Y.; Sun, Z. Overview of principal component analysis algorithm. Optik 2016, 127, 3935–3944. [Google Scholar] [CrossRef]
- Watts, N.; Amann, M.; Arnell, N.; Ayeb-Karlsson, S.; Beagley, J.; Belesova, K.; Boykoff, M.; Byass, P.; Cai, W.; Campbell-Lendrum, D.; et al. The 2020 report of the Lancet Countdown on health and climate change: Responding to converging crises. Lancet 2021, 397, 129–170. [Google Scholar] [CrossRef]
- Van de Walle, J.; Brousse, O.; Arnalsteen, L.; Brimicombe, C.; Byarugaba, D.; Demuzere, M.; Jjemba, E.; Lwasa, S.; Misiani, H.; Nsangi, G.; et al. Lack of vegetation exacerbates exposure to dangerous heat in dense settlements in a tropical African city. Environ. Res. Lett. 2022, 17, 024004. [Google Scholar] [CrossRef]
- Bhattacharjee, P.K. Global warming impact on the earth. Int. J. Environ. Sci. Dev. 2010, 1, 219. [Google Scholar] [CrossRef]


| Factors | Estimated Statistics | Year | Source | Reference |
|---|---|---|---|---|
| Poverty rate | 15% (17,045 habitants) | 2020 | French Newspaper “Courrier Picard” 2020 | - |
| Elderly population >65 | 19% (25,246) | 2014 | National Institute of Statistics in France—INSEE | [19] |
| Illiteracy rate (no diploma aged >15 years) | 22% | 2015 | Municipality of Amiens City population | [20] |
| Illness ratio of the elderly population | 28 out of every 200 patients | 2000 | Insurance company survey | [21] |
| Cardiovascular patients | 799 Elder = 112 | 2008 | Research paper | [22] |
| Asthma patients | 8% Total = (10,629) Elders = 1400 | 2014 | Eurostat | [23,24] |
| Other respiratory diseases excluding asthma | 6% Total = 7972 Elders = 1100 | |||
| Socially vulnerable elders in the summer | 2000 | 2014 | Article: “The city of Amiens watches over our seniors” | [25] |
| S.No. | Class | Area (%) | Category for PCA | Total Area (%) |
|---|---|---|---|---|
| 1 | Artificial surfaces | 31.65 | Built-up area | 31.65 |
| 2 | Coniferous tree cover | 1.17 | Vegetation | 56.88 |
| 3 | Cultivated areas | 26.69 | ||
| 4 | Deciduous tree cover | 9.29 | ||
| 5 | Herbaceous vegetation | 3.93 | ||
| 6 | Moors and heathland | 15.80 | ||
| 7 | Natural material surfaces | 1.99 | Open areas | 1.99 |
| 8 | Marshes | 4.68 | Wetlands | 2.22 |
| 9 | Peatbogs | 2.54 | ||
| 10 | Water bodies | 2.26 | Water | 2.26 |
| Total | 100 | 100 |
| Extraction Sums of Squared Loadings | ||||
|---|---|---|---|---|
| Factors | Eigenvalue | Difference | Proportion | Cumulative |
| 1 | 14.39 | 6.31 | 0.45 | 0.44 |
| 2 | 8.07 | 4.40 | 0.25 | 0.70 |
| 3 | 3.67 | 2.33 | 0.11 | 0.81 |
| 4 | 1.34 | 0.27 | 0.04 | 0.85 |
| 5 | 1.07 | 0.26 | 0.03 | 0.89 |
Publisher’s Note: MDPI stays neutral with regard to jurisdictional claims in published maps and institutional affiliations. |
© 2022 by the authors. Licensee MDPI, Basel, Switzerland. This article is an open access article distributed under the terms and conditions of the Creative Commons Attribution (CC BY) license (https://creativecommons.org/licenses/by/4.0/).
Share and Cite
Qureshi, A.M.; Rachid, A. Heat Vulnerability Index Mapping: A Case Study of a Medium-Sized City (Amiens). Climate 2022, 10, 113. https://doi.org/10.3390/cli10080113
Qureshi AM, Rachid A. Heat Vulnerability Index Mapping: A Case Study of a Medium-Sized City (Amiens). Climate. 2022; 10(8):113. https://doi.org/10.3390/cli10080113
Chicago/Turabian StyleQureshi, Aiman Mazhar, and Ahmed Rachid. 2022. "Heat Vulnerability Index Mapping: A Case Study of a Medium-Sized City (Amiens)" Climate 10, no. 8: 113. https://doi.org/10.3390/cli10080113
APA StyleQureshi, A. M., & Rachid, A. (2022). Heat Vulnerability Index Mapping: A Case Study of a Medium-Sized City (Amiens). Climate, 10(8), 113. https://doi.org/10.3390/cli10080113