
Improving Future Estimation of Cheliff-Mactaa-Tafna Streamflow via an Ensemble of Bias Correction Approaches

 ,
,
Abstract
:1. Introduction
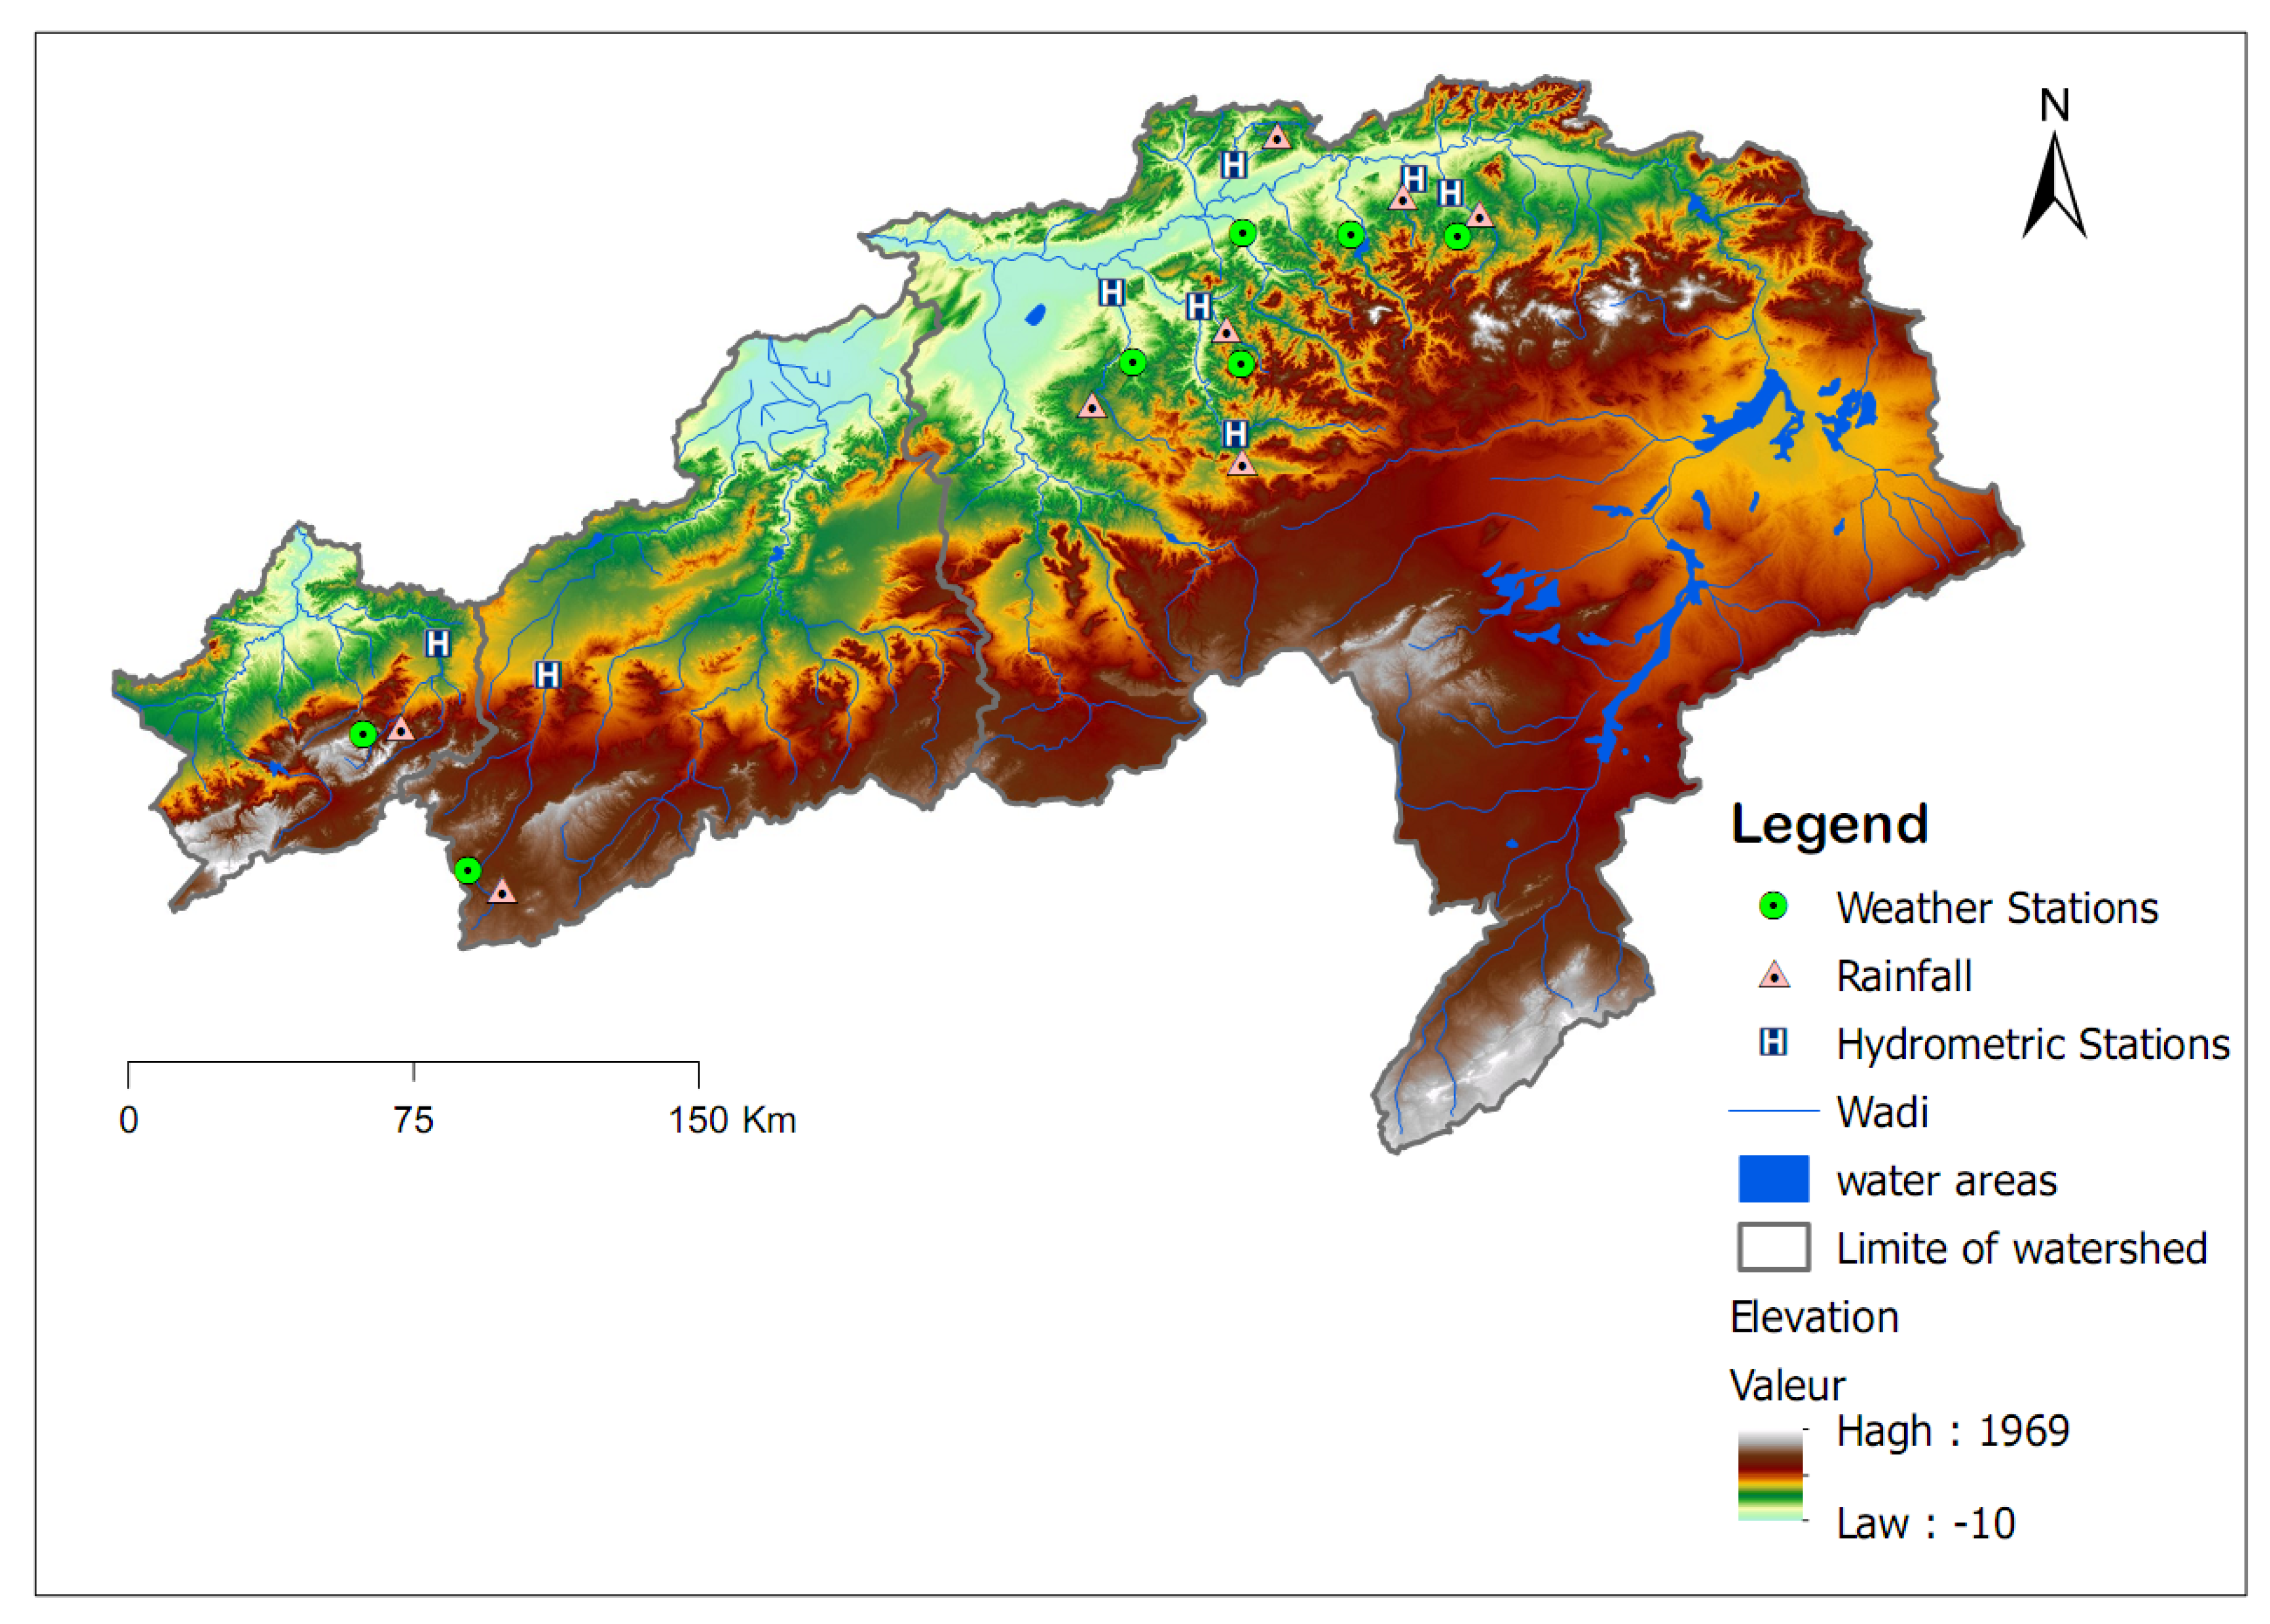
2. Study Area
2.1. The Basin of Macta
2.2. The Basin of Tafna
3. Dataset Used
3.1. Hydrological Model Data
3.2. Streamflow/River Discharge Data
3.3. Climate Scenario Data and Bias Correction Method
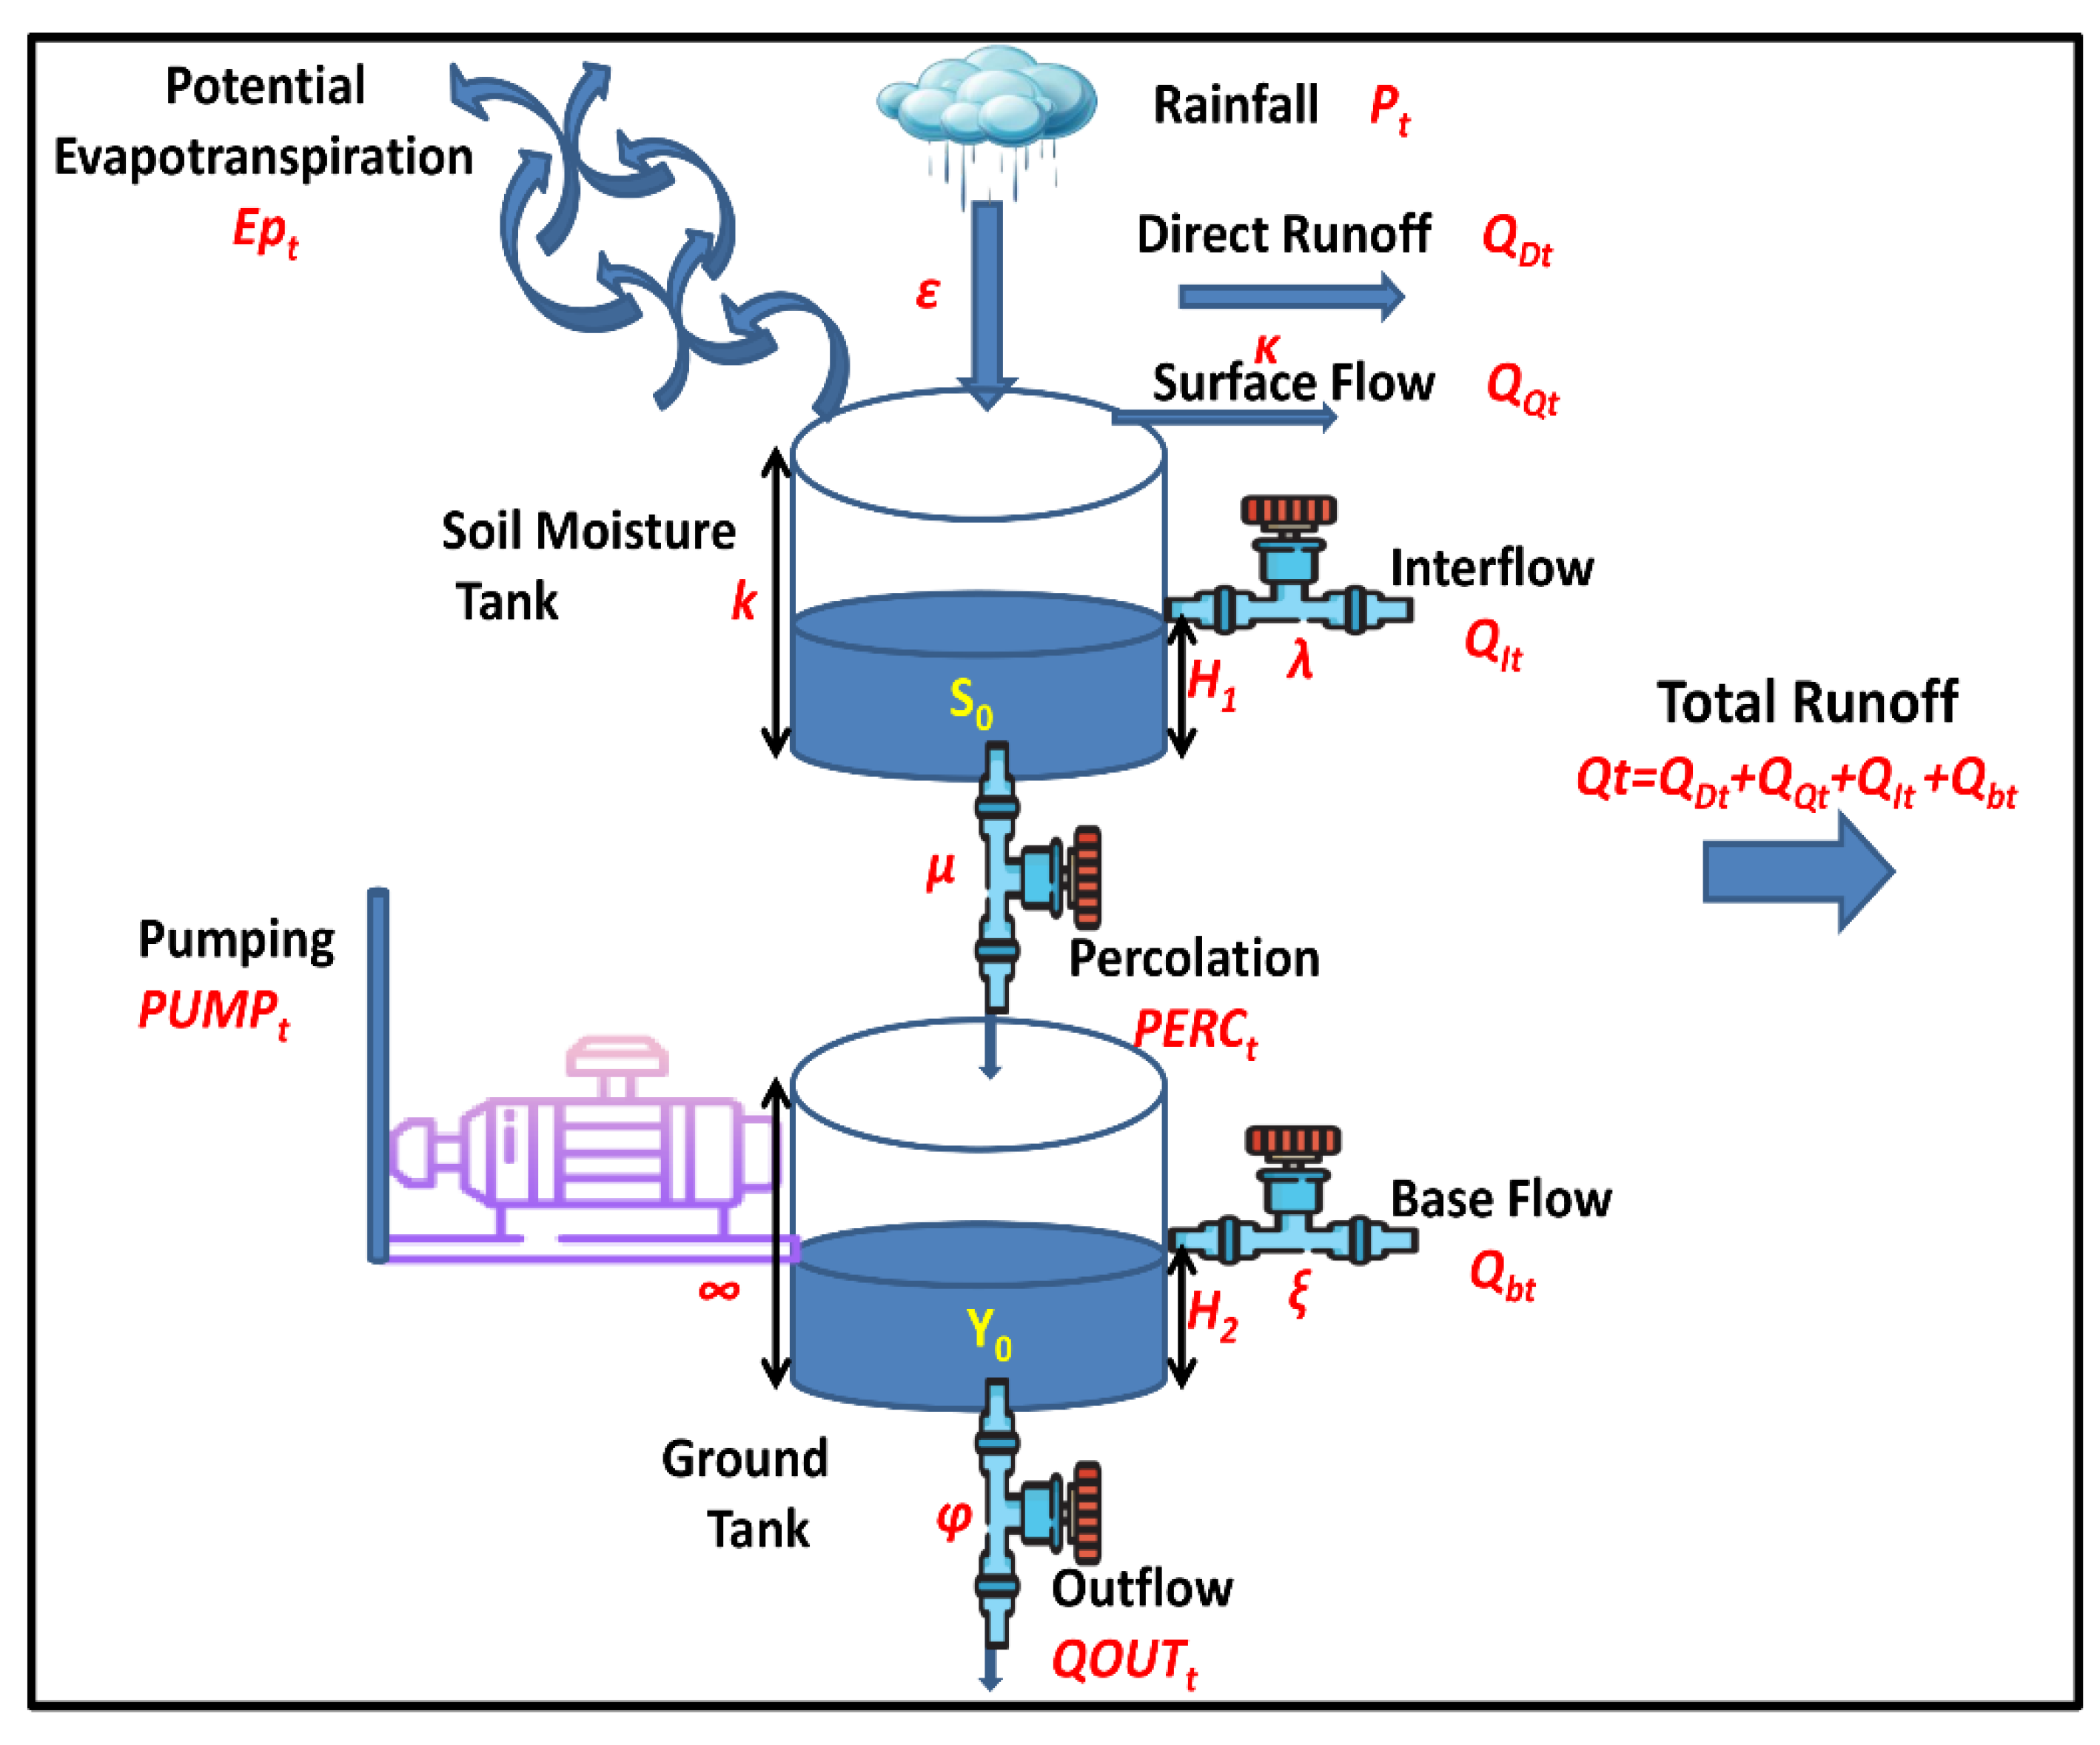
3.4. Hydrological Modeling Using Zygos
3.5. Parameter’s Description
3.6. Performance Criteria
4. Results
4.1. Parameter of Simulation
4.2. Changes in Evapotranspiration
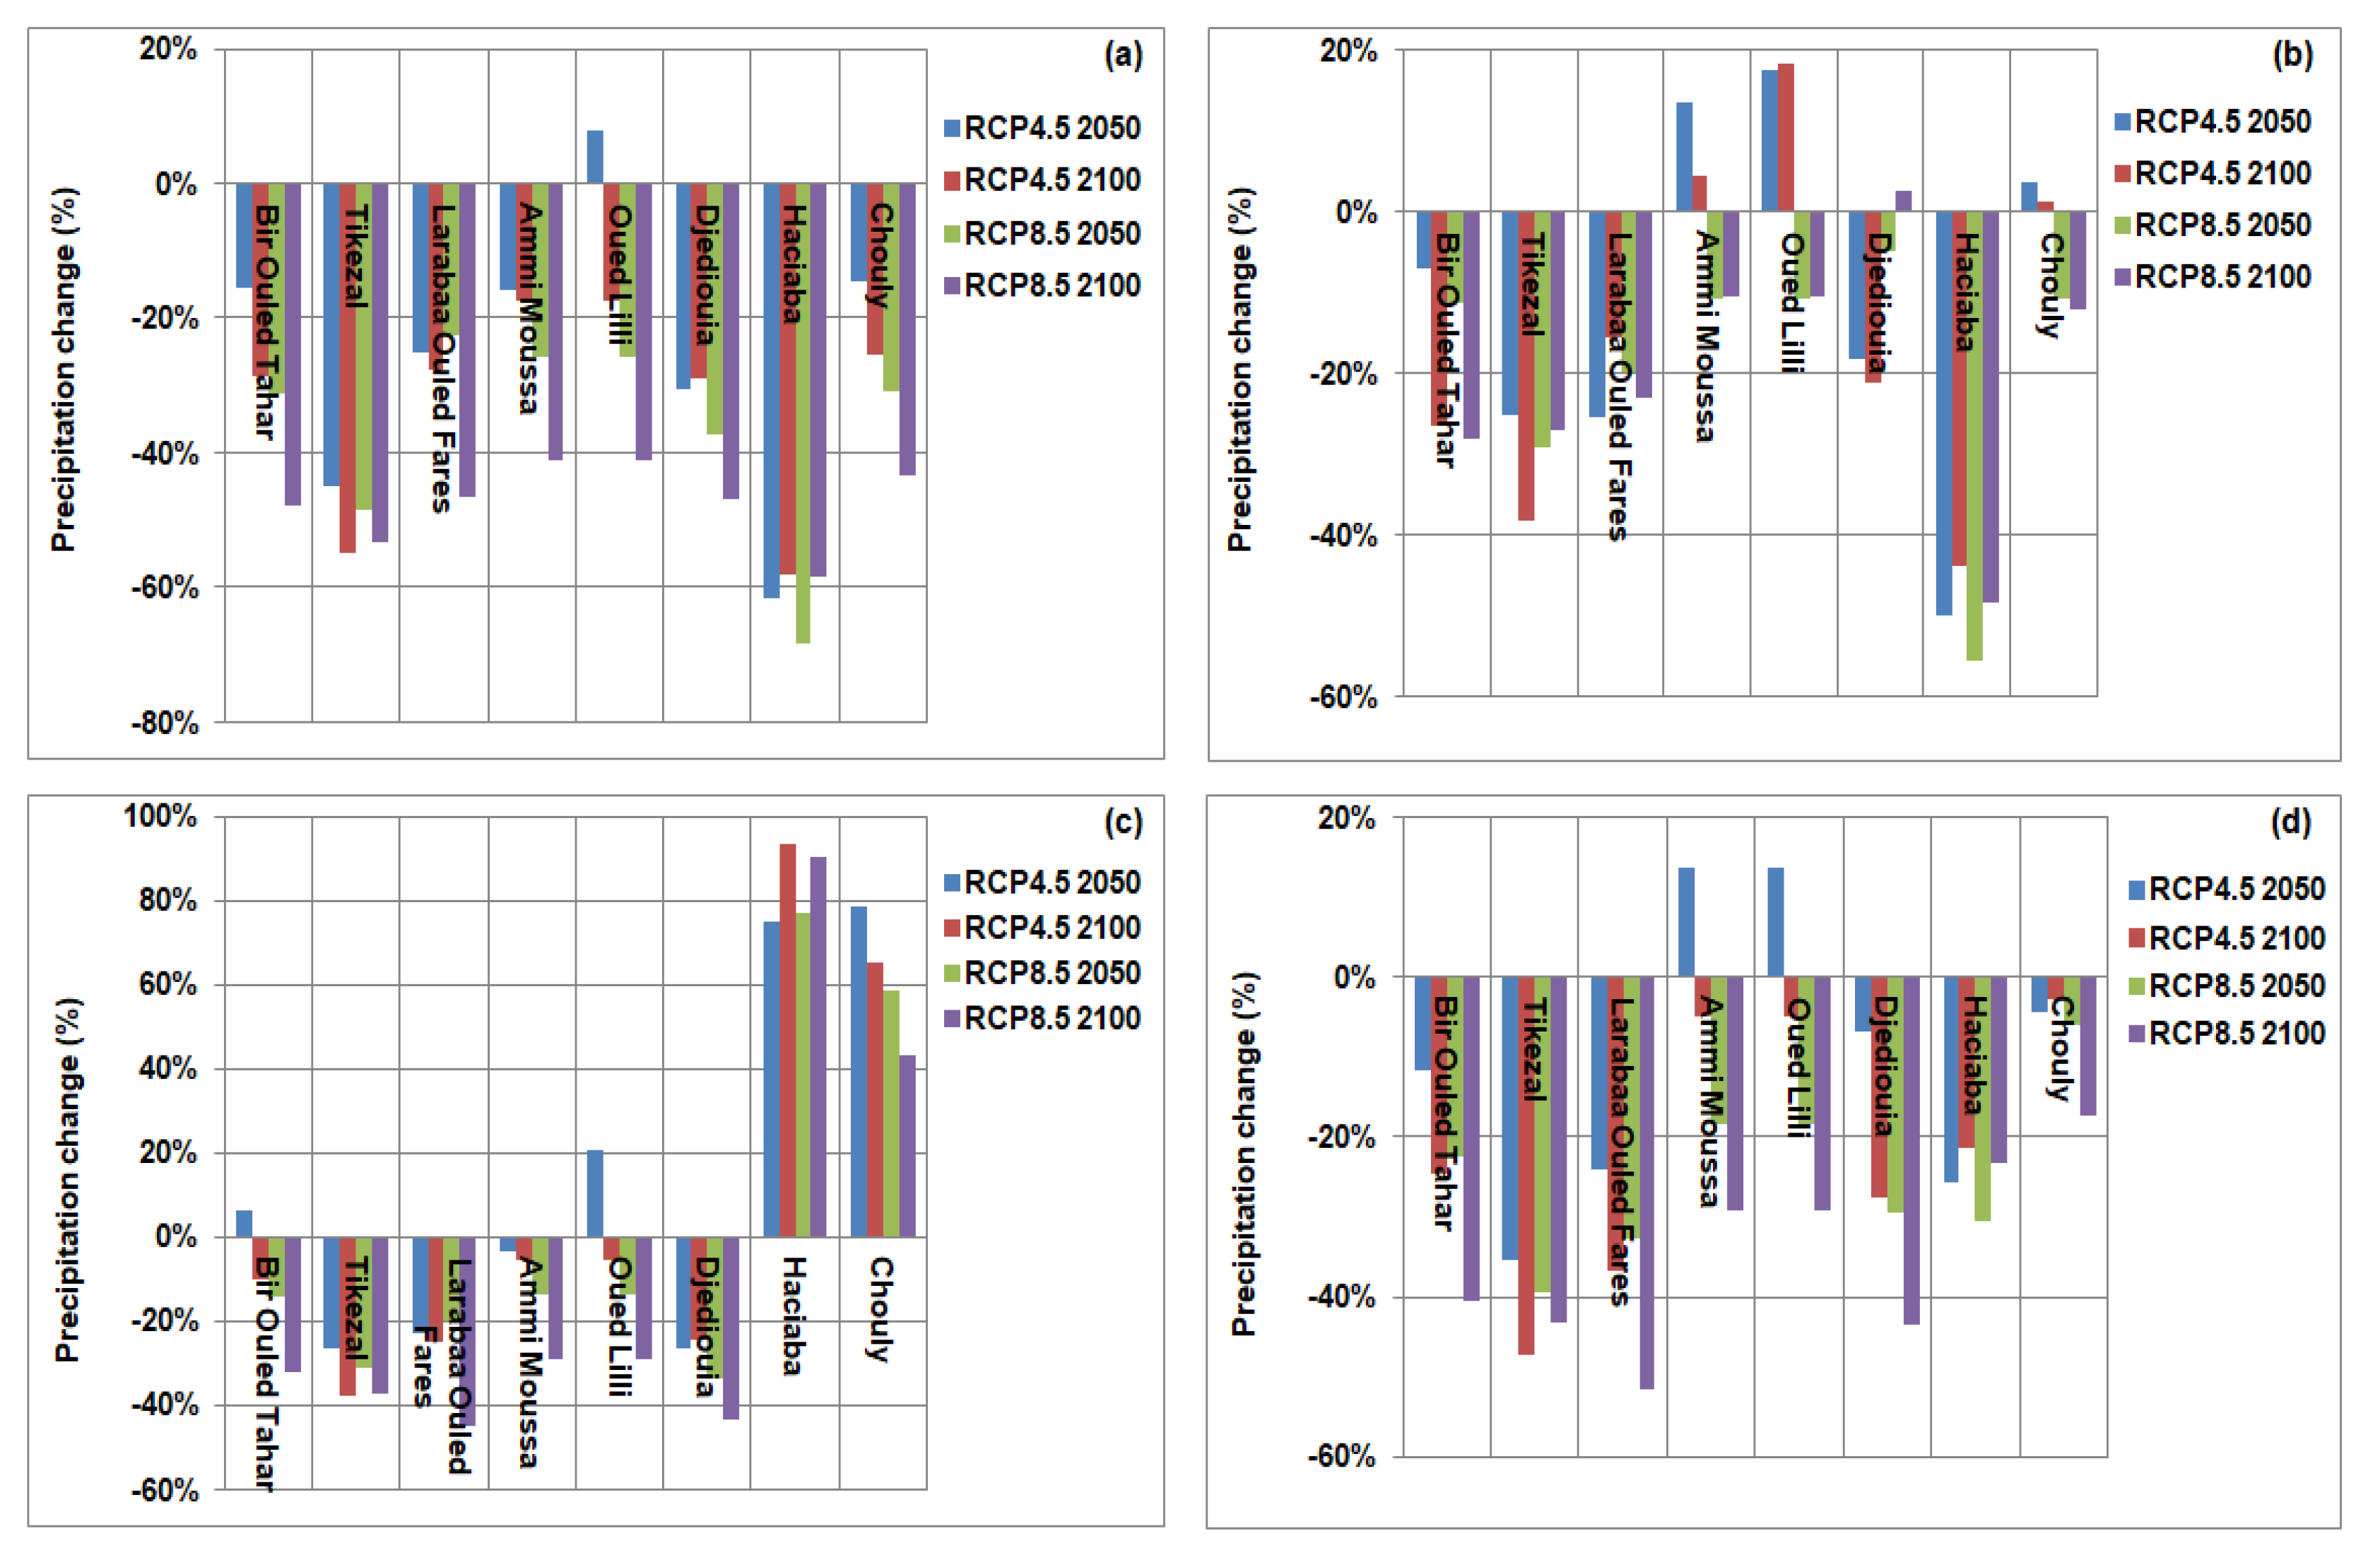
4.3. Projected Precipitation
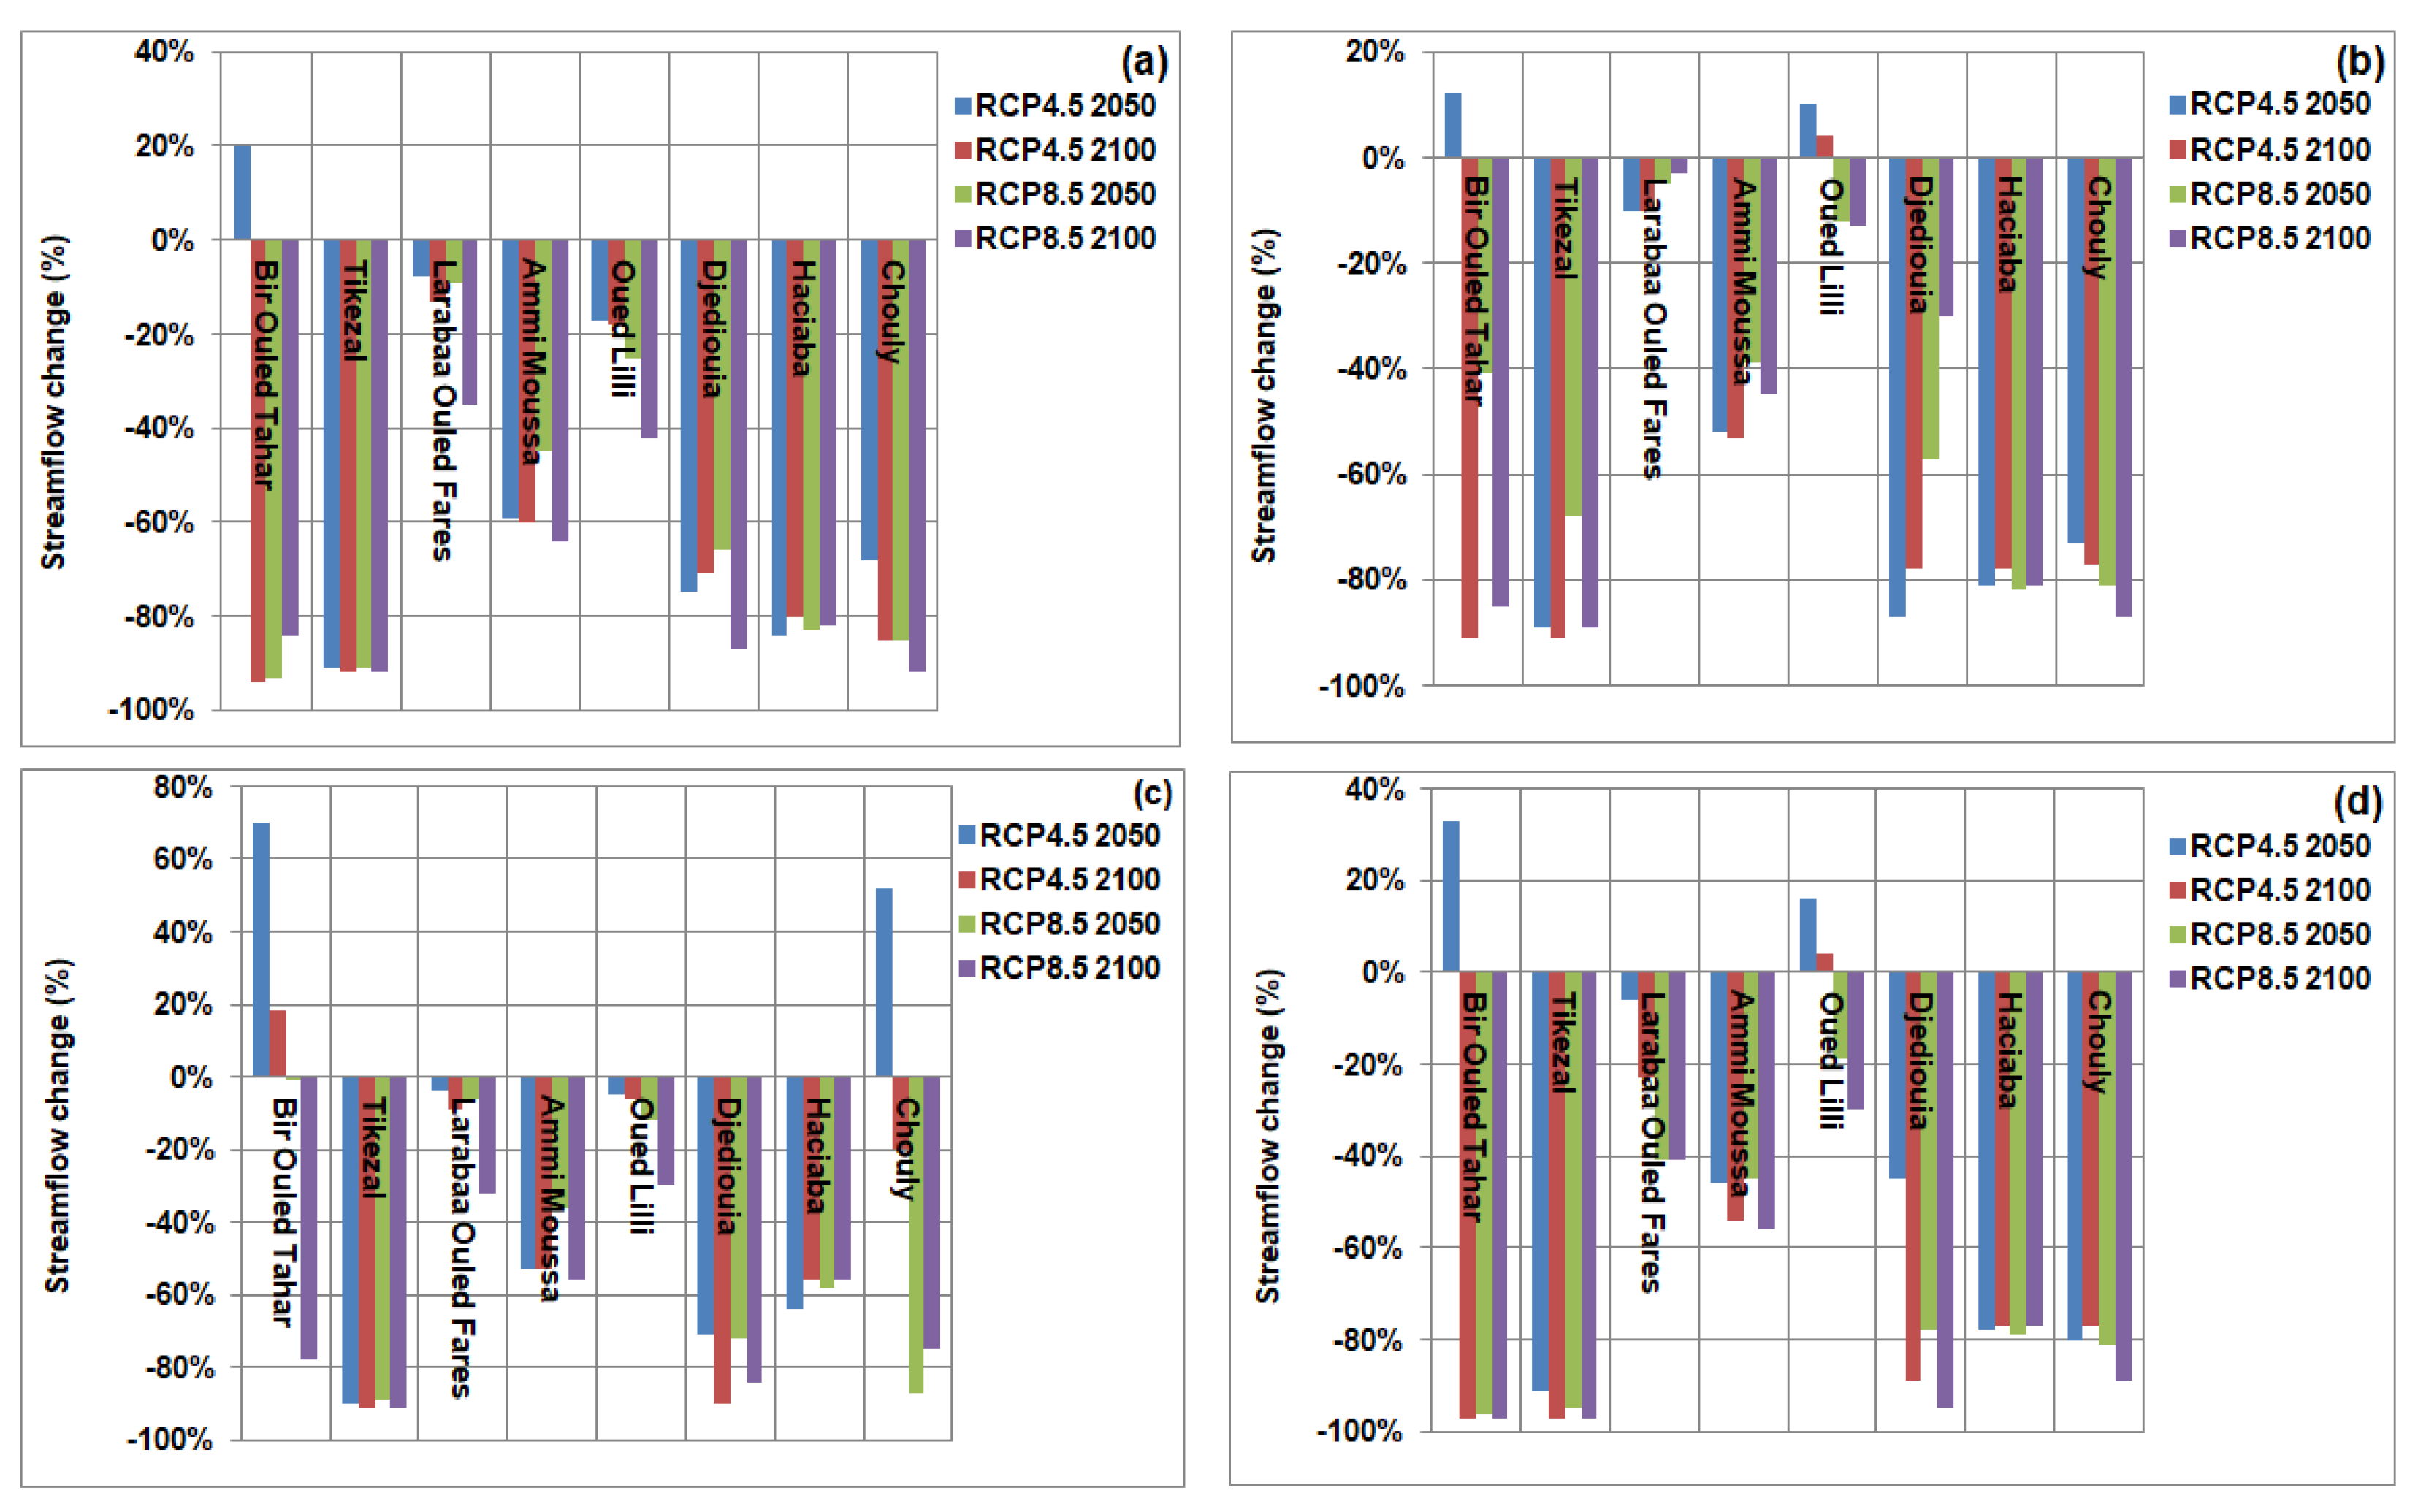
4.4. Streamflow Projected
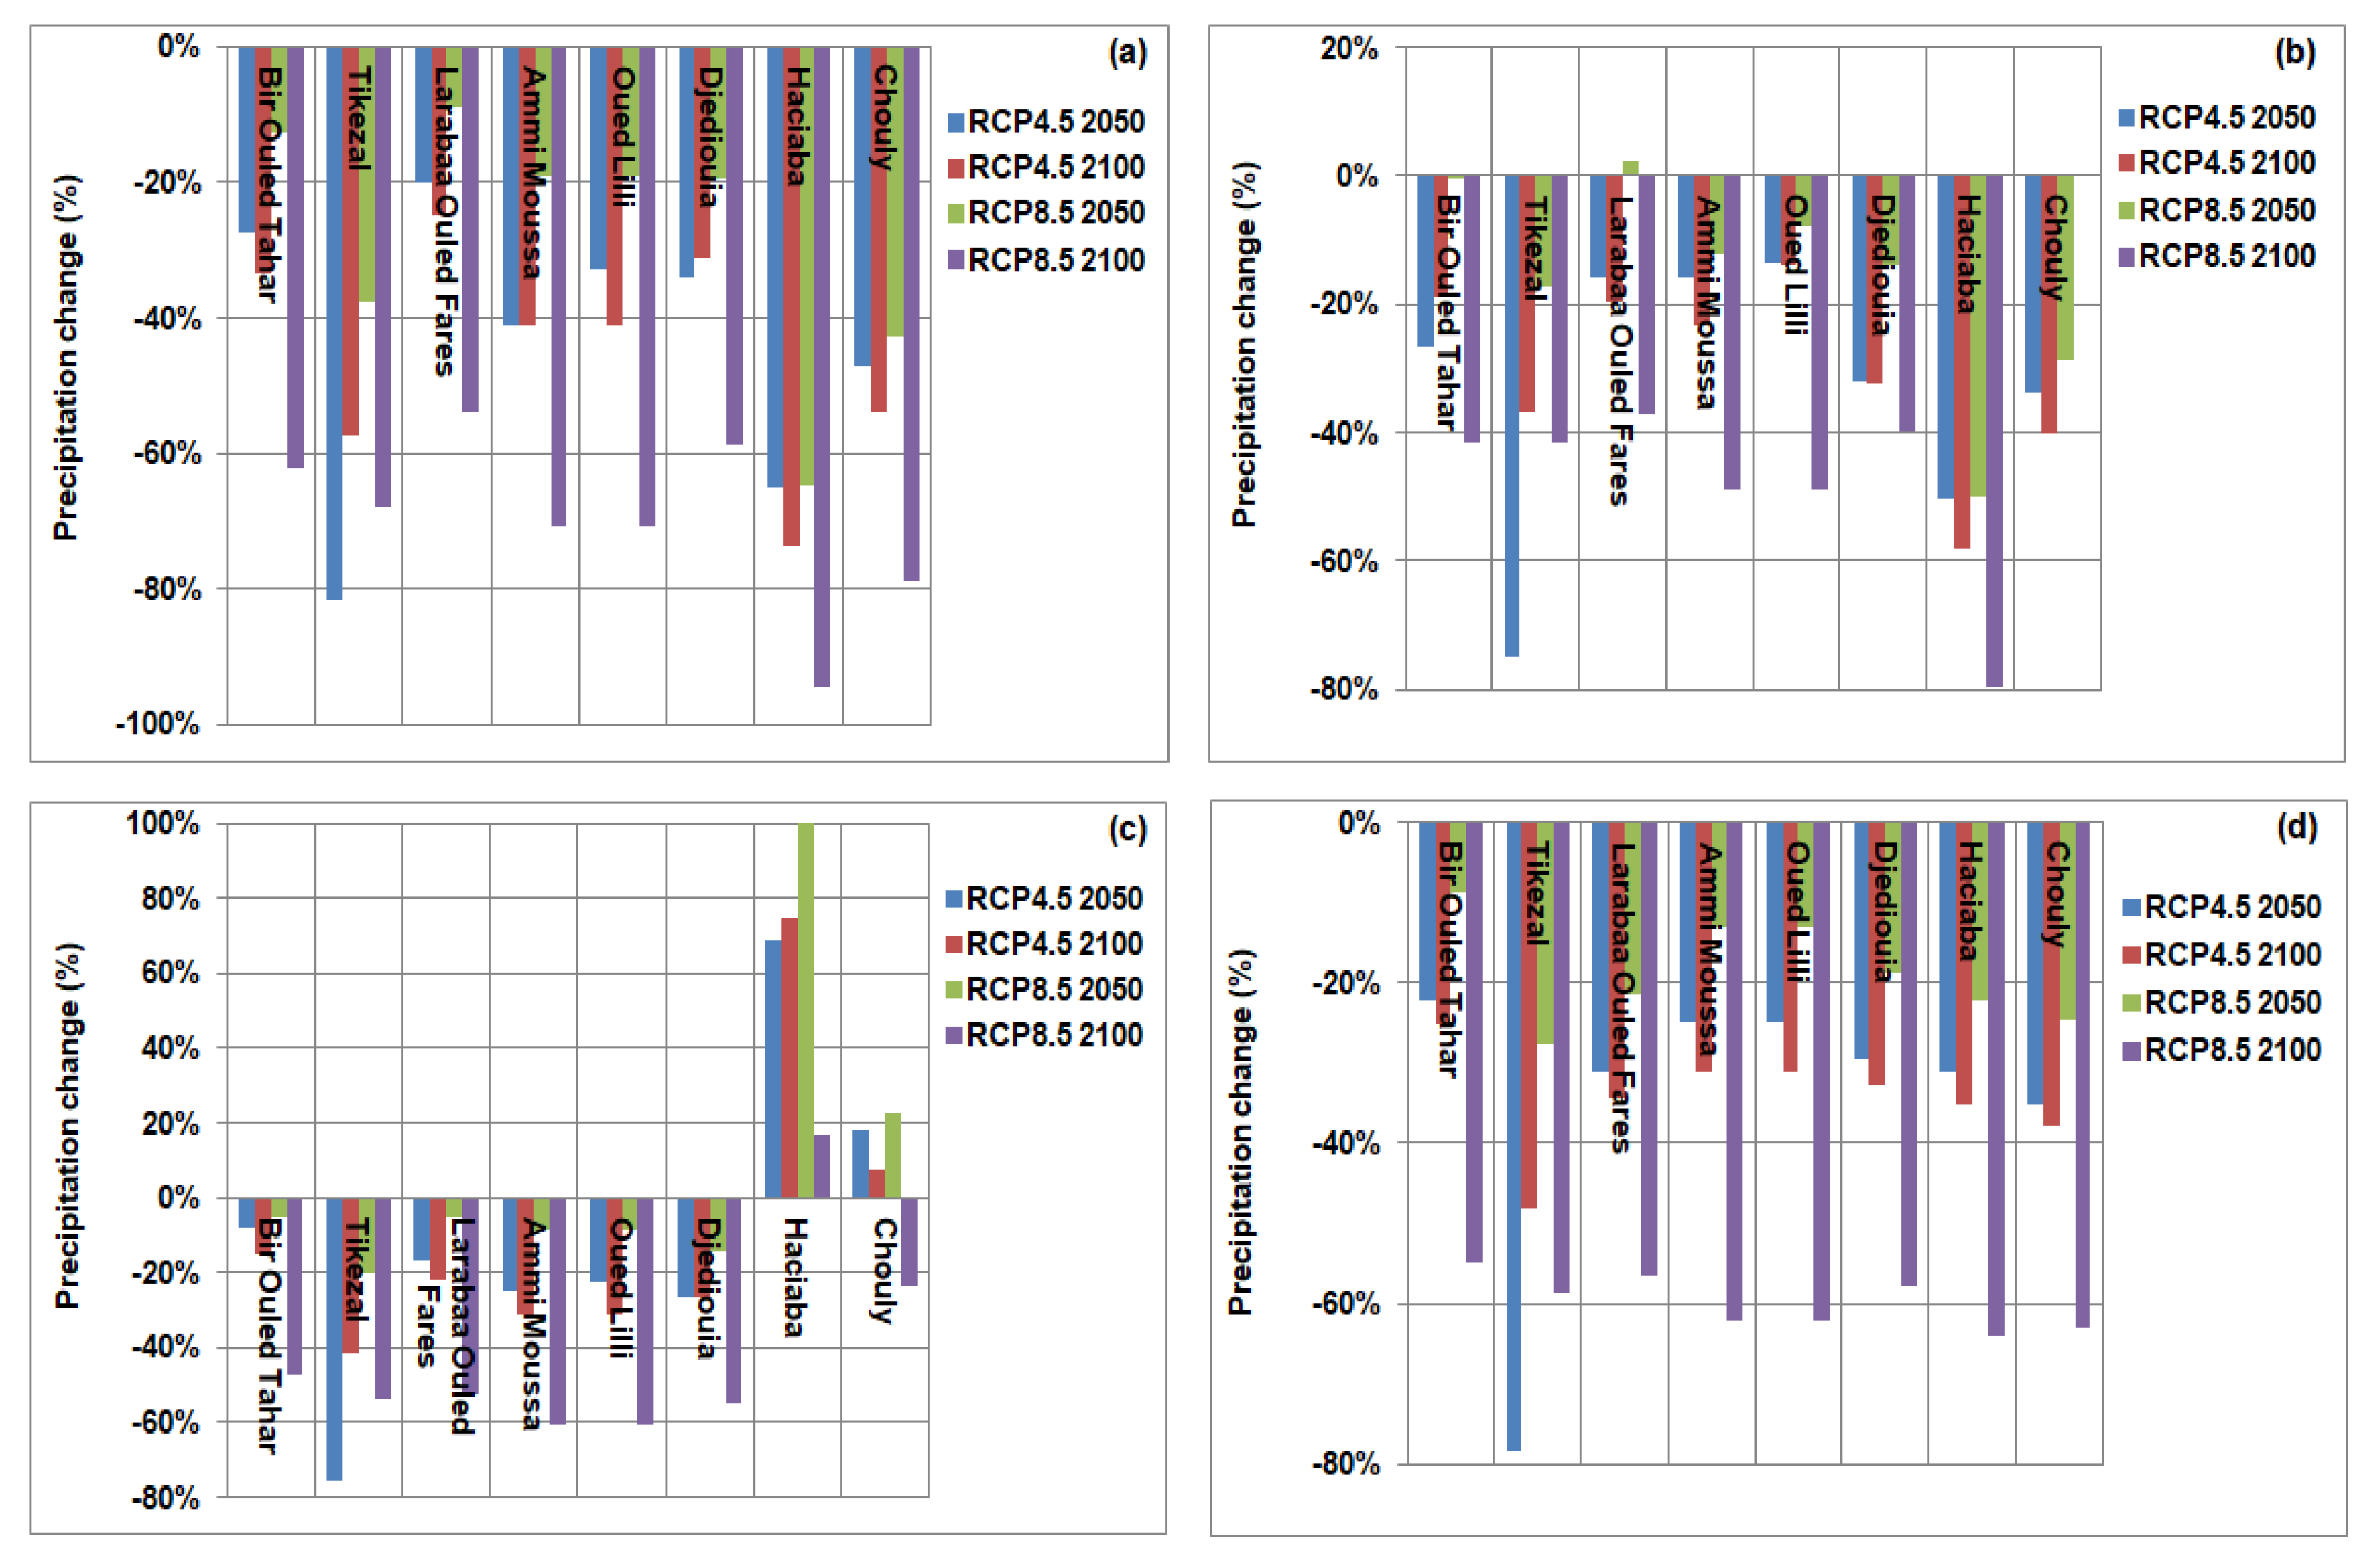
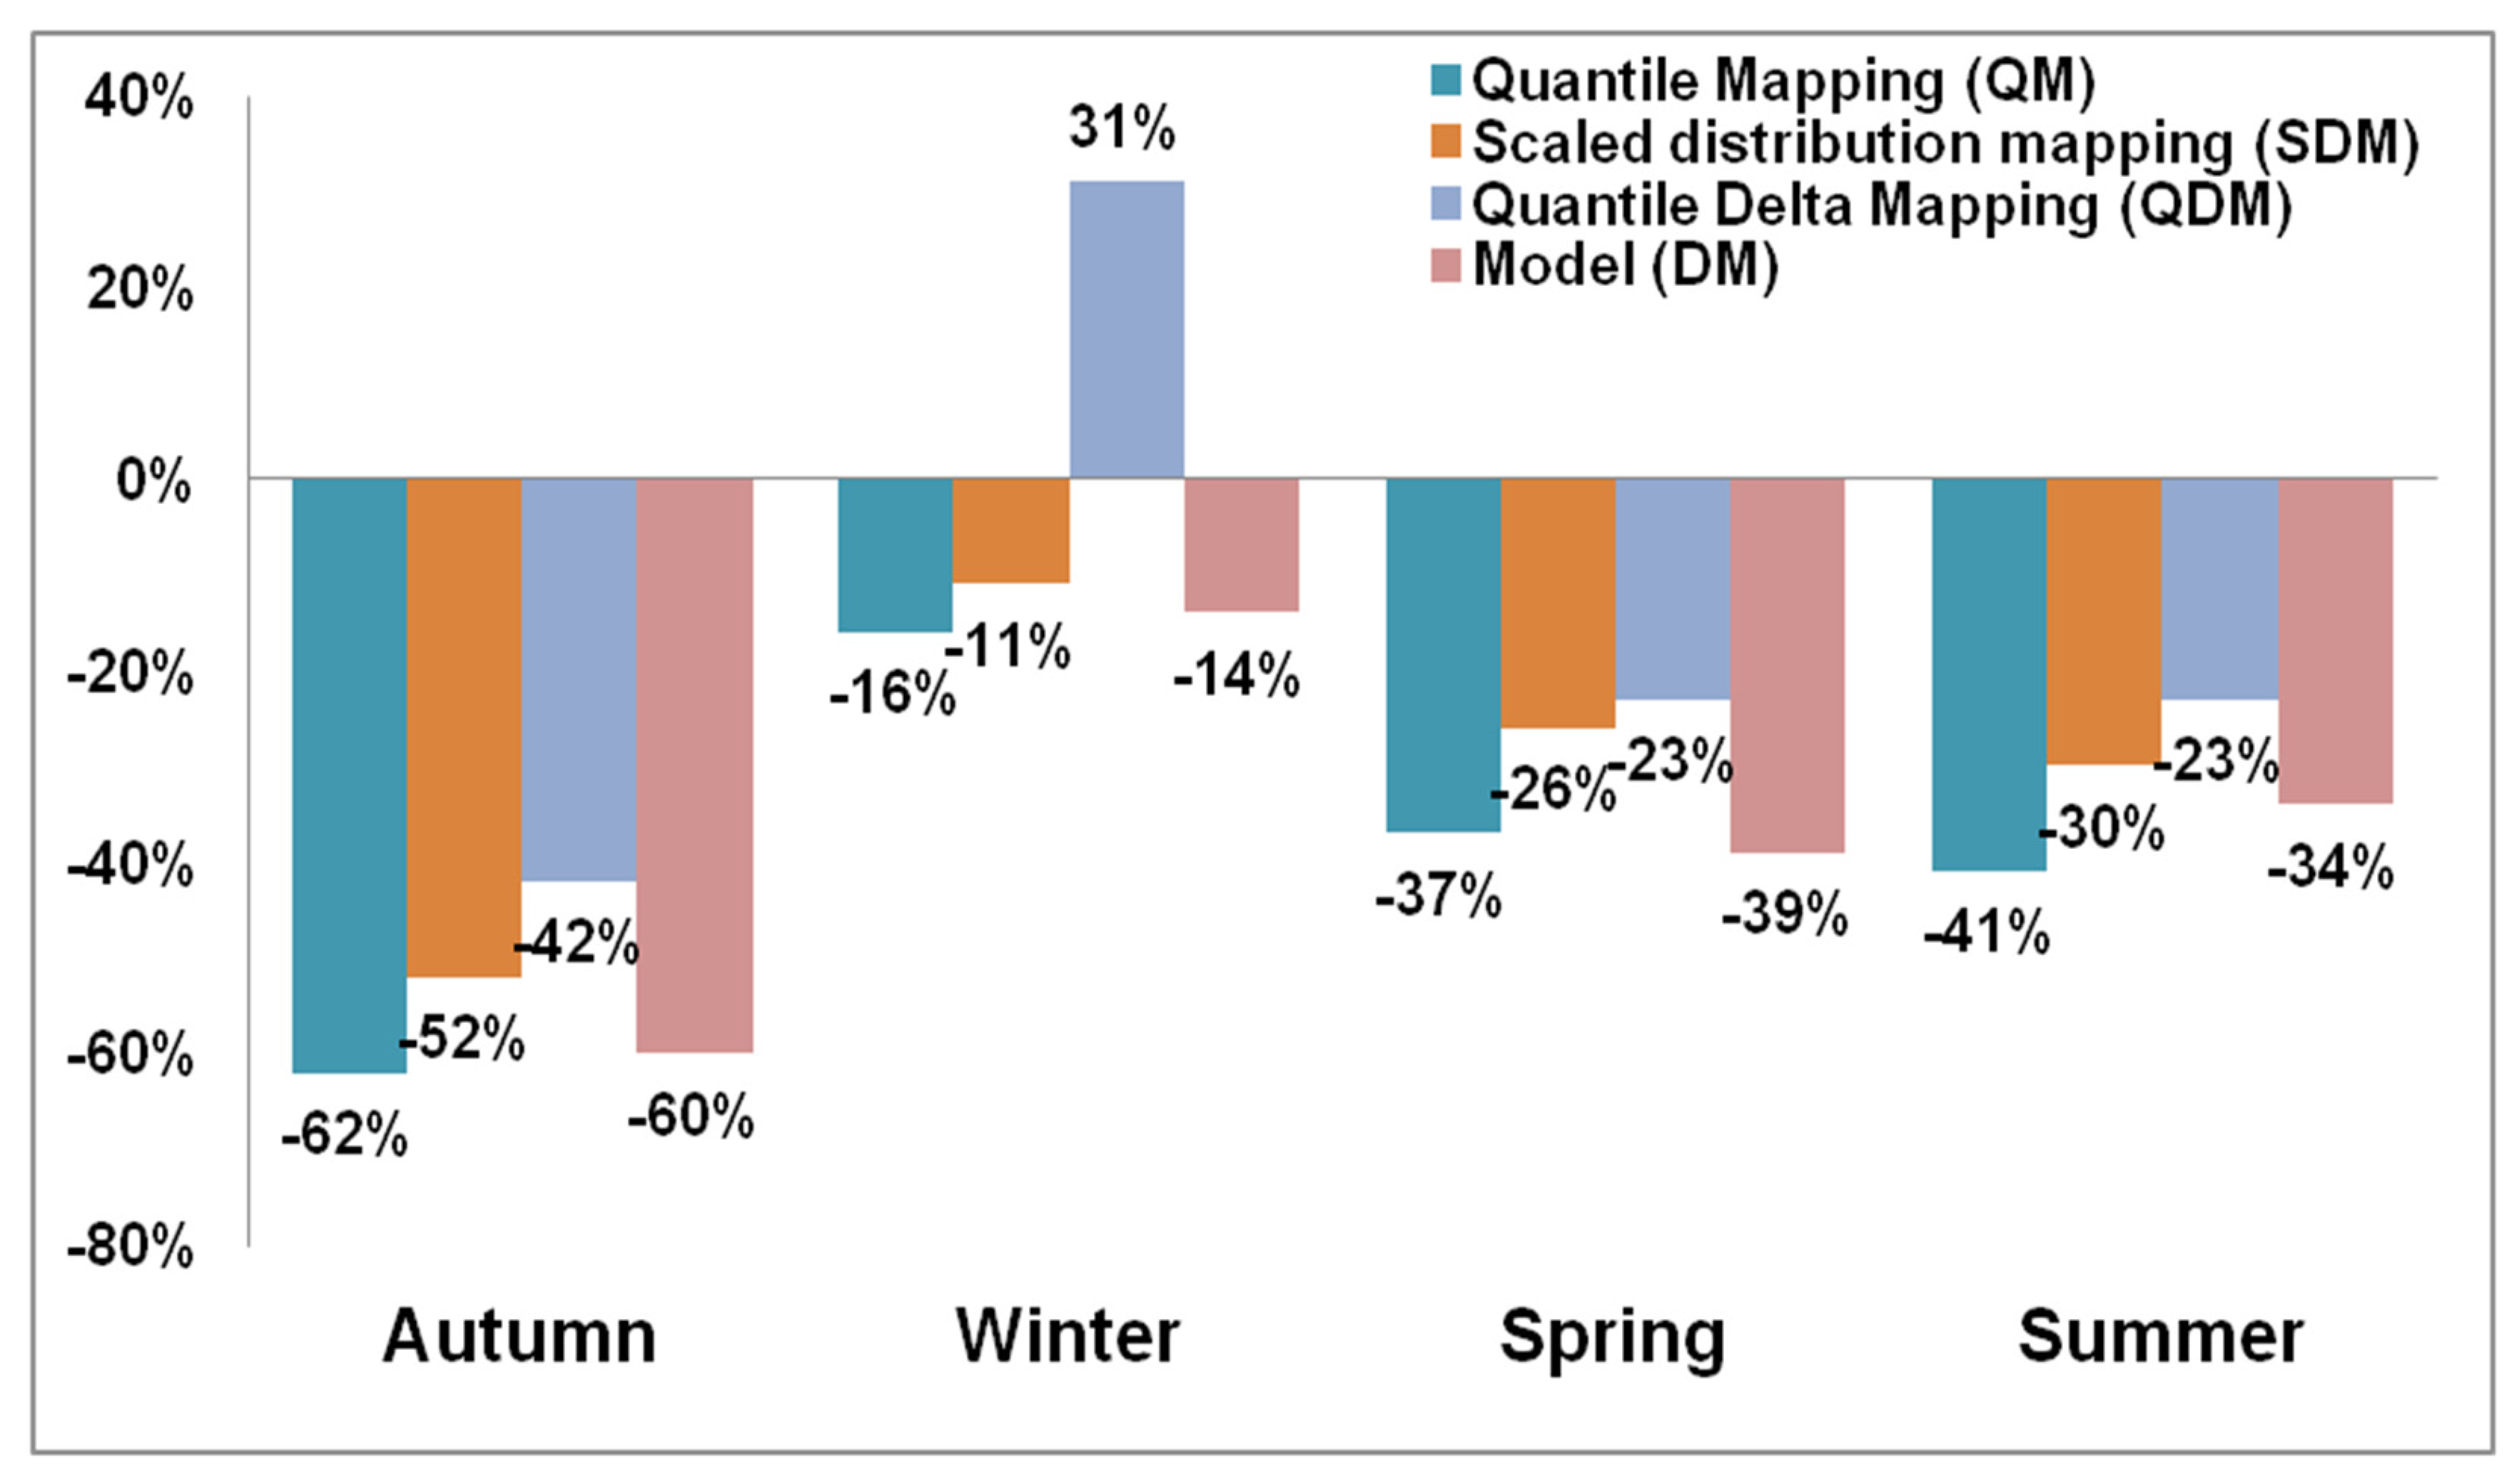
4.5. Projected Season Precipitation
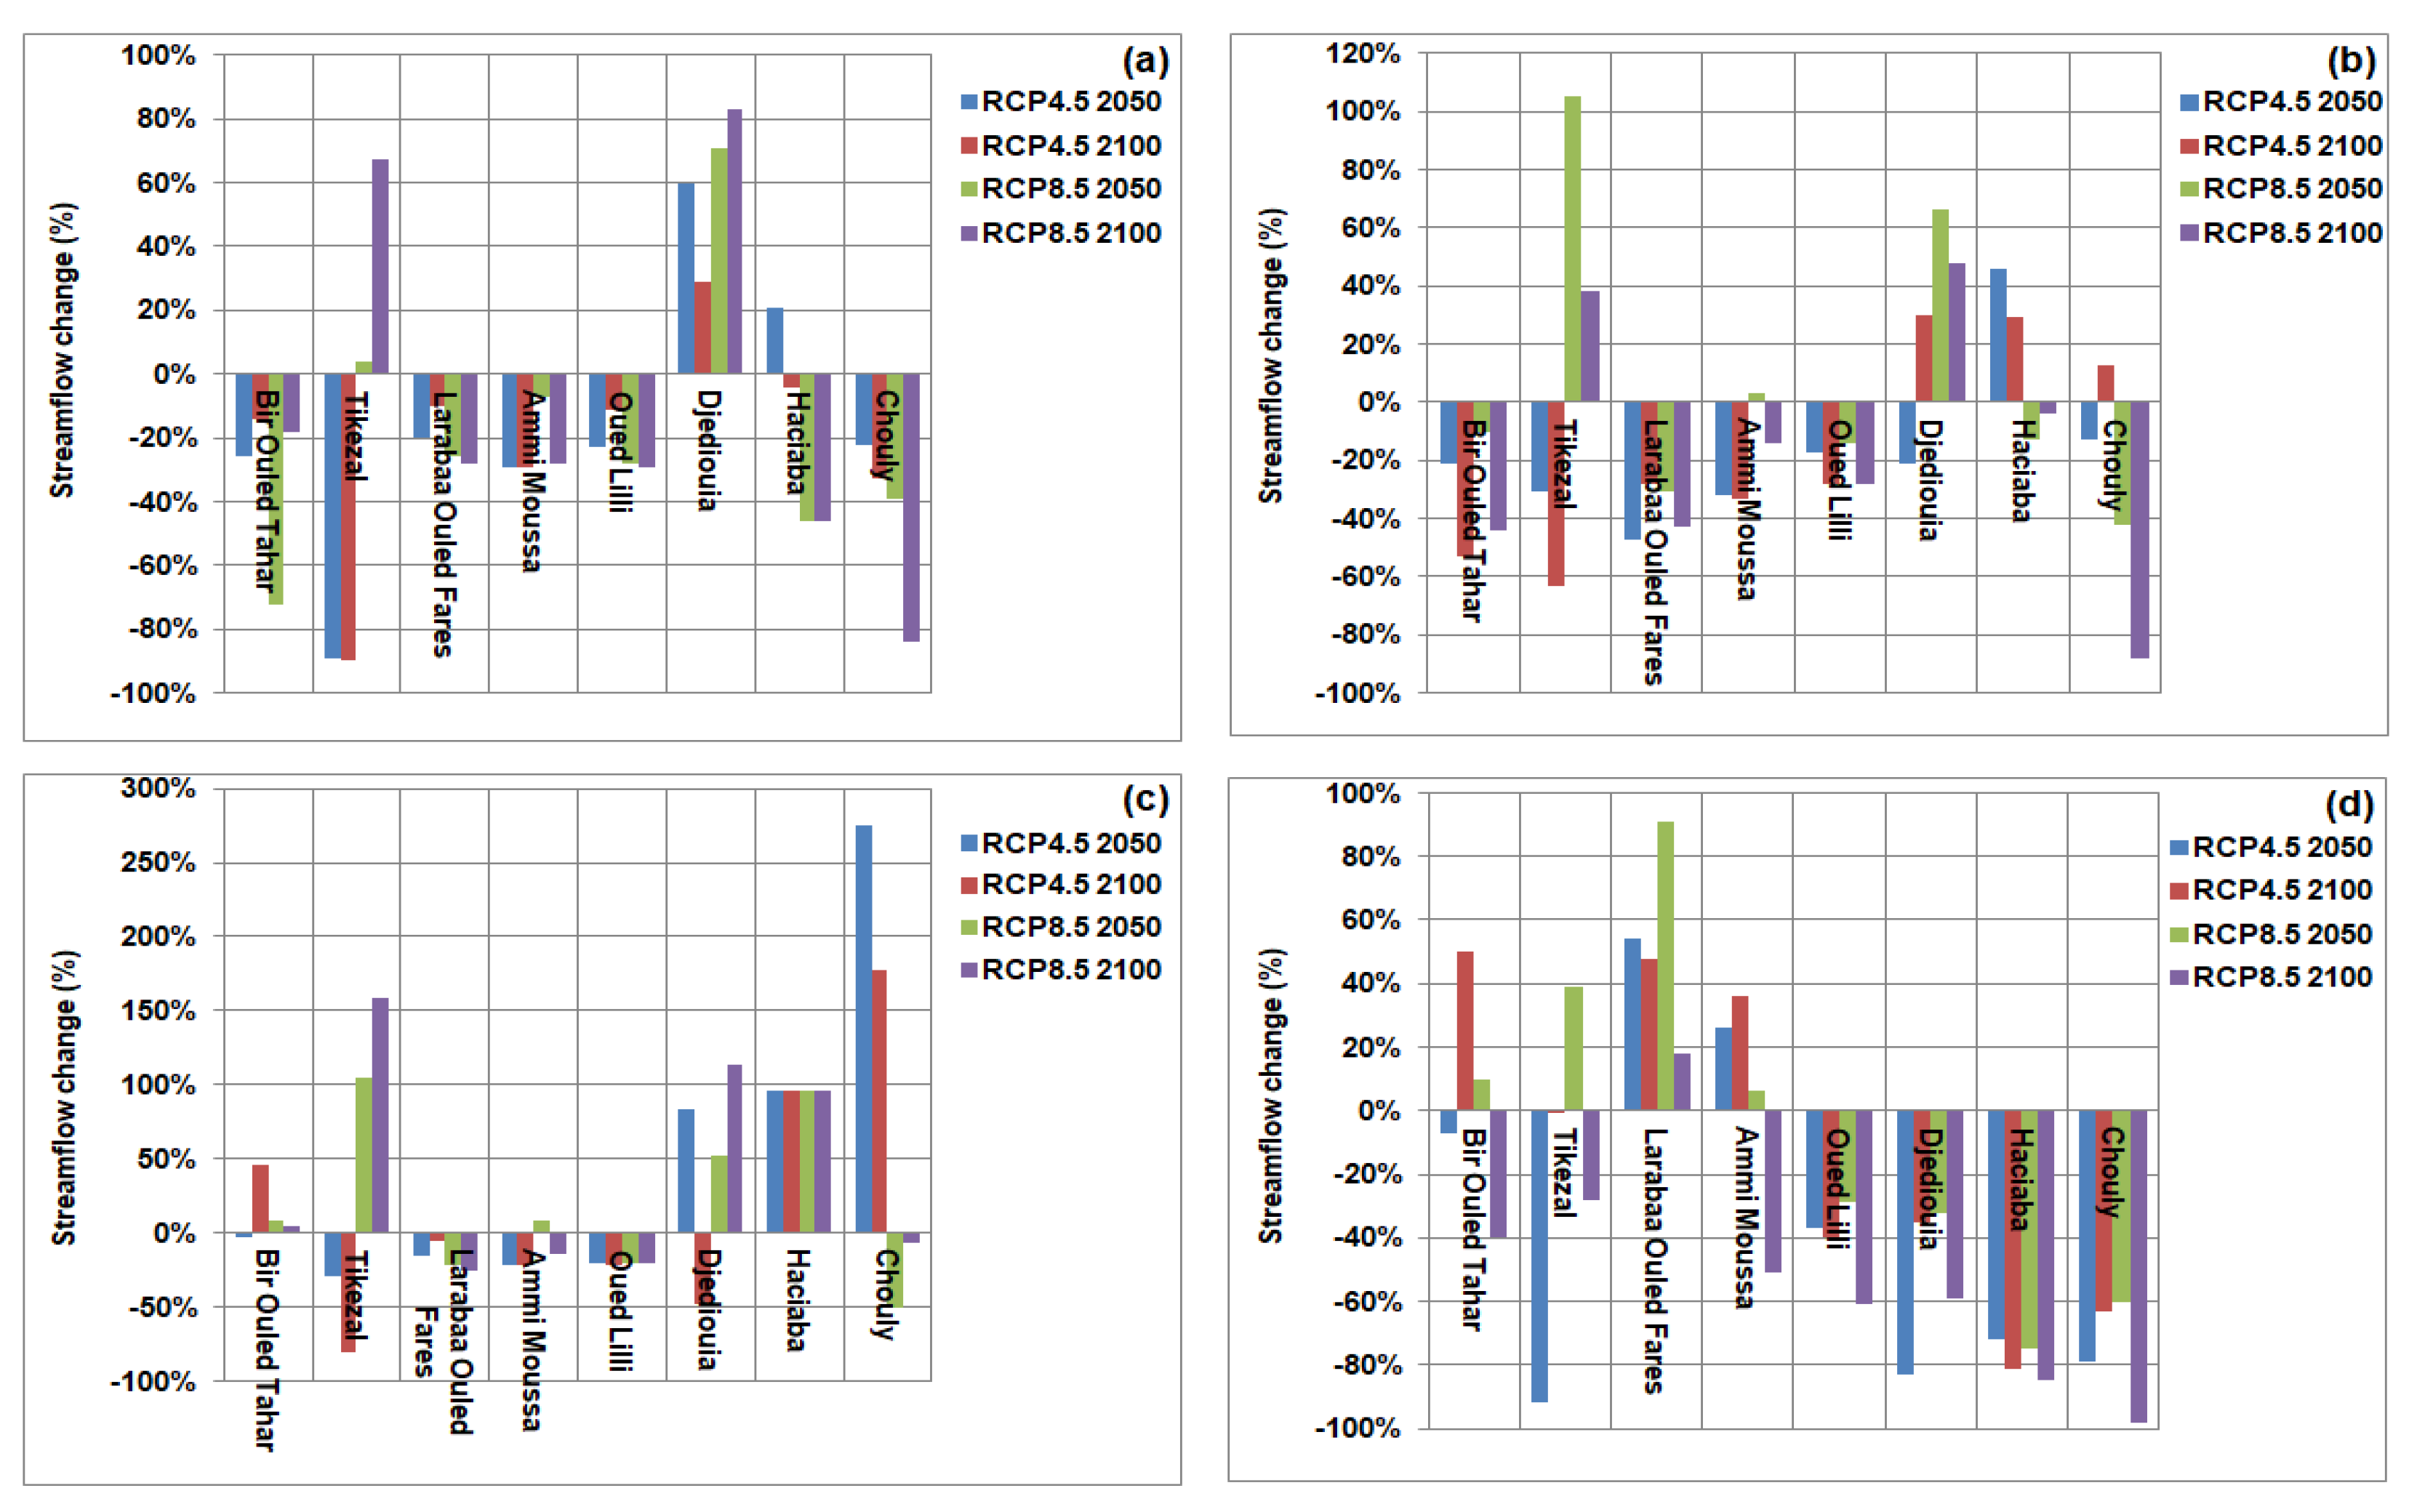
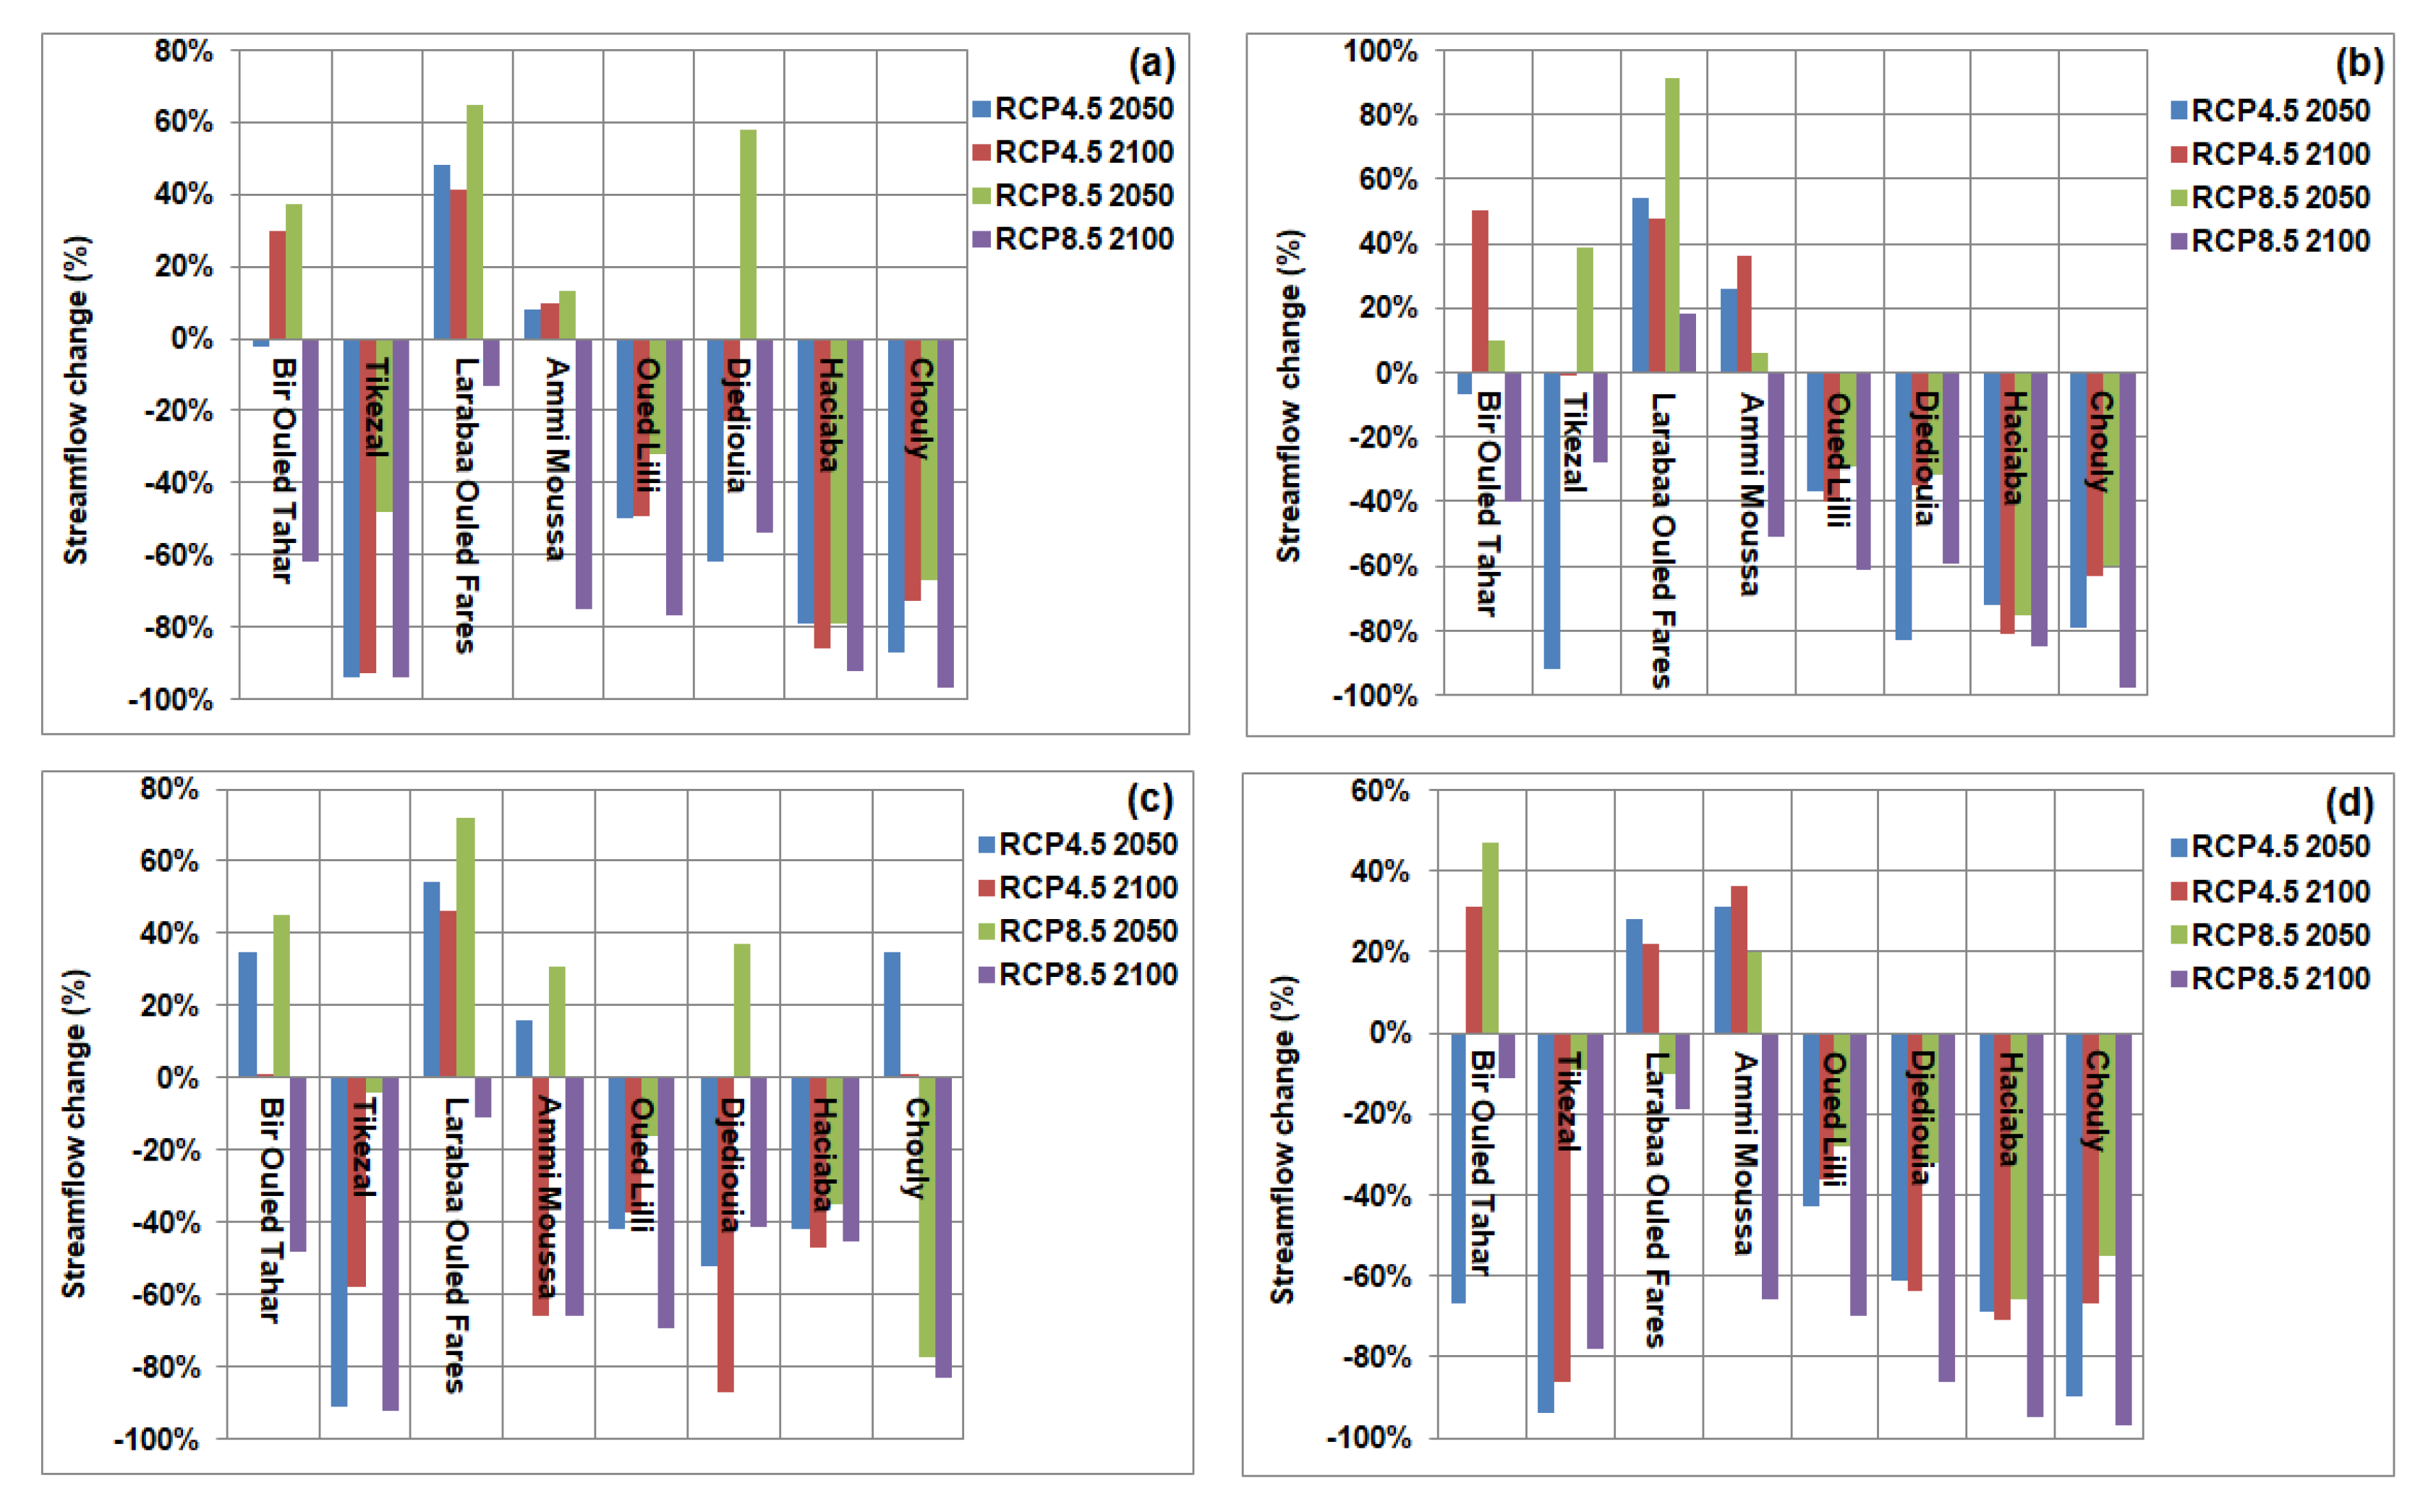
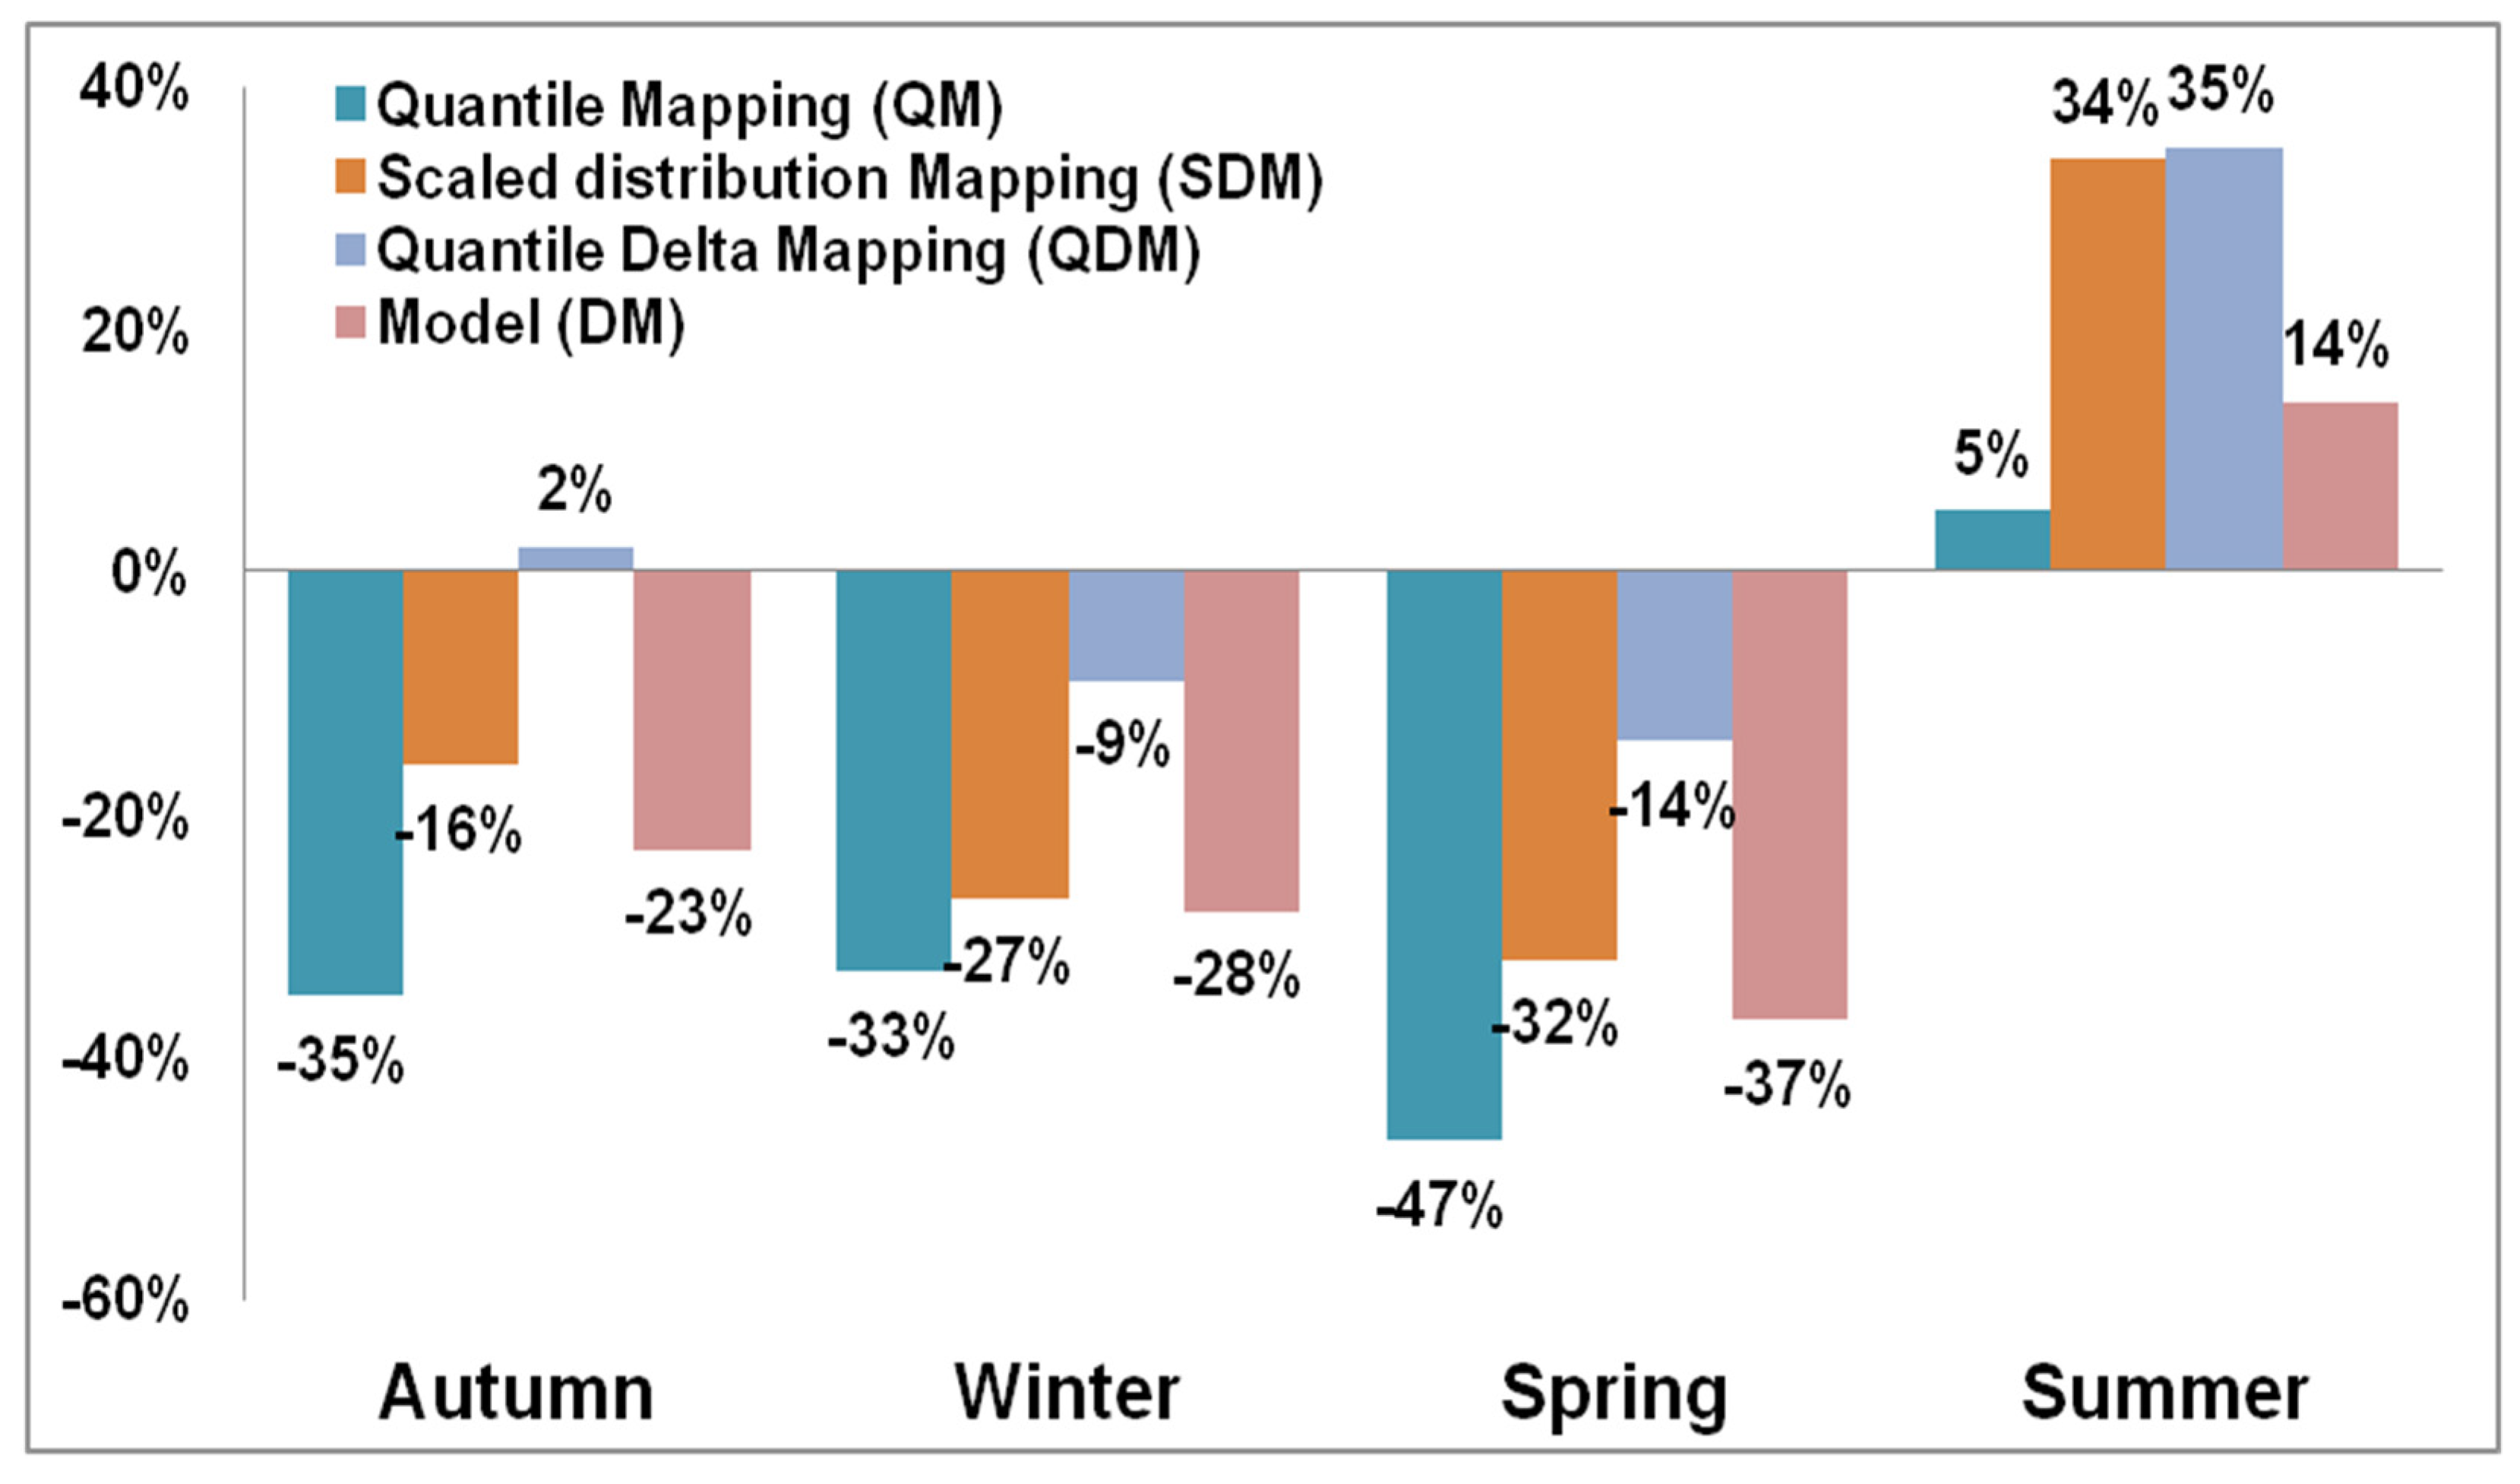
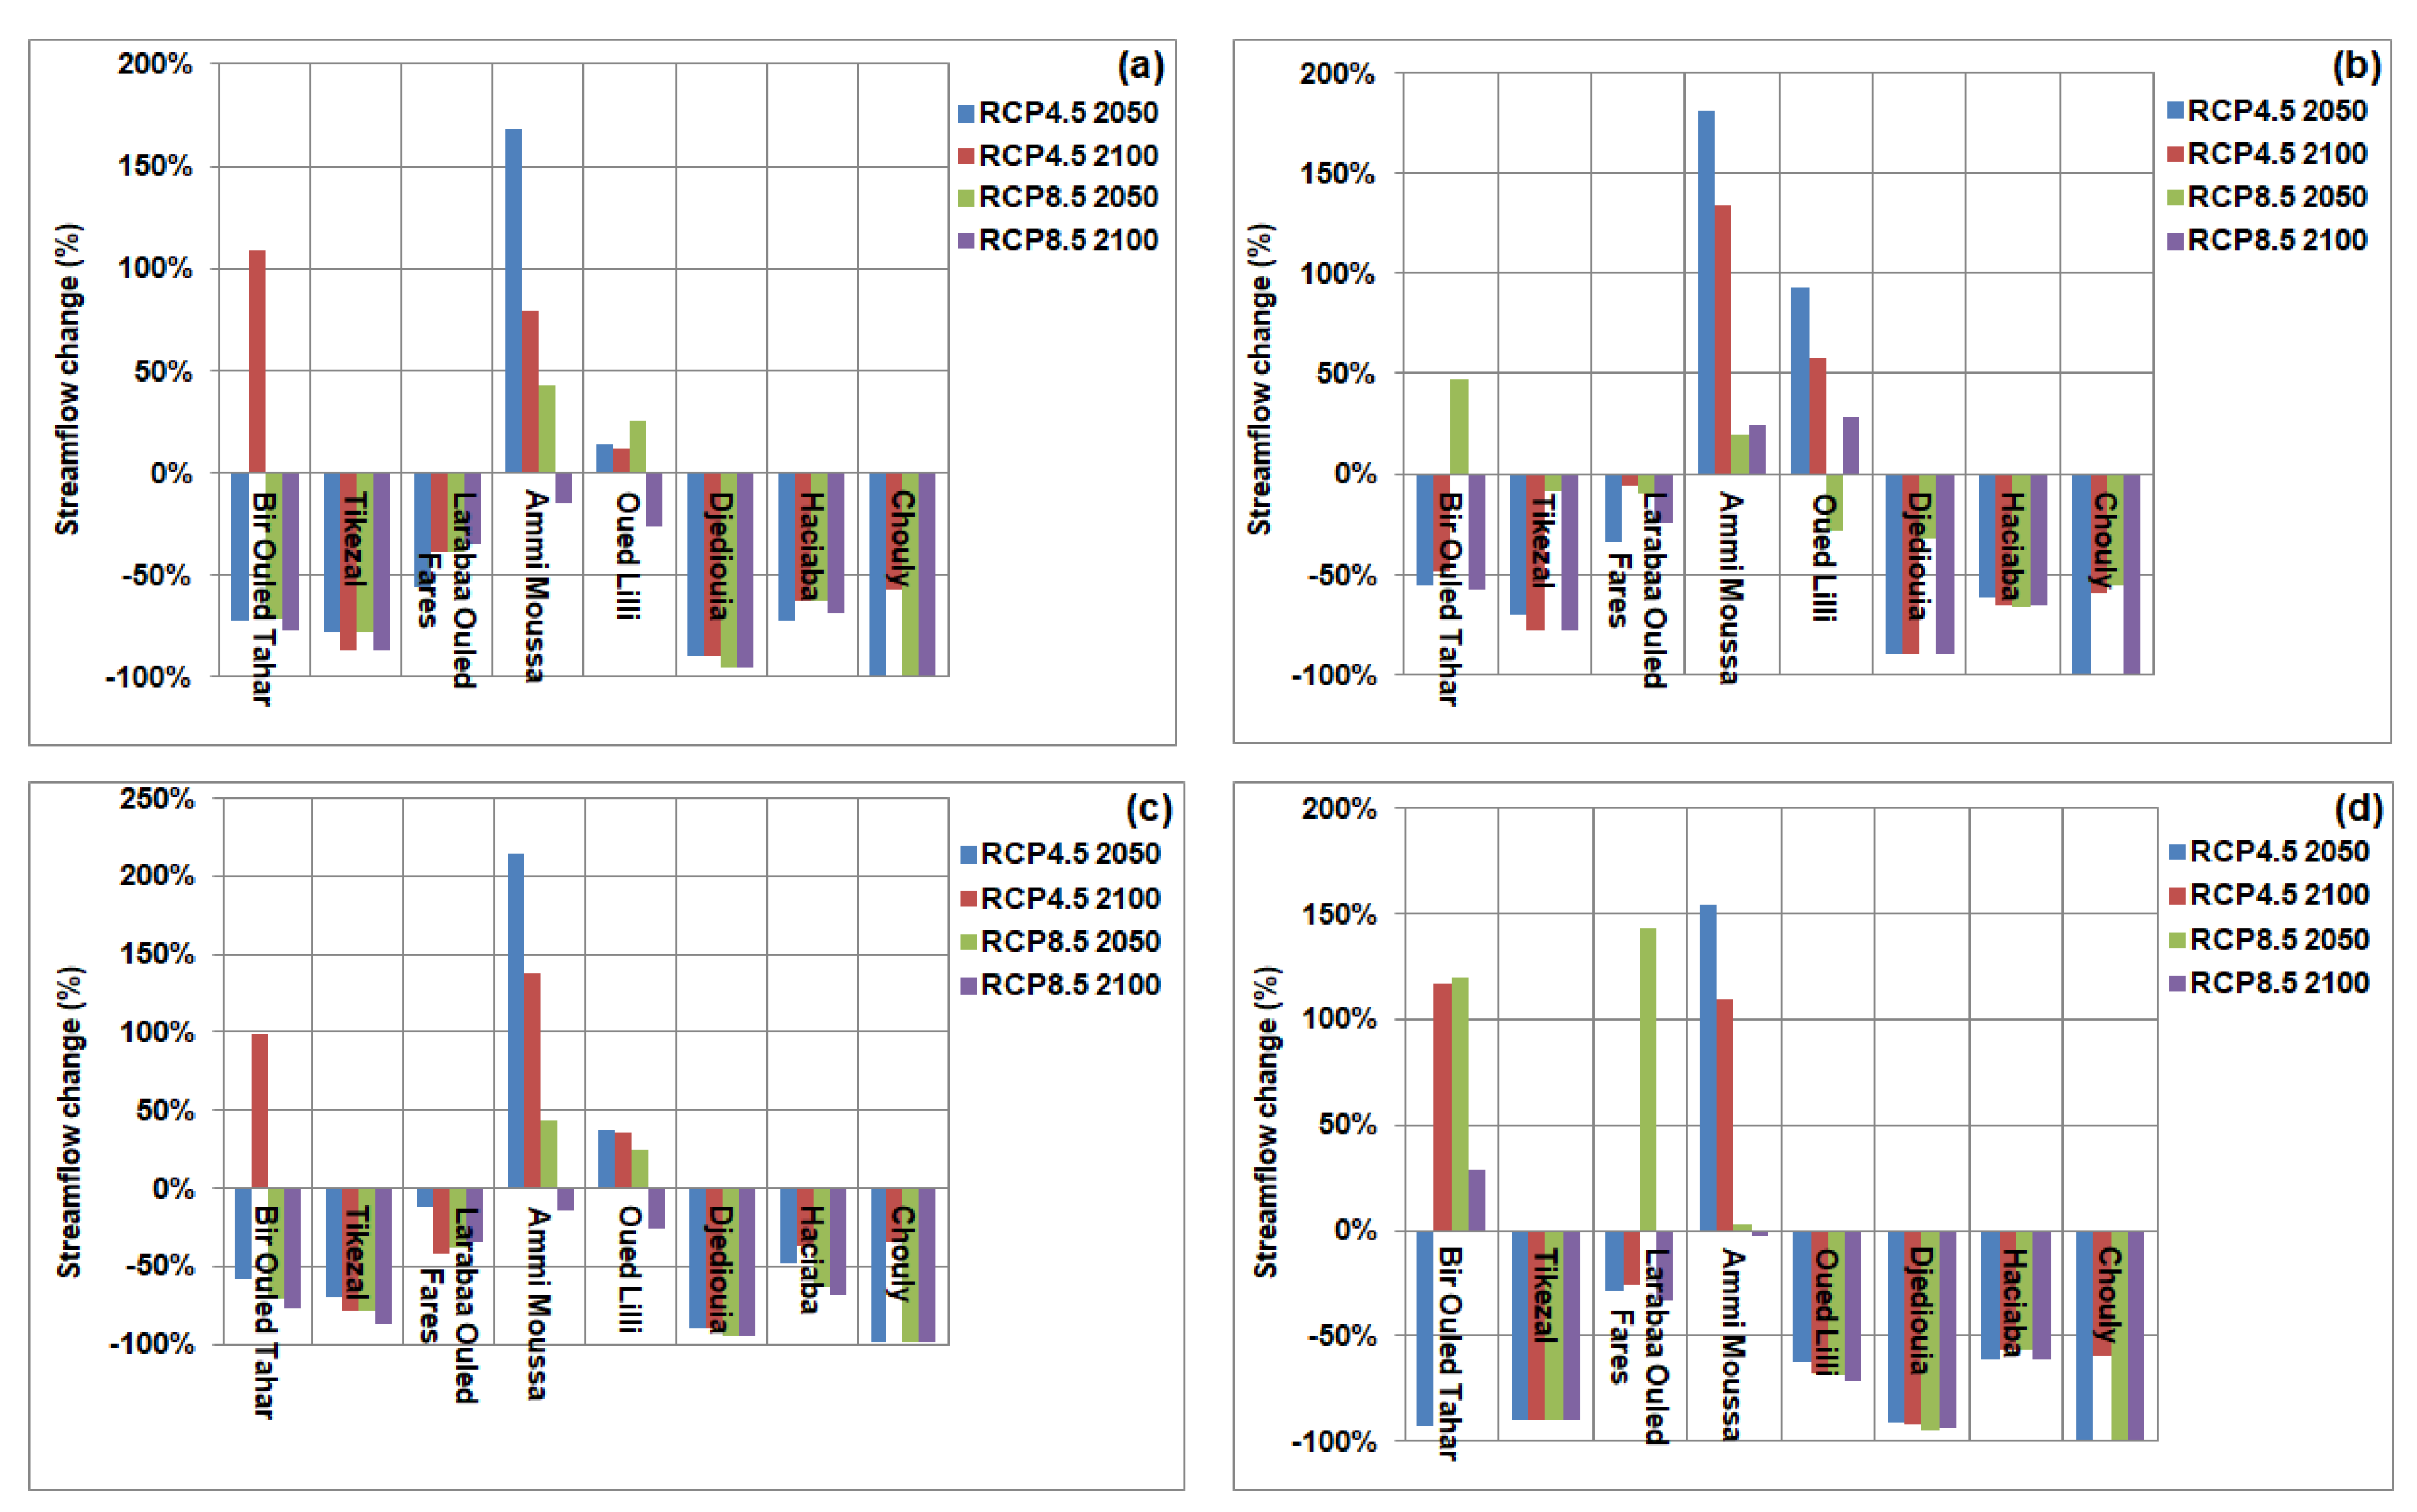
4.6. Seasonal Streamflow Projections
5. Discussion
5.1. Change in Precipitation
5.2. Change in Streamflow
6. Conclusions
Supplementary Materials
Author Contributions
Funding
Institutional Review Board Statement
Informed Consent Statement
Data Availability Statement
Acknowledgments
Conflicts of Interest
References
- Change, Intergovernmental Panel On Climate. Climate Change; IPCC: Geneva, Switzerland, 2014.
- Mukheibir, P. Water access, water scarcity, and climate change. Environ. Manag. 2010, 45, 1027–1039. [Google Scholar]
- Schewe, J.; Heinke, J.; Gerten, D.; Haddeland, I.; Arnell, N.W.; Clark, D.B.; Dankers, R.; Eisner, S.; Fekete, B.M.; Colón-González, F.J.; et al. Multimodel assessment of water scarcity under climate change. Proc. Natl. Acad. Sci. USA 2014, 111, 3245–3250. [Google Scholar]
- Arnell, N.W.; Gosling, S.N. The impacts of climate change on river flow regimes at the global scale. J. Hydrol. 2013, 486, 351–364. [Google Scholar]
- Hattermann, F.F.; Krysanova, V.; Gosling, S.N.; Dankers, R.; Daggupati, P.; Donnelly, C.; Flörke, M.; Huang, S.; Motovilov, Y.; Buda, S.; et al. Cross-scale intercomparison of climate change impacts simulated by regional and global hydrological models in eleven large river basins. Clim. Chang. 2017, 141, 561–576. [Google Scholar]
- Theodossiou, N. Assessing the Impacts of Climate Change on the Sustainability of Groundwater Aquifers. Application in Moudania Aquifer in N. Greece. Environ. Process. 2016, 3, 1045–1061. [Google Scholar]
- Hamed, Y.; Hadji, R.; Redhaounia, B.; Zighmi, K.; Bâali, F.; El Gayar, A. Climate impact on surface and groundwater in North Africa: A global synthesis of findings and recommendations. Euro-Mediterr. J. Environ. Integr. 2018, 3, 25. [Google Scholar]
- Mokadem, N.; Redhaounia, B.; Besser, H.; Ayadi, Y.; Khelifi, F.; Hamad, A.; Hamed, Y.; Bouri, S. Impact of climate change on groundwater and the extinction of ancient “Foggara” and springs systems in arid lands in North Africa: A case study in Gafsa basin (Central of Tunisia). Euro-Mediterr. J. Environ. Integr. 2018, 3, 28. [Google Scholar]
- Meehl, G.A.; Covey, C.; Delworth, T.; Latif, M.; McAvaney, B.; Mitchell, J.F.B.; Stouffer, R.J.; Taylor, K.E. The WCRP CMIP3 Multimodel Dataset: A New Era in Climate Change Research. Bull. Am. Meteorol. Soc. 2007, 88, 1383–1394. [Google Scholar]
- Mearns, L.O.; Arritt, R.; Biner, S.; Bukovsky, M.S.; McGinnis, S.; Sain, S.; Caya, D.; Correia, J.; Flory, D.; Gutowski, W.; et al. The North American regional climate change assessment program: Overview of phase I results. Bull. Am. Meteorol. Soc. 2012, 93, 1337–1362. [Google Scholar]
- Sillmann, J.; Kharin, V.V.; Zwiers, F.W.; Zhang, X.; Bronaugh, D. Climate extremes indices in the CMIP5 multimodel ensemble: Part 2. Future climate projections. J. Geophys. Res. Atmos. 2013, 118, 2473–2493. [Google Scholar] [CrossRef]
- Teutschbein, C.; Seibert, J. Bias correction of regional climate model simulations for hydrological climate-change impact studies: Review and evaluation of different methods. J. Hydrol. 2012, 456, 12–29. [Google Scholar]
- Themeßl, M.J.; Gobiet, A.; Heinrich, G. Empirical-statistical downscaling and error correction of regional climate models and its impact on the climate change signal. Clim. Chang. 2012, 112, 449–468. [Google Scholar]
- Räisänen, J.; Räty, O. Projections of daily mean temperature variability in the future: Cross-validation tests with ENSEMBLES regional climate simulations. Clim. Dyn. 2013, 41, 1553–1568. [Google Scholar]
- Teutschbein, C.; Seibert, J. Is bias correction of regional climate model [RCM] simulations possible for non-stationary conditions? Hydrol. Earth Syst. Sci. 2013, 17, 5061–5077. [Google Scholar]
- Fang, G.H.; Yang, J.; Chen, Y.N.; Zammit, C. Comparing bias correction methods in downscaling meteorological variables for a hydrologic impact study in an arid area in China. Hydrol. Earth Syst. Sci. 2015, 19, 2547–2559. [Google Scholar]
- Ahmed, K.F.; Wang, G.; Silander, J.; Wilson, A.M.; Allen, J.M.; Horton, R.; Anyah, R. Statistical downscaling and bias correction of climate model outputs for climate change impact assessment in the U.S. northeast. Glob. Planet. Chang. 2013, 100, 320–332. [Google Scholar]
- Switanek, M.B.; Troch, P.A.; Castro, C.L.; Leuprecht, A.; Chang, H.-I.; Mukherjee, R.; Demaria, E.M.C. Scaled distribution mapping: A bias correction method that preserves raw climate model projected changes. Hydrol. Earth Syst. Sci. 2017, 21, 2649–2666. [Google Scholar]
- Grenier, P. Two Types of Physical Inconsistency to Avoid with Univariate Quantile Mapping: A Case Study over North America Concerning Relative Humidity and Its Parent Variables. J. Appl. Meteorol. Clim. 2018, 57, 347–364. [Google Scholar]
- Willems, P.; Vrac, M. Statistical precipitation downscaling for small-scale hydrological impact investigations of climate change. J. Hydrol. 2011, 402, 193–205. [Google Scholar]
- Gudmundsson, L.; Bremnes, J.B.; Haugen, J.E.; Engen-Skaugen, T. Downscaling RCM precipitation to the station scale using statistical transformations–a comparison of methods. Hydrol. Earth Syst. Sci. 2012, 16, 3383–3390. [Google Scholar]
- Hempel, S.; Frieler, K.; Warszawski, L.; Schewe, J.; Piontek, F. A trend-preserving bias correction–the ISI-MIP approach. Earth Syst. Dyn. 2013, 4, 219–236. [Google Scholar]
- Bürger, G.; Murdock, T.Q.; Werner, A.T.; Sobie, S.R.; Cannon, A.J. Downscaling Extremes—An Intercomparison of Multiple Statistical Methods for Present Climate. J. Clim. 2012, 25, 4366–4388. [Google Scholar]
- Cannon, A.J.; Sobie, S.R.; Murdock, T.Q. Bias correction of GCM precipitation by quantile mapping: How well do methods preserve changes in quantiles and extremes? J. Clim. 2015, 28, 6938–6959. [Google Scholar]
- Casanueva, A.; Herrera, S.; Iturbide, M.; Lange, S.; Jury, M.; Dosio, A.; Maraun, D.; Gutiérrez, J.M. Testing bias adjustment methods for regional climate change applications under observational uncertainty and resolution mismatch. Atmos. Sci. Lett. 2020, 21, e978. [Google Scholar]
- Mpelasoka, F.S.; Chiew, F.H.S. Influence of Rainfall Scenario Construction Methods on Runoff Projections. J. Hydrometeorol. 2009, 10, 1168–1183. [Google Scholar]
- Van Roosmalen, L.; Sonnenborg, T.O.; Jensen, K.H.; Christensen, J.H. Comparison of Hydrological Simulations of Climate Change Using Perturbation of Observations and Distribution-Based Scaling. Vadose Zone J. 2011, 10, 136–150. [Google Scholar]
- Muerth, M.J.; Gauvin St-Denis, B.; Ricard, S.; Velázquez, J.A.; Schmid, J.; Minville, M.; Caya, D.; Chaumont, D.; Ludwig, R.; Turcotte, R. On the need for bias correction in regional climate scenarios to assess climate change impacts on river runoff. Hydrol. Earth Syst. Sci. 2013, 17, 1189–1204. [Google Scholar]
- Teng, J.; Potter, N.J.; Chiew, F.H.S.; Zhang, L.; Wang, B.; Vaze, J.; Evans, J.P. How does bias correction of regional climate model precipitation affect modelled runoff? Hydrol. Earth Syst. Sci. 2015, 19, 711–728. [Google Scholar]
- Nguyen, H.; Mehrotra, R.; Sharma, A. Assessment of Climate Change Impacts on Reservoir Storage Reliability, Resilience, and Vulnerability Using a Multivariate Frequency Bias Correction Approach. Water Resour. Res. 2020, 56, e2019WR026022. [Google Scholar]
- Achour, K.; Meddi, M.; Zeroual, A.; Bouabdelli, S.; Maccioni, P.; Moramarco, T. Spatio-temporal analysis and forecasting of drought in the plains of northwestern Algeria using the standardized precipitation index. J. Earth Syst. Sci. 2020, 129, 42. [Google Scholar]
- Zerouali, B.; Mesbah, M.; Chettih, M.; Djemai, M. Contribution of cross time-frequency analysis in assessment of possible relationships between large-scale climatic fluctuations and rainfall of northern central Algeria. Arab. J. Geosci. 2018, 11, 392. [Google Scholar]
- Bouabdelli, S.; Meddi, M.; Zeroual, A.; Alkama, R. Hydrological drought risk recurrence under climate change in the karst area of Northwestern Algeria. J. Water Clim. Chang. 2020, 11, 164–188. [Google Scholar]
- Zeroual, A.; Assani, A.A.; Meddi, M.; Alkama, R. Assessment of climate change in Algeria from 1951 to 2098 using the Köppen–Geiger climate classification scheme. Clim. Dyn. 2019, 52, 227–243. [Google Scholar]
- Benzater, B.; Elouissi, A.; Benaricha, B.; Habi, M. Spatio-temporal trends in daily maximum rainfall in northwestern Algeria (Macta watershed case, Algeria). Arab. J. Geosci. 2019, 12, 370. [Google Scholar]
- Bouchelkia, H.; Belarbi, F.; Rémini, B. Estimated flows of suspended solids by the statistical analysis of outfall drainage basin of Tafna (Algeria). Soil Water Res. 2013, 8, 63–70. [Google Scholar]
- Jones, C.; Giorgi, F.; Asrar, G. The Coordinated Regional Downscaling Experiment: CORDEX–an international downscaling link to CMIP5. CLIVAR Exch. 2011, 16, 34–40. [Google Scholar]
- Kozanis, S.; Christoforides, A.; Efstratiadis, A. Scientific Documentation of Hydrognomon software [version 4]. Development of Database and Software Application in a Web Platform for the “National Database and Meterological Information”. ITIA Research Team, National Technical University of Athens. Available online: https://www.itia.ntua.gr/en/docinfo/928/1/Documents/HydrognomonV4TheoryGR-V1,2 (accessed on 6 July 2022).
- Charizopoulos, N.; Psilovikos, A. Hydrologic processes simulation using the conceptual model Zygos: The example of Xynias drained Lake catchment (central Greece). Environ. Earth Sci. 2016, 75, 777. [Google Scholar] [CrossRef]
- Charizopoulos, N.; Psilovikos, A.; Zagana, E. A lumped conceptual approach for modeling hydrological processes: The case of Scopia catchment area, Central Greece. Environ. Earth Sci. 2017, 76, 632. [Google Scholar] [CrossRef]
- Madsen, H. Automatic calibration of a conceptual rainfall–runoff model using multiple objectives. J. Hydrol. 2000, 235, 276–288. [Google Scholar]
- Khazaei, M.R.; Zahabiyoun, B.; Saghafian, B.; Ahmadi, S. Development of an Automatic Calibration Tool Using Genetic Algorithm for the ARNO Conceptual Rainfall-Runoff Model. Arab. J. Sci. Eng. 2013, 39, 2535–2549. [Google Scholar]
- Anandhi, A.; Frei, A.; Pierson, D.C.; Schneiderman, E.M.; Zion, M.S.; Lounsbury, D.; Matonse, A.H. Examination of change factor methodologies for climate change impact assessment. Water Resour. Res. 2011, 47. [Google Scholar] [CrossRef] [Green Version]
- Taïbi, S.; Zeroual, A.; Meddi, M. Effect of autocorrelation on temporal trends in air-temperature in Northern Algeria and links with teleconnections patterns. Theor. Appl. Climatol. 2022, 147, 959–984. [Google Scholar] [CrossRef]
- Zeroual, A.; Assani, A.A.; Meddi, H.; Bouabdelli, S.; Zeroual, S.; Alkama, R. Assessment of Projected Precipitations and Temperatures Change Signals over Algeria Based on Regional Climate Model: RCA4 Simulations. In Water Resources in Algeria—Part I. The Handbook of Environmental Chemistry; Negm, A.M., Bouderbala, A., Chenchouni, H., Barceló, D., Eds.; Springer: Cham, Switzerland, 2020; Volume 97, pp. 135–159. [Google Scholar] [CrossRef]
- Taïbi, S.; Anza, F.Z.H.; Zeroual, S. Etude de l’impact des changements climatiques sur la disponibilité des ressources en eau basée sur les simulations du modèle climatique régional RCA4: Cas du bassin de Ain DALIA (Algérie). Alger. J. Environ. Sci. Technol. 2021, 7, 1860–1869. [Google Scholar]
- Bouabdelli, S.; Zeroual, A.; Meddi, M.; Assani, A. Impact of temperature on agricultural drought occurrence under the effects of climate change. Theor. Appl. Climatol. 2022, 148, 191–209. [Google Scholar]
- Taïbi, S.; Zeroual, A.; Melhani, N. Evaluation de deux méthodes de correction de biais des sorties de modèles climatiques régionaux Cordex-Africa pour la prévision des pluies: Cas du bassin côtier oranais. Proc. Int. Assoc. Hydrol. Sci. 2021, 384, 213–218. [Google Scholar] [CrossRef]
- Hadour, A.; Mahé, G.; Meddi, M. Watershed based hydrological evolution under climate change effect: An example from North Western Algeria. J. Hydrol. Reg. Stud. 2020, 28, 100671. [Google Scholar]
- Zeroual, A.; Meddi, M.; Bensaad, S. The impact of climate change on river flow in arid and semi-arid rivers in Algeria. IAHS-AISH Proc. Rep. 2013, 359, 1–6. [Google Scholar]
- Piani, C.; Haerter, J.O.; Coppola, E. Statistical bias correction for daily precipitation in regional climate models over Europe. Theor. Appl. Climatol. 2010, 99, 187–192. [Google Scholar]
- Ringard, J.; Seyler, F.; Linguet, L. A Quantile Mapping Bias Correction Method Based on Hydroclimatic Classification of the Guiana Shield. Sensors 2017, 17, 1413. [Google Scholar] [CrossRef] [Green Version]
- Li, C.; Sinha, E.; Horton, D.E.; Diffenbaugh, N.S.; Michalak, A.M. Joint bias correction of temperature and precipitation in climate model simulations. J. Geophys. Res. Atmos. 2014, 119, 13–153. [Google Scholar]


| Stations Code | Name Stations | Watershed | Latitude | Longitude | Measurement Period |
|---|---|---|---|---|---|
| PV011901 | El Touaibia | Cheliff | 1°94′ | 36°12′ | 1990–2012 |
| PV012004 | Tikezal | Cheliff | 1°75′ | 36°19′ | 1989–2012 |
| PV012201 | Larabaa Ouled Fares | Cheliff | 1°24′ | 36°24′ | 1971–2012 |
| PV012507 | Oued Lili | Cheliff | 1°26′ | 35°52′ | 1975–2005 |
| PV012703 | Kenanda Ferme | Cheliff | 0°82′ | 35°65′ | 1978–2005 |
| PV110102 | Ras Elma | Mactaa | −0°83′ | 34°46′ | 1980–2010 |
| PV160601 | Chouly | Tafna | −1°13′ | 34°86′ | 1975–2012 |
| Station Code | Name Stations | Watershed | Wadi | Latitude | Longitude | Surface (km2) | Measurement Period |
|---|---|---|---|---|---|---|---|
| Qm011905 | Bir Ouled Tahar | Cheliff | Zeddine | 36°19′ | 1°85′ | 450 | 1990–2008 |
| Qm012004 | Tikezal | Cheliff | Tikezal | 36°19′ | 1°75′ | 130 | 1990–2012 |
| Qm012201 | Larabaa Ouled Fares | Cheliff | Ouahrane | 36°22′ | 1°21′ | 262 | 1983–2011 |
| Qm012501 | Oued Lilli | Cheliff | Tiguiguest | 35°59′ | 1°24′ | 1612 | 1975–2006 |
| Qm012601 | Ammi Moussa | Cheliff | Rhiou | 35°86′ | 1°12′ | 1937 | 1975–2006 |
| Qm012701 | Djidiouia | Cheliff | Djidiouia | 35°92′ | 0°88′ | 836 | 1975–2006 |
| Qm110101 | Haciabia | Mactaa | Mekerra | 34°69′ | −0°75′ | 941 | 1980–2001 |
| Qm160601 | Chouly | Tafna | Chouly | 34°86′ | −1°13′ | 167 | 1975–2006 |
| Parameters | Description |
|---|---|
| ε | Rainfall proportion available for the achievement of direct evapotranspiration. |
| κ | The rainfall excess proportion, appearing as direct runoff, caused by the occurrence of impermeable formations. Through them, the rainfall proportion is transformed directly into runoff. Essentially, it is the percentage of impermeable surface and expresses the percentage that runs off directly without percolating the soil. |
| k | The capacity of the soil moisture tank, which expresses the maximum storage capacity of the ground (mm). |
| So | Initial reserve of the soil moisture. |
| λ | Discharge rate of the soil moisture tank, for the creation of subsurface flow. |
| H1 | Reserve threshold of the soil moisture tank, for the creation of subsurface flow. |
| μ | Discharge rate of the soil moisture tank, for the creation of infiltration. |
| ξ | Discharge rate of the groundwater tank, for the creation of base flow. |
| H2 | Reserve threshold of the groundwater tank, for the creation of base flow. |
| φ | Discharge rate of the groundwater tank, for the creation of subsurface outflow. |
| ϒo | Initial reserve of the groundwater tank. |
| Stations | Ammi Moussa | Chouly | Djediouia | Haciaba | L. Ouled Fares | Oued Lilli | Tikezal | Bir Ouled Tahar | |
|---|---|---|---|---|---|---|---|---|---|
| Calibration | Period | 1980–1997 | 1979–1996 | 1979–1996 | 1980–1995 | 1983–2000 | 1979–1996 | 1990–2004 | 1990–2002 |
| NSE (calibration) | 0.56 | 0.98 | −0.84 | 0.16 | −5.81 | 0.55 | 0.62 | 0.60 | |
| RMSE | 40.67 | 3.61 | 9.29 | 5.53 | 60.92 | 4.67 | 4.29 | 24.91 | |
| Zygos modelparameters | κ | 0.247 | 0.04 | 0.154 | 0.013 | 0.694 | 0.131 | 0.01 | 0.023 |
| μ | 0.023 | 0.99 | 0.22 | 0.839 | 0.4 | 0.188 | 0.886 | 0.017 | |
| ε | 0.547 | 0.99 | 0.99 | 0.099 | 0.01 | 0.399 | 0.813 | 0.189 | |
| H1 | 39.42 | 133.99 | 13.52 | 101.23 | 3.80 | 40.09 | 6.00 | 0.74 | |
| H2 | 68.99 | 96.88 | 263.29 | 158.71 | 5.00 | 115.60 | 72.23 | 60.40 | |
| λ | 0.104 | 0.889 | 0.145 | 0.378 | 0.99 | 0.318 | 0.99 | 0.029 | |
| ξ | 0.341 | 0.225 | 0.77 | 0.659 | 0.699 | 0.89 | 0.99 | 0.63 | |
| φ | 0.01 | 0.03 | 0.35 | 0.23 | 0.01 | 0.03 | 0.02 | 0.15 | |
| k | 120.28 | 156.9 | 111.85 | 182.73 | 170.14 | 100.01 | 195.61 | 111.28 | |
| So | 14.62 | 17.68 | 11.11 | 16.6 | 20.26 | 10.37 | 9.61 | 8.39 | |
| ϒo | 5.09 | 5.00 | 226.84 | 271.23 | 295.31 | 20.03 | 290.00 | 116.20 | |
| Objective function | 0.594 | 0.767 | 0.41 | 0.071 | 0.0736 | 0.696 | 0.018 | 0.171 | |
| Validation | Period | 1998–2004 | 1997–2004 | 1997–2004 | 1996–2001 | 2001–2007 | 1997–2004 | 2005–2011 | 2003–2008 |
| NSE (validation) | 1.00 | 0.96 | −1.48 | 0.85 | −0.45 | 0.02 | 0.37 | 0.29 | |
| RMSE | 0.84 | 2.56 | 10.65 | 0.82 | 27.19 | 3.42 | 23.34 | 42.36 |
| STATIONS | Quantile Mapping (QM) | Scaled Distribution Mapping (SDM) | ||||||
|---|---|---|---|---|---|---|---|---|
| RCP4.5 2050 | RCP4.5 2100 | RCP8.5 2050 | RCP8.5 2100 | RCP4.5 2050 | RCP4.5 2100 | RCP8.5 2050 | RCP8.5 2100 | |
| Bir Ouled Tahar | −27% | −30% | −31% | −51% | −22% | −25% | −16% | −38% |
| Tikezal | −57% | −55% | −44% | −53% | −42% | −38% | −25% | −37% |
| Larabaa Ouled Fares | −16% | −15% | −15% | −40% | −17% | −14% | −14% | −30% |
| Ammi Moussa | −20% | −30% | −25% | −48% | −5% | −17% | −16% | −27% |
| Oued Lilli | −16% | −27% | −27% | −49% | −3% | −6% | −15% | −27% |
| Djediouia | −22% | −28% | −27% | −37% | −17% | −30% | −12% | −20% |
| Haciaba | −42% | −41% | −46% | −54% | −23% | −30% | −33% | −41% |
| Chouly | −18% | −30% | −29% | −47% | 0% | −6% | −11% | −24% |
| STATIONS | Quantile Delta Mapping (QDM) | Model (RAW) | ||||||
| RCP4.5 2050 | RCP4.5 2100 | RCP8.5 2050 | RCP8.5 2100 | RCP4.5 2050 | RCP4.5 2100 | RCP8.5 2050 | RCP8.5 2100 | |
| Bir Ouled Tahar | −9% | −12% | −15% | −38% | −24% | −26% | −24% | −46% |
| Tikezal | −43% | −39% | −27% | −38% | −50% | −48% | −35% | −47% |
| Larabaa Ouled Fares | −11% | −11% | −11% | −38% | −21% | −28% | −27% | −47% |
| Ammi Moussa | −12% | −21% | −16% | −37% | −9% | −19% | −20% | −40% |
| Oued Lilli | −4% | −16% | −16% | −37% | −9% | −19% | −20% | −40% |
| Djediouia | −16% | −9% | −22% | −32% | −13% | −23% | −25% | −40% |
| Haciaba | 51% | 67% | 64% | 66% | −15% | −16% | −20% | −27% |
| Chouly | 71% | 56% | 58% | 35% | −21% | −23% | −21% | −41% |
| STATIONS | Quantile Mapping (QM) | Scaled Distribution Mapping (SDM) | ||||||
|---|---|---|---|---|---|---|---|---|
| RCP4.5 2050 | RCP4.5 2100 | RCP8.5 2050 | RCP8.5 2100 | RCP4.5 2050 | RCP4.5 2100 | RCP8.5 2050 | RCP8.5 2100 | |
| Bir Ouled Tahar | −10% | −3% | −27% | −51% | −18% | −19% | −6% | −44% |
| Tikezal | −90% | −91% | −36% | −32% | −38% | −52% | 27% | 42% |
| Larabaa Ouled Fares | −7% | −4% | −6% | −28% | −10% | −7% | −3% | −21% |
| Ammi Moussa | −22% | −23% | −9% | −50% | −16% | −15% | −6% | −31% |
| Oued Lilli | −27% | −23% | −24% | −48% | −9% | −18% | −8% | −29% |
| Djediouia | −18% | −19% | −7% | −11% | −18% | −24% | −2% | −7% |
| Haciaba | −75% | −75% | −77% | −80% | −69% | −71% | −73% | −75% |
| Chouly | −61% | −58% | −60% | −92% | −55% | −35% | −58% | −93% |
| STATIONS | Quantile Delta Mapping (QDM) | Model (RAW) | ||||||
| RCP4.5 2050 | RCP4.5 2100 | RCP8.5 2050 | RCP8.5 2100 | RCP4.5 2050 | RCP4.5 2100 | RCP8.5 2050 | RCP8.5 2100 | |
| Bir Ouled Tahar | 21% | 24% | 26% | −35% | −1% | −1% | −5% | −53% |
| Tikezal | −36% | −77% | 46% | 22% | −88% | −91% | −22% | −41% |
| Larabaa Ouled Fares | −1% | 0% | −2% | −25% | −13% | −18% | −44% | −37% |
| Ammi Moussa | −14% | −17% | 5% | −39% | −5% | −5% | −6% | −47% |
| Oued Lilli | −20% | −19% | −11% | −36% | −23% | −19% | −31% | −50% |
| Djediouia | −4% | −72% | 5% | 6% | −10% | −22% | −27% | −58% |
| Haciaba | −43% | −37% | −38% | −38% | −66% | −66% | −68% | −70% |
| Chouly | 118% | 63% | −70% | −55% | −70% | −45% | −52% | −92% |
Publisher’s Note: MDPI stays neutral with regard to jurisdictional claims in published maps and institutional affiliations. |
© 2022 by the authors. Licensee MDPI, Basel, Switzerland. This article is an open access article distributed under the terms and conditions of the Creative Commons Attribution (CC BY) license (https://creativecommons.org/licenses/by/4.0/).
Share and Cite
Renima, M.; Zeroual, A.; Hamitouche, Y.; Assani, A.; Zeroual, S.; Soltani, A.A.; Mulowayi Mubulayi, C.; Taibi, S.; Bouabdelli, S.; Kabli, S.; et al. Improving Future Estimation of Cheliff-Mactaa-Tafna Streamflow via an Ensemble of Bias Correction Approaches. Climate 2022, 10, 123. https://doi.org/10.3390/cli10080123
Renima M, Zeroual A, Hamitouche Y, Assani A, Zeroual S, Soltani AA, Mulowayi Mubulayi C, Taibi S, Bouabdelli S, Kabli S, et al. Improving Future Estimation of Cheliff-Mactaa-Tafna Streamflow via an Ensemble of Bias Correction Approaches. Climate. 2022; 10(8):123. https://doi.org/10.3390/cli10080123
Chicago/Turabian StyleRenima, Mohammed, Ayoub Zeroual, Yasmine Hamitouche, Ali Assani, Sara Zeroual, Ahmed Amin Soltani, Cedrick Mulowayi Mubulayi, Sabrina Taibi, Senna Bouabdelli, Sara Kabli, and et al. 2022. "Improving Future Estimation of Cheliff-Mactaa-Tafna Streamflow via an Ensemble of Bias Correction Approaches" Climate 10, no. 8: 123. https://doi.org/10.3390/cli10080123
APA StyleRenima, M., Zeroual, A., Hamitouche, Y., Assani, A., Zeroual, S., Soltani, A. A., Mulowayi Mubulayi, C., Taibi, S., Bouabdelli, S., Kabli, S., Ghammit, A., Bara, I., Kastali, A., & Alkama, R. (2022). Improving Future Estimation of Cheliff-Mactaa-Tafna Streamflow via an Ensemble of Bias Correction Approaches. Climate, 10(8), 123. https://doi.org/10.3390/cli10080123