Article

Contemporary Climate Change and Its Hydrological Consequence in the Volga Federal District, European Russia

by
Yuri Perevedentsev
1,
Artyom Gusarov
2,*,
Nadezhda Mirsaeva
1,
Boris Sherstyukov
3,
Konstantin Shantalinsky
1,
Vladimir Guryanov
1 and
Timur Aukhadeev
1
1
Institute of Environmental Sciences, Kazan Federal University, 420008 Kazan, Russia
2
Institute of Geology and Petroleum Technologies, Kazan Federal University, 420008 Kazan, Russia
3
All-Russia Research Institute of Hydrometeorological Information–World Data Centre (RIHMI–WDC), 249035 Obninsk, Russia
*
Author to whom correspondence should be addressed.
Climate 2022, 10(12), 198; https://doi.org/10.3390/cli10120198
Submission received: 1 November 2022 / Revised: 3 December 2022 / Accepted: 9 December 2022 / Published: 12 December 2022

Abstract

:
An analysis of spatiotemporal variability of air temperature and precipitation in the Volga Federal District (European Russia) between 1966 and 2021 was carried out. Based on data from 20 meteorological stations, relatively evenly located on the territory under consideration, the spatial distribution of average monthly and average annual air temperatures and monthly and annual precipitation was assessed; some indicators of the temporal variability of these variables in the period under consideration were calculated and analyzed. It was revealed that throughout the Volga Federal District, there was a tendency of climate warming in all months, and a slight increase in annual precipitation, except for the southeast of the district, where the precipitation trend was negative. It is noted that in the period 1955–1998, the number of negative air temperature anomalies was approximately equal to the number of positive ones; however, in the later period 1999–2021, the number of positive anomalies significantly exceeded the number of negative ones. Based on reanalysis data, climatic maps of vaporization and runoff in the Volga Federal District during 1966–2021 were created. The dependence of air temperature fluctuations on the nature of atmospheric circulation was revealed using the NAO, AO, and SCAND indices. On the example of the central part of the district (Republic of Tatarstan), some increase in summer aridity of the climate was revealed by using Budyko’s dryness index, Selyaninov’s hydrothermal coefficient, and Sapozhnikov’s humidification coefficient. The indicators of runoff and evaporation were also calculated using the methods of Schreiber and Ivanov. Against the background of the positive trend in vaporization rates, favorable conditions for a decrease in runoff were noted.

1. Introduction

The problem of modern changes in the environment and climate is reflected both in the materials of the Sixth Assessment Report of the IPCC [1] and in a special report on climate change dedicated to the problem of curbing the growth of the average global air temperature to 1.5 °C [2]. This concern is caused by the need to maintain climate stability in regions of the world that respond differently to global challenges. Among the regions in which noticeable climate change has occurred in recent decades is the east of the Russian Plain, where the Volga Federal District (VFD) is located. In earlier works [3,4,5,6,7], the issues of regional fluctuations in the main climatic indicators against the background of baric and circulation processes in the troposphere of the Northern Hemisphere were considered separately. Among the first major climate studies in the region is the monograph by N.V. Kolobov [3], which assessed the influence of atmospheric circulation, the radiation factor, and the state of the underlying surface on changes in the temperature regime and moisture content. These studies used data from observations up to the 1960s. However, this period preceded the era of global warming that began in the mid-1970s. In the modern period, the work [8] describes climate change in the Volga Federal District in the period 1966–2009. Climate warming has been identified throughout its territory. The work [9] describes the radiation, thermal and wind factors, humidity regime, and meteorological phenomena that form the climate of Russia. The specialized indicators used in various spheres of the economy and social sphere are given.
The next most important works on the study of the climate of Russia are as follows. The paper [10] considers the possible mechanisms of the formation of significant anomalies of weather-climatic conditions on the territory of Russia in recent years and their relationship with global climate change and natural quasi-climatic processes. In [11], the results of the analysis of the state of the climate, its seasonal and geophysical features, as well as current trends in its change based on observation data in Russia are presented. It was shown in [12] that during the modern period, there was a decrease in the variability of the daily average air temperature (DAAT) in the interdiurnal and synoptic ranges in winter in most regions of Russia.
The global warming of the last decades in many regions of the planet, including Russia, has been accompanied by an increase in the number of days with abnormal weather phenomena [10]. A number of such phenomena was associated with extreme values of surface temperature, heat and cold waves, and sharp temperature jumps [13]. Together with an increase in annual average air temperature in most of Russia in 2009–2014, there was an increase in seasonal and daily maximum air temperatures, as well as an increase in annual average maxima and minima of DAAT. The greatest increase in air temperature throughout Russia was observed during the cold period [14].
In [13], an increase in the frequency of days with high daily air temperatures and a daily amount of precipitation, and a decrease in frosty days were found. The greatest changes are observed in European Russia. In the south of Siberia, at the beginning of the 21st century, the frequency of frosty and warm days and days with extreme winter precipitation increased simultaneously.
It was shown in [15] that in the period 1970–2004, the average values of trend changes in the annual average air temperature and the average air temperature in winter and summer throughout Russia were 3.8, 5.1, and 3.2 °C/100 years, respectively. In the period 1900–2004, the annual average air temperature trend for the territory of Russia was 1.1 °C/100 years. The secular trends of the annual average air temperature (1900–2004) vary from 0.5 °C/100 years in the north of the Ural Mountains and Primorsky Krai (located in the Far East region of the country) to 1.4–1.6 °C/100 years in the south of the Urals; in Siberia and the Far East of Russia, the average was 1.1 °C/100 years. In the winter period of 1950–2004, these trend changes ranged from 0.2 °C/100 years (in the north of the Ural Mountains) to 2.4–2.6 °C/100 years. In our paper, the analysis involved more extensive material over a longer period, which became possible due to the development of modern information and computing technologies and free access to meteorological and reanalysis data.
The most complete data on climate change and its consequences in the Russian Federation are contained in the Third Assessment Report of the Federal Service for Hydrometeorology and Environmental Monitoring (RosHydromet) [16], according to which, the territory of Russia is heating twice as fast as the Northern Hemisphere as a whole: 0.51 °C/10 years, and each decade starting from 1981 to 1990 was warmer than the previous one, with nine of the ten warmest years occurred at the beginning of the 21st century. Both annual and seasonal precipitation increased, especially in spring. In summer, a decrease in precipitation is noted due to an increase in the duration of blocking episodes in the southern regions of European Russia.
The purpose of this paper is to provide a comprehensive analysis of changes in the characteristics of the air temperature and humidity regimes in the Volga Federal District in recent decades, taking into account some consequences for the environment (mainly hydrological ones) during the active phase of global climate warming. As far as we know, such a generalization is given for the study area of European Russia for the first time.

2. Materials and Methods
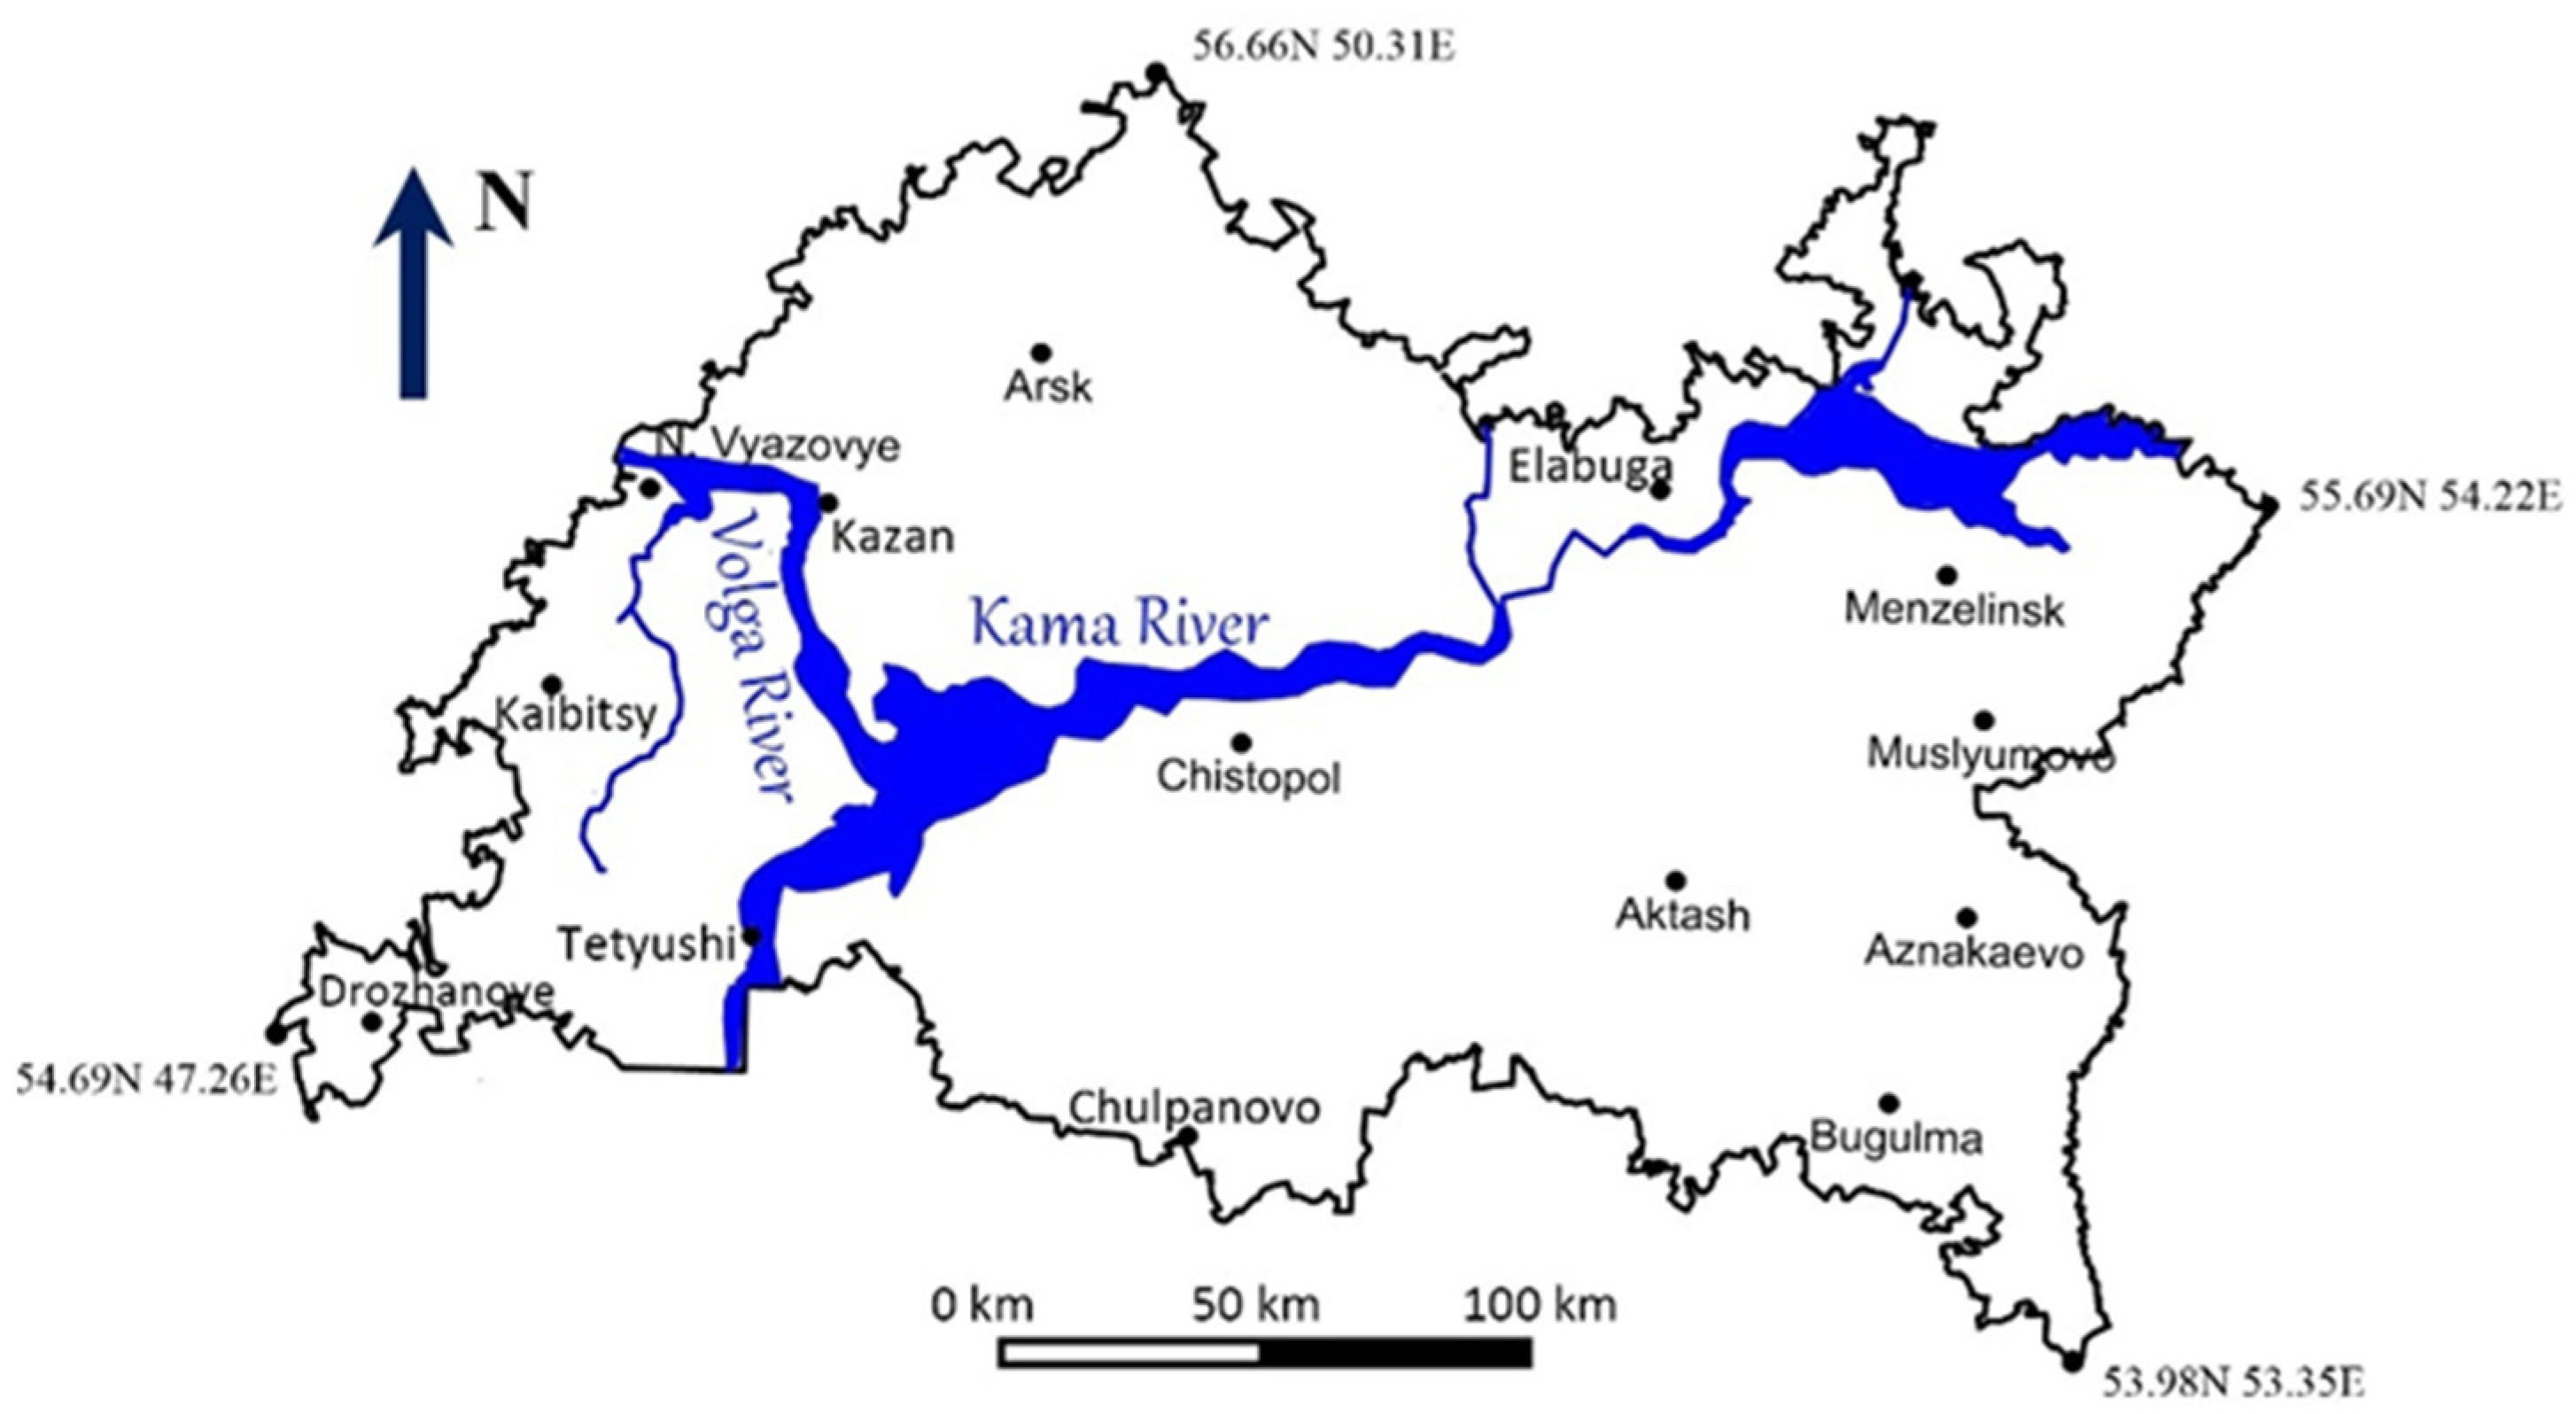
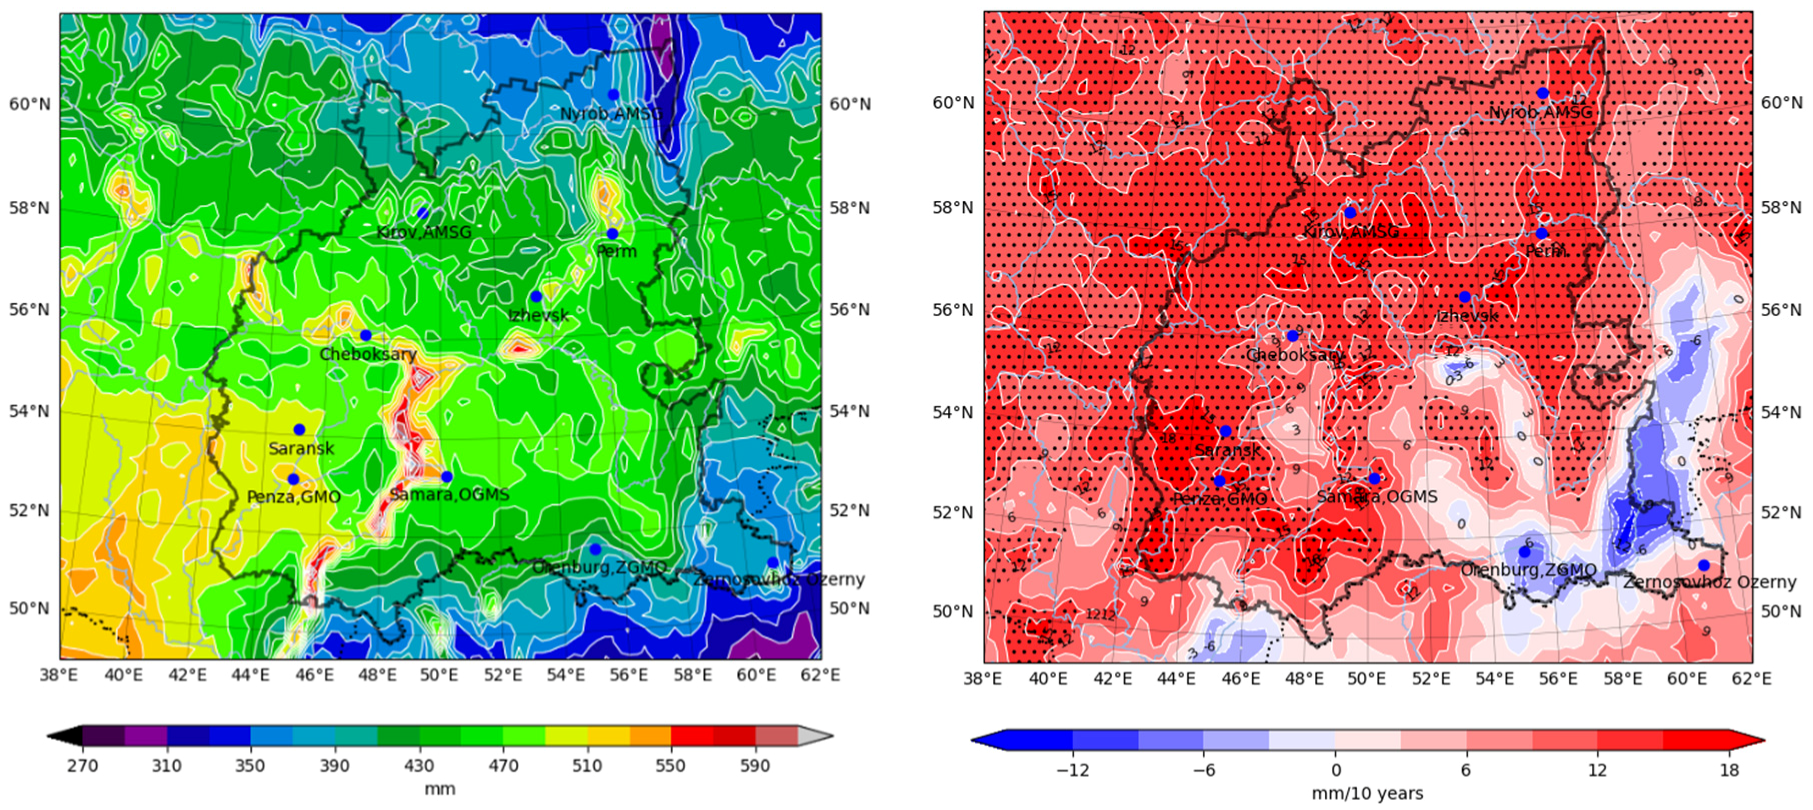
2.1. Study Area

The Volga Federal District (1,038,000 km2) occupies about 6% of Russia; the population of the district is 28.84 million inhabitants (about 22%). It is one of the most densely populated federal districts in the country. The district includes 14 administrative regions (Figure 1).
The Republic of Tatarstan (67.8 thousand km2), which is part of the Volga Federal District, was chosen as the key administrative region in our study (Figure 2). There are 13 meteorological stations in the republic where long-term meteorological monitoring is carried out. Data from these stations were also additionally used in our analysis.

2.2. Data and Statistical Processing

Climatic calculations were carried out using reanalyses of data from 183 meteorological stations located on the territory of the Volga Federal District (RIHMI-WDC). Long-term series of initial data were subjected to statistical processing: average values, standard deviations (SD), normalized anomalies, and linear trends in air temperature and precipitation were calculated. The identification of the low-frequency component (LFC) in the analyzed meteorological series was carried out using a Potter low-frequency filter with a cut-off threshold of 15 years or more. The significance of the results obtained was assessed using the Fisher test and non-parametric Mann–Kendall test.

2.3. Methods

To characterize the humidity of the study region, the following indices (coefficients) were calculated [17]:
  • Budyko’s Dryness Index (DI): <0.45—excessively humid climate; 0.45–1.0—humid climate; 1.0–3.0—insufficiently humid climate, and >3.0—dry climate;
  • Selyaninov’s Hydrothermal Coefficient (HTC): <0.2—very severe drought; 0.2–0.4—severe drought; 0.4–0.6—moderate drought; 0.6–0.7—mild drought; 0.7–1.0—insufficient moisture; 1.0–1.4—optimal moisture; 1.4–1.6—increased moisture; and >1.6—excessive moisture;
  • Sapozhnikova’s Humidity Coefficient (Sapozhnikova’s HC); it has the same gradations as the Selyaninov’s Hydrothermal Coefficient.
  • Ivanov’s Humidity Coefficient (Ivanov’s HC), i.e., the ratio of annual precipitation to annual evaporation (here and below, potential evaporation): 1—optimal moisture; >1—excessive moisture; <1—insufficient moisture (<0.25–0.35—drought);
The runoff (annual values) was also calculated using the following formula [18,19]:
R = P − E
where R is climate-induced water runoff, P is precipitation, E is the total vaporization (here and below, actual evaporation) on the Earth’s surface. To calculate the vaporization E, the following formula of Schreiber (2) was used:
E = P   ( 1 e E 0 / P )
where E0 is evaporation. The use of this formula gave almost identical E0 values compared to the formula of Oldekop (E = E0 th(P/E0)) [20]. The value of E0 was calculated according to the formula of Ivanov [21]:
E 0 = 0.0018 ( 25 + t ¯ ) 2 ( 100 f )
where t ¯ is the monthly average air temperature (°C), f is the relative air humidity (%) during this month. In addition, to compare the results obtained, the E0 value was calculated by the methods of Holdridge and Tyurk [22,23].
The runoff coefficient (μ) was calculated using the following formula:
μ = R P = 1 E P
where E P   is the vaporization coefficient. The runoff coefficient increases with increasing moisture content in the area. The value of μ ranges from 0 to 1.
The integral indicator of winter anomaly (α) was determined by the formula [24]:
α = 1 N K = 1 N 1 2 Δ t I σ I + Δ t I I σ I I k
where N is the number of meteorological stations analyzed, Δ t I σ I and Δ t I I σ I I are normalized air temperature anomalies at a station (K) for January and February, respectively; σ I and σ I I are air temperature SD in January and February, respectively. In European Russia south of 60° N, winter is considered extremely cold at α < −0.9 and extremely warm at α > 1.0.
As an indicator of the state of the natural environment, the Climatic Index of Biological Efficiency (CIBE) was also calculated. This index is the multiplication of the sum of active temperatures >10 °C (active phase of the growing season; APGS) (0.01 × ΣT>10 °C) by Ivanov’s Humidity Coefficient (Ivanov’s HC):
CIBE = 0.01 × ΣT>10 °C × Ivanov’s HC
The above coefficient of Ivanov is found as the ratio of the annual precipitation (P, mm) to the annual evaporation (E, mm), which is obtained by summing the evaporation values for each month (Emonth) (7):
Ivanov s   HC = P E month

3. Results and Discussion

Let us consider the features of spatiotemporal changes in air temperature and precipitation in the Volga Federal District from 1966 to 2021. Table 1, Table 2, Table 3 and Table 4 present results calculated for 20 meteorological stations of the Volga Federal District, located from north to south, which makes it possible to characterize the state of the climate as a whole throughout the entire district. The values of the long-term annual average air temperature varied from southwest to northeast from 6.9 °C (Saratov) to 0.5 °C (Nyrob). In the central part of the district, they were about 3.0–4.0 °C; from west to east, the air temperature decreased there from 4.9 to 3.9 °C. The most severe conditions were formed in the elevated areas of the Republic of Bashkortostan and in the northeast of Perm Krai (see Figure 1). Annual isotherms stretched from the northwest to southeast.
In January, the monthly average air temperature ranged from −16.3 °C (northeast) to −8.8 °C (southwest). The lowest air temperature was observed in the eastern half of the district. In winter, the formation of the temperature regime occurred under conditions of a negative radiation balance of the Earth’s surface and under the influence of heat advection from the North Atlantic. This circumstance created a temperature difference of 4–6 °C between the west and east of the Volga Federal District.
In July, the arrangement of isotherms acquired a zonal character under the conditions of the annual maximum of radiative heating. The monthly average air temperature rose from 17.1 °C (northeast) to 22.5 °C (southwest and southeast); the air temperature contrasts along the meridian were noticeably smaller than in January.
The west of the district was characterized by a fairly mild continental climate compared to the east. The intra-annual amplitude of monthly average air temperatures was minimum in the west (29.3 °C, Nizhny Novgorod) and maximum in the southeast (37.5 °C, Zernosovkhoz Ozerny). This distribution reflects an increase in the continentality of the climate from northwest to southeast.
In April, the monthly average air temperature rose rapidly and a positive temperature background was established throughout the district: the difference between the north and south of the region was 7.4 °C. In autumn, the reverse process occurred: in November, the air temperature was negative everywhere, and the lowest air temperature was observed in the northeast (−7.4 °C, Nyrob); the isotherms acquired features close to those of winter.
The value of σ (standard deviation), which characterizes the interannual variability of air temperature, has a well-defined annual variation. It was maximum in January in the northwest (σ = 3.10 °C, Lalsk) and minimum in June in the south of the study area (σ = 1.87 °C, Saratov). The difference in long-term monthly average air temperatures between the southwest (Saratov) and northeast of the Volga Federal District (Nyrob) during the year was 6.4 °C; it was maximum in May (7.9 °C) and minimum in March (3.6 °C). In the northeast and east of the district, the lowest January average air temperature was observed. In Ulu-Telyak, Ufa (Dema), and Nyrob (AMSG) (see Figure 1), it dropped in 1969 to −28.7, −28.3, and −28.1 °C, respectively. The hottest July was in Orenburg (26.8 °C) in 2010.
To identify a systematic component of air temperature changes for all months of the year, linear trends were revealed for 20 meteorological stations in the Volga Federal District for 1966–2021 (Table 2). Analysis of the obtained results showed that the most significant increases in air temperature occurred in January and February. The LTSC value in January varied across the study area within 0.53–1.25 °C/10 years; in February, these values decreased compared to January. In the warm period, the value of LTSC was noticeably lower than in the cold one. Thus, in July, the values of LTSC > 0 and fluctuated within 0.09–0.56 °C/10 years. The smallest changes in the thermal regime occur in spring. In April, the LTSC value fluctuated within 0.07–0.38 °C/10 years. There were no stations with negative trend values in the study period. In general, during the year, an increase in air temperature was observed at all stations in the district. For the annual average air temperature, the LTSC value varied within 0.27–0.53 °C/10 years (see Table 2).
An analysis of air temperature distribution maps over the district showed that in its western part, the annual average air temperature rises faster than in the eastern and southeastern parts, and winter trends over the territory as a whole were more significant than in the summer months. If in January, almost throughout the entire territory, with the exception of the southeast, the LTSC value is >0.6 °C/10 years, then in July, the largest increase in air temperature was observed in the southwest, and a reduced rate of warming is observed in most of the district, especially in its southeastern part.
The use of the non-parametric Mann–Kendall test at a 5%-significance level (p = 0.05) showed that the trends of monthly average air temperatures during 1966–2021 were significant for all stations in January and October. In February, these trends were statistically significant for Kazan (CGMS), Ufa (Dema), Ulu-Telyak, Penza (GMO), Samara (OGMS), Balashov, and Saratov. In March, the trends were significant for the stations in Perm, Izhevsk, Kazan (CGMS), Ufa (Dema), Ulu-Telyak, and Samara (OGMS). In April, as in November, all trends were not significant. In May, they were significant for the stations at the top of Table 2 (from Lalsk to Kazan (CGMS)), as well as for Ulu-Telyak and Samara (OGMS). In June, the trends were significant only for Uchaly, Penza (GMO), Samara (OGS), Perelub, and Orenburg (ZGMO). In July, these were N. Novgorod (Myza), Kazan (CGMS), Ufa (Dema), Penza (GMO), Samara (OGMS), and Balashov. In August, the list of stations expanded to 14. There were eight stations in September and five stations in December with statistical significance for these trends. For a more detailed look at the spatial distribution of the statistical significance of these trends in January and July, see also Appendix A (Figure A1 and Figure A2).
The annual precipitation over 56 years (1966–2021) was about 530 mm for the study area (Table 3). The greatest amount of precipitation falls in the northern part of the Volga Federal District (≈659 mm per year in Kirov) and the least in the southern and southeastern parts (only 274 mm falls annually at the Zernosovkhoz Ozerny station). Under the influence of the Ural Mountains, the annual amount of precipitation increases in the east of the region, i.e., in Perm Krai and the Republic of Bashkortostan: the maximum precipitation was recorded at Ulu-Telyak–707 mm per year (see Figure 1). The features of the underlying surface and topography determine the formation of local areas of maximum precipitation on the windward slopes of the Bugulma-Belebey Upland and Volga Upland, the Northern Uvals and Vyatskiy Uval, and the Ufa Plateau.
As can also be seen from Table 3, in the district, with the exception of its south and southeast, the variation of annual precipitation was well manifested. The greatest amount of precipitation fell in the summer months, and the minimum was in February–March. For example, in the northeast of the Volga Federal District, precipitation in a layer of 81 mm falls in Kirov in July, and half as much in Orenburg (39 mm). The minimum amount of precipitation falls during the year in the southeast (in the steppe regions), where precipitation varies from 13 mm in February to 39 mm in July (Zernosovkhoz Ozerny).
Linear trends for the period 1966–2021 indicate an increase in annual precipitation at a rate from 2.2 mm/10 years (Penza, GMO) to 30.6 mm/10 years (Nyrob, AMSG). The annual precipitation increases in the northwestern and northeast parts of the Volga Federal District and slightly increases in its southeast part; in Bugulma, Orenburg (ZGMO) and Saransk, there was even a slight decrease at a rate from –0.8 to –12.7 mm/10 years.
The distribution of LTSC values of precipitation over the Volga Federal District was spotty, which is especially noticeable over the months. In January, LTSC values vary from −1.5 mm/10 years (Zernosovkhoz Ozerny) to 5.1 mm/10 years (Kazan, CGMS); in July, the rate of change ranges from −6.4 mm/10 years (Uchaly) to 3.4 mm/10 years (Lalsk). In most of the Volga Federal District, precipitation decreased in July; this was especially noticeable in the eastern and southern parts of the district. The increase in precipitation occured mainly in spring and early summer. In December, the positive sign of the LTSC also prevailed in the region (Table 4). Linear trends in monthly precipitation at a 5% significance level (p = 0.05) were insignificant for almost most stations. For a more detailed look at the spatial distribution of the statistical significance of these trends in January and July, see also Appendix B (Figure A3 and Figure A4).
Features of the temperature and humidity regimes of the district were also manifested in the distribution of hydrological characteristics. In this regard, according to the ERA-5 reanalysis data for the Volga Federal District, the values of annual evaporation E0, vaporization E, and runoff (R) were determined for the period 1966–2021.
Calculations of the annual evaporation E0 using the method of Holdridge showed that there was a clearly defined zoning: it increased from 295 mm (northeast) to 550 mm (extreme southwest) as biotemperatures (positive monthly average air temperatures) increased. It should be noted that the calculations of the annual evaporation using the Tyurk method [23] showed similar results: the E0 value also increased from the northeast to the southwest of the district, from 310 to 470 mm.
Figure 3 presents the results of calculations of annual evaporation using the method of Ivanov, which in their structure correspond to the results obtained using the methods of Holdridge and Tyurk, but exceed them in absolute values. The E0 value increased from the northeast (<350 mm) to the southwest (≈800 mm) of the Volga Federal District.
As can be seen from Figure 4, the highest values of annual vaporization E were observed in the central and southwestern parts of the district (E = 520 mm/year), where the climate is more humid and air temperatures are relatively high. In the northern part, there was enough moisture (E ≈ 400 mm/year), but low air temperatures; in the southeastern most arid part of thedistrict, the value of E was minimum (340 mm/year). The calculated LTSC values of vaporization point to the heterogeneity of their changes (Figure 4).
The annual runoff (Figure 5), which depends on the ratio of vaporization and precipitation, reaches the highest values in the northeast of the Volga Federal District (R ≈ 530 mm within the Ural Mountains). In the Cis-Urals (R ≈ 300 mm), in the northwest (R ≈ 250 mm), and in the southern half of the region, the runoff is less (R ≈ 100 mm and less), which is explained by insufficient precipitation and increased vaporization. The calculated values of the runoff LTSC (Figure 5) indicate its decrease throughout the Volga Federal District: In the central part of the district, the change in runoff reaches −4 mm/10 years, and in the southeast and northeast, there are foci with an LTSC value of about −6 mm/10 years. All this indicates an increase in the aridity in the study region, especially in its south.
In the period 1955–2018, large normalized anomalies of near-surface air temperature (∆TT) averaged over the Volga Federal District were estimated based on data from 183 meteorological stations. When estimating large normalized anomalies of near-surface air temperature (∆TT), two sub-periods, 1955–1998 and 1999–2018, were analyzed. The choice of these sub-periods is due to the fact that at the turn of the two centuries, there was a positive jump in the annual average air temperature by 1.2 °C, a decrease in interannual air temperature variability, and a sharp increase in the minimum air temperature. The analysis showed that the number of large positive anomalies during 1955–2018 was more common in the spring months (III–V) and in June when their number ranged from 11 to 15, which was a percentage of 17.2 to 23.4% of the time, i.e., almost every fourth or fifth month was abnormally warm. The average intensity of the anomaly varied from 1.24 (December) to 1.74 (August). The number of negative anomalies was approximately the same as positive ones, but they often exceeded positive anomalies in intensity. A sub-period of 1999–2018 was distinguished, in which the number of positive anomalies significantly exceeded the number of negative ones. At the same time, the proportion of the time of existence of positive anomalies has increased significantly in percentage terms (often up to 30%), which indicates a noticeable warming of the climate in the Volga Federal District in the 21st century. The intensity of positive normalized anomalies varied from 1.26 (June) to 1.81 (August). The intensity of negative normalized anomalies varied from −1.20 (October) to −2.51 (December). At the same time, in April and September, there were no cases with a large negative anomaly over the past twenty years.
The identified trends were confirmed by the behavior of the integral indicator of winter anomaly in the Volga Federal District. To assess the conditions for overwintering of winter crops, a catalog of winter anomalies was built according to the method of A.V. Meshcherskaya [24] (Figure 6), according to which the integral indicator of winter anomaly is determined by the Formula (5).
As follows from Figure 6, abnormally cold winters were observed most often in 1954–1976 (the most severe winter was in 1969); in the period 1977–2005 (the active phase of climate warming), severe winters were not observed in the Volga Federal District, and only in the period 2006–2011 they reappeared. The latter was associated with a pause in global warming. Since 2012, there have been no more extreme cold winters. At the same time, the winter of 2020 was noted as extremely warm. The linear trend was positive. On the LFC curve, periods with cold and warm winters were clearly distinguished.
To assess the role of atmospheric circulation in the formation of the thermal regime of the area under study, we used the correlation coefficients between the monthly average values of air temperature, both averaged over the district and meteorological stations (61 stations in the region and adjacent territories), and circulation indices: North Atlantic Oscillation (NAO), Arctic Oscillation (AO), and Scandinavian Oscillation (SCAND) during the year in the period 1954–2021 (68 years) (Table 5).
As can be seen from Table 5, the intra-annual course of the correlation coefficients of the average air temperature of the district with the AO and NAO indices was similar. This was due to a fairly close relationship between these indices, especially in the cold season (the correlation coefficient between these indices in the period from December to March is 0.71–0.80). The closest positive relationships between air temperatures in December–March, both with the NAO index (r reaches 0.47 in December) and the AO index (r = 0.43 in January), were observed.
According to some modern ideas, the AO was largely the result of the interaction of the troposphere and stratosphere. The positive phase of the AO was associated with a positive anomaly in the intensity of the circumpolar vortex and an increase in the average zonal current. Since the 1970s, the AO has tended to remain in the positive phase more [25].
About half of the variability in warming in the Northern Hemisphere from the mid-1970s to the beginning of the 21st century can be explained by long-term fluctuations in the near-surface air temperature of the North Atlantic—the Atlantic Multidecadal Oscillation (AMO), which moved from a relatively cold to a warm phase with an increase in heat fluxes from the ocean to the atmosphere in the North Atlantic and the Arctic during this period. It was noted that during periods of stable positive anomalies of the near-surface air temperature of the North Atlantic, a restructuring of large-scale atmospheric circulation was observed, which affected the regional climate both in Western and Eastern Europe [13].
A significant negative correlation is noted between the district-averaged air temperature and the SCAND index from December to May, as well as in October (the correlation coefficient was significant at 0.27 and higher at a confidence level of 0.95). The closest relationship was found in January and February (r = –0.60); in the summer period, it was insignificant.
Linear regression of the district-averaged air temperature (as the resulting variable), and jointly the NAO and SCAND indices (as factorial variables) shows that 27–47% of the air temperature dispersion in December–March and about 21% in October were described by circulation changes. At the same time, in January and February, the influence of the SCAND index was more than twice as strong; in October, this influence prevailed; in March, the influence of both indices was approximately the same; and in December, the influence of the NAO index prevailed. Adding the AO index (factorial variable) to the regression model does not have a significant impact on the characteristics of the model due to the rather close relationship between the AO and NAO indices.
Thus, during the cold period of the year, atmospheric circulation indices were closely related to changes in the monthly average air temperature, and the circulation factor, in contrast to the summer season, played a significant role in air temperature fluctuations. To obtain more detailed spatiotemporal patterns, the atmospheric circulation indices were calculated by months according to data from 61 meteorological stations for a 68-year period. As a result, 36 maps were created, a brief analysis of which allowed us to draw the following conclusions.
The results of calculating the correlation of air temperature indicators with the SCAND index are as follows: in January, the value of r increased from −0.4 (northwest) to −0.7 (southeast), and isocorrelates were directed from southwest to northeast; in February, r = −0.6 in the central part of the district. In March, in the northwest and northeast of the Volga Federal District, the correlation was weak (statistically insignificant); in the south and southeast, the values of r reached −0.5. In April, r = −0.3–0.4 in the east and southeast. In May, the correlation was also weak and statistically insignificant. In September, r = −0.34 only in the east. In October, across the Volga Federal District, r increased from −0.38 to −0.5 from west to east. In November, only in the south of the Volga Federal District, r = −0.36 (statistically significant correlation). In December, in the east and southeast, r reached −0.48. The correlation was closest in winter.
Relationships with the AO. In January, the closest relationship (r = 0.46) was noted in the west of the district. In February, in the northwest of the Volga Federal District, r = 0.46. In March, the north and northwest were distinguished (r = 0.55). In April, the relationship was statistically insignificant (r varies from 0.02 to 0.18). In May and June, the relationship was weak. In June, r = 0.3 in the northeast. In August, September, and October, the relationship was statistically insignificant. In November, the maximum value of r (r = 0.31) was in the northeast of the district. In December, r reached its maximum in the northwest (r = 0.52), and the minimum value was in the south (r ≈ 0.2).
Relationships with the NAO. In January, in most of the district (its west, center, and northeast), r ≥ 0.3 (the maximum was in the northwest, r = 0.46). In February, in most of the district, r ≥ 0.3, except for the south and southeast (the maximum r is 0.5 in the northwest). In March, the picture was the same, and the maximum r was 0.55. In April, the relationship was weak and statistically insignificant. In May, r increased in the south and southeast (r = −0.42), in the west, this relationship was weaker. In June, r was the largest in the east (r = −0.42). In July, the relationship was very weak (negative) and the same in August (but r > 0). In September, the relationship was weak (r > 0). In October, it was also weak (r > 0 was over most of the territory). In November, the same pattern could be found. Finally, in December, r was above zero everywhere, with a maximum (r = 0.48) in the northwest of the district.
Thus, a heterogeneous picture arises by months in the annual course and by territory. In winter, positive correlations were observed between air temperature fluctuations and the NAO circulation index, with the closest correlation observed in the northwest of the region (r = 0.46). In May and June, negative correlations with the NAO (r = −0.42) appeared in the east of the study region. In other words, atmospheric circulation warms the Volga Federal District in winter and cools it in summer. The presented results correspond well to the conclusions obtained earlier for Northern Eurasia [26,27,28].
It is of interest to consider a number of indicators for the Republic of Tatarstan, where meteorological observations have been carried out since 1828 at a meteorological station in Kazan (in Kazan University). According to these observations, this city’s annual average air temperature has increased by 4 °C over the past 200 years [29]. The Republic of Tatarstan was used as an example, since its territory is located in the center (the forest-steppe zone) of the Volga Federal District. The main emphasis was placed on the assessment of its agroclimatic resources, since agriculture is highly developed in this republic.
Based on data from 13 meteorological stations located in Tatarstan, some hydrometeorological values (precipitation, evaporation, vaporization, and runoff) were calculated for 1966–2021. The results of these calculations are presented in Table 6.
As can be seen from Table 6, annual precipitation in Tatarstan ranged from 447 mm (Muslyumovo) to 557 mm (Kazan, CGMS), while SD ranged from 77 (Muslyumovo) to 103 mm (Bugulma). The LTSC values of annual precipitation are characterized by spatial heterogeneity and varied from −7.3 mm/10 years (Drozhanoye) to 12.0 mm/10 years (N. Vyazovye). If in the northwest of the Republic of Tatarstan the annual amount of precipitation increased, then in the south and southeast, it decreased. The annual vaporization E calculated using the Schreiber Formula (2) varies from 323 mm (Muslyumovo) to 380 mm (Kazan), while E increased at a rate of 0.2 mm/10 years to 16.3 mm/10 years throughout the entire Tatarstan, which is explained by an increase in summer air temperatures. The runoff ranges across the territory from 124 mm (Muslyumovo) to 177 mm (Kazan) with a large interannual variability (SD ranges from 60 to 88 mm), while a decrease in the runoff was observed everywhere with a rate of −0.2 mm/10 years (N. Vyazovye) to −11.2 mm/10 years (Elabuga).
In agrometeorology, great importance is attached to the indicators of the coldest (January) and warmest (July) months. As can be seen from Table 7, in January in the territory of the Republic of Tatarstan, the air temperature was the highest at Drozhanoye (−11.24 °C) and the lowest at Muslyumovo (−12.86 °C), i.e., the difference was 1.62 °C. The SD value varied between 3.8–4.5 °C. At the same time, an increase in January air temperatures was observed everywhere at a rate from 0.8 °C/10 years (Bugulma) to 1.0 °C/10 years (Arsk). In July, the monthly average air temperature increased from 18.9 °C (Bugulma) to 20.0 °C (Kazan). The value of SD varied over the republic between 1.78–2.01 °C. As in January, the July air temperatures tended to rise at all stations (the LTSC varied from 0.3 to 0.5 °C/10 years). However, in winter, the process of warming proceeded more intensively.
The runoff coefficient (μ), which depends on annual precipitation and factors that determine evaporation, also did not experience noticeable territorial fluctuations (see Table 6). It ranges from 0.28 (N. Vyazovye and Menzelinsk) to 0.34 (Arsk) (on average 0.30) and shows the proportion of precipitation transformed into surface and underground runoff. For all stations analyzed, the value of runoff LTSC was <0 and varied from −0.2 to −11.2 mm/10 years; it is explained by rising air temperatures in the district. In general, the runoff coefficient characterizes the area under study as a zone of sufficient moisture. The results of the study are consistent with [30].
To characterize the humidity and its dynamics in the Republic of Tatarstan, the Budyko’s Dryness Index, the Selyaninov’s Hydrothermal Coefficient (HTC), Sapozhnikova’s Humidity Coefficient (Sapozhnikova’s HC), and Ivanov’s Humidity Coefficient (Ivanov’s HC) were calculated based on data from 13 meteorological stations. The results of calculations for the period with DAAT > 10 °C are presented in Table 8.
As can be seen from Table 8, the dryness index in summer varied across the territory from 2.70 (Kazan) to 3.26 (Aktash), the HTC index—from 0.96 (Kaibitsy) to 1.16 (Bugulma), and Sapozhnikova’s HC index was from 0.77 (Muslyumovo) to 0.94 (Bugulma). This indicates a balance in the inflow and outflow of moisture. At the same time, the LTSC values have a positive sign for the dryness index and a negative sign for the HTC and Sapozhnikova’s HC indices, which indicates a slight upward trend in aridity in the study area.
In addition, based on data from a meteorological station at Kazan (Kazan–CGMS)–the capital city of the Republic of Tatarstan, Sapozhnikova’s HC and Selyaninov’s Hydrothermal Coefficient (HTC) for 1966–2021 and 1976–2021 were also calculated. As can be seen from Figure 7, in both cases, there is a downward trend in the indices under consideration, which indicates a certain increase in the aridity in Tatarstan. The linear trends of Sapozhnikova’s HC and HTC indices presented in Figure 7 were not statistically significant for 1966–2021 and statistically significant for 1976–2021 (the active phase of global warming) with p < 0.02. At the same time, the low-frequency components of the indices were similar.
It should also be noted that the LTSC value of these indices in the period 1976–2021 was three times higher than the LTSC calculated for the period 1966–2021. So, if for the period 1966–2021 the LTSC value for the HC index was −0.02 units/10 years and the LTSC for the HTC index was −0.037 units/10 years, while for the period 1976–2021, these values were −0.061 units/10 years and −0.112 units/10 years, respectively. The average Sapozhnikova’s HC index for 1966–2021 equaled 0.86, the average HTC index–1.03. In practice, the HTC value was close to 1.0; this indicated a balance of inflow and outflow of moisture.
It is also of practical interest to analyze the results of calculating the Climatic Index of Biological Efficiency (CIBE) as an integral indicator of heat and moisture supply (see above). The CIBE, which characterizes the environmental background, fluctuated throughout the Republic of Tatarstan within the range of 17.87–21.10. The optimal CIBE value is about 22. Therefore, the CIBE values for a number of stations were quite close to the optimal one.
To illustrate the interannual variability of the considered indicators of the active phase of the growing season (APGS), time diagrams were constructed for each of the stations analyzed. As an example, Figure 8 shows the long-term dynamics of these indicators, linear trends, and low-frequency components with a cut-off point of 15 years for N. Vyazovye (see Figure 2).
As can be seen from Figure 8, according to the linear trend in 1966–2021, there was a slight increase in the duration of the APGS, but since 2012, it has been noticeably reduced due to an earlier completion in autumn. The data of Figure 8 also show a noticeable increase in the sum of temperatures; according to the trend line, only at the very end (2015–2021) of the period under consideration, a decrease was observed along the LFC curve. In summer, the amount of precipitation had a slight tendency to increase (Figure 8). According to the LFC line, the maximum was in 1982 and 2007; in recent years, precipitation has decreased. The hydrothermal coefficient had a weak (not statistically significant) downward trend, according to the trend line (Figure 8). In addition, it should be noted that during the study period, Budyko’s Dryness Index and Sapozhnikova’s HC almost did not change. Annual evaporation tended to noticeably increase, while the humidity coefficient, on the contrary, tended to decrease. In this regard, the Climatic Index of Biological Efficiency had not changed much either.

4. Limitations and Uncertainties

The material for the study was observation data from the network of meteorological stations of the Federal Service for Hydrometeorology and Environmental Monitoring (Russia), as well as reanalysis data. Gaps and erroneous values at certain points in time were inevitable. The detection and elimination of such gaps in the series of observations were carried out by the authors according to the methods recommended by the “RIHMI-WDC” and methodological guidelines of the Federal Service for Hydrometeorology and Environmental Monitoring. The values restored in this way are as close as possible to the data of field observations.
Calculation and construction of climatic maps of evaporation and runoff for the Volga Federal District were carried out using reanalysis data based on ground-based observation data and assimilation of model calculations, including satellite measurement data. The reanalysis data, along with the advantage of large temporal coverage, also has disadvantages associated with multiple changes in the technical characteristics of the spacecraft equipment, the data from which are assimilated by the model. Despite the model underlying the reanalysis taking into account this factor, a slight uncertainty cannot be ruled out.
An analysis of the ongoing climate change in the Volga Federal District over the past decades shows that warming occurs mainly in winter at a rate exceeding the rate of warming in Russia as a whole. Climate warming results in a decrease in the intensity of negative anomalies and, conversely, an increase in the frequency and intensity of positive temperature anomalies, the disappearance of extremely cold winters in recent years. There is also a slight increase in annual precipitation in the study arearegion, except for its southeast. In the future, it is planned to assess the course of the main climatic indicators (air temperature and precipitation) until the end of the 21st century based on the results of ensemble calculations using 40 climatic models from the CMIP6 project. In this case, the problem of choosing the most reliable anthropogenic scenario arises, which creates uncertainty in forecast estimates.
The above values of runoff change are estimated (calculated) values. Therefore, they need to be verified by independent methods (for example, based on observations at the district’s gauging stations, runoff plots, etc.).

5. Conclusions

(1) Climate warming occurred in the Volga Federal District during 1966–2021. This was manifested in an increase in air temperature in all months of the year, an increase in the number of positive air temperature anomalies in the 21st century, and a decrease in the severity of winters.
(2) Using the Mann–Kendall test at a 5% significance level (p = 0.05), statistically significant air temperature trends were identified. At the same time, precipitation trends turned out to be statistically insignificant. The linear trends in the HTC index and Sapozhnikova’s HC were estimated with p < 0.02. It turned out that for the period 1966–2021 the trends were insignificant, and for the later period 1976–2021 (the active phase of global warming), they were significant. This made it possible to identify a trend toward an increase in the aridity of the region.
(3) In the cold period of the year, atmospheric circulation has a noticeable effect on the air temperature regime in the study area since under the influence of the Arctic and North Atlantic oscillations, the air temperature rises, and under the influence of the SCAND circulation, cooling occurs.
(4) The analysis of humidity and aridity indicators showed that, in general, in the Republic of Tatarstan, as one of the central administrative regions of the Volga Federal District, there was an approximate equality of moisture inflow and outflow. At the same time, the trends of these variables indicate some increase in summer aridity and a decrease in runoff within this territory. These phenomena require special attention to land melioration. Throughout the Volga Federal District, the trend towards a decrease in the estimated runoff prevailed.

Author Contributions

Conceptualization, Y.P., K.S. and B.S.; methodology, Y.P., B.S., K.S., A.G., N.M. and T.A.; software, K.S., V.G. and T.A.; validation, Y.P., B.S., A.G., T.A. and N.M.; formal analysis, Y.P.; investigation, Y.P.; resources, Y.P., A.G., B.S., N.M., K.S., V.G. and T.A.; data curation, Y.P. and A.G.; writing—original draft preparation, Y.P. and N.M.; writing—review and editing, Y.P., A.G., B.S., N.M., K.S., V.G. and T.A.; visualization, Y.P.; supervision, Y.P.; project administration, Y.P.; funding acquisition, Y.P. All authors have read and agreed to the published version of the manuscript.

Funding

This research was supported by the Russian Science Foundation (22-27-20080). The work is also carried out in accordance with the Strategic Academic Leadership Program “Priority 2030” of the Kazan Federal University of the Government of the Russian Federation.

Institutional Review Board Statement

Not applicable.

Informed Consent Statement

Not applicable.

Data Availability Statement

Not applicable.

Conflicts of Interest

The authors declare no conflict of interest.

Appendix A

Figure A1. Linear trend slope coefficients (LTSC, °C/10 years) for January average air temperature and their statistical significance in the Volga Federal District during 1966–2021.
Climate 10 00198 g0a1
Figure A2. Linear trend slope coefficients (LTSC, °C/10 years) for July average air temperature and their statistical significance in the Volga Federal District during 1966–2021.
Climate 10 00198 g0a2

Appendix B

Figure A3. Linear trend slope coefficients (LTSC, mm/10 years) of January precipitation and their statistical significance in the Volga Federal District during 1966–2021.
Climate 10 00198 g0a3
Figure A4. Linear trend slope coefficients (LTSC, mm/10 years) of July precipitation and their statistical significance in the Volga Federal District during 1966–2021.
Climate 10 00198 g0a4

References

  1. IPCC. 2022: Climate Change 2022: Impacts. Adaptation and Vulnerability. Contribution of Working Group II to the Sixth Assessment Report of the Intergovernmental Panel on Climate Change; Pörtner, H.-O., Roberts, D.C., Tignor, M., Poloczanska, E.S., Mintenbeck, K., Alegría, A., Craig, M., Langsdorf, S., Löschke, S., Möller, V., et al., Eds.; Cambridge University Press: Cambridge, UK; New York, NY, USA, 2022; p. 3056. [Google Scholar]
  2. Gladilshchikova, A.A.; Dmitrieva, T.M.; Semenov, S.M. Special Report of the Intergovernmental Panel on Climate Change “Global Warming of 1.5 °C”. Fundam. Appl. Climatol. 2018, 4, 5–18. (In Russian) [Google Scholar] [CrossRef]
  3. Kolobov, N.V. The Climate of the Middle Volga Region; Publishing House of Kazan University: Kazan, Russia, 1968. (In Russian) [Google Scholar]
  4. Kolobov, N.V.; Murakaeva, S.A. Droughts in the Territory of the Tatar ASSR; Publishing House of Kazan University: Kazan, Russia, 1980. (In Russian) [Google Scholar]
  5. Perevedentsev, Y.P.; Vereshchagin, M.A.; Naumov, E.P.; Shantalinsky, K.M. Long-term variations in main characteristics of the hydrometeorological Volga basin regime. Russ. Meteorol. Hydrol. 2001, 10, 9–15. [Google Scholar]
  6. Perevedentsev, Y.P.; Vereshchagin, M.A.; Naumov, E.P.; Shantalinsky, K.M.; Nikolaev, A.A. Regional display of the modern climate warming in tropo- and stratospheres of the Northern Hemisphere. Izv. Akad. Nauk. Ser. Geograf. 2005, 6, 6–16. [Google Scholar]
  7. Perevedentsev, Y.P.; Shantalinsky, K.M.; Aukhadeev, T.R.; Ismagilov, N.V.; Zandi, R. Effect of microcirculation systems on the thermobaric conditions of the Volga Federal District. Uchenye Zapiski Kazanskogo Universiteta. Seriya Estestvennye Nauki 2014, 156, 156–169. (In Russian) [Google Scholar]
  8. Vereshchagin, M.A. (Ed.) Climate and Environment of the Volga Federal District; Kazan University: Kazan, Russia, 2013. (In Russian) [Google Scholar]
  9. Kobysheva, N.V. (Ed.) Climate of Russia; Hydrometeoizdat: St. Petersburg, Russia, 2001. (In Russian) [Google Scholar]
  10. Mokhov, I.I.; Semenov, V.A. Weather and climate anomalies in Russian regions related to global climate change. Russ. Meteorol. Hydrol. 2016, 41, 84–92. [Google Scholar] [CrossRef]
  11. Cargo, G.V.; Rankova, E.Y. Observations and Expected Climate Change in Russia: Air Temperature; IGKE: Moscow, Russia, 2012. (In Russian) [Google Scholar]
  12. Babina, E.D.; Semenov, V.A. Intramonth variability of daily surface air temperature in Russia in 1970–2015. Russ. Meteorol. Hydrol. 2019, 44, 513–522. [Google Scholar] [CrossRef]
  13. Titkova, T.B.; Cherenkova, E.A.; Semenov, V.A. Regional features of changes in winter extreme temperatures and precipitation in Russia in 1970–2015. Ice Snow 2018, 58, 486–497. (In Russian) [Google Scholar] [CrossRef]
  14. RosHydromet. The Second Assessment Report on Climate Change and Its Consequences in Russian Federation; RosHydromet: Moscow, Russia, 2014. (In Russian) [Google Scholar]
  15. Anisimov, O.A.; Lobanov, V.A.; Reneva, S.A. Analysis of changes in air temperature in Russia and empirical forecast for the first quarter of the 21st century. Russ. Meteorol. Hydrol. 2007, 32, 620–626. [Google Scholar] [CrossRef]
  16. Science-Intensive Technologies. Third Assessment Report on Climate Change and Its Consequences in Russian Federation. General Summary; Science-Intensive Technologies: St. Petersburg, Russia, 2022. (In Russian) [Google Scholar]
  17. Semenov, S.M. (Ed.) Methods for Assessing the Consequences of Climate Change for Physical and Biological Systems; RosHydromet: Moscow, Russia, 2012. (In Russian) [Google Scholar]
  18. Doganovsky, A.M. Land Hydrology; Russian State Hydrometeorological University: Saint Petersburg, Russia, 2012. (In Russian) [Google Scholar]
  19. Kotlyakov, V.M.; Koronkevich, N.I.; Barabanova, E.A. (Eds.) Questions of Geography. Sat. 145. Hydrological Changes; Publishing House “Kodeks”: Moscow, Russia, 2018. (In Russian) [Google Scholar]
  20. Doganovsky, A.M.; Malinin, V.N. Gidrosfera Zemli [Earth Hydrosphere]; Russian State Hydrometeorological University: Saint Petersburg, Russia, 2004. (In Russian) [Google Scholar]
  21. Ivanov, N.N. On the determination of evaporation values. News All-Union Geogr. Soc. 1954, 86, 189–196. (In Russian) [Google Scholar]
  22. Holdridge, L.R. Simple Method for determining Potential Evapotranspiration from Temperature Data. Science 1959, 130, 572. [Google Scholar] [CrossRef] [PubMed]
  23. Tyurk, L. Balance of Soil Moisture; Hydrometeoizdat: Leningrad, Russia, 1958. (In Russian) [Google Scholar]
  24. Meshcherskaya, A.V.; Golod, M.P. Catalogs of abnormal winters over the Russian territory. Proc. MGO 2015, 579, 130–162. (In Russian) [Google Scholar]
  25. Kryzhov, V.M.; Gorelits, O.V. The Arctic Oscillation and its impact on temperature and precipitation in Northern Eurasia in the 20th Century. Russ. Meteorol. Hydrol. 2015, 40, 711–721. [Google Scholar] [CrossRef]
  26. Bardin, M.Y.; Platova, T.V.; Samokhina, O.F. Variability of anti-cyclonic activity in the northern extratropics. Fundam. Appl. Climatol. 2019, 3, 32–58. (In Russian) [Google Scholar] [CrossRef]
  27. Popova, V.V.; Shmakin, A.B. Regional structure of surface–air temperature fluctuations in Northern Eurasia in the latter half of the 20th and early 21st centuries. Izv. Atmos. Ocean. Phys. 2010, 46, 144–158. [Google Scholar] [CrossRef]
  28. Popova, V.V. Present-day changes in climate in the north of Eurasia as a manifestation of variation of the large-scale atmospheric circulation. Fundam. Appl. Climatol. 2018, 1, 84–111. (In Russian) [Google Scholar] [CrossRef]
  29. Perevedentsev, Y.P.; Naumov, E.P. (Eds.) The Climate of Kazan and Its Change in the Modern Period; Publishing House of Kazan University: Kazan, Russia, 2006. (In Russian) [Google Scholar]
  30. Cherenkova, E.A.; Shumova, N.A. Potential evapotranspiration in quantity indicators of climate. Arid. Ecosyst. 2007, 13, 55–67. (In Russian) [Google Scholar]
Figure 1. The Volga Federal District and its main (key) meteorological stations analyzed. Administrative regions of the Russian Federation: 1—Republic of Bashkortostan; 2—Mari El Republic; 3—Republic of Mordovia; 4—Republic of Tatarstan; 5—Udmurt Republic; 6—Chuvash Republic; 7—Perm Krai; 8—Kirov Oblast; 9—Nizhny Novgorod Oblast; 10—Orenburg Oblast; 11—Penza Oblast; 12—Samara Oblast; 13—Saratov Oblast; and 14—Ulyanovsk Oblast.
Climate 10 00198 g001
Figure 2. The analyzed meteorological stations in the Republic of Tatarstan, the Volga Federal District (European Russia, see Figure 1).
Climate 10 00198 g002
Figure 3. Spatial distribution of annual evaporation (E0, mm; according to Ivanov’s method [21]) in the Volga Federal District.
Climate 10 00198 g003
Figure 4. Spatial distribution of annual vaporization (E) (left map) and the annual vaporization LTSC value (right map) (according to ERA-5 reanalysis data) in the Volga Federal District during 1966–2021.
Climate 10 00198 g004
Figure 5. Spatial distribution of calculated annual runoff (R) (left map) and LTSC values of annual runoff (right map) in the Volga Federal District during 1979–2021.
Climate 10 00198 g005
Figure 6. Long-term change in the integral indicator of winter anomaly (α) averaged over the Volga Federal District. 1—initial series; 2—LFC with a period of more than 10 years; 3—linear trend.
Climate 10 00198 g006
Figure 7. Long-term changes of Sapozhnikova’s Humidity Coefficient (left) and Selyaninov’s Hydrothermal Coefficient (right) in Kazan (see Figure 1 and Figure 2).
Climate 10 00198 g007
Figure 8. Long-term changes of APGS indicators (Day—the duration of the APGS, days; ∑T—the sum of air temperatures; ∑Pr—the sum of precipitation; HTC—Selyaninov’s Hydrothermal Coefficient) at N. Vyazovye, the Republic of Tatarstan (see Figure 2).
Climate 10 00198 g008
Table 1. Monthly and annual average air temperatures (°C) in the Volga Federal District (VFD) during 1966–2021.
Meteorological
Station
(see Figure 1)
Month
IIIIIIIVVVIVIIVIIIIXXXIXIIYear
Lalsk−14.3−12.1−5.02.59.615.017.614.48.51.8−5.2−10.81.9
Nyrob, AMSG−16.3−14.0−6.01.28.214.517.113.57.80.5−7.4−13.50.5
Kirov, AMSG−13.0−11.2−4.24.011.516.318.715.89.72.3−4.6−10.13.0
Perm−13.7−11.9−4.43.710.916.118.315.49.62.3−5.4−11.22.5
Izhevsk−13.5−12.1−5.04.012.116.818.816.210.22.6−4.7−10.72.9
N. Novgorod, Myza−10.1−8.9−2.76.013.317.119.217.011.14.1−2.6−7.64.7
Cheboksary−11.4−10.4−4.35.013.217.219.517.211.13.8−3.3−8.84.1
Kazan, CGMS−11.6−10.6−4.05.513.717.920.117.911.74.2−3.0−8.74.5
Saransk−10.3−9.9−4.16.014.017.519.617.811.84.4−2.5−7.84.7
Bugulma−12.8−11.8−5.34.713.017.118.916.911.03.1−4.3−10.13.4
Ufa, Dema−13.6−12.5−5.15.513.517.919.617.311.33.9−4.0−10.83.6
Ulu-Telyak−13.5−11.9−4.55.412.817.219.016.510.83.7−4.2−11.13.3
Uchaly−14.6−13.3−6.63.511.015.717.215.19.31.9−6.1−12.21.7
Penza, GMO−10.0−9.6−3.57.014.718.320.218.512.45.1−1.9−7.35.4
Samara, OGMS−11.1−10.3−3.67.315.419.421.419.513.35.3−2.2−8.35.5
Balashov−8.9−8.5−2.78.015.519.121.019.713.45.9−1.0−6.36.3
Saratov−8.8−8.6−2.48.616.120.422.520.714.36.6−0.6−6.46.9
Perelyub−11.6−11.4−4.67.615.820.122.220.413.75.3−2.1−8.65.6
Orenburg, ZGMO−13.0−12.4−5.27.515.920.522.520.614.05.3−2.9−9.75.3
Zernosovkhoz Ozerny−16.2−15.4−8.35.214.219.721.319.212.53.6−5.3−12.83.1
VFD average−12.4−11.3−4.65.413.217.719.717.511.43.8−3.7−9.63.9
Table 2. Linear trend slope coefficients (LTSC, °C/10 years) for monthly and annual average air temperatures in the Volga Federal District (VFD) during 1966–2021.
Meteorological Station
(see Figure 1)
Month
IIIIIIIVVVIVIIVIIIIXXXIXIIYear
Lalsk0.820.610.080.300.610.270.440.380.470.550.490.530.45
Nyrob, AMSG0.930.510.180.380.570.330.320.350.310.660.440.310.44
Kirov, AMSG0.760.440.160.210.510.250.350.400.410.530.340.430.40
Perm0.650.480.290.220.440.280.280.420.360.570.340.350.39
Izhevsk0.800.480.290.090.320.180.200.340.530.540.340.340.35
N. Novgorod, Myza0.860.530.380.230.500.200.510.530.440.510.340.640.47
Cheboksary0.820.290.350.210.440.250.420.530.410.550.350.530.43
Kazan, CGMS0.950.660.530.300.460.390.510.640.430.600.420.510.53
Saransk0.740.540.370.130.320.150.410.440.310.470.240.450.38
Bugulma0.810.410.270.120.290.320.370.580.350.610.370.250.39
Ufa, Dema0.950.650.500.200.250.290.320.590.290.590.370.420.45
Ulu-Telyak1.250.960.590.120.260.250.290.650.350.510.330.530.51
Uchaly0.260.250.170.000.190.300.240.520.210.540.280.250.27
Penza, GMO0.850.680.430.160.370.260.560.600.410.570.270.540.47
Samara, OGMS0.910.620.460.180.360.430.540.650.390.660.390.500.51
Balashov0.750.580.440.140.310.150.530.560.380.500.190.430.41
Saratov0.670.480.450.130.260.160.340.480.250.480.140.320.35
Perelyub0.790.600.430.070.190.290.360.540.190.520.240.370.39
Orenburg, ZGMO0.770.780.640.220.210.340.310.620.270.570.300.280.44
Zernosovhoz Ozerny0.530.570.610.070.180.250.090.600.230.380.310.270.32
VFD average0.810.640.300.070.250.290.310.370.340.480.200.500.38
Table 3. Long-term (1966–2021) average values of monthly and annual precipitation (mm) in the Volga Federal District (VFD).
Meteorological Station
(see Figure 1)
Month
IIIIIIIVVVIVIIVIIIIXXXIXIIYear
Lalsk403132364970776855605448619
Nyrob, AMSG362729415476787466685340642
Kirov, AMSG453234375271816963655752659
Perm412929365379767567615343643
Izhevsk332526304062666153534334526
N. Novgorod, Myza463734394571756662655655651
Cheboksary312425334065715856564336539
Kazan, CGMS403231333765675552534545555
Saransk342525303654655248464037492
Bugulma292222304372655556544032521
Ufa, Dema433732354462545350605249569
Uchaly181521304263855732312120433
Penza, GMO403133354063635252494643548
Samara, OGMS493935403454544647525251553
Balashov443232323863594047434748527
Saratov423232323750483646364542480
Perelyub393029262849403340403941434
Orenburg, ZGMO282224262937392731363231361
Zernosovhoz Ozerny161317223230392418252018274
VFD average362829334161635350504440528
Table 4. Linear trend slope coefficients (LTSC, mm/10 years) of monthly and annual precipitation in the Volga Federal District (VFD) during 1966–2021.
Meteorological Station
(see Figure 1)
Month
IIIIIIIVVVIVIIVIIIIXXXIXIIYear
Lalsk1.02.11.6−3.6−0.49.53.45.31.1−1.0−1.61.218.7
Nyrob, AMSG2.22.02.91.91.07.90.3−0.10.95.32.24.430.6
Kirov, AMSG3.41.33.50.4−1.95.8−0.81.5−2.21.5−0.74.516.3
Perm0.40.12.82.10.26.7−0.23.60.11.31.83.622.4
Izhevsk−1.1−1.31.20.22.63.2−0.60.60.5−0.6−1.91.43.9
N. Novgorod, Myza2.01.54.01.5−3.23.70.81.02.3−0.5−1.75.516.8
Cheboksary1.0−0.52.2−1.50.12.43.20.71.9−1.1−0.21.910.0
Kazan, CGMS5.11.84.40.0−0.1−3.9−1.0−1.20.90.40.76.613.8
Saransk1.40.60.8−0.9−1.2−2.6−6.0−0.5−0.8−2.3−2.51.4−12.7
Bugulma−1.30.52.22.93.20.9−5.30.8−1.9−1.40.5−0.4−0.8
Ufa, Dema0.90.32.90.33.82.0−3.9−0.11.1−1.0−0.22.08.1
Ulu-Telyak0.80.33.00.71.83.8−5.11.20.90.1−0.71.98.7
Uchaly−0.40.12.62.8−0.1−3.3−6.44.40.92.1−0.2−0.45.8
Penza, GMO−0.31.11.72.21.8−1.6−2.5−1.61.0−1.8−0.20.22.2
Samara, OGMS3.52.03.32.01.1−2.4−3.5−2.33.10.3−0.82.58.9
Balashov1.32.72.8−0.74.6−0.81.5−5.22.00.4−1.5−0.17.0
Saratov0.62.32.53.51.12.9−0.6−5.44.41.5−1.70.312.2
Perelyub2.43.24.34.03.30.3−0.90.30.21.4−1.11.518.7
Orenburg, ZGMO0.00.32.21.51.3−3.10.5−1.3−2.1−1.3−0.1−0.6−2.9
Zernosovhoz Ozerny−1.5−0.12.31.31.4−2.31.21.0−1.0−0.30.52.13.8
VFD average1.11.02.71.01.01.5−1.30.10.70.2−0.52.09.6
Table 5. The correlation coefficient between air temperature averaged by months over the Volga Federal District and some atmospheric circulation indices.
IndexMonth
IIIIIIIVVVIVIIVIIIIXXXIXII
NAO0.340.380.44−0.10−0.29−0.32−0.08−0.150.11−0.07−0.120.47
AO0.430.330.390.06−0.06−0.130.250.010.150.110.280.41
SCAND−0.62−0.63−0.35−0.31−0.28−0.030.09−0.14−0.17−0.48−0.22−0.29
Table 6. Spatial distribution of some hydrometeorological variables indicators (annual values) in the Republic of Tatarstan (RT), the Volga Federal District, during 1966–2021.
Meteorological Station
(see Figure 2)
PrecipitationVaporizationRunoff
AvSDLTSCAvSDLTSCAv (μ)SDLTSC
Arsk523937.83473813.4176 (0.34)88−5.6
Elabuga54495−3.0369358.2175 (0.32)82−11.2
N. Vyazovye4849112.03473412.2137 (0.28)74−0.2
Kazan5579311.43804016.3177 (0.32)83−4.9
Menzelinsk46885−1.3337307.4131 (0.28)69−8.7
Kaibitsy471847.3334388.5137 (0.29)60−1.2
Muslyumovo447771.0323297.2124 (0.28)60−1.2
Aktash490894.0341318.1149 (0.30)76−4.1
Aznakaevo5001011.8349324.5151 (0.30)78−2.7
Tetyushi482925.6341396.8141 (0.29)73−1.2
Drozhanoye48596−7.3344370.2141 (0.29)78−7.6
Bugulma516103−6.8354292.0162 (0.31)86−8.8
Chulpanovo47583−5.5328211.4147 (0.31)74−6.8
RT average494912.1346337.4148 (0.30)75−4.9
Average values (Av) and standard deviation (SD) are in mm; LTSC is in mm/10 years; μ—the runoff coefficient (dimensionless).
Table 7. Changes in the air temperature regime during the coldest (January) and warmest (July) months of the year in the Republic of Tatarstan (RT), the Volga Federal District, during 1966–2021.
Meteorological Station
(see Figure 2)
JanuaryJuly
AvSDLTSCR2LR2FAvSDLTSCR2LR2F
Arsk−12.274.050.10122819.442.010.04617
Elabuga−12.164.090.10112619.941.950.03415
Vyazovye−11.494.020.09112719.771.970.04720
Kazan−11.414.000.10142920.042.010.051122
Menzelinsk−12.824.150.10102719.531.940.04615
Kaibitsy−11.484.070.09102819.411.890.04619
Muslyumovo−12.864.480.0982619.741.820.03314
Aktash−12.354.230.0992519.551.860.03213
Aznakaevo−12.604.100.0992619.261.850.03515
Tetyushi−11.693.990.0992619.491.890.04719
Drozhanoye−11.243.850.0882519.241.970.03418
Bugulma−12.593.780.08102618.881.970.03313
Chulpanovo−12.394.240.0982419.651.780.03214
RT average−12.104.080.09102619.531.920.035516
Average values (Av) and standard deviation (SD) are in °C; LTSC is in °C/year; R2L is contribution to the overall linear trend variance (%), R2F is contribution to the total variance of the low-frequency component (%).
Table 8. Changes in air humidity indicators in the Republic of Tatarstan (RT), the Volga Federal District, during 1966–2021.
Meteorological Station
(see Figure 2)
Budyko’s Dryness Index (Summer)HTCSapozhnikova’s HC
Average ValueLTSC,
un. /10 Years
Average ValueLTSC,
un. /10 Years
Average ValueLTSC,
un. /10 Years
Arsk2.720.101.05−0.020.91−0.02
Elabuga2.940.231.09−0.020.92−0.03
N. Vyazovye3.000.041.0100.830
Kazan2.700.161.07−0.040.92−0.02
Menzelinsk2.860.151.00−0.030.83−0.03
Kaibitsy3.160.150.96−0.040.81−0.02
Muslyumovo3.130.210.98−0.030.77−0.02
Aktash3.260.170.98−0.020.83−0.01
Aznakaevo3.050.371.06−0.030.88−0.02
Tetyushi2.930.091.00−0.020.84−0.01
Drozhanoye2.810.111.05−0.010.86−0.02
Bugulma2.870.381.16−0.040.94−0.03
Chulpanovo3.120.190.98−0.030.81−0.02
RT average2.970.181.03−0.0250.86−0.02
Publisher’s Note: MDPI stays neutral with regard to jurisdictional claims in published maps and institutional affiliations.

