
Impact of Urbanization on Urban Heat Island Intensity in Major Districts of Bangladesh Using Remote Sensing and Geo-Spatial Tools

 ,
,  and
and 
Abstract
1. Introduction
2. Data and Methods
2.1. Study Area
2.2. Data Acquisition and Pre-Processing
2.3. LULC Classification
2.4. Accuracy Assessment
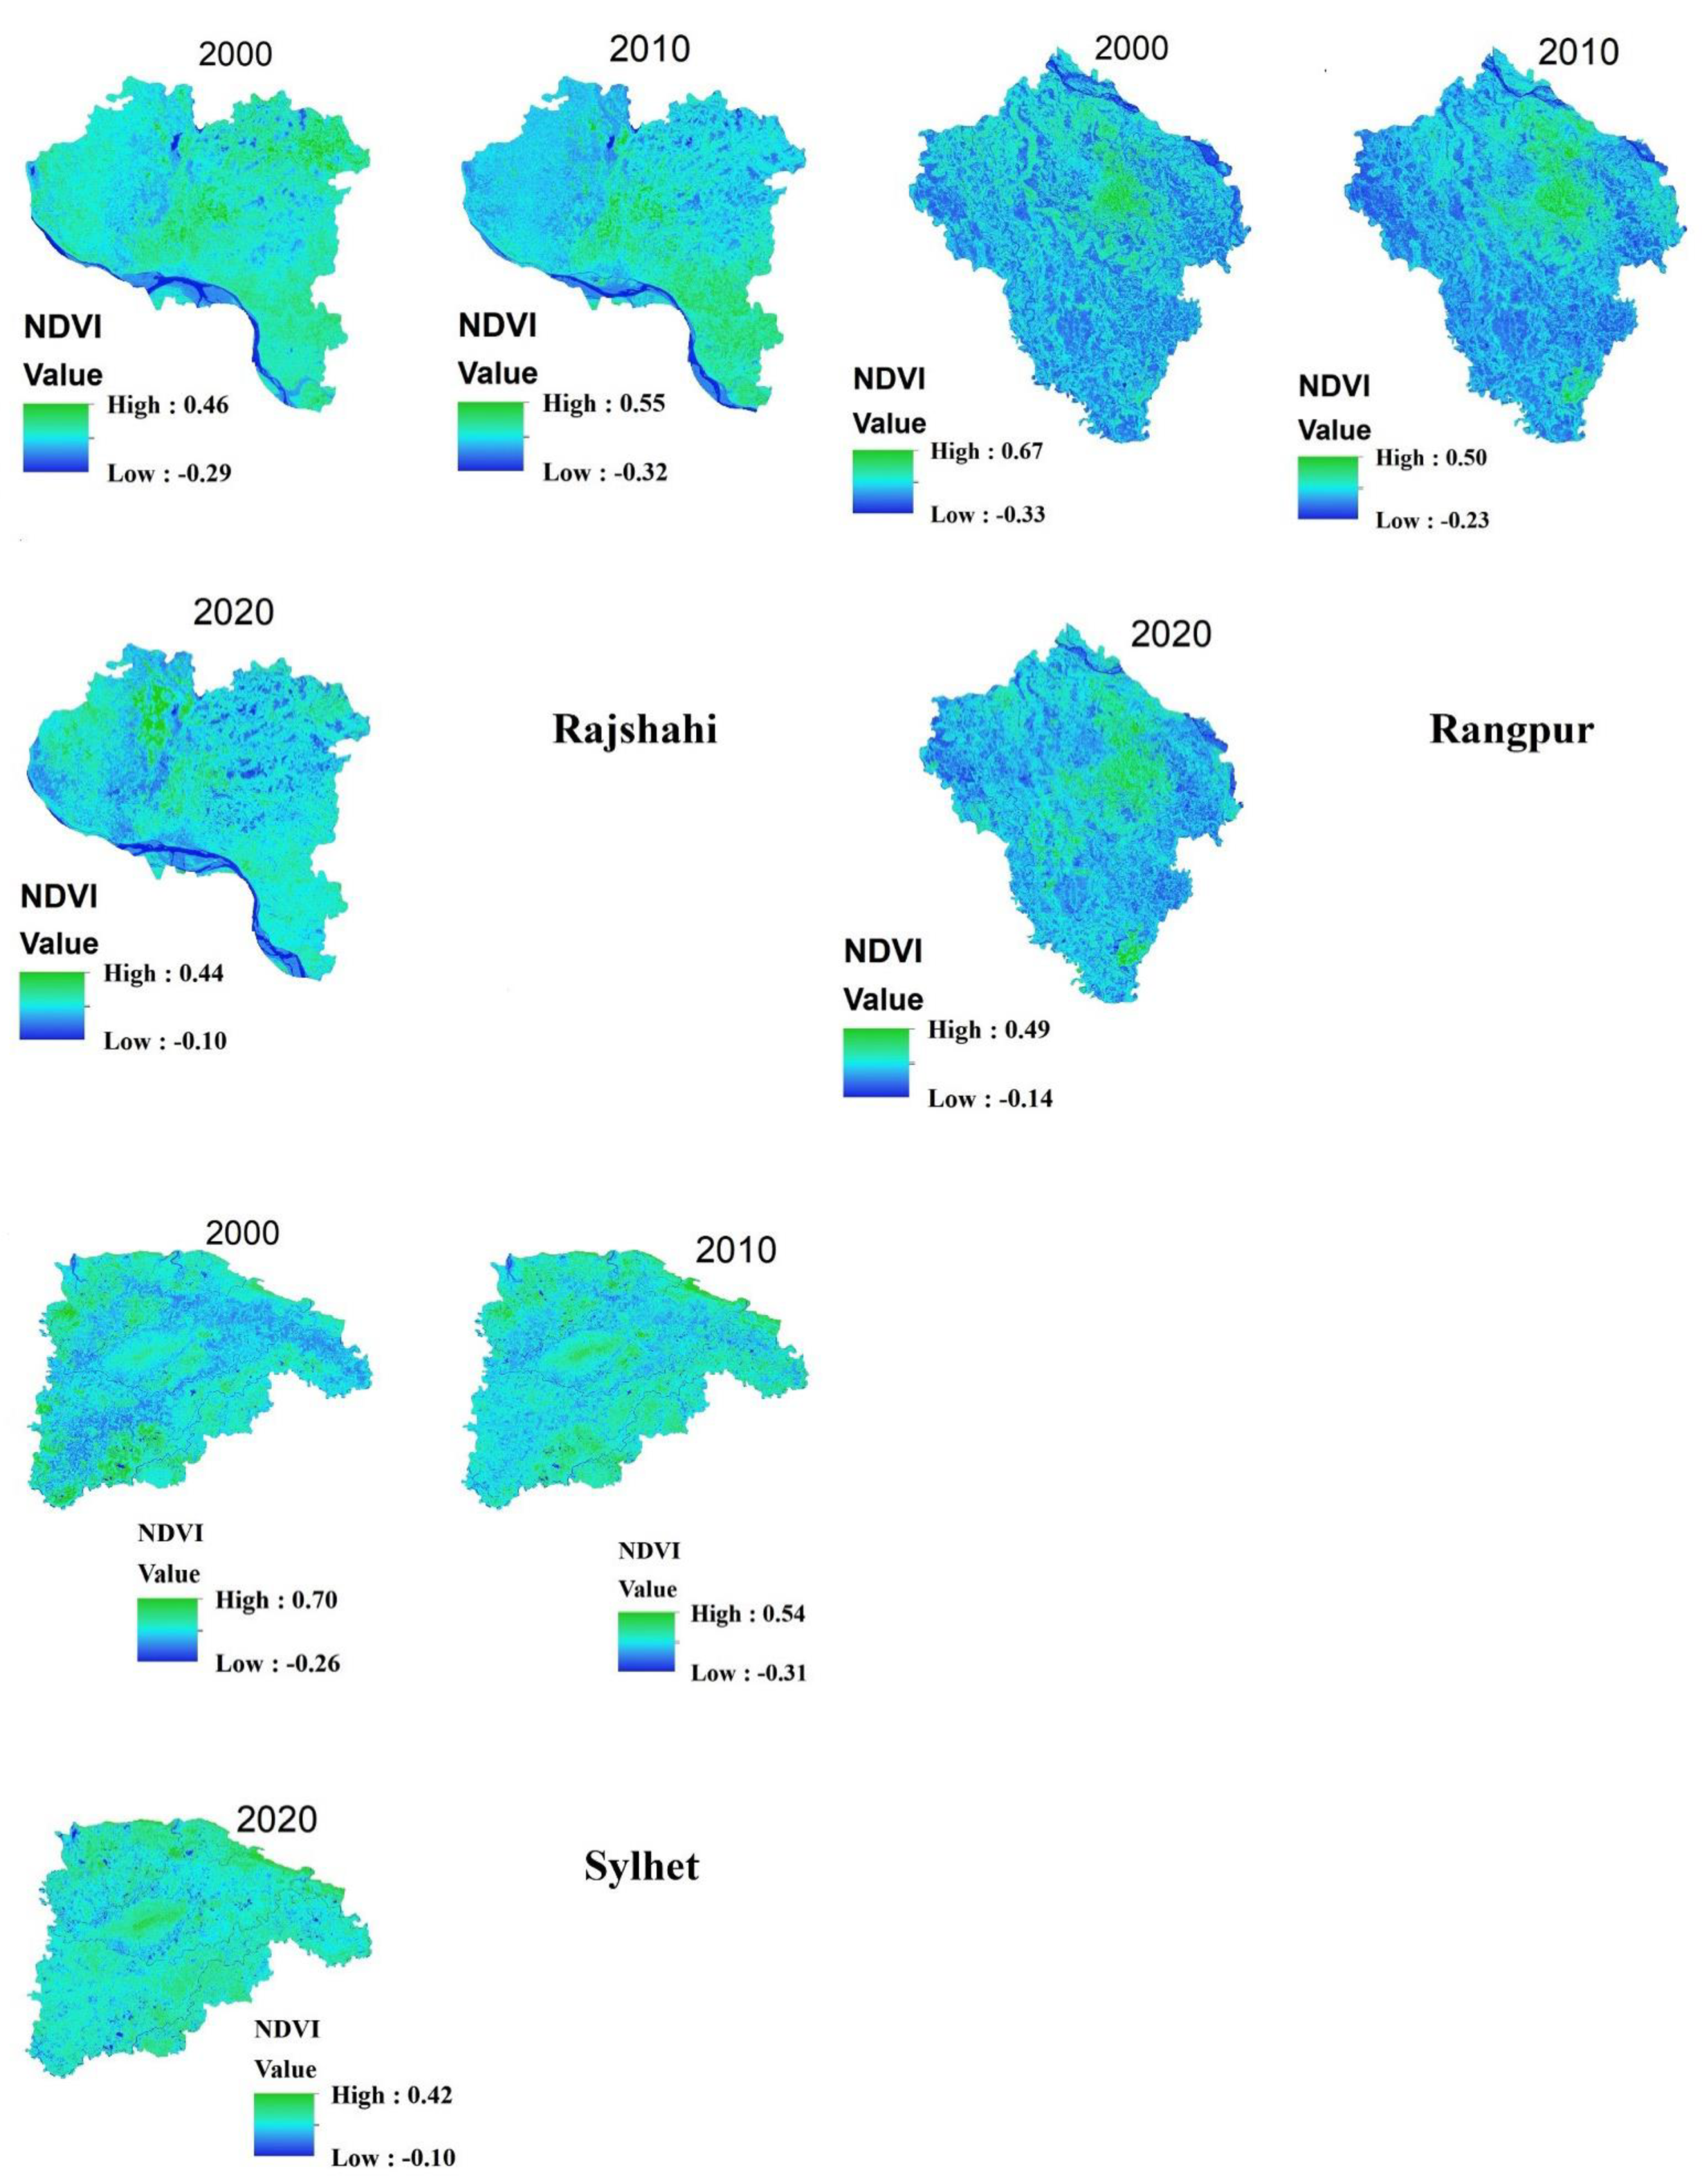
2.5. NDVI Derivation
2.6. LST Derivation for Landsat-5
2.7. LST Derivation for Landsat-8
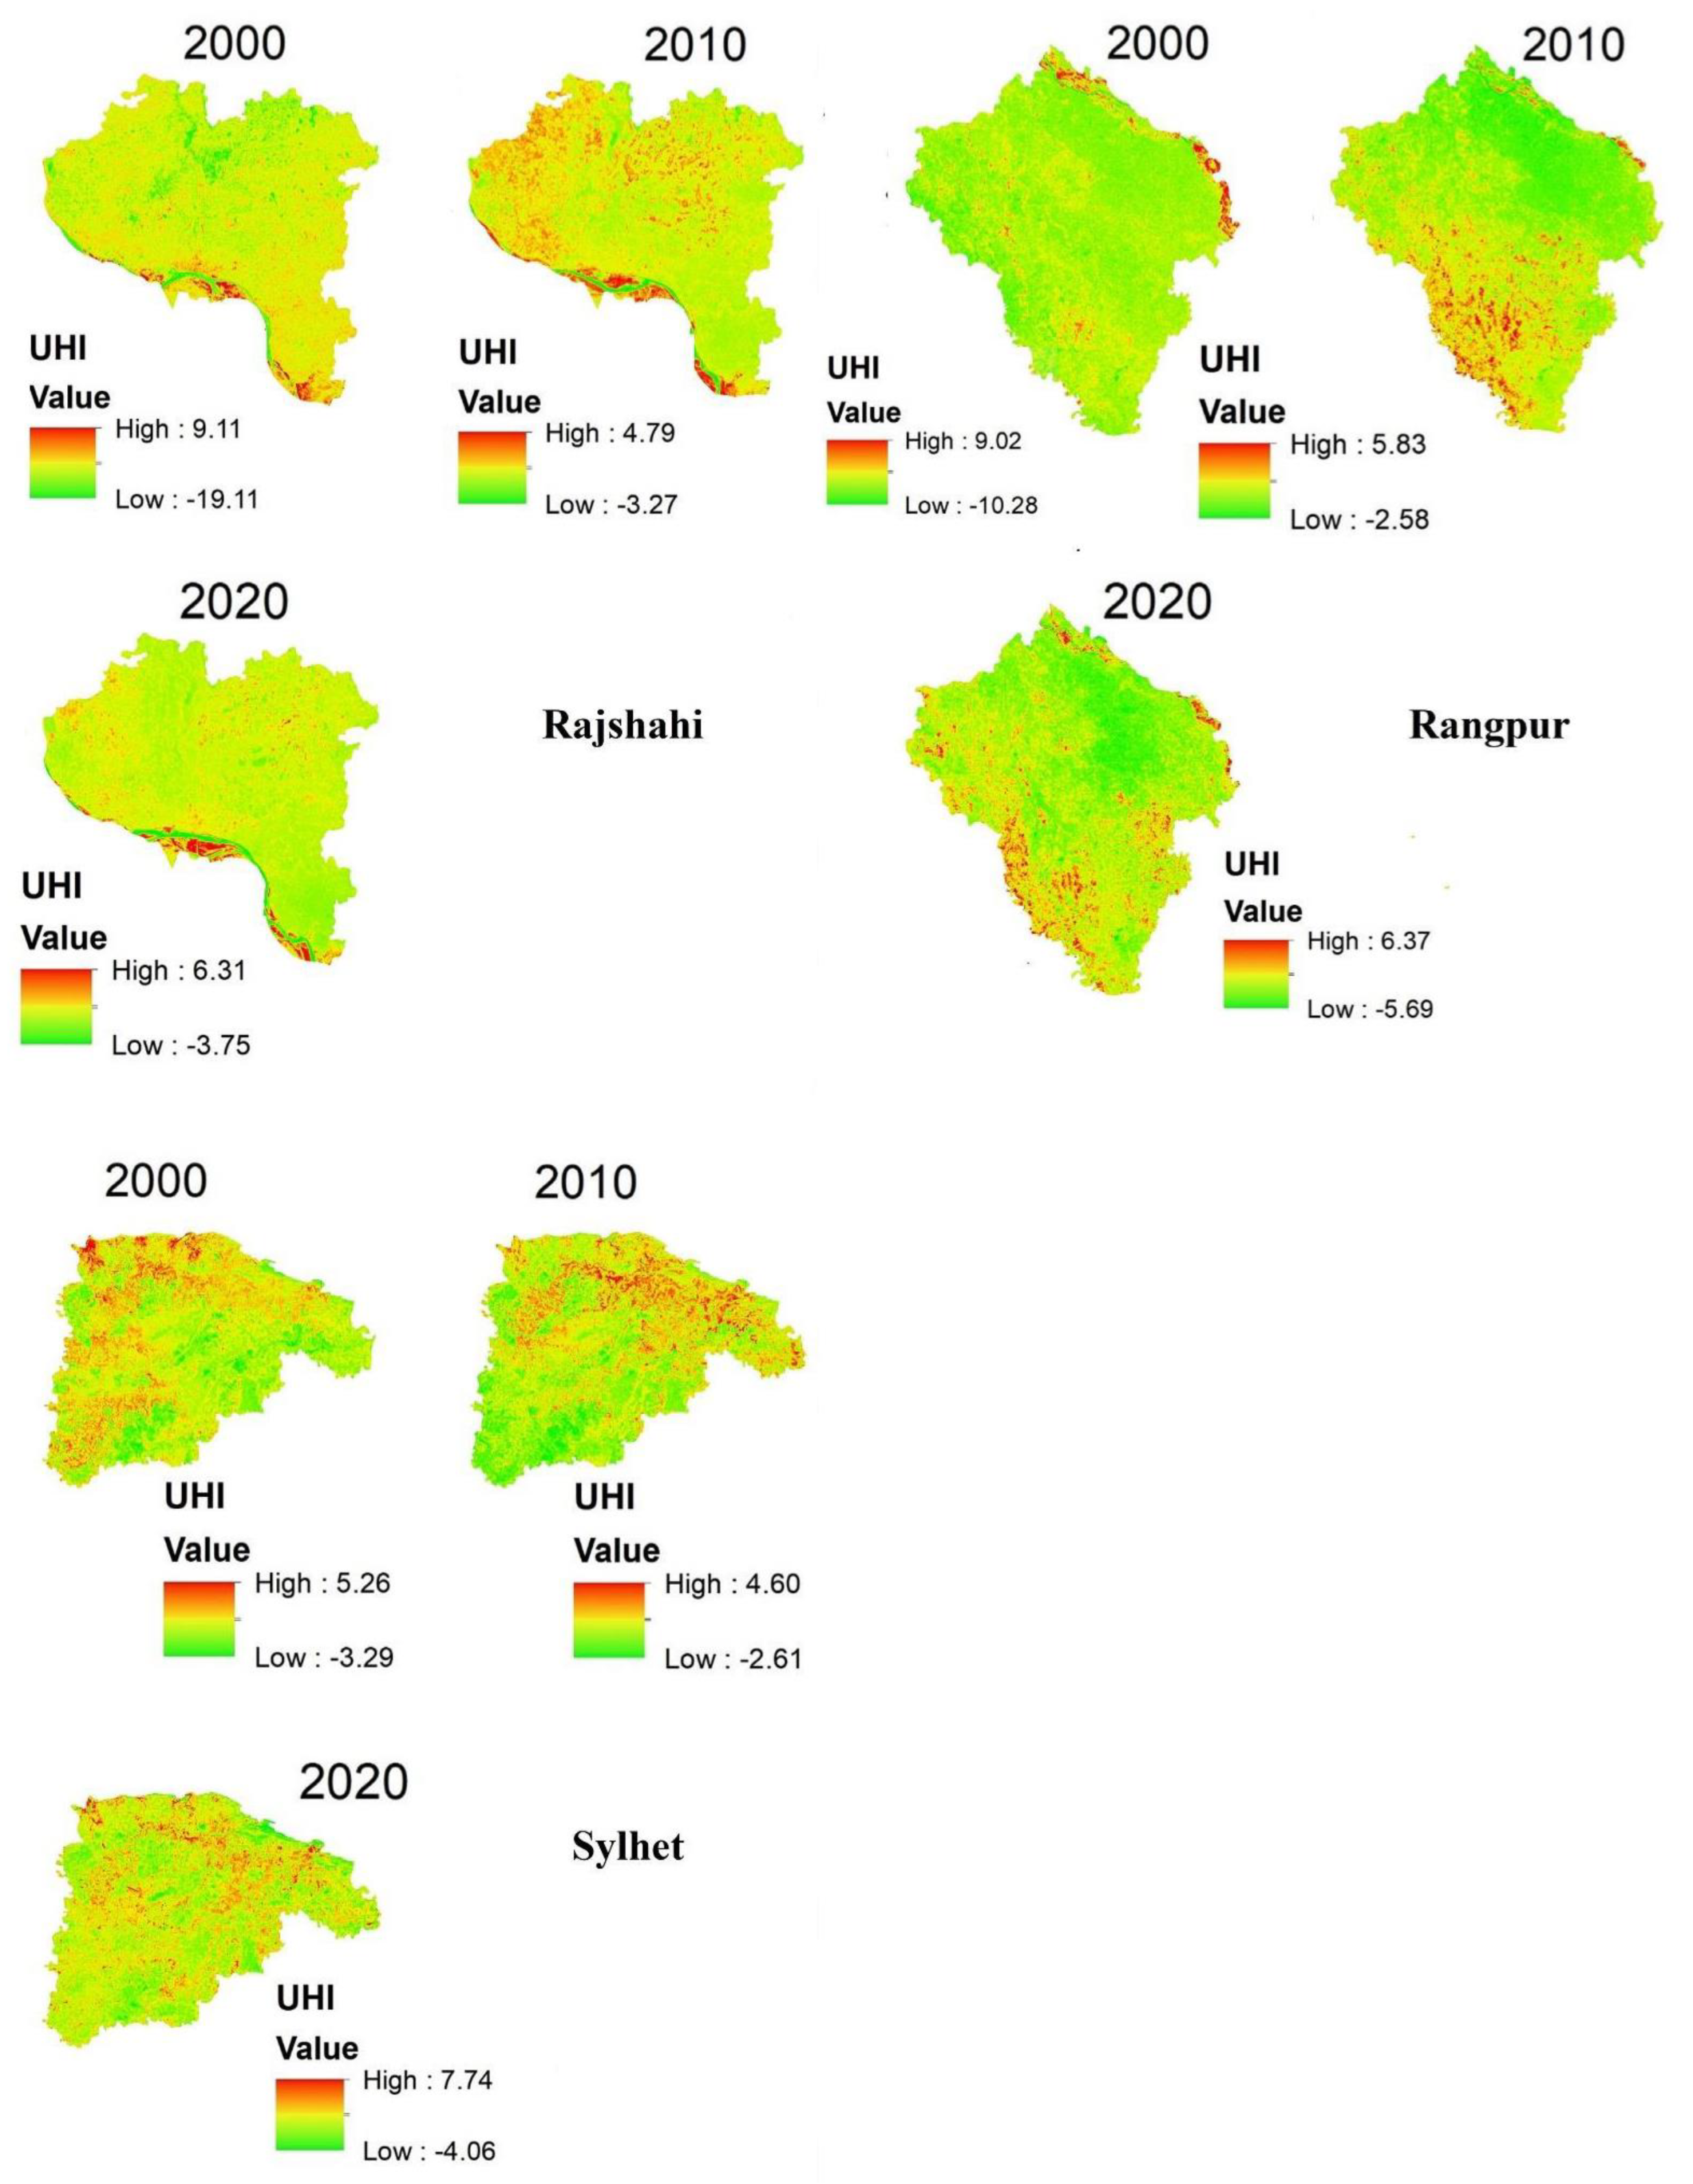
2.8. Estimation of UHI
3. Results and Discussion
3.1. LULC and NDVI Variations and Accuracy ASSESSMENT
3.2. Assessment of LST
3.3. UHI Intensity Assessment
4. Possible Implication and Limitation of the Study
5. Conclusions
Author Contributions
Funding
Institutional Review Board Statement
Informed Consent Statement
Data Availability Statement
Acknowledgments
Conflicts of Interest
References
- Muñoz, P.; Zwick, S.; Mirzabaev, A. The impact of urbanization on Austria’s carbon footprint. J. Clean. Prod. 2020, 263, 121326. [Google Scholar] [CrossRef]
- Seto, K.C.; Dhakal, S.; Bigio, A.; Blanco, H.; Delgado, G.C.; Dewar, D.; Huang, L.; Inaba, A.; Kansal, A.; Lwasa, S.; et al. Human settlements, infrastructure, and spatial planning. In Climate Change 2014: Mitigation of Climate Change. IPCC Working Group III Contribution to AR5; Cambridge University Press: Cambridge, MA, USA, 2014. [Google Scholar]
- United Nations. 68% of the World Population Projected to Live in Urban Areas by 2050; UN: New York, NY, USA, 2018. [Google Scholar]
- Chapman, S.; Thatcher, M.; Salazar, A.; Watson, J.; McAlpine, C.A. The impact of climate change and urban growth on urban climate and heat stress in a subtropical city. Int. J. Clim. 2019, 39, 3013–3030. [Google Scholar] [CrossRef]
- Abir, F.A.; Ahmmed, S.; Sarker, S.H.; Fahim, A.U. Thermal and ecological assessment based on land surface temperature and quantifying multivariate controlling factors in Bogura, Bangladesh. Heliyon 2021, 7, e08012. [Google Scholar] [CrossRef]
- Morshed, S.R.; Fattah, A. Responses of spatiotemporal vegetative land cover to meteorological changes in Bangladesh. Remote Sens. Appl. Soc. Environ. 2021, 24, 100658. [Google Scholar] [CrossRef]
- Roy, B.; Bari, E.; Nipa, N.J.; Ani, S.A. Comparison of temporal changes in urban settlements and land surface temperature in Rangpur and Gazipur Sadar, Bangladesh after the establishment of city corporation. Remote Sens. Appl. Soc. Environ. 2021, 23, 100587. [Google Scholar] [CrossRef]
- Egerer, M.H.; Lin, B.B.; Threlfall, C.G.; Kendal, D. Temperature variability influences urban garden plant richness and gardener water use behavior, but not planting decisions. Sci. Total Environ. 2018, 646, 111–120. [Google Scholar] [CrossRef]
- Ayanlade, A. Remote sensing approaches for land use and land surface temperature assessment: A review of methods. Int. J. Image Data Fusion 2017, 8, 188–210. [Google Scholar] [CrossRef]
- Rahman, M.Z.; Rashid, M.S. Aerial Extent Analysis and Environmental Problems Identification of Matasagar and Sukhsagar Wetlands in Bangladesh Using GIS and Remote Sensing Tools. J. Geogr. Inf. Syst. 2016, 8, 683–691. [Google Scholar] [CrossRef][Green Version]
- Saaroni, H.; Ben-Dor, E.; Bitan, A.; Potchter, O. Spatial distribution and microscale characteristics of the urban heat island in Tel-Aviv, Israel. Landsc. Urban Plan. 2000, 48, 1–18. [Google Scholar] [CrossRef]
- Kim, S.W.; Brown, R.D. Urban heat island (UHI) intensity and magnitude estimations: A systematic literature review. Sci. Total Environ. 2021, 779, 146389. [Google Scholar] [CrossRef] [PubMed]
- Maharjan, M.; Aryal, A.; Shakya, B.M.; Talchabhadel, R.; Thapa, B.; Kumar, S. Evaluation of Urban Heat Island (UHI) Using Satellite Images in Densely Populated Cities of South Asia. Earth 2021, 2, 86–110. [Google Scholar] [CrossRef]
- Li, H.; Zhou, Y.; Li, X.; Meng, L.; Wang, X.; Wu, S.; Sodoudi, S. A new method to quantify surface urban heat island intensity. Sci. Total Environ. 2018, 624, 262–272. [Google Scholar] [CrossRef]
- Oh, J.W.; Ngarambe, J.; Duhirwe, P.N.; Yun, G.Y.; Santamouris, M. Using deep-learning to forecast the magnitude and characteristics of urban heat island in Seoul Korea. Sci. Rep. 2020, 10, 3559. [Google Scholar] [CrossRef] [PubMed]
- Sun, Y.; Wang, S.; Wang, Y. Estimating local-scale urban heat island intensity using nighttime light satellite imageries. Sustain. Cities Soc. 2020, 57, 102125. [Google Scholar] [CrossRef]
- Equere, V.; Mirzaei, P.A.; Riffat, S. Definition of a new morphological parameter to improve prediction of urban heat island. Sustain. Cities Soc. 2020, 56, 102021. [Google Scholar] [CrossRef]
- Deilami, K.; Kamruzzaman, M.; Liu, Y. Urban heat island effect: A systematic review of spatio-temporal factors, data, methods, and mitigation measures. Int. J. Appl. Earth Obs. Geoinf. 2018, 67, 30–42. [Google Scholar] [CrossRef]
- Shirani-Bidabadi, N.; Nasrabadi, T.; Faryadi, S.; Larijani, A.; Roodposhti, M.S. Evaluating the spatial distribution and the intensity of urban heat island using remote sensing, case study of Isfahan city in Iran. Sustain. Cities Soc. 2019, 45, 686–692. [Google Scholar] [CrossRef]
- Howard, L. The Climate of London Deduced from Meteorological Observations; W. Phillips: London, UK, 1818. [Google Scholar]
- Sultana, S.; Satyanarayana, A.N.V. Assessment of urbanisation and urban heat island intensities using landsat imageries during 2000–2018 over a sub-tropical Indian City. Sustain. Cities Soc. 2020, 52, 101846. [Google Scholar] [CrossRef]
- Rani, M.; Kumar, P.; Pandey, P.C.; Srivastava, P.K.; Chaudhary, B.; Tomar, V.; Mandal, V.P. Multi-temporal NDVI and surface temperature analysis for Urban Heat Island inbuilt surrounding of sub-humid region: A case study of two geographical regions. Remote Sens. Appl. Soc. Environ. 2018, 10, 163–172. [Google Scholar] [CrossRef]
- Mathew, A.; Khandelwal, S.; Kaul, N. Investigating spatial and seasonal variations of urban heat island effect over Jaipur city and its relationship with vegetation, urbanization and elevation parameters. Sustain. Cities Soc. 2017, 35, 157–177. [Google Scholar] [CrossRef]
- Guha, S.; Govil, H.; Diwan, P. Analytical study of seasonal variability in land surface temperature with normalized difference vegetation index, normalized difference water index, normalized difference built-up index, and normalized multiband drought index. J. Appl. Remote Sens. 2019, 13, 024518. [Google Scholar] [CrossRef]
- Yu, Q.; Acheampong, M.; Pu, R.; Landry, S.M.; Ji, W.; Dahigamuwa, T. Assessing effects of urban vegetation height on land surface temperature in the City of Tampa, Florida, USA. Int. J. Appl. Earth Obs. Geoinf. 2018, 73, 712–720. [Google Scholar] [CrossRef]
- Sussman, H.S.; Raghavendra, A.; Zhou, L. Impacts of increased urbanization on surface temperature, vegetation, and aerosols over Bengaluru, India. Remote Sens. Appl. Soc. Environ. 2019, 16, 100261. [Google Scholar] [CrossRef]
- Bashit, N.; Prasetyo, Y.; Sukmono, A. Analysis of Built-up Land Spatial Patterns Using Multitemporal Satellite Imagery in Pekalongan City. J. Appl. Geospat. Inf. 2020, 4, 356–362. [Google Scholar] [CrossRef]
- Nguyen, C.; Chidthaisong, A.; Diem, P.K.; Huo, L.-Z. A modified bare soil index to identify bare land features during agricultural fallow-period in southeast Asia using Landsat 8. Land 2021, 10, 231. [Google Scholar] [CrossRef]
- Yang, Y.; Cao, C.; Pan, X.; Li, X.; Zhu, X. Downscaling land surface temperature in an arid area by using multiple remote sensing indices with random forest regression. Remote Sens. 2017, 9, 789. [Google Scholar] [CrossRef]
- Souza, C.M.; Shimbo, J.Z.; Rosa, M.R.; Parente, L.L.; Alencar, A.A.; Rudorff, B.F.T.; Hasenack, H.; Matsumoto, M.; Ferreira, L.G.; Souza-Filho, P.W.M.; et al. Reconstructing Three Decades of Land Use and Land Cover Changes in Brazilian Biomes with Landsat Archive and Earth Engine. Remote Sens. 2020, 12, 2735. [Google Scholar] [CrossRef]
- BBS (Bangladesh Bureau of Statistics). Bangladesh Household Survey; Bangladesh Bureau of Statistics: Dhaka, Bangladesh, 2012.
- Rahman, M.N.; Shozib, S.H. Seasonal Variability of Waterlogging in Rangpur City Corporation Using GIS and Remote Sensing Techniques. Geosfera Indones. 2021, 6, 143–156. [Google Scholar] [CrossRef]
- Rai, R.; Zhang, Y.; Paudel, B.; Li, S.; Khanal, N.R. A Synthesis of Studies on Land Use and Land Cover Dynamics during 1930–2015 in Bangladesh. Sustainability 2017, 9, 1866. [Google Scholar] [CrossRef]
- Rahman, M.N.; Rony, M.R.H.; Jannat, F.A. Spatiotemporal evaluation of drought trend during 1979–2019 in seven climatic zones of Bangladesh. Heliyon 2021, 7, e08249. [Google Scholar] [CrossRef] [PubMed]
- Islam, A.R.M.T.; Islam, H.; Shahid, S.; Khatun, M.K.; Ali, M.M.; Rahman, M.; Ibrahim, S.M.; Almoajel, A.M. Spatiotemporal nexus between vegetation change and extreme climatic indices and their possible causes of change. J. Environ. Manag. 2021, 289, 112505. [Google Scholar] [CrossRef] [PubMed]
- Dewan, A.; Kiselev, G.; Botje, D.; Mahmud, G.I.; Bhuian, H.; Hassan, Q.K. Surface urban heat island intensity in five major cities of Bangladesh: Patterns, drivers and trends. Sustain. Cities Soc. 2021, 71, 102926. [Google Scholar] [CrossRef]
- Itzhak-Ben-Shalom, H.; Alpert, P.; Potchter, O.; Samuel, R. MODIS summer SUHI cross-sections anomalies over the meg-acities of the monsoon Asia region and global trends. Open Atmos. Sci. J. 2017, 11, 121–136. [Google Scholar] [CrossRef]
- Dewan, A.; Kiselev, G.; Botje, D. Diurnal and seasonal trends and associated determinants of surface urban heat islands in large Bangladesh cities. Appl. Geogr. 2021, 135, 102533. [Google Scholar] [CrossRef]
- Li, J.; Song, C.; Cao, L.; Zhu, F.; Meng, X.; Wu, J. Impacts of landscape structure on surface urban heat islands: A case study of Shanghai, China. Remote Sens. Environ. 2011, 115, 3249–3263. [Google Scholar] [CrossRef]
- Talukdar, S.; Eibek, K.U.; Akhter, S.; Ziaul, S.; Islam, A.R.M.T.; Mallick, J. Modeling fragmentation probability of land-use and land-cover using the bagging, random forest and random subspace in the Teesta River Basin, Bangladesh. Ecol. Indic. 2021, 126, 107612. [Google Scholar] [CrossRef]
- Banglapedia. Climatic. Available online: http://en.banglapedia.org/index.php?title=Climate (accessed on 20 February 2021).
- Banglapedia. Climatic Zone. Available online: http://en.banglapedia.org/index.php?title=Climatic_Zone#:~:text (accessed on 23 February 2021).
- Macrotrends. Available online: www.macrotrends.net (accessed on 25 February 2021).
- World Bank. Climate Change Overview. Available online: https://climateknowledgeportal.worldbank.org/country/bangladesh (accessed on 2 December 2021).
- Al Kafy, A.; Al-Faisal, A.; Hasan, M.M.; Sikdar, S.; Khan, M.H.H.; Rahman, M.; Islam, R. Impact of LULC Changes on LST in Rajshahi District of Bangladesh: A Remote Sensing Approach. J. Geogr. Stud. 2019, 3, 11–23. [Google Scholar] [CrossRef]
- Al Kafy, A.; Faisal, A.A.; Rahman, S.; Islam, M.; Al Rakib, A.; Islam, A.; Khan, H.H.; Sikdar, S.; Sarker, H.S.; Mawa, J.; et al. Prediction of seasonal urban thermal field variance index using machine learning algorithms in Cumilla, Bangladesh. Sustain. Cities Soc. 2020, 64, 102542. [Google Scholar] [CrossRef]
- El-Zeiny, A.M.; Effat, H.A. Environmental monitoring of spatiotemporal change in land use/land cover and its impact on land surface temperature in El-Fayoum governorate, Egypt. Remote Sens. Appl. Soc. Environ. 2017, 8, 266–277. [Google Scholar] [CrossRef]
- Verma, P.; Raghubanshi, A.; Srivastava, P.K. Appraisal of kappa-based metrics and disagreement indices of accuracy assessment for parametric and nonparametric techniques used in LULC classification and change detection. Model. Earth Syst. Environ. 2020, 6, 1045–1059. [Google Scholar] [CrossRef]
- Matsushita, B.; Yang, W.; Chen, J.; Onda, Y.; Qiu, G. Sensitivity of the Enhanced Vegetation Index (EVI) and Normalized Difference Vegetation Index (NDVI) to Topographic Effects: A Case Study in High-density Cypress Forest. Sensors 2007, 7, 2636–2651. [Google Scholar] [CrossRef]
- USGS. Landsat Normalized Difference Vegetation Index. Available online: https://www.usgs.gov/landsat-missions/landsat-normalized-difference-vegetation-index (accessed on 2 December 2021).
- Fatemi, M.; Narangifard, M. Monitoring LULC changes and its impact on the LST and NDVI in District 1 of Shiraz City. Arab. J. Geosci. 2019, 12, 127. [Google Scholar] [CrossRef]
- He, B.-J.; Zhao, Z.-Q.; Shen, L.-D.; Wang, H.-B.; Li, L.-G. An approach to examining performances of cool/hot sources in mitigating/enhancing land surface temperature under different temperature backgrounds based on landsat 8 image. Sustain. Cities Soc. 2018, 44, 416–427. [Google Scholar] [CrossRef]
- Gutman, G.; Huang, C.; Chander, G.; Noojipady, P.; Masek, J.G. Assessment of the NASA–USGS Global Land Survey (GLS) datasets. Remote Sens. Environ. 2013, 134, 249–265. [Google Scholar] [CrossRef]
- Weng, Q.; Lu, D.; Schubring, J. Estimation of land surface temperature–vegetation abundance relationship for urban heat island studies. Remote Sens. Environ. 2004, 89, 467–483. [Google Scholar] [CrossRef]
- Avdan, U.; Jovanovska, G. Algorithm for Automated Mapping of Land Surface Temperature Using LANDSAT 8 Satellite Data. J. Sens. 2016, 2016, 1480307. [Google Scholar] [CrossRef]
- Hu, Y.; Hou, M.; Jia, G.; Zhao, C.; Zhen, X.; Xu, Y. Comparison of surface and canopy urban heat islands within megacities of eastern China. ISPRS J. Photogramm. Remote Sens. 2019, 156, 160–168. [Google Scholar] [CrossRef]
- Molla, M.H.; Chowdhury, M.A.T.; Islam, A.Z.M.Z. Spatiotemporal Change of Urban Water Bodies in Bangladesh: A Case Study of Chittagong Metropolitan City Using Remote Sensing (RS) and GIS Analytic Techniques, 1989–2015. J. Indian Soc. Remote Sens. 2020, 49, 773–792. [Google Scholar] [CrossRef]
- Hassan, M.M.; Nazem, M.N.I. Examination of land use/land cover changes, urban growth dynamics, and environmental sustainability in Chittagong city, Bangladesh. Environ. Dev. Sustain. 2015, 18, 697–716. [Google Scholar] [CrossRef]
- Morshed, N.; Yorke, C.; Zhang, Q. Urban Expansion Pattern and Land Use Dynamics in Dhaka, 1989–2014. Prof. Geogr. 2016, 69, 396–411. [Google Scholar] [CrossRef]
- Hassan, M.M. Monitoring land use/land cover change, urban growth dynamics and landscape pattern analysis in five fastest urbanized cities in Bangladesh. Remote Sens. Appl. Soc. Environ. 2017, 7, 69–83. [Google Scholar] [CrossRef]
- Congalton, R.G. A review of assessing the accuracy of classifications of remotely sensed data. Remote Sens. Environ. 1991, 37, 35–46. [Google Scholar] [CrossRef]
- Ishtiaque, T.A.; Tasin, Z.T.; Akter, K.S. Urban heat Island intensity assessment through comparative study on land surface temperature and normalized difference vegetation index: A case study of Chittagong, Bangladesh. Int. J. Urban Civ. Eng. 2017, 11, 37–42. [Google Scholar]
- Gazi, Y.; Rahman, Z.; Uddin, M.; Rahman, F.M.A. Spatio-temporal dynamic land cover changes and their impacts on the urban thermal environment in the Chittagong metropolitan area, Bangladesh. GeoJournal 2020, 86, 2119–2134. [Google Scholar] [CrossRef]
- Parvin, N.S.; Abudu, D. Estimating Urban Heat Island Intensity using Remote Sensing Techniques in Dhaka City. Int. J. Sci. Eng. Res. 2017, 8, 289–298. [Google Scholar] [CrossRef]
- Faridatul, M.I. Spatiotemporal Effects of Land Use and River Morphological Change on the Microclimate of Rajshahi Metropolitan Area. J. Geogr. Inf. Syst. 2017, 09, 466–481. [Google Scholar] [CrossRef][Green Version]
- Uddin, J.; Mondal, C. Effect of earth covering and water body on land surface temperature (LST). J. Civ. Eng. Sci. Technol. 2020, 11, 45–56. [Google Scholar] [CrossRef]
- Al Rakib, A.; Akter, K.S.; Rahman, N.; Arpi, S.; Kafy, A. Analyzing the Pattern of Land Use Land Cover Change and its Impact on Land Surface Temperature: A Remote Sensing Approach. In Proceedings of the 1st International Student Research Conference-2020; Dhaka University Research Society (DURS), University of Dhaka: Dhaka, Bangladesh, 2020. [Google Scholar]
- Yuksel, U. Examination of the air and surface temperatures in structural and green areas in the city: The case of Ankara. Ecology 2008, 18, 66–74. [Google Scholar]
- Myhre, G.; Myhre, A. Uncertainties in Radiative Forcing due to Surface Albedo Changes Caused by Land-Use Changes. J. Clim. 2003, 16, 1511–1524. [Google Scholar] [CrossRef]
- Gophen, M. Land-Use, Albedo and Air Temperature Changes in the Hula Valley (Israel) during 1946–2008. Open J. Mod. Hydrol. 2014, 4, 101–111. [Google Scholar] [CrossRef][Green Version]
- Argüeso, D.; Evans, J.; Fita, L.; Bormann, K.J. Temperature response to future urbanization and climate change. Clim. Dyn. 2013, 42, 2183–2199. [Google Scholar] [CrossRef]
- Debbage, N.; Shepherd, J.M. The urban heat island effect and city contiguity. Comput. Environ. Urban Syst. 2015, 54, 181–194. [Google Scholar] [CrossRef]
- Huang, F.; Zhan, W.; Voogt, J.; Hu, L.; Wang, Z.; Quan, J.; Guo, Z. Temporal upscaling of surface urban heat island by in-corporating an annual temperature cycle model: A tale of two cities. Remote Sens. Environ. 2016, 186, 1–12. [Google Scholar] [CrossRef]
- Kant, Y.; Azim, S.; Mitra, D. Analyzing the influence of urban growth on thermal environment through demographic, environmental, and physical parameters in Bangladesh. In Land-Atmospheric Research Applications in South and Southeast Asia; Springer: Cham, Switzerland, 2018; pp. 613–639. [Google Scholar]
- Quan, J.; Zhan, W.; Chen, Y.; Wang, M.; Wang, J. Time series decomposition of remotely sensed land surface temperature and investigation of trends and seasonal variations in surface urban heat islands. J. Geophys. Res. Atmos. 2016, 121, 2638–2657. [Google Scholar] [CrossRef]
- Wang, Y.; Berardi, U.; Akbari, H. Comparing the effects of urban heat island mitigation strategies for Toronto, Canada. Energy Build. 2016, 114, 2–19. [Google Scholar] [CrossRef]
- Hu, X.-M.; Xue, M.; Klein, P.M.; Illston, B.G.; Chen, S. Analysis of Urban Effects in Oklahoma City using a Dense Surface Observing Network. J. Appl. Meteorol. Clim. 2016, 55, 723–741. [Google Scholar] [CrossRef]
- Roy, S.; Pandit, S.; Eva, E.A.; Bagmar, S.H.; Papia, M.; Banik, L.; Dube, T.; Rahman, F.; Razi, M.A. Examining the nexus between land surface temperature and urban growth in Chattogram Metropolitan Area of Bangladesh using long term Landsat series data. Urban Clim. 2020, 32, 100593. [Google Scholar] [CrossRef]
- Chakraborty, T.; Lee, X. A simplified urban-extent algorithm to characterize surface urban heat islands on a global scale and examine vegetation control on their spatiotemporal variability. Int. J. Appl. Earth Obs. Geoinf. 2018, 74, 269–280. [Google Scholar] [CrossRef]
- Peng, J.; Hu, Y.; Dong, J.; Liu, Q.; Liu, Y. Quantifying spatial morphology and connectivity of urban heat islands in a megacity: A radius approach. Sci. Total Environ. 2020, 714, 136792. [Google Scholar] [CrossRef]
- Li, L.; Zha, Y.; Zhang, J. Spatially non-stationary effect of underlying driving factors on surface urban heat islands in global major cities. Int. J. Appl. Earth Obs. Geoinf. 2020, 90, 102131. [Google Scholar] [CrossRef]
- Raj, S.; Paul, S.K.; Chakraborty, A.; Kuttippurath, J. Anthropogenic forcing exacerbating the urban heat islands in India. J. Environ. Manag. 2020, 257, 110006. [Google Scholar] [CrossRef]
- Ojeh, V.N.; Balogun, A.A.; Okhimamhe, A.A. Urban-Rural Temperature Differences in Lagos. Climate 2016, 4, 29. [Google Scholar] [CrossRef]
- Shojaei, P.; Gheysari, M.; Myers, B.; Eslamian, S.; Shafieiyoun, E.; Esmaeili, H. Effect of different land cover/use types on canopy layer air temperature in an urban area with a dry climate. Build. Environ. 2017, 125, 451–463. [Google Scholar] [CrossRef]
- Chapman, S.; Watson, J.E.; Salazar, A.; Thatcher, M.; McAlpine, C.A. The impact of urbanization and climate change on urban temperatures: A systematic review. Landsc. Ecol. 2017, 32, 1921–1935. [Google Scholar] [CrossRef]
- Mora, C.; Dousset, B.; Caldwell, I.R.; Powell, F.E.; Geronimo, R.C.; Bielecki, C.R.; Counsell, C.W.W.; Dietrich, B.S.; Johnston, E.T.; Louis, L.V.; et al. Global risk of deadly heat. Nat. Clim. Chang. 2017, 7, 501–506. [Google Scholar] [CrossRef]
- Rahman, M.M.; Rahman, M.M.; Momotaz, M. Environmental quality evaluation in Dhaka City Corporation—Using satellite imagery. Proc. Inst. Civ. Eng. Urban Des. Plan. 2019, 172, 13–25. [Google Scholar] [CrossRef]
- Chun, B.; Guldmann, J.M. Impact of greening on the urban heat island: Seasonal variations and mitigation strategies. Comput. Environ. Urban Syst. 2018, 71, 165–176. [Google Scholar] [CrossRef]
- Islam, A.R.M.T.; Ahmed, I.; Rahman, S. Trends in cooling and heating degree-days overtimes in Bangladesh? An investigation of the possible causes of changes. Nat. Hazards 2020, 101, 879–909. [Google Scholar] [CrossRef]
- Oleson, K.W.; Bonan, G.B.; Schaaf, C.; Gao, F.; Jin, Y.; Strahler, A. Assessment of global climate model land surface albedo using MODIS data. Geophys. Res. Lett. 2003, 30. [Google Scholar] [CrossRef]


| District | Year | Population | Area (sq. km) | Climate | District | Year | Population | Area (sq. km) | Climate |
|---|---|---|---|---|---|---|---|---|---|
| Barisal | 2000 | 248,000 | 2785.52 | Tropical savanna | Chattogram | 2000 | 3,308,000 | 5282.92 | Tropical monsoon |
| 2010 | 344,000 | 2010 | 4,106,000 | ||||||
| 2020 | 484,000 | 2020 | 5,020,000 | ||||||
| Dhaka | 2000 | 10,285,000 | 1497.17 | Tropical savanna | Mymensingh | 2000 | 350,000 | 4394.57 | Tropical monsoon |
| 2010 | 14,731,000 | 2010 | 401,000 | ||||||
| 2020 | 21,006,000 | 2020 | 460,000 | ||||||
| Rajshahi | 2000 | 678,000 | 2401 | Tropical savanna | Rangpur | 2000 | 279,000 | 2400.56 | Humid sub-tropical |
| 2010 | 786,000 | 2010 | 337,000 | ||||||
| 2020 | 908,000 | 2020 | 407,000 | ||||||
| Sylhet | 2000 | 852,000 | 3452.07 | Tropical monsoon | |||||
| 2010 | 529,000 | ||||||||
| 2020 | 331,000 |
| District | Year | Landsat | Date of Acquisition | Sensor | Path and Row |
|---|---|---|---|---|---|
| Barisal | 2000 | Landsat-5 | 19 January 2000 | TM | 137/44 |
| 2010 | 30 January 2010 | ||||
| 2020 | Landsat-8 | 26 January 2010 | OLI_TIRS | ||
| Chattogram | 2000 | Landsat-5 | 13 February 2000 | TM | 136/44, 136/45 |
| 2010 | 8 February 2010 | ||||
| 2020 | Landsat-8 | 4 February 2020 | OLI_TIRS | ||
| Dhaka | 2000 | Landsat-5 | 19 January 2000 | TM | 137/43, 137/44 |
| 2010 | 30 January 2010 | ||||
| 2020 | Landsat-8 | 11 February 2010 | OLI_TIRS | ||
| Mymensingh | 2000 | Landsat-5 | 19 January 2000 | TM | 137/43 |
| 2010 | 30 January 2010 | ||||
| 2020 | Landsat-8 | 11 February 2010 | OLI_TIRS | ||
| Rajshahi | 2000 | Landsat-5 | 11 February 2000 | TM | 138/43 |
| 2010 | 6 February 2010 | ||||
| 2020 | Landsat-8 | 18 February 2020 | OLI_TIRS | ||
| Rangpur | 2000 | Landsat-5 | 11 February 2000 | TM | 138/42 |
| 2010 | 6 February 2010 | ||||
| 2020 | Landsat-8 | 2 February 2020 | OLI_TIRS | ||
| Sylhet | 2000 | Landsat-5 | 29 February 2000 | TM | 136/43 |
| 2010 | 8 February 2010 | ||||
| 2020 | Landsat-8 | 4 February 2020 | OLI_TIRS |
| District | Category | 2000 (sq.km) | 2010 (sq.km) | 2020 (sq.km) | Changes (2000–2010) | Percent Changes | Changes (2010–2020) | Percent Changes |
|---|---|---|---|---|---|---|---|---|
| Rangpur | Bare Land | 58.05 | 30.69 | 32.50 | −27.36 | −1.18 | 1.81 | 0.08 |
| Urban area | 573.16 | 759.75 | 1067.40 | 186.59 | 8.02 | 307.65 | 13.22 | |
| Water body | 20.11 | 33.69 | 29.80 | 13.58 | 0.58 | −3.89 | −0.17 | |
| Vegetation | 1675.21 | 1502.41 | 1196.78 | −172.80 | −7.43 | −305.63 | −13.14 | |
| Mymensingh | Bare Land | 12.81 | 44.40 | 13.37 | 31.59 | 0.74 | −31.03 | −0.72 |
| Urban area | 1094.82 | 1233.73 | 2020.48 | 138.91 | 3.24 | 786.75 | 18.36 | |
| Water body | 47.69 | 47.09 | 70.23 | −0.60 | −0.01 | 23.14 | 0.54 | |
| Vegetation | 3130.21 | 2960.58 | 2181.74 | −169.63 | −3.96 | −778.84 | −18.17 | |
| Sylhet | Bare Land | 27.48 | 2.89 | 21.33 | −24.59 | −0.71 | 18.44 | 0.53 |
| Urban area | 159.55 | 580.75 | 630.70 | 421.20 | 12.21 | 49.95 | 1.45 | |
| Water body | 146.30 | 65.40 | 235.87 | −80.90 | −2.34 | 170.47 | 4.94 | |
| Vegetation | 3117.64 | 2801.88 | 2563.87 | −315.76 | −9.15 | −238.01 | −6.90 | |
| Rajshahi | Bare Land | 54.68 | 51.76 | 45.09 | −2.92 | −0.12 | −6.67 | −0.28 |
| Urban area | 848.48 | 987.26 | 1075.77 | 138.78 | 5.83 | 88.51 | 3.72 | |
| Water body | 75.23 | 68.04 | 70.15 | −7.19 | −0.30 | 2.11 | 0.09 | |
| Vegetation | 1403.68 | 1274.90 | 1191.03 | −128.78 | −5.41 | −83.87 | −3.52 | |
| Dhaka | Bare Land | 14.40 | 15.89 | 14.51 | 1.49 | 0.10 | −1.38 | −0.09 |
| Urban area | 709.20 | 694.21 | 958.62 | −14.99 | −0.98 | 264.41 | 17.36 | |
| Water body | 53.68 | 48.30 | 61.63 | −5.38 | −0.35 | 13.33 | 0.88 | |
| Vegetation | 745.47 | 764.40 | 488.01 | 18.93 | 1.24 | −276.39 | −18.15 | |
| Barisal | Bare Land | 179.20 | 63.51 | 76.70 | −115.69 | −5.17 | 13.19 | 0.59 |
| Urban area | 58.56 | 295.57 | 1022.56 | 237.01 | 10.60 | 726.99 | 32.51 | |
| Water body | 107.13 | 223.79 | 231.26 | 116.66 | 5.22 | 7.47 | 0.33 | |
| Vegetation | 1891.42 | 1653.73 | 905.56 | −237.69 | −10.63 | −748.17 | −33.46 | |
| Chattogram | Bare Land | 40.02 | 36.63 | 21.62 | −3.39 | −0.08 | −15.01 | −0.33 |
| Urban area | 577.25 | 701.03 | 1373.04 | 123.78 | 2.76 | 672.01 | 14.98 | |
| Water body | 184.03 | 163.30 | 136.15 | −20.73 | −0.46 | −27.15 | −0.61 | |
| Vegetation | 3684.43 | 3584.30 | 2954.84 | −100.13 | −2.23 | −629.46 | −14.03 |
| District | Year | Class | User Accuracy | Producer Accuracy | Overall Accuracy | Kappa Coefficient |
|---|---|---|---|---|---|---|
| Barisal | 2000 | Bare Land | 73.68 | 82.35 | 85.20 | 0.77 |
| Built-up Area | 66.67 | 90.91 | ||||
| Vegetation | 94.05 | 79.83 | ||||
| Water Body | 94.29 | 100.00 | ||||
| 2010 | Bare Land | 88.57 | 100.00 | 88.00 | 0.81 | |
| Built-up Area | 73.68 | 70.00 | ||||
| Vegetation | 76.60 | 90.00 | ||||
| Water Body | 95.96 | 87.16 | ||||
| 2020 | Bare Land | 87.50 | 100.00 | 93.13 | 0.90 | |
| Built-up Area | 97.50 | 90.70 | ||||
| Vegetation | 87.50 | 87.50 | ||||
| Water Body | 100.00 | 95.24 | ||||
| Chattogram | 2000 | Bare Land | 77.50 | 91.18 | 81.88 | 0.75 |
| Built-up Area | 85.00 | 75.56 | ||||
| Vegetation | 85.00 | 69.39 | ||||
| Water Body | 80.00 | 100.00 | ||||
| 2010 | Bare Land | 80.00 | 80.00 | 83.13 | 0.77 | |
| Built-up Area | 80.00 | 80.00 | ||||
| Vegetation | 87.50 | 87.50 | ||||
| Water Body | 85.00 | 85.00 | ||||
| 2020 | Bare Land | 92.50 | 94.87 | 86.88 | 0.82 | |
| Built-up Area | 75.00 | 75.00 | ||||
| Vegetation | 87.50 | 81.40 | ||||
| Water Body | 92.50 | 97.37 | ||||
| Dhaka | 2000 | Bare Land | 82.50 | 100.00 | 83.75 | 0.78 |
| Built-up Area | 85.00 | 77.27 | ||||
| Vegetation | 80.00 | 71.11 | ||||
| Water Body | 87.50 | 92.11 | ||||
| 2010 | Bare Land | 90.00 | 100.00 | 91.25 | 0.88 | |
| Built-up Area | 92.50 | 78.72 | ||||
| Vegetation | 85.00 | 89.47 | ||||
| Water Body | 97.50 | 100.00 | ||||
| 2020 | Bare Land | 90.00 | 100.00 | 86.88 | 0.82 | |
| Built-up Area | 80.00 | 76.19 | ||||
| Vegetation | 80.00 | 78.05 | ||||
| Water Body | 97.50 | 95.12 | ||||
| Mymensingh | 2000 | Bare Land | 85.00 | 100.00 | 88.13 | 0.84 |
| Built-up Area | 92.50 | 92.50 | ||||
| Vegetation | 85.00 | 72.34 | ||||
| Water Body | 90.00 | 92.31 | ||||
| 2010 | Bare Land | 82.50 | 97.06 | 83.13 | 0.77 | |
| Built-up Area | 67.50 | 100.00 | ||||
| Vegetation | 87.50 | 92.11 | ||||
| Water Body | 95.00 | 62.30 | ||||
| 2020 | Bare Land | 87.50 | 100.00 | 88.75 | 0.85 | |
| Built-up Area | 97.50 | 88.64 | ||||
| Vegetation | 87.50 | 79.55 | ||||
| Water Body | 82.50 | 89.19 | ||||
| Rajshahi | 2000 | Bare Land | 100.00 | 95.24 | 87.50 | 0.83 |
| Built-up Area | 80.00 | 94.12 | ||||
| Vegetation | 80.00 | 74.42 | ||||
| Water Body | 90.00 | 87.80 | ||||
| 2010 | Bare Land | 100.00 | 95.24 | 89.38 | 0.85 | |
| Built-up Area | 67.50 | 96.43 | ||||
| Vegetation | 97.50 | 73.58 | ||||
| Water Body | 92.50 | 100.00 | ||||
| 2020 | Bare Land | 100.00 | 100.00 | 93.13 | 0.90 | |
| Built-up Area | 82.50 | 94.29 | ||||
| Vegetation | 92.50 | 82.22 | ||||
| Water Body | 97.50 | 97.50 | ||||
| Rangpur | 2000 | Bare Land | 80.00 | 100.00 | 87.50 | 0.83 |
| Built-up Area | 82.50 | 80.49 | ||||
| Vegetation | 90.00 | 76.60 | ||||
| Water Body | 97.50 | 97.50 | ||||
| 2010 | Bare Land | 95.00 | 100.00 | 90.00 | 0.86 | |
| Built-up Area | 85.00 | 91.89 | ||||
| Vegetation | 90.00 | 76.60 | ||||
| Water Body | 90.00 | 94.74 | ||||
| 2020 | Bare Land | 90.00 | 94.74 | 86.88 | 0.82 | |
| Built-up Area | 77.50 | 83.78 | ||||
| Vegetation | 82.50 | 71.74 | ||||
| Water Body | 97.50 | 100.00 | ||||
| Sylhet | 2000 | Bare Land | 72.50 | 100.00 | 87.50 | 0.83 |
| Built-up Area | 87.50 | 85.37 | ||||
| Vegetation | 95.00 | 80.85 | ||||
| Water Body | 95.00 | 88.37 | ||||
| 2010 | Bare Land | 100.00 | 97.56 | 91.25 | 0.88 | |
| Built-up Area | 97.50 | 75.00 | ||||
| Vegetation | 72.50 | 100.00 | ||||
| Water Body | 95.00 | 100.00 | ||||
| 2020 | Bare Land | 82.50 | 97.06 | 84.38 | 0.79 | |
| Built-up Area | 82.50 | 82.50 | ||||
| Vegetation | 95.00 | 71.70 | ||||
| Water Body | 77.50 | 93.94 |
| Area | Year | Temperature (°C) | Area | Per Cent Change | Area | Year | Temperature (°C) | Area | Per Cent Change |
|---|---|---|---|---|---|---|---|---|---|
| Barisal | 2000 | 14.71–17.47 | 312.96 | 13.99 | Chattogram | 2000 | 17.47–20.17 | 799.2422 | 17.82 |
| 17.47–18.38 | 1007.304 | 45.04 | 20.17–21.06 | 1477.061 | 32.93 | ||||
| 18.38–18.83 | 544.7676 | 24.36 | 21.06–21.94 | 1332.5 | 29.71 | ||||
| 18.83–19.72 | 325.35 | 14.55 | 21.94–23.25 | 780.1382 | 17.39 | ||||
| 19.72–24.54 | 46.23 | 2.07 | 23.25–28.76 | 96.631 | 2.15 | ||||
| 2010 | 16.56–17.93 | 149.85 | 6.70 | 2010 | 17.02–21.06 | 799.2604 | 17.82 | ||
| 17.93–19.72 | 700.18 | 31.31 | 21.06–22.37 | 1607.954 | 35.85 | ||||
| 19.72–21.06 | 960.27 | 42.93 | 22..37–23.68 | 1232.395 | 27.47 | ||||
| 21.06–22.37 | 362.99 | 16.23 | 23.68–25.82 | 706.7859 | 15.76 | ||||
| 22.37–27.09 | 63.28 | 2.83 | 25.82–31.64 | 139.27 | 3.10 | ||||
| 2020 | 17.21–18.61 | 207.8975 | 9.30 | 2020 | 12.03–20.05 | 569.3204 | 12.69 | ||
| 18.61–19.39 | 763.3504 | 34.13 | 20.05–21.01 | 1477.769 | 32.94 | ||||
| 19.39–20.08 | 766.6907 | 34.28 | 21.01–21.97 | 1383.896 | 30.85 | ||||
| 20.08–21.13 | 445.1029 | 19.90 | 21.97–23.33 | 840.1881 | 18.73 | ||||
| 21.13–25.95 | 53.52764 | 2.39 | 23.33–32.55 | 213.0636 | 4.75 | ||||
| Dhaka | 2000 | 11.88–16.10 | 169.3025 | 11.12 | Mymensingh | 2000 | 14.24–17.02 | 935.6212 | 21.83 |
| 16.10–17.02 | 660.2207 | 43.35 | 17.02–17.93 | 1672.55 | 39.03 | ||||
| 17.02–17.93 | 444.6282 | 29.20 | 17.93–18.83 | 1204.605 | 28.11 | ||||
| 17.93–18.83 | 181.3708 | 11.91 | 18.83–19.72 | 360.5033 | 8.41 | ||||
| 18.83–23.68 | 67.30422 | 4.42 | 19.72–24.54 | 112.4708 | 2.62 | ||||
| 2010 | 16.53–19.72 | 398.6277 | 26.18 | 2010 | 13.77–19.28 | 1117.137 | 26.07 | ||
| 19.72–21.06 | 623.056 | 40.91 | 19.28–20.17 | 1739.536 | 40.59 | ||||
| 21.06–22.37 | 334.1014 | 21.94 | 20.17–21.06 | 782.3379 | 18.25 | ||||
| 22.37–24.11 | 130.523 | 8.57 | 21.06–22.37 | 508.4115 | 11.86 | ||||
| 24.11–29.59 | 36.50096 | 2.40 | 22.37–27.93 | 138.2994 | 3.23 | ||||
| 2020 | 17.89–20.82 | 167.0037 | 10.97 | 2020 | 15.37–20.70 | 657.0212 | 15.33 | ||
| 20.82–22.09 | 592.2974 | 38.89 | 20.70–21.28 | 1911.871 | 44.61 | ||||
| 22.09–23.31 | 437.5772 | 28.73 | 21.28–22.13 | 1284.027 | 29.96 | ||||
| 23.31–25.11 | 258.5014 | 16.98 | 22.13–23.68 | 369.288 | 8.62 | ||||
| 25.11–30.33 | 67.40691 | 4.43 | 23.68–29.00 | 63.56586 | 1.48 | ||||
| Rajshahi | 2000 | 7.99–13.77 | 0.108031 | 0.00 | Rangpur | 2000 | 11.40–18.38 | 532.9292 | 22.91 |
| 13.77–16.56 | 177.5506 | 7.45 | 18.38–18.83 | 761.79 | 32.74 | ||||
| 16.56–17.02 | 507.7203 | 21.31 | 18.83–19.72 | 839.1335 | 36.07 | ||||
| 17.02–17.47 | 1139.577 | 47.84 | 19.72–21.06 | 147.5184 | 6.34 | ||||
| 17.47–21.94 | 557.0388 | 23.38 | 21.06–25.82 | 45.1306 | 1.94 | ||||
| 2010 | 16.10–18.38 | 47.39137 | 1.99 | 2010 | 15.64–17.93 | 489.0469 | 21.02 | ||
| 18.38–20.61 | 932.7005 | 39.16 | 17.93–19.28 | 862.8425 | 37.09 | ||||
| 20.61–21.94 | 776.454 | 32.60 | 19.28–20.61 | 597.2121 | 25.67 | ||||
| 21.94–24.11 | 497.7213 | 20.89 | 20.61–22.37 | 304.2014 | 13.08 | ||||
| 24.11–29.18 | 127.7852 | 5.36 | 22.37–27.93 | 73.21678 | 3.15 | ||||
| 2020 | 18.99–21.28 | 52.85249 | 2.22 | 2020 | 13.20–18.50 | 502.6909 | 21.61 | ||
| 21.28–22.79 | 865.2631 | 36.32 | 18.50–19.37 | 821.9776 | 35.33 | ||||
| 22.79–23.83 | 1077.733 | 45.24 | 19.37–20.29 | 594.9595 | 25.57 | ||||
| 23.83–25.86 | 327.451 | 13.75 | 20.29–21.51 | 302.883 | 13.02 | ||||
| 25.86–30.05 | 58.75703 | 2.47 | 21.51–26.25 | 103.9618 | 4.47 | ||||
| Sylhet | 2000 | 15.17–18.83 | 648.0724 | 18.78 | |||||
| 18.83–20.17 | 988.2278 | 28.64 | |||||||
| 20.17–21.50 | 987.1232 | 28.60 | |||||||
| 21.50–23.25 | 691.1813 | 20.03 | |||||||
| 23.25–29.18 | 136.3068 | 3.95 | |||||||
| 2010 | 17.02–20.17 | 901.1923 | 26.11 | ||||||
| 20.17–21.50 | 920.6859 | 26.68 | |||||||
| 21.50–22.81 | 824.0293 | 23.88 | |||||||
| 22.81–24.54 | 602.0792 | 17.45 | |||||||
| 24.54–30.00 | 202.9232 | 5.88 | |||||||
| 2020 | 16.10–19.17 | 607.4081 | 17.60 | ||||||
| 19.17–19.99 | 1113.531 | 32.27 | |||||||
| 19.99–20.80 | 918.7201 | 26.62 | |||||||
| 20.80–21.80 | 658.5974 | 19.08 | |||||||
| 21.80–27.68 | 152.66 | 4.42 |
Publisher’s Note: MDPI stays neutral with regard to jurisdictional claims in published maps and institutional affiliations. |
© 2022 by the authors. Licensee MDPI, Basel, Switzerland. This article is an open access article distributed under the terms and conditions of the Creative Commons Attribution (CC BY) license (https://creativecommons.org/licenses/by/4.0/).
Share and Cite
Rahman, M.N.; Rony, M.R.H.; Jannat, F.A.; Chandra Pal, S.; Islam, M.S.; Alam, E.; Islam, A.R.M.T. Impact of Urbanization on Urban Heat Island Intensity in Major Districts of Bangladesh Using Remote Sensing and Geo-Spatial Tools. Climate 2022, 10, 3. https://doi.org/10.3390/cli10010003
Rahman MN, Rony MRH, Jannat FA, Chandra Pal S, Islam MS, Alam E, Islam ARMT. Impact of Urbanization on Urban Heat Island Intensity in Major Districts of Bangladesh Using Remote Sensing and Geo-Spatial Tools. Climate. 2022; 10(1):3. https://doi.org/10.3390/cli10010003
Chicago/Turabian StyleRahman, Md. Naimur, Md. Rakib Hasan Rony, Farhana Akter Jannat, Subodh Chandra Pal, Md. Saiful Islam, Edris Alam, and Abu Reza Md. Towfiqul Islam. 2022. "Impact of Urbanization on Urban Heat Island Intensity in Major Districts of Bangladesh Using Remote Sensing and Geo-Spatial Tools" Climate 10, no. 1: 3. https://doi.org/10.3390/cli10010003
APA StyleRahman, M. N., Rony, M. R. H., Jannat, F. A., Chandra Pal, S., Islam, M. S., Alam, E., & Islam, A. R. M. T. (2022). Impact of Urbanization on Urban Heat Island Intensity in Major Districts of Bangladesh Using Remote Sensing and Geo-Spatial Tools. Climate, 10(1), 3. https://doi.org/10.3390/cli10010003