


Abstract
Building on arguments by Joshua Angrist and Jörn-Steffen Pischke arguments for how the teaching of undergraduate econometrics could become more effective, I propose a redesign of graduate econometrics that would better serve most students and help make the field of economics more relevant. The primary basis for the redesign is that the conventional methods do not adequately prepare students to recognize biases and to properly interpret significance, insignificance, and p-values; and there is an ethical problem in searching for significance and other matters. Based on these premises, I recommend that some of Angrist and Pischke’s recommendations be adopted for graduate econometrics. In addition, I recommend further shifts in emphasis, new pedagogy, and adding important components (e.g., on interpretations and simple ethical lessons) that are largely ignored in current textbooks. An obvious implication of these recommended changes is a confirmation of most of Angrist and Pischke’s recommendations for undergraduate econometrics, as well as further reductions in complexity.
1. Introduction
On 23 January 2015, basketball player Klay Thompson of the Golden State Warriors hit all 13 of his shot attempts in the 3rd quarter of a game against the Sacramento Kings—this included making 9 of 9 on 3-point shots1. These 3-point shots were not all wide-open 3-point shots players typically take (with the team passing the ball around until they find an open player). Rather, several of them were from far beyond the 3-point line or with a defender close enough to him that under normal circumstances, few would dare take such a heavily contested shot.
Everyone knew that Klay Thompson was “in the zone” or “en fuego”, or that Thompson had the “hot hand” that night. Everyone that is … unless you are a statistician, a psychologist, or an economist (particularly, a Nobel-Prize-winning economist) without adequate training in econometrics or regression analysis. Starting with Gilovich et al. (1985), an entire literature over 25 years found no evidence for the hot hand in basketball. Even the famous evolutionary biologist, Steve Jay Gould, got in on this research (Gould 1989). From the results, these researchers claimed that the hot hand was a “myth” or “cognitive illusion”.
This was an incredibly appealing result: that all basketball players and fans were wrong to believe in the hot hand (players achieving a temporary higher playing level) and that they were committing the cognitive bias of seeing patterns (the hot hand) in data that, the researchers claimed, were actually random and determined by a binomial process. Therefore, the story has shown up in many popular books—e.g., Nudge (Thaler and Sunstein 2009) and Thinking Fast and Slow (Kahneman 2011). Note that Kahneman and Thaler are the 2002 and 2017 winners of the Nobel Prize in economics, respectively. In addition, this was a story that a recent-Harvard-President-and-almost-Fed-Chairman-nominee gave to the Harvard men’s basketball team, as he brought media along in his address to the team (Brooks 2013).
However, it turns out, these researchers and Nobel laureates failed to recognize a few biases to the estimated relationship between making prior shots and the current shot—i.e., alternative explanations for why there was no significant relationship. In addition, they made a major logical error in their interpretation. Both are discussed in a moment.
From my experience playing basketball and occasionally experiencing the hot hand, I knew the researchers were wrong to conclude that the hot hand was a myth (This, as it turns out, is an example of the fact that sometimes, there are limits to what data can tell us; and, the people engaged in an activity often will understand it better than researchers trying to model the activity with imperfect data or imperfect modeling techniques). Eventually, I developed a more powerful model by pooling all players together in a player-fixed-effects model rather than have players analyzed one at a time, as in the prior studies. In Arkes (2010), I found the first evidence for the hot hand, showing that players were about 3- to 5-percentage points more likely to make a second of two free throws if they had made their first free throw.
Yet, I failed to recognize an obvious bias in past studies and my own study that Stone (2012) noted: measurement error. Measurement error is not just from lying or a coding error. It could also stem from the variable not representing well the concept that it is trying to measure—a point that eluded me, along with the prior researchers. Therefore, whether a player made their first free throw is an imperfect indicator of whether the player was in the hot-hand state, and the misclassification would likely cause a bias towards zero in the estimated hot-hand effect. There was another major problem in these studies from the Gambler’s Fallacy, as noted by Miller and Sanjurjo (2018). This leads to a negative bias (not just towards zero, as would bias from measurement error). Both biases make it more difficult to detect the hot hand.
Reading Stone (2012) was a watershed moment for me. I realized that in my graduate econometrics courses, I had learned equation-wise how these biases to coefficient estimates work in econometrics, but I never truly learned how to recognize some of these biases. And, this appears to be a pattern. The conventional methods for teaching econometrics that I was exposed to did not teach me (nor others) how to properly scrutinize a regression. Furthermore, given that such errors were even being committed by some of those we deem to be the best in our field, this appears to be a widespread and systemic problem.
What was also exposed in these studies and writings on the hot hand (beyond the failure to recognize the measurement error) was the authors’ incorrect interpretations. They took the insignificant estimate to indicate proof that the hot hand does not exist (A referee at the first journal to which I sent my 2010 hot-hand article wrote that the research had to be wrong because “it’s been proven that the hot hand does not exist”). This line of reasoning is akin to taking a not-guilty verdict or a finding of “not enough evidence for a crime” and claiming that it proves innocence. The proper interpretation should have been that the researchers found no evidence for the hot hand. And now, despite the hurdles of negative biases, there is more evidence coming out that the hot hand is real (e.g., Bocskocsky et al. 2014; Miller and Sanjurjo 2018).
This article is my attempt to remedy relatively common deficiencies in the econometric education of scholars and practitioners. I contend that inadequate econometrics education directly drives phenomena such as the errors in the hot-hand research and on other research topics I will discuss below. Although the veracity or falsifiability of the basketball hot hand probably does not materially affect anyone, errors in research can affect public perceptions, which in turn affects how much influence academics can have.
Angrist and Pischke (2017) recently called for a shift in how undergraduate econometrics should be taught. Their main recommended shifts were:
- (1)
- The abstract equations and high-level math should be replaced with real examples;
- (2)
- There should be greater emphasis on choosing the best set of control variables for causal interpretation of some treatment variable;
- (3)
- There should be a shift towards randomized control trials and quasi-experimental methods (e.g., regression-discontinuities and difference-in-difference methods), as these are the methods most often used by economists these days.
Angrist and Pischke’s recommendations, particularly (2) and (3), appear to be largely based on earlier arguments they made (Angrist and Pischke 2010) that better data and better study designs have helped economists take the “con” out of econometrics. They cite several random-assignment studies, including studies on the effects of cash transfers on child welfare (e.g., Gertler 2004) and on the effects of housing vouchers (Kling et al. 2007).
In this article, I build on Angrist and Pischke’s (2017) study to make the argument for a redesign of graduate econometrics. I use several premises, perhaps most notably: (a) a large part of problems in research is from researchers not recognizing potential sources of bias to coefficient estimates, incorrectly interpreting significance, and potential ethical problems; (b) any bias to coefficient estimates has a much greater potential to threaten the validity of a model than bias to standard errors.
And so, the general redesign I propose involves a change from the high-level-math econometric theory to a more practical approach and shifts in emphasis towards new pedagogy for recognizing when coefficient estimates might be biased, proper interpretations, and ethical research practices. I argue that the first two of Angrist and Pischke’s (2017) arguments should apply to graduate econometrics as well. However, because some of the models in their third argument are based on the rare instances of randomness or having the data to do a more-complicated quasi-experimental method, I recommend a shift in emphasis away from these towards more practical quasi-experimental methods (such as fixed effects). The idea is, rather than teaching people how to find randomness and build a topic around that, it might be more worthwhile for students to learn how to deal with the more prevalent research problem of needing to use less-than-ideal data.
My new recommended changes are:
- A.
- Increase emphasis on some regression basics (“holding other factors constant” and regression objectives)
- B.
- Reduce emphasis on getting the standard errors correct
- C.
- Adopt new approaches for teaching how to recognize biases
- D.
- Shift focus to the more practical quasi-experimental methods
- E.
- Add emphasis on interpretations on statistical significance and p-values
- F.
- Advocate less complexity
- G.
- Add a simple ethical component.
Although most of the article makes the case for changes to graduate econometrics, my argument implies that undergraduate econometrics needs a similar redesign. This follows directly from the arguments on graduate econometrics, along with the idea that the common approach, using high-level math, is teaching undergraduates as if they would all become econometric theorists; probably less than one percent of them will.
The ideas and arguments I present come from my experiences in two types of worlds: in research organizations (where I had to develop models to assess policy options) and as an academic (creating my own research and teaching about econometrics).
The article proceeds, in Section 2, with a discussion of the premises behind why I believe changes are needed and demonstrates how much various topics are covered and how little more important topics are covered in the leading textbooks. Section 3 presents some examples of topics with decades of research failing to recognize biases and examples of my own research errors. Section 4 discusses my proposed changes. Section 5 makes the case for changes to undergraduate econometrics. I provide conclusions in Section 6.
2. Why a Redesign Is Needed
In this section, I give five reasons why there needs to be a major shift in teaching graduate econometrics, and I show what is emphasized in leading graduate textbooks. By “major shift” or “redesign”, I mean that there should be new topics, new pedagogy (for teaching how to scrutinize a regression), and shifts in emphasis for what is taught among existing topics. The five reasons I give also serve as the premises for support of some of Angrist and Pischke’s (2017) recommendations on redesigning undergraduate econometrics and for the recommended changes I give in Section 4. The five reasons are:
- There are concerns on the validity of much economic research;
- Biases in coefficient estimates threaten a model’s validity much more than biases in standard errors;
- The conventional methods for teaching econometrics do not adequately prepare students to recognize biases to coefficient estimates;
- The high-level math and proofs are unnecessary and take valuable time away from more important concepts; and
- There are ethical problems in research, namely on the search for significance and not fully disclosing potential sources of bias.
2.1. There Are Concerns on the Validity of Much Economic Research
There is growing evidence of problems with validity in all academic research, and economics certainly has its problems. In my view, there are three main sources of the concerns. First, there are some topics that have conflicting results in the research—e.g., the research on the effects of minimum-wage increases (see Gill 2018). Second, there are errors in interpretations. For example, akin to the incorrect interpretations in the hot-hand research, Cready et al. (2019) find that 65% of articles in the top Accounting journals with null results misrepresent the true meaning of those null results. I am not aware of a similar study for economics, but as I will discuss below, it is taught incorrectly in several leading econometric textbooks.
Third and (in my view) most importantly, researchers sometimes fail to recognize or fully acknowledge potential biases to the coefficient estimates. Not addressing potential biases could result in the failure of studies to be replicated. This certainly could be the cause of some cases of conflicting results. In Section 3, I give some examples in a few economics topics in which nearly the entire literature failed to recognize likely biases. This highlights the point below that the current methods are not working well for preparing students to develop proper models and to recognize the biases.
2.2. Biases in Coefficient Estimates Threaten a Model’s Validity More Than Biases in Standard Errors
From my experience, almost all corrections for clustering or heteroskedasticity result in standard errors being adjusted less than 15%. That said, there can be instances of much larger bias in the standard errors, particularly for panel data sets. For example, Petersen (2009) finds that the bias in standard errors for finance panel data sets is as high as 45% under certain circumstances. However, generally speaking, the bias on coefficient estimates from any of the major pitfalls (e.g., reverse causality, omitted-variables bias, and measurement error) could be significantly larger and, except for measurement error, even produce an estimated effect that has the reverse sign of the true effect (which would mean more than a 100% bias).
Supporting this idea is the contention that the major research errors are more likely to come from biased coefficient estimates than biased standard errors. For example, the initial research on estrogen replacement therapy (based on observational data) suggested that it was highly beneficial to women in terms of reduced mortality (e.g., Ettinger et al. 1996). However, a follow-on randomized control trial in 2002 found that taking estrogen could actually lead to a greater risk of death (Rossouw et al. 2002). And, later research after following the participants in the randomized study for longer found that taking estrogen could actually improve health outcomes (Manson et al. 2017), depending on age.
2.3. Current Methods Do Not Teach How to Recognize Biases
This statement is based on several observations. First, as mentioned earlier, there are problems of validity in some academic research. Second, after having received the conventional training in econometrics, I have failed in several instances to recognize pitfalls and biases in my own research. Third, just by common sense, it must be difficult to translate the concept of conditional mean dependence/independence of the error term (the conventional criterion) to recognize whether a coefficient estimate might be biased (from, for example, omitted-variables bias and measurement error). I admittedly have difficulty and must think hard about making this connection. Fourth, to the best of my knowledge, conditional mean dependence of the error term cannot explain the bias from the inclusion in a model of mediating factors, or “bad controls”, as Angrist and Pischke (2009) call them. These are variables that are part of the mechanism for why the treatment affects the outcome. (This is different from “collider” variables used in the Directed Acyclic Graph approach, in which a variable is affected by both the treatment and the outcome.)
2.4. The High-Level Math and Proofs Are Unnecessary and Take Valuable Time Away from More Important Concepts
I consider myself to be a “generalist” researcher, with deeper dives into military, labor, health, behavioral, and sports economics. In my dozens of publications and dozens of reports, I never needed the calculus or linear algebra that was used in the econometrics courses I took. Although the necessary math underlying basic probability theory and statistics was important, the calculus and linear algebra used in econometrics never helped me understand the real nuances of what happens when you hold other factors constant nor how to recognize the pitfalls and sources of bias. What contributed to my understanding of these things has been the intuition I have gained from using regressions for many research projects and from the mistakes I made—mistakes due to not adequately grasping how to recognize the pitfalls of regression analysis.
And so, along the lines of Angrist and Pischke’s (2017) argument, real examples would be much more useful and practical than the math underlying the regressions. The lessons from examples are almost certainly more likely to be retained than abstract equations. Adding visual aids could be even more effective.
This is not to say that the high-level math theory is not important for all students. For those aiming to study econometric theory, they would need that more mathematical approach. However, for improvisation of applying the concepts to new situations, students would likely benefit more from examples than from knowing the high-level math underlying the econometrics.
Let me emphasize that this is my view, based on my experiences described above. As I look back to the errors I have made, what would have helped more than the math for me would have been more practical experience on recognizing pitfalls and understanding the nuances of certain techniques. However, others feel differently and believe the math is essential.
2.5. There Is an Ethical Problem in Economic Research
In the scores of job-market-candidate seminars I have attended in my two decades since graduate school, I do not remember one in which the candidate had an insignificant coefficient estimate on the key explanatory variable. The high percentage of significant results could be due to graduate students giving up on a topic if the results do not support the theory they developed. However, it could also partly stem from some searching for significance (or p-hacking), meaning that some students keep changing the model (by adding or cutting control variables or by changing the method) until they achieve a desirable result. There has been mixed evidence on p-hacking; one study that found evidence for p-hacking is Head et al. (2015), although they argue that the extent of it is relatively minor when compared to effect sizes.
Another issue, mentioned above as a source of validity problems, is that researchers are not always fully honest and forthright about potential limitations of a study. To do so would reduce their chance of being published. Or, for those producing reports for sponsors (e.g., at research organizations), I suspect that many do not want to express any lack of confidence in their results.
These ethical problems are certainly not universal, as most research is probably done objectively and honestly. However, likely due to the pressures to publish and raise research funds, there is certainly a portion of research that could be conducted more responsibly. Simple ethical lessons might be able to help.
2.6. What the Textbooks Teach
Table 1 shows my estimates on the number of pages devoted to various topics in the six textbooks I believe are the most widely used for graduate econometrics. This is not a scientific assessment, as it is based on my judgment of the number of pages having the discussion centered around the topic and does not include other mentions of the topic. One pattern is that other than for “simultaneity”, there appears to be greater emphasis on the things that could bias the standard errors than there is on the things that could bias the coefficient estimates. In fact, one of the potential sources of bias for coefficient estimates (inclusion of mediating factors) is not even mentioned other than by Angrist and Pischke (2009), and there is minimal discussion for the other biases. The large number of pages I indicate is devoted to simultaneity might be misleading, as few of these pages are devoted to identifying when it could occur and the direction of the bias. In fact, “reverse causality” is a very small part of number of pages devoted to simultaneity (and not mentioned in most of these).
Table 1.
What the main graduate textbooks teach (number of pages on a given topic).
Furthermore, in most of these books, there is for the most part no discussion on the intuition behind “holding other factors constant” and what exactly happens when you do so, and there is no discussion in any of the books on the Bayesian critique of p-values. In addition, three of the four books that discuss hypothesis tests incorrectly state that an insignificant coefficient estimate indicates that one should accept the null hypothesis.
Assuming that econometrics courses mirror these books, there are many changes needed in the teaching of graduate econometrics, as the typical emphasis in econometrics appears to be on things that diverge from the reality of the problems that practitioners face.
3. Research Topics with Decades of Research Errors
Responding to Leamer’s (1983) critique on the unreliability of econometric research, Angrist and Pischke (2010) argued that better data and better research designs have improved the credibility of econometric research. I imagine that overall, there have been improvements in research. However, plenty of unreliable research continues to be published.
I will discuss in this section the following three research topics in which the investigators failed to recognize likely biases and did not realize it for decades:
- (A)
- The hot hand in basketball, continuing the discussion from the Introduction;
- (B)
- The public-finance/macroeconomic topic of how state tax rates affect Gross State Product;
- (C)
- How occupation-specific bonuses affect the probability of reenlistment in the military.
3.1. The Hot Hand in Basketball
The world is not necessarily better off with knowledge of whether the hot hand in basketball is real or not. However, if it turns out that there is no hot hand, which would stand in contrast with what the population believes, then this would be indicative of a mass cognitive illusion. However, in my view, the real value in the research comes from the arc of the story on the research and the mistakes made.
As discussed in the Introduction, no researcher in the first 25 years of study on the hot hand in basketball found any evidence for the hot hand. These studies were based on runs tests, conditional-probability tests, and stationarity tests for individual players, finding no statistically significant evidence for a hot-hand effect—see Bar-Eli et al. (2006) for a review of the early studies. The researchers (and Nobel Prize winners writing about this research) claimed that the “hot hand is a myth” or a “figment of our imaginations”. However, in Arkes (2010), I pooled all players into a player-fixed-effects model (to generate more power) that regressed “whether a player made a second free throw in a set of two or three free throws” on “whether the player made the first free throw”. I found a small but significant hot-hand-effect of 3 to 5 percentage points. Still, this study turned out to be flawed.
The first major error the researchers made is that they interpreted an insignificant estimate as proof of non-existence. However, as the saying goes, absence of evidence is not evidence of absence. The correct interpretation should have been that there is no evidence for the hot hand. This is a common logical error made throughout academia (not just Economics and Statistics), and it was highlighted in Amrhein et al. (2019), which I discuss below.
The second major error is that the researchers (including myself this time) failed to recognize what should have been an obvious bias: measurement error. Stone (2012) noted that the hot hand means that a player is in a state in which he/she has a higher probability than normal of making a shot (which contrasts with the conventional thought that a player “can’t miss”). This means that a player can be in the hot-hand state and miss a shot, and the player can be in the normal state and make a few shots in a row, making it seem as if he/she is in that hot-hand state.
This means that the crude indicator I used for being in the hot-hand state in Arkes (2010)—making the first of two free throws—and the indicators that others have used (e.g., making the last three shots) could very well occur in the normal state. In addition, having missed the prior shot(s) could still occur in the “hot hand” state. The misclassification (measurement error) likely caused a downward bias, and this certainly could have contributed to the failure of most studies to detect the hot hand. In addition, the hot-hand effect I found for free throws in Arkes (2010) was probably a gross understatement due to the measurement error.
Miller and Sanjurjo (2018) found another major error in this research, related to the Gambler’s Fallacy, that was not so obvious. They demonstrated that if you take all “heads” in a finite sequence of coin flips, the probability that the following flip is “heads” is actually less than 50%—yes, this is true! They then applied this to the hot-hand application and, with the correction, actually found a significant hot-hand effect with the data used in the seminal hot-hand study (Gilovich et al. 1985).
This source of bias again highlights the flaws in the original interpretations that the lack of evidence for the hot hand proved it was a myth. Not only had most of the literature misinterpreted the significance tests, but they had not given the model a thorough scrutiny of the potential biases that could speak to whether the lack of any estimated effect was correct.
3.2. How State Income Tax Rates Affect Gross State Product
Another research topic that has had questionable modeling strategies has been on how state tax rates affect state economic growth. The convention has been to use a Cobb-Douglas model as the theoretical framework underpinning the econometric model. The Cobb-Douglas model has state economic growth as a function of tax rates, as well as other economic factors such as labor and capital. Therefore, models typically include control variables reflecting labor and capital. For example, several studies include a measure of the unemployment rate as a control variable (Mofidi and Stone 1990; Bania et al. 2007). Others use the amount of capital (Reed 2008; Yeoh and Stansel 2013). And, some studies even include state personal income per capita (Wasylenko and McGuire 1985; Poulson and Kaplan 2008) or the wage rate (e.g., Wasylenko and McGuire 1985; Funderburg et al. 2013) as control variables.
Including these variables may not have been the best approach. Bartik (1991) raised an important consideration for these models that has been largely ignored in the literature: that several factors of economic growth are endogenous. Variables such as the average wage rate, the labor supply (proxied by the unemployment rate), the level of capital, and capital growth are all factors of economic growth and, at the same time, are measures of economic growth that could depend on the tax rate. They are what Angrist and Pischke (2009) described as “bad controls” in that they come after the treatment (taxes) and control for part of the effect of the tax rate. Or, Arkes (2019) considers such variables as potential mediating factors for how the tax rate affects economic growth, i.e., tax rates could affect how much investment and employment growth there is, which in turn affect economic growth. We can also think of investment, the unemployment rate, employment growth, and personal income per capita being themselves outcomes of tax rates.
Including these variables means that what is being estimated is something akin to (but not exactly) the effect of tax rates on Gross State Product beyond the effects on employment growth, investment, and/or personal income per capita. This is no longer informative on how tax rates affect Gross State Product. The counterargument is that excluding these factors from the model could cause omitted-variables bias. At the very least, the issue of mediating factors versus omitted-variables bias should be acknowledged by the researchers.
3.3. How Occupation-Specific Bonuses Affect the Probability of Reenlistment
This is an important research issue for the military services, as they try to set the optimal bonuses to efficiently achieve a required reenlistment rate in an occupation. In over 40 years of research on this topic, all studies have been subject to numerous biases, some of which were only recently recognized. The typical model would be:
where Rio is the reenlistment/retention decision for serviceperson i in occupation o, BONUS is either a dollar amount or a multiple-of-basic-pay determining the amount a serviceperson would receive, X would be a set of other factors, such as year, home-state unemployment rate, and more, and µo represents occupation fixed effects.
Rio = β1 × (BONUS)io + Xioβ2 + µo + εio,
Arkes (2018) describes four major sources of bias in these studies:
- There is the obvious bias of reverse causality in that lower reenlistment rates lead to higher bonuses.
- Enlisted personnel often have latitude on when they reenlist, so if they were planning to reenlist, they may time it to when the bonus appears to be higher than normal; so, the bonus is endogenous in that it is chosen to some extent by those reenlisting. This is an indirect reverse causality, in that the choice of reenlisting or not (R) would affect the timing of the reenlistment; and those choosing to reenlist would tend to do so when the bonus is relatively high within their reenlistment window.
- There is likely bias from measurement error, as servicepersons often have a few different bonuses during their reenlistment window, and the one most often recorded is the one at the official reenlistment date, not the one when they sign the new contract (which is not among the available data and can be up to two months earlier).
- There is unobserved heterogeneity because excess supply for reenlistments can mean that we only observe whether a person reenlists rather than whether he/she is willing to reenlist (or actual reenlistment supply). Excess supply of reenlistments could result from reduced demand from the military (e.g., occupations being eliminated) or worsening civilian prospects for the skill. Excess supply when an occupation is eliminated (and the reenlistment rate and bonus equals zero) could lead to a large exaggeration of the bonus effect.
In the numerous studies on this topic—see Arkes (2018) for a list of some of the more recent studies—none recognized the third and fourth sources of bias, and only one (Goldberg 2001) recognized the second source of bias. Furthermore, most studies attempted to address the reverse causality with separate occupation and year fixed effects. However, any variation across occupations in changes in the propensity to reenlist (due to changing civilian-economy opportunities or military environment) would still result in this reverse causality. I used occupation-fiscal-year-interacted fixed effects to reduce the bias from reverse causality, but I acknowledged that it likely led to greater bias from measurement error (Arkes 2018), as occurs often with fixed effects (see below).
The ultimate result of all this is that with the historical and current reenlistment rules and inadequate data, this is a research question that just cannot be accurately answered with any adequate degree of confidence that the potential biases are being addressed. Indeed, Hansen and Wenger (2005) note that different assumptions in such models produce widely different results. Even random assignment would probably not work well, as servicepersons would likely know whether they received a high or low bonus, and any perceived inequity could have its own effects on retention.
3.4. Summary
These three topics highlight how the entire literature on a topic can go decades without recognizing likely sources of bias. I cannot speak to how extensive this is among the many big topics in empirical economics, but there must be other topics that have had similar problems. For example, there is a literature on how the state unemployment rate (or other measures of local economies) affects various health or social outcomes—I have had several articles in this literature. I cannot recall one (including mine) that recognized that using state fixed effects (or controls) exacerbates any bias from measurement error in the economic measure, which would likely cause attenuation bias—a lesson I learned far too late into my career. This is not terribly harmful in this case, as at least it is a bias against finding significant estimates, but it has been an unrecognized bias, nonetheless.
4. Recommended Changes and New Topics for Graduate Econometrics
In this section, I propose seven new recommendations for redesigning graduate econometrics courses, most of which follow from the premises from Section 2. However, first, I contend that the first two of Angrist and Pischke’s (2017) recommendations for changing undergraduate econometrics would work well for changes to graduate econometrics. These recommended changes are:
- Replace the math with intuition and examples
- Focus on choosing the best set of control variables.
The first is consistent with basic tenets of pedagogical theory, as the practice of some skill to learn about certain concepts can be much more instructive than learning the abstract equations underlying the concepts. The second one is important for avoiding potential biases, and it goes hand in hand with my first new added recommendation below.
What follows are my new recommended changes. These are the new components, changes in pedagogy, and shifts in emphasis that should help to develop effective and responsible academics and practitioners. The recommended changes and shifts I will discuss are:
- A.
- Increase emphasis on some regression basics (“holding other factors constant” and regression objectives)
- B.
- Reduce emphasis on getting the standard errors correct
- C.
- Adopt new approaches for teaching how to recognize biases
- D.
- Shift focus to the more practical quasi-experimental methods
- E.
- Add emphasis on interpretations on statistical significance and p-values
- F.
- Advocate less complexity
- G.
- Add a simple ethical component
A. Increase emphasis on some regression basics (“holding other factors constant” and regression objectives)
These two concepts of “holding other factors constant” and the various regression objectives are important building blocks needed to understand when there could be potential bias to a coefficient estimate and for determining the optimal set of control variables to use—Angrist and Pischke’s second point. In addition, together they should help foster understanding of why modeling strategies should be different depending on the objectives of a regression analysis.
I believe it is commonly assumed that students will understand “holding other factors constant” from the few pages, if that, devoted to the concept in textbooks. However, in my view, this is usually not the case. Lessons on this topic should include a discussion of the purpose of holding other factors constant, a demonstration of what happens when you do so, and in what circumstances would you not want to hold certain factors constant. In Arkes (2019), I describe a simple issue of whether adding cinnamon to your chocolate-chip cookie improves the taste. In this example, I ask which is the better approach: (1) make two batches from scratch, adding cinnamon to one; or (2) make one batch, split it in two, and add cinnamon to one of them. Most would agree that the second would be a better test because you do not want any other factor that could affect the outcome of taste (butter, sugar, and chocolate chips) to vary as you switch from the no-cinnamon to cinnamon batch, i.e., you want to hold those other factors constant. This is the point of multivariate models: design the model so that the only relevant factor that changes is the treatment or key explanatory variable. That said, with interval (quantitative) variables, it is impossible to perfectly control for the variable, and so perhaps the best that can be said is that one is attempting to adjust for the variable.
In Arkes (2019), I describe what I believe are the four main objectives of regression analyses: (1) estimating causal effects; (2) forecasting/predicting an outcome; (3) determining predictors for an outcome; and (4) analyzing relative performance by removing the influence of contextual factors, which is similar to the concept of “anomaly detection.”I proceed to describe how the choice of control variables (what should be held constant) should depend on the objective. For example, a causal-effects model might attempt to estimate the effect of a college degree on the probability of getting in a car accident in a given year. An insurance company, on the other hand, might be more interested in predicting the probability of a person getting in a car accident—the second objective above. One potential control variable in both analyses would be whether the person has a white-collar job. That could be a mediating factor (a “bad control”) for how a college degree affects the probability of an accident, so it would be best to exclude that variable in the causal-effects analysis. However, the insurance company might find that variable to be a valuable contributor to obtain a more accurate prediction of the probability of an accident. The insurance company does not care about obtaining the correct estimate of how a college degree affects the likelihood of an accident. Likewise, forecasting GDP (or Gross State Product, GSP) growth would involve a different strategy from that for estimating the effects of tax rates on GDP/GSP growth. In these cases of predicting an outcome or forecasting, including explanatory variables is not meant to hold other factors constant but rather to improve the prediction/forecast.
Some textbooks, e.g., Greene (2012), indicate that the adjusted R2 could be used as part of the “model selection criteria”. However, any measure of goodness-of-fit would primarily be useful for determining whether a variable should be included for forecasting/prediction. For estimating causal effects, whether a potential control variable contributes to explaining the dependent variable should not be a factor in determining whether it should be included in the model. These are just a few examples of why understanding the objective of the regression is important.
B. Reduce emphasis on getting the standard errors correct
This was a passing point by Angrist and Pischke (2017). However, in my view, it deserves status as one of the main recommendations. The justification for this recommendation is partly based on one of the premises from Section 2: that biases to standard errors are typically minimal compared to the potential biases to coefficient estimates. To this point, Harford (2014) argues that sampling bias can be much more harmful than sampling error, as demonstrated by the 1936 Literary Digest poll that found a 55-41 advantage for Landon over Roosevelt in the Presidential election. The 2.4-million sample size (and tiny standard errors) did not matter when there was sampling bias. This idea goes back to Leamer (1988), who argued that corrections for heteroscedasticity are mere “white-washing” if there is no consideration of the validity of the coefficient estimates.
Further justification for reducing the emphasis on corrections for standard errors comes from the vagueness of the p-value and statistical significance. Getting the standard errors correct is typically meant to make proper confidence intervals or correct conclusions on hypothesis tests, which are usually based on t-stats or p-values meeting certain thresholds. However, as I learned not too long ago (and far too late into my career), the p-value by itself actually has little meaning, given the Bayesian critique of p-values. This is discussed by Ioannidis (2005), who points out that the probability that an empirical relationship is real depends on: (1) the t-statistic; (2) the a priori probability that there could be an empirical relationship; and (3) the statistical power of the study (and this depends on the probability of a false negative and requires an alternative hypothesized value). The p-value is based just on the first one, the t-statistic. The less likely there is such a relationship, a priori, the less likely any given t-statistic indicates a significant relationship, as Nuzzo (2014) demonstrates. For example, even for an a priori toss-up (50% chance there is a relationship), p-values of 0.05 and 0.01 translate to only 71% and 89% probabilities that the relationship is real.
Unfortunately, it is nearly impossible to know beforehand what the probability is that there is an effect of one variable on another. This uncertainty means that higher levels of significance than is the current convention would be needed to make any strong conclusions about statistical relationships being real. Given the vagueness of the p-value and that high levels of significance should be used to make any strong conclusions, errors in the standard errors would tend to be much less impactful to those conclusions than would potentially much larger biases in coefficient estimates.
Correcting standard errors for heteroskedasticity and clustering is still important, yet it is easy to recognize when it is needed and typically takes only a few characters of code to correct for. Recognizing and addressing biases to coefficient estimates is more difficult and takes much more practice to become proficient, and so greater emphasis should go towards those concepts.
C. Adopt new approaches to teach how to recognize biases
As I described above, I do not believe that “conditional mean dependence of the error term” is an effective concept to teach how to recognize biases. I believe that calling a source of bias what it is (e.g., reverse causality) rather than what it does (conditional dependence of the error term) is a good starting point. I believe it would be more effective if we were to list the most common sources of bias, provide some visual depictions of the biases (when possible), and give examples of the various types of situations in which they might arise. In Arkes (2019), I list what I believe are the six most common biases for coefficient estimates when estimating causal effects: reverse causality, omitted-variables bias, self-selection bias, measurement error, and including mediating factors or outcomes as control variables. In addition, I give guidance on how to recognize such biases. These are the main alternative stories that need to be considered before making conclusions from results. (I since added a 7th bias, from improper reference groups2.) Useful visual depictions could be the “directed acyclical graphical” (DAG) approach (Pearl and Mackenzie 2018; Cunningham 2018), basic flowcharts (Arkes 2019), and animations produced by Nick Huntington-Klein on his website: http://nickchk.com/causalgraphs.html. These tools demonstrate when there could be bias and what needs to be controlled for.
As an example of using visualizations (with flowcharts), let us take again the research issue from Section 3 on how occupation-specific bonuses affect retention decisions in the military:
Rio = β1 × (BONUS)io + Xioβ2 + µo + εio,
Figure 1 demonstrates the concept of reverse causality and omitted-variables bias. An arrow in such a pictorial representation of a model would represent the causal effect of a one-unit change in the pointing variable on the pointed-to variable. The objective would be to estimate A, the average causal effect of the occupational-specific bonus on the probability that a serviceperson reenlists. We hope that is an unbiased estimate of A in Figure 1. However, captures all the reasons why the bonus and the retention decision might move together (or not), after adjusting for the factors in X.
Figure 1.
A visual representation of reverse causality.
To determine whether there is any potential bias, it does not require a formal theoretical model with assumptions on what factors affect what other factors. Rather, one would start by considering the reasons why the bonus and retention variables move (or do not move) together, other than the bonus affecting the retention decision. This would also determine what needs to be controlled for.
The question to ask for reverse causality is whether the probability of reenlistment could affect the bonus, represented by the arrow labeled B in Figure 1. It very likely could, as a decrease in the probability of reenlistment for people in a certain occupation (due perhaps to increases in civilian labor market demand for the skill or increases in the deployment rates for the occupation) would cause the military service to have to increase the bonus; and an increase in the probability of reenlistment would allow the service to reduce the bonus.
Because B is likely negative, there would be a negative bias from the reverse causality on the estimated effect of the bonus on the probability of reenlistment. This bias would cause to be lower than the value of A in Figure 1. (It requires much deeper and more-convoluted thought to determine the sign of the bias from an argument based on conditional mean dependence of the error term.) Thus, we would have an alternative story for why the estimated effect of the bonus is what it is—i.e., alternative to the causal-effects story. Attempts to address this with fixed effects would need to make sure that within the fixed-effects group, there still would not be any potential reverse causality (or omitted-variables bias).
For omitted-variables bias, in my experience, students have a hard time thinking of whether any variable might affect both the treatment and the outcome. Therefore, I found it to be more effective to use three steps: (a) What factors are the main drivers of why some have high vs. low (or 1 vs. 0) values of the treatment? (b) Which of those (if any) can you not adequately control for? (c) Could any of those factors affect the outcome beyond any effects through the treatment?
In Figure 1, we would need to think of what causes variation in the bonus in the sample. I imagine the list would include the occupation, the year (and factors specific to a given year, such as national economic conditions), the particular demand for the skills of servicepersons in a given occupation, and the working conditions for those in that occupation—such working conditions could change over time, and they would probably be rougher (say, more negative in theory) during periods of wars or increased deployments. All of these factors could affect the outcome beyond any effects through the bonus, and so if not controlled for, they would cause omitted-variables bias. I demonstrate this in Figure 1, with the omitted factor being working conditions for those in the occupation, using an oval to represent that we do not have a measure for it. Therefore, if we cannot adequately control for this, then better working conditions for an occupation in a given year would negatively affect the bonus (directly or indirectly through higher retention, leading to reverse causality) and positively affect retention, so C < 0 and D > 0. Thus, not adequately controlling for working conditions (and other things that could impact both the bonus and retention) for the occupation would lead to a negative omitted-variables bias for (the product of C and D in Figure 1 would be negative). These are perhaps the most common sources of bias, and they follow directly from such a figure. However, there are other sources of bias, such as measurement error, that need to be considered.
Figure 2 demonstrates another type of omitted-variables bias based on the research issue of how the state unemployment rate (representing the strength of the labor market) affects marijuana use for teenagers. Therefore, A is the true average effect of a one-percentage-point increase in the state unemployment rate on the probability of a teenager using marijuana.
Figure 2.
A visual representation of omitted-variables bias from incidental correlation.
The problem is that whereas there is probably not any general factor that systematically affects both the state unemployment rate and teenage marijuana use, it still could be that states that have a higher general propensity to use marijuana (outside the influence of the economy) tend to have higher or lower unemployment rates, but not due to any systematic relationship. Therefore, whereas the occupational bonus and retention propensity for an occupation, in Figure 1, might have “spurious correlation” (due to a systematic relationship) contributing to why the variables move together, the state unemployment rate and propensity for teenage marijuana use might have “incidental correlation” that contributes to why they move together. If so, this would cause omitted-variables bias. (Line C, without arrows, is indicative of an incidental correlation that does not have an underlying systematic relationship).
Alternatively, you could put a specific state (say, California) as the potential omitted factor at the bottom of the figure and then have an arrow pointing from the California variable to both the unemployment rate (a positive effect, as California tends to have higher unemployment rates than the U.S.) and teen marijuana use (I am guessing positive). In this case, there would be positive omitted-variables bias from not controlling for California. For other states, it could be different. And, as a whole, it is quite possible that either the negative or positive biases could dominate the other, leading to a non-trivial bias in the estimate.
In this case, controlling for the states (with dummy variables or state fixed effects) would help towards addressing this problem. However, based on the concept mentioned at the end of Section 3, using fixed effects (or, controlling for a categorization) when the treatment has some error could cause greater bias from measurement error. In this case, a higher proportion of the usable variation in the state unemployment rate within states would be due to measurement error. (That is, in the ratio of variation due to measurement error divided by overall usable variation, state fixed effects reduces the denominator significantly but does not reduce the numerator.)
Let me give two tangents. First, omitted-variables bias is not a problem if the regression objective is forecasting or determining predictors of an outcome—this provides an example of how an understanding of regression objectives (recommendation A above) is important. Second, Arkes (2019) notes that the conventional definition of omitted-variables bias needs some modification. Note that in Figure 1 and Figure 2, the correlation between the treatment and the omitted variable is based on the omitted variable affecting the treatment or incidental correlation. If, on the other hand, the omitted variable were a mediating factor and were affected by the treatment, then there would not be omitted-variables bias by excluding the variable; rather, there would be bias by including the variable. Therefore, the conventional definition that an omitted variable is correlated with the treatment and affects the outcome needs to add as a condition that the correlation is not solely due to the treatment affecting the omitted variable. Seeing this in a flow-chart demonstration can help with this concept.
In another visual lesson to recognize the direction of the biases, the bias from non-differential measurement error can be demonstrated with a simple bar graph of an outcome (say, income) for two groups (no-college-degree and college-degree). One can then easily see what would happen to the difference in income if people get randomly misclassified as to whether they have a college degree. The two averages would converge, and the estimated effect of a college degree would be biased downwards, at least from measurement error.
Finally, any teaching of how to recognize biases would be served well by having numerous examples to apply the concept to. This is consistent with the lessons from the book, How Learning Works (Ambrose et al. 2010), in which the authors argue that mastery of a subject requires much practice applying the topic and knowing when to and which topic to apply to a new situation. This is also consistent with higher levels of understanding, based on Bloom’s Taxonomy. Furthermore, seeing research mistakes in action could provide meaningful lessons. And, dissecting media reports on research and gauging how trustworthy that research is (based on simply reading the media report) might be worthwhile for developing intuition on scrutinizing research.
D. Shift focus to the more practical quasi-experimental methods
This recommendation actually is in the same spirit as but diverges from the third of Angrist and Pischke’s (2017) recommendations. They espouse a shift in the focus of econometrics classes to randomized control trials (RCT) and quasi-experimental methods. One method they mention is the Regression-Discontinuity (RD) approach, which has appeared to become the new favorite approach for graduate students. This strategy parallels an earlier article (Angrist and Pischke 2010) and their book (Angrist and Pischke 2009).
However, I would argue there could be a better approach. The methods Angrist and Pischke espouse are more for academics who can search for randomness or a discontinuity and build a topic from that. It is not as effective for non-academics and other academics who are trying to address a specific policy question that will probably not afford the opportunity to apply an RCT or RD to the problems they are given. Furthermore, it limits the usefulness of economists. As Sims (2010) stated:
“If applied economists narrow the focus of their research and critical reading to various forms of pseudo-experimental, the profession loses a good part of its ability to provide advice about the effects and uncertainties surrounding policy issues”.
Sims (2010) also suggested that many of the quasi-experimental studies have limited scope with regards to the extrapolation of the results. This could occur, for example, due to non-linearities or just the nature of Local Average Treatment Effects that some quasi-experimental methods estimate. This further limits the usefulness of economics research.
Meanwhile, the less-complicated quasi-experimental methods might be more fruitful for most people conducting economic research and may be less limiting in extrapolation of the estimates. In particular, from my experiences in the non-academic world, a fixed-effects model is often the only plausible approach to addressing some potential sources of bias.
Given that the fixed-effects method would likely be a more useful tool than RD and other quasi-experimental methods, more emphasis should be placed on the nuances of fixed effects. These include many particulars of fixed effects that I wish I had learned in graduate school. For example:
- (1)
- As described above in some things I had missed in my own research, bias from measurement error can be exacerbated by fixed effects;
- (2)
- The estimated treatment effect with fixed effects is a weighted average of the estimated treatment effects within each fixed-effects group;
- (3)
- The natural regression weights of the fixed-effects groups with a higher variance of the treatment are disproportionately higher—this concept and the correction is described in Gibbons et al. (2018) and Arkes (2019, Section 8.3); and so shifting the natural weight of a group could partly explain why fixed-effects estimates are different from the corresponding estimates without fixed effects; also besides fixed effects, this concept applies to cases in which one simply controls for categories (e.g., race). Reweighting observations can help address this problem.
Although the RCT is the most valid type of study, it is easy to analyze and few will have the resources to conduct one. The RD approach is a rare occurrence, and it is more for “finding a topic to use the method” than “finding a method for a topic”. The fixed-effects method is much more widely used, and so shifting focus to the nuances of fixed effects would be more practical and useful to most students.
E. Add emphasis on interpretations on statistical significance and p-values
Perhaps the most important topic for which interpretations need to be taught better is on statistical significance and insignificance. In a recent article in Nature, Amrhein et al. (2019) call for an end to statistical significance and p-values and instead to use confidence intervals. There have been similar calls for teaching statistical analysis beyond the “p-value” approach over the last few decades—e.g., Gigerenzer (2004), Wasserstein and Lazar (2016), and Wasserstein et al. (2019). Wasserstein et al. (2019) said: “Statistics education will require major changes at all levels to move to a post ‘p < 0.05’ world”. However, most textbooks continue to teach hypothesis tests based on the conventional approach that uses p-values.
I am aware of only two textbooks that discuss the problems of p-values and potential solutions: Paolella (2018) and Arkes (2019). Paolella (2018) points out all the problems with hypothesis tests, the p-value, and even the use of confidence intervals. He makes the point that hypothesis tests should not be used, but he notes how the p-values still might be useful. A single study with a low p-value provides little evidence for a theory or an empirical relationship. However, repeated studies with low p-values would provide stronger evidence. This confirms the value of the importance of replications. Furthermore, as Paolella argues, finding a p-value of 0.06 on a new drug that could cure cancer does not mean that society should discard any further research on the drug. Rather, the result should be interpreted as “something might be there” and it should be further investigated (Paolella 2018).
One area that could also use better instruction is on the various possible explanations for insignificance. Amrhein et al. (2019) find that over half of 791 articles across five journals made the mistake of interpreting insignificance as meaning that there is no effect—and these do not include the hot-hand studies. Aczel et al. (2018) find an even worse statistic for three leading psychology journals: 72% of 137 studies from 2015 with negative results had incorrect interpretations of those results. What highlights the problem with these interpretations is that an insignificant estimate may still provide more evidence for the alternative hypothesis than for the null (Aczel et al. 2018). Abadie (2020) makes the argument that an insignificant estimate might have more information than a significant estimate. In addition, there is always the possibility that a biased coefficient estimate has caused the insignificance; and a bias could cause significance when there is no causal effect. Furthermore, as described in Arkes (2019), if a treatment were to positively affect some and negatively affect others, then it could be that an insignificant effect is the average of these positive and negative effects that are, to some extent, cancelling each other out. Thus, it would be improper to conclude that the treatment has no effect based on an insignificant estimate. That said, a precisely estimated coefficient very close to zero (“precise nulls”, as some call them), if free from potential biases, could mean that there is evidence for no meaningful average effect.
In light of the problems with the traditional p-value approach and the misinterpretations of insignificant estimates, lessons from Kass and Raftery (1995) or Startz (2014) on how to calculate posterior odds and on determining the most likely hypothesis would be useful components to the teaching on any statistical testing. Unfortunately, these often introduce an inconvenient vagueness in properly interpreting a hypothesis test. However, it is the proper approach to interpreting statistical tests. In addition, introducing the Bayesian critique should give the important lesson that strong conclusions on an empirical relationship should require quite high levels of significance.
Another important consideration for hypothesis tests would be the costs (loss) from a wrong conclusion. Therefore, such costs should be considered when determining the optimal significance level for the hypothesis test (Kim and Ji 2015; Kim 2020). Adjustments to the optimal significance level should be made for quite large samples. In addition, there should be some discussion on statistical significance for a meaningful effect size (rather than using zero as a baseline effect).
In the end, perhaps the post-(p < 0.05) world should be one without hypothesis tests. Even the correct conclusions of “fail to reject” and “reject” (and not including “accept”) come across as more conclusive than they actually are. And, they do not account for the potential biases and the practicality of the estimated relationship.
F. Advocate less complexity
The current go-to model for the Department of Defense (DoD) for evaluating the effects of various manpower policies (including bonuses) on retention is the Dynamic Retention Model (DRM). This is a complex model that only relatively recently has become able to be estimated, given the huge computing power it requires. Even though I had a (very) minor role in an application of it, I do not have a strong understanding of the model. And, my educated speculation is that no one at DoD funding such studies understands the model neither.
However, I do understand the model enough to know that the DRM is deficient in many ways, as described in Arkes et al. (2019). In retention models, the DRM estimates complex concepts, such as the discount rate and a taste-for-military parameter. However, it fails to control for basic factors that could partly address the reverse causality for bonuses I describe above, such as military occupation, fiscal year, and their interactions (Arkes 2018). Furthermore, the DRM will never be able to address the other problems noted above of measurement error and excess supply, as we only observe whether a person reenlists, not their willingness to reenlist. Thus, the DRM will probably not give a more reliable answer than the simpler and more-direct models. And, in my view, guesses from subject-matter-experts would be more reliable than what any model would tell us.
These empirical challenges are probably not well known to DoD officials. Therefore, they appear to be enamored by the complexity of the model. Some may put more faith in complex models. However, the simpler models are often more credible, as they rely on fewer assumptions.
One lesson may come from the history of instrumental-variables models. Early studies tended to not pay much attention to the validity of the instruments. For example, Sims (2010) noted that Ehrlich’s (1975) research on capital punishment lacked any discussion on the validity of the numerous instruments that were used, such as lagged endogenous variables. Later studies (e.g., Bound et al. 1995) noted the major problems with instrumental variables if assumptions were violated. This is an example of how the problems with complex models come out as people start understanding them better.
G. Add a simple ethical component
We conduct research to help inform society on the best public policies, health behaviors, business practices, and more. What we hope to see in others’ research is the product of the optimal model they can develop, not the product of their efforts to find statistical significance. This means that our goal in conducting research should not be to find statistical significance, but rather to develop the best model to answer a research question and to give a responsible assessment of that model.
I recommend a few basic lessons in ethics (or good research practices). The first one would stress honesty in research and would give examples of when or how people might not be honest, such as with p-hacking. This could include some efforts to detect p-hacking, as described in Christensen and Miguel (2018). The second lesson would be the simple concept that “significance is not the goal of research”. This is obvious to my students when they hear it (after they have taken other statistics and econometrics classes), but it is new to them and proves to be a valuable lesson. One student said, in an end-of-term reflection paper, that she had an insignificant estimate on her treatment variable in her thesis. She had the temptation to change the model to find significance, but she resisted that temptation based on this simple lesson that significance is not the goal. Other students, before hearing this lesson, tell me that something must be wrong with their model because their main coefficient estimate was insignificant. A simple statement on the order of “insignificant estimates are okay” might help change the culture. The third lesson in ethics would be on the importance of making responsible conclusions. This should involve being completely forthright about all potential pitfalls and biases to the coefficient estimates that could not be addressed and being careful with the conclusions on significance based on the Bayesian critique of p-values. This is important for society to properly synthesize the meaning and conclusions that can be drawn from a study. Overall, having textbooks incorporate lessons on the ethics of research might be a good step towards contributing to more honest research.
These lessons may also benefit from what Baicker et al. (2013) did for the study on how an expansion of Medicaid in Oregon affected health outcomes. They developed their model and published the research plan before implementing it. New resources, such as from the Center for Open Science, are promoting the online posting of research plans3.
5. Implications for Undergraduate Econometrics
It follows logically that if my argument is correct that graduate econometrics training needs to be changed as I suggest, so too does undergraduate econometrics. Here is an equation from the textbook assigned in the undergraduate econometrics class I took many years ago, which remains in the current edition:
It makes me wonder what would be a more efficient use of students’ time: deciphering equations such as this or learning how to recognize biases.
One colleague said to me as I was writing my textbook, “Undergraduate econometrics is taught as if everyone will go on to a Ph.D. Economics program.”I would take that statement further and argue that undergraduate econometrics is generally taught as if everyone will become an econometric theorist. However, few will.
To highlight how misguided it might be to use a high-level math approach rather than a more practical approach, consider these numbers. There are about 26,500 undergraduate economics majors per year (Stock 2017). And, according to the American Economic Association, there are about 1000 new Economics Ph.D.’s each year4. I will guess that no more than 10% of those Ph.D.’s become econometric theorists. There are also some Economics Ph.D. students who may not have had undergraduate econometrics. Therefore, less than 4% of undergraduate econometrics students end up receiving an Economics Ph.D., and easily less than 1% of them end up becoming econometric theorists.
Just as with graduate econometrics, I would agree with the first two of Angrist and Pischke’s (2017) recommended changes to undergraduate econometrics:
- replace the math with examples, which is a basic tenet of fostering student motivation (Ambrose et al. 2010)
- increase the emphasis on choosing the correct set of control variables.
However, I would argue that there is even less justification (than for graduate econometrics) for their third point (increase emphasis on RCT and quasi-experimental methods), at least for most quasi-experimental methods that have limited opportunities to be applied. More so than graduate students, few undergraduate econometric students will become academics, and so few will have the opportunity to search for randomness, valid instrumental variables, or discontinuities. Rather, they will mostly have to make the best of non-random data. Therefore, lessons should focus on developing skills for dealing with such data, understanding what the potential sources of bias are, figuring out how (if possible) to address the potential biases, and making responsible conclusions. These are the skills that will be needed for most people using regression analysis to try to solve problems. Learning how to conduct regression analysis without learning how to properly scrutinize a model and interpret results (in terms of causality and significance) has the potential to do more harm than good.
Table 2 is similar to Table 1, but it is for the top undergraduate textbooks, as used by Angrist and Pischke (2017), and with a few more I added. It shows, again, my estimate for the number of pages centered around a given topic. There is the same problem as with graduate textbooks that important concepts are not covered much or at all, while much space (and likely time in undergraduate classes) is devoted to concepts that are relatively minor for what would be useful to learn, in my view. Although the things that could cause bias in standard errors appear to have a large emphasis, there remains minimal coverage of things that could bias coefficient estimates. Furthermore, while those books that do discuss how to interpret an insignificant coefficient estimate do so correctly (albeit, briefly for each of them), it appears that only four of the eight books discuss it in the main discussion of hypothesis tests.
Table 2.
What the main undergraduate textbooks teach (number of pages on a given topic).
With a more practical approach, there can be useful lessons that would actually be applicable for most of the undergraduate econometrics students. I grant that not all undergraduate econometrics students will have a job using econometrics. However, perhaps the greater skill they should come away with is the ability to recognize sources of bias. This could help them understand why correlation could but does not always mean causation. It could help them understand other important statistical concepts such as omitted-variables bias and Type I errors, both of which have applications to many workplace situations. Learning about biases could help engender a healthy skepticism in the statistics and research they hear about every day. And, these are skills that could form the foundation for more efficient learning in graduate econometrics, for those who take that route.
6. Conclusions and Topics for Further Discussion
The goal we should have as econometrics instructors is to teach the skills that would encourage solid, honest, and responsible research that can help improve the world. Being able to have a voice for improving the world requires trust that what we produce is valid. Therefore, efforts in instruction should foster honesty, responsibility, and the skills and research practices that produce valid research.
This means that we need to assess what concepts and what methods of instruction are the most important for producing solid researchers. Based on this idea, I have made the case, building on Angrist and Pischke (2017), that we need to shift emphases.
The teaching of graduate (and undergraduate) econometrics needs to be revamped. As instructors, we need to think about what most students will be doing with their skills, what are the most practical lessons from econometrics, what potential problems are most likely to affect the validity of a study, and how do we produce ethical and responsible researchers.
Not everyone is going to be an academic with the freedom to search the world for random assignment and choose their own topics from the randomness they find. Rather, most students will become non-academic practitioners who will need to address important problems with data that do not have random assignment. Their task would be to recognize the potential sources of bias, design the optimal method to address the issue, choose the optimal set of control variables, recognize the remaining sources of bias that could not be addressed, and make responsible conclusions. Or, as consumers of research, they should have the tools to recognize biases, which can also apply to the everyday statistics they hear in the news or even properly assessing events by considering alternative stories that could explain why two variable move (or do not move) together. These are the things that econometrics courses should be aimed towards, both at the graduate and undergraduate levels.
Certainly, such shifts would impact certain fields in which there would be methods particular to that field, such as Macroeconomics. And, anyone studying econometric theory would need a new course on the high-level math underlying econometrics. However, such shifts would make sense to spend class and student-studying time more efficiently, avoiding spending time on field-specific methods or the high-level math for students who would never need such material. Furthermore, a class that spent more time giving examples that demonstrate the nuances of certain methods should help students better understand the mathematical theory behind the models.
Let me end by calling for a larger assessment of what skills Ph.D. economists need in their research. Would most Ph.D. students benefit from a shift in focus from the high-level math to something more practical? Should basic graduate econometrics be any different from undergraduate econometrics? For what I believe is a large share of Ph.D. economists, two good low-math undergraduate courses (that incorporate the changes I describe above), along with applied graduate courses and plenty of practice, should be sufficient to prepare them to become successful researchers. Based on my experiences at research organizations and in academia, I believe that these lessons would have been sufficient for most of my colleagues. The redesign and shifts that I have discussed, as I have argued in this article, would have helped me avoid most of my research mistakes.
Funding
This research received no external funding.
Acknowledgments
I would like to thank Thomas Ahn, Jiadi Chen, Judith Hermis, Ercio Munoz, Daniel Stone, and anonymous referees for their helpful comments.
Conflicts of Interest
The strategy for the teaching of econometrics that I espouse in this article is consistent with much of (although not all of) the teachings in my own textbook. There are ideas in this paper that go beyond what is in my textbook, and at least one idea that is inconsistent with my textbook. If this article were to lead to more book sales, there would be a very-minor financial benefit. That said, my views expressed here were based on: (1) my perspectives that shaped my textbook; and (2) other of my perspectives that have evolved since the publication of my textbook.
References
- Abadie, Alberto. 2020. Statistical Nonsignificance in Empirical Economics. American Economic Review: Insights 2: 193–208. [Google Scholar] [CrossRef] [Scilit]
- Aczel, Balazs, Bence Palfi, Aba Szollosi, Marton Kovacs, Barnabas Szaszi, Peter Szecsi, Mark Zrubka, Quentin F. Gronau, Don van den Bergh, and Eric-Jan Wagenmakers. 2018. Quantifying support for the null hypothesis in psychology: An empirical investigation. Advances in Methods and Practices in Psychological Science 1: 357–66. [Google Scholar] [CrossRef] [Scilit]
- Ambrose, Susan A., Michael W. Bridges, Michele DiPietro, Marsha C. Lovett, and Marie K. Norman. 2010. How Learning Works: Seven Research-Based Principles for Smart Teaching. Hoboken: John Wiley & Sons. [Google Scholar]
- Amrhein, Valentin, Sander Greenland, and Blake McShane. 2019. Scientists rise up against statistical significance. Nature 567: 305–7. [Google Scholar] [CrossRef] [Scilit] [PubMed]
- Angrist, Joshua D., and Jörn-Steffen Pischke. 2009. Mostly Harmless Econometrics: An Empiricist’s Companion. Princeton: Princeton University Press. [Google Scholar]
- Angrist, Joshua D., and Jörn-Steffen Pischke. 2010. The credibility revolution in empirical economics: How better research design is taking the con out of econometrics. Journal of Economic Perspectives 24: 3–30. [Google Scholar] [CrossRef] [Scilit]
- Angrist, Joshua D., and Jörn-Steffen Pischke. 2015. Mastering Metrics: The Path from Cause to Effect. Princeton: Princeton University Press. [Google Scholar]
- Angrist, Joshua D., and Jörn-Steffen Pischke. 2017. Undergraduate econometrics instruction: Through our classes, darkly. Journal of Economic Perspectives 31: 125–44. [Google Scholar] [CrossRef] [Scilit]
- Arkes, Jeremy. 2010. Revisiting the hot hand theory with free throw data in a multivariate framework. Journal of Quantitative Analysis in Sports 6. [Google Scholar] [CrossRef] [Scilit]
- Arkes, Jeremy. 2018. Empirical biases and some remedies in estimating the effects of selective reenlistment bonuses on reenlistment rates. Defence and Peace Economics 29: 475–502. [Google Scholar] [CrossRef] [Scilit]
- Arkes, Jeremy. 2019. Regression Analysis: A Practical Introduction. Oxford: Routledge. [Google Scholar]
- Arkes, Jeremy, Thomas Ahn, Amilcar Menichini, and William Gates. 2019. Retention Analysis Model (RAM) for Navy Manpower Analysis. Report NPS-GSBPP-19-003. Monterey: Naval Postgraduate School. [Google Scholar]
- Baicker, Katherine, Sarah L. Taubman, Heidi L. Allen, Mira Bernstein, Jonathan H. Gruber, Joseph P. Newhouse, Eric C. Schneider, Bill J. Wright, Alan M. Zaslavsky, and Amy N. Finkelstein. 2013. The Oregon experiment—effects of Medicaid on clinical outcomes. New England Journal of Medicine 368: 1713–22. [Google Scholar] [CrossRef] [Scilit]
- Baltagi, Badi H. 2011. Econometrics, 3rd ed. Heildelberg: Springer. [Google Scholar]
- Bania, Neil, Jo Anna Gray, and Joe A. Stone. 2007. Growth, Taxes, and Government Expenditures: Growth Hills for U.S. States. National Tax Journal 60: 193–204. [Google Scholar] [CrossRef] [Scilit]
- Bar-Eli, Michael, Simcha Avugos, and Markus Raab. 2006. Twenty years of “hot hand” research: Review and critique. Psychology of Sport and Exercise 7: 525–53. [Google Scholar] [CrossRef] [Scilit]
- Bartik, Timothy J. 1991. Who Benefits from State and Local Economic Development Policies? Kalamazoo: W.E. Upjohn Institute for Employment Research. [Google Scholar]
- Bocskocsky, Andrew, John Ezekowitz, and Carolyn Stein. 2014. The hot hand: A new approach to an old ‘fallacy’. Paper presented at 8th Annual MIT Sloan Sports Analytics Conference, Boston, MA, USA, 28 February 2014–1 March 2014; pp. 1–10. [Google Scholar]
- Bound, John, David A. Jaeger, and Regina M. Baker. 1995. Problems with instrumental variables estimation when the correlation between the instruments and the endogenous explanatory variable is weak. Journal of the American Statistical Association 90: 443–50. [Google Scholar] [CrossRef] [Scilit]
- Brooks, David. 2013. The Philosophy of Data. New York Times. February 4. Available online: http://www.nytimes.com/2013/02/05/opinion/brooks-the-philosophy-of-data.html (accessed on 6 November 2015).
- Christensen, Garret, and Edward Miguel. 2018. Transparency, Reproducibility, and the Credibility of Economics Research. Journal of Economic Literature 56: 920–80. [Google Scholar] [CrossRef] [Scilit]
- Cready, William M., Bo Liu, and Di Wang. 2019. A Content Based Assessment of the Relative Quality of Leading Accounting Journals. Available online: https://papers.ssrn.com/sol3/papers.cfm?abstract_id=3438405 (accessed on 4 September 2020).
- Cunningham, Scott. 2018. Causal Inference: The MIX Tape (v. 1.7). Available online: tufte-latex.googlecode.com (accessed on 4 September 2020).
- Dougherty, Christopher. 2016. Introduction to Econometrics. New York: Oxford University Press. [Google Scholar]
- Ehrlich, Isaac. 1975. The deterrent effect of capital punishment: A question of life and death. American Economic Review 65: 397–417. [Google Scholar]
- Ettinger, Bruce, Gary D. Friedman, Trudy Bush, and Charles P. Quesenberry, Jr. 1996. Reduced mortality associated with long-term postmenopausal estrogen therapy. Obstetrics & Gynecology 87: 6–12. [Google Scholar]
- Funderburg, Richard, Timothy J. Bartik, Alan H. Peters, and Peter S. Fisher. 2013. The impact of marginal business taxes on state manufacturing. Journal of Regional Science 53: 557–82. [Google Scholar] [CrossRef] [Scilit]
- Gertler, Paul. 2004. Do conditional cash transfers improve child health? Evidence from PROGRESA’s control randomized experiment. American Economic Review 94: 336–41. [Google Scholar] [CrossRef] [Scilit]
- Gibbons, Charles E., Juan Carlos Suárez Serrato, and Michael B. Urbancic. 2018. Broken or fixed effects? Journal of Econometric Methods 8. [Google Scholar] [CrossRef] [Scilit]
- Gigerenzer, Gerd. 2004. Mindless statistics. The Journal of Socio-Economics 33: 587–606. [Google Scholar] [CrossRef] [Scilit]
- Gill, D. 2018. Why It’s so Hard to Study the Impact of Minimum Wage Increases. Available online: https://qz.com/work/1415401/why-minimum-wage-research-is-full-of-conflicting-studies/ (accessed on 11 June 2020).
- Gilovich, Thomas, Robert Vallone, and Amos Tversky. 1985. The hot hand in basketball: On the misperception of random sequences. Cognitive Psychology 17: 295–314. [Google Scholar] [CrossRef] [Scilit]
- Goldberg, Matthew S. 2001. A Survey of Enlisted Retention: Models and Findings. Report # CRM D0004085.A2. Alexandria: Center for Naval Analyses. [Google Scholar]
- Goldberger, Arthur Stanley. 1991. A Course in Econometrics. Harvard: Harvard University Press. [Google Scholar]
- Gould, Stephen Jay. 1989. The streak of streaks. Chance 2: 10–16. [Google Scholar] [CrossRef] [Scilit]
- Greene, W. 2012. Econometric Analysis, 7th ed. Upper Saddle River: Prentice Hall. [Google Scholar]
- Gujarati, Damodar N., and D. Porter. 2009. Basic Econometrics. New York: McGraw-Hill. [Google Scholar]
- Hansen, Michael L., and Jennie W. Wenger. 2005. Is the pay responsiveness of enlisted personnel decreasing? Defence and Peace Economics 16: 29–43. [Google Scholar] [CrossRef] [Scilit]
- Harford, Tim. 2014. Big data: A big mistake? Significance 11: 14–19. [Google Scholar] [CrossRef] [Scilit]
- Hayashi, Fumio. 2000. Econometrics. Princeton: Princeton University Press. [Google Scholar]
- Head, Megan L., Luke Holman, Rob Lanfear, Andrew T. Kahn, and Michael D. Jennions. 2015. The extent and consequences of p-hacking in science. PLoS Biology 13: e1002106. [Google Scholar] [CrossRef] [Scilit] [PubMed]
- Ioannidis, John P. A. 2005. Why Most Published Research Findings Are False. PLoS Medicine 2: e124. [Google Scholar] [CrossRef] [Scilit]
- Kahneman, Daniel. 2011. Thinking Fast and Slow. New York: Farrar, Straus and Giroux. [Google Scholar]
- Kass, Robert E., and Adrian E. Raftery. 1995. Bayes factors. Journal of the American Statistical Association 90: 773–95. [Google Scholar] [CrossRef]
- Kennedy, Peter. 2008. A Guide to Econometrics, 6th ed. Hoboken: Wiley-Blackwell. [Google Scholar]
- Kim, Jae H. 2020. Decision-theoretic hypothesis testing: A primer with R package OptSig. The American Statistician. in press. [Google Scholar] [CrossRef] [Scilit]
- Kim, Jae H., and Philip Inyeob Ji. 2015. Significance testing in empirical finance: A critical review and assessment. Journal of Empirical Finance 3: 1–14. [Google Scholar] [CrossRef] [Scilit]
- Kling, Jeffrey R., Jeffrey B. Liebman, and Lawrence F. Katz. 2007. Experimental analysis of neighborhood effects. Econometrica 75: 83–119. [Google Scholar] [CrossRef] [Scilit]
- Leamer, Edward E. 1983. Let’s take the con out of econometrics. Modelling Economic Series 73: 31–43. [Google Scholar]
- Leamer, Edward E. 1988. 3 Things that bother me. Economic Record 64: 331–35. [Google Scholar] [CrossRef] [Scilit]
- Manson, JoAnn E., Aaron K. Aragaki, Jacques E. Rossouw, Garnet L. Anderson, Ross L. Prentice, Andrea Z. LaCroix, Rowan T. Chlebowski, Barbara V. Howard, Cynthia A. Thomson, Karen L. Margolis, and et al. 2017. Menopausal Hormone Therapy and Long-term All-Cause and Cause-Specific Mortality: The Women’s Health Initiative Randomized Trials. Journal of the American Medical Association 318: 927–38. [Google Scholar] [CrossRef] [Scilit]
- Miller, Joshua B., and Adam Sanjurjo. 2018. Surprised by the hot hand fallacy? A truth in the law of small numbers. Econometrica 86: 2019–47. [Google Scholar] [CrossRef] [Scilit]
- Mofidi, Alaeddin, and Joe A. Stone. 1990. Do state and local taxes affect economic growth? The Review of Economics and Statistics 72: 686–91. [Google Scholar] [CrossRef] [Scilit]
- Nuzzo, Regina. 2014. Statistical errors. Nature 506: 150–52. [Google Scholar] [CrossRef] [Scilit] [PubMed]
- Paolella, Marc S. 2018. Fundamental Statistical Inference: A Computational Approach. Hoboken: John Wiley & Sons, vol. 216. [Google Scholar]
- Pearl, Judea, and Dana Mackenzie. 2018. The Book of Why: The New Science of Cause and Effect. New York: Basic Books. [Google Scholar]
- Petersen, Mitchell A. 2009. Estimating standard errors in finance panel data sets: Comparing approaches. The Review of Financial Studies 22: 435–80. [Google Scholar] [CrossRef] [Scilit]
- Poulson, Barry W., and Jules Gordon Kaplan. 2008. State Income Taxes and Economic Growth. Cato Journal 28: 53–71. [Google Scholar]
- Reed, W. Robert. 2008. The robust relationship between taxes and US state income growth. National Tax Journal 61: 57–80. [Google Scholar] [CrossRef] [Scilit]
- Rossouw, Jacques E., Garnet L. Anderson, Ross L. Prentice, Andrea Z. LaCroix, Charles Kooperberg, Marcia L. Stefanick, Rebecca D. Jackson, Shirley A. A. Beresford, Barbara V. Howard, Karen C. Johnson, and et al. 2002. Risks and benefits of estrogen plus progestin in healthy postmenopausal women: Principal results from the Women’s Health Initiative randomized controlled trial. JAMA 288: 321–33. [Google Scholar]
- Russell, Davidson, and James G. MacKinnon. 2004. Econometric Theory and Methods. New York: Oxford University Press. [Google Scholar]
- Sims, Christopher A. 2010. But economics is not an experimental science. Journal of Economic Perspectives 24: 59–68. [Google Scholar] [CrossRef] [Scilit]
- Startz, Richard. 2014. Choosing the More Likely Hypothesis. Foundations and Trends in Econometrics 7: 119–89. [Google Scholar] [CrossRef] [Scilit]
- Stock, Wendy A. 2017. Trends in economics and other undergraduate majors. American Economic Review 107: 644–49. [Google Scholar] [CrossRef] [Scilit]
- Stock, James H., and Mark W. Watson. 2018. Introduction to Econometrics, 4th ed. London: Pearson. [Google Scholar]
- Stone, Daniel F. 2012. Measurement error and the hot hand. The American Statistician 66: 61–66. [Google Scholar] [CrossRef] [Scilit]
- Studenmund, A. H. 2010. Using Econometrics: A Practical Guide. London: Pearson Education. [Google Scholar]
- Thaler, Richard H., and Cass R. Sunstein. 2009. Nudge: Improving Decisions about Health, Wealth, and Happiness. New York: Penguin. [Google Scholar]
- Wasserstein, Ronald L., and Nicole A. Lazar. 2016. The ASA statement on p-values: Context, process, and purpose. The American Statistician 70: 129–33. [Google Scholar] [CrossRef] [Scilit]
- Wasserstein, Ronald L., Allen L. Schirm, and Nicole A. Lazar. 2019. Moving to a world beyond “p <0.05”. The American Statistician 73: 1–19. [Google Scholar]
- Wasylenko, Michael, and Therese McGuire. 1985. Jobs and taxes: The effect of business climate on states’ employment growth rates. National Tax Journal 38: 497–511. [Google Scholar]
- Wooldridge, Jeffrey M. 2012. Econometric Analysis of Cross Section and Panel Data. Cambridge: MIT Press. [Google Scholar]
- Wooldridge, Jeffrey M. 2015. Introductory Econometrics: A Modern Approach. Toronto: Nelson Education. [Google Scholar]
- Yeoh, Melissa, and Dean Stansel. 2013. Is Public Expenditure Productive: Evidence from the Manufacturing Sector in US Cities, 1880–1920. Cato Journal 33: 1. [Google Scholar]
| 1 | See https://www.youtube.com/watch?v=BNHjX_08FE0. One extra 3-pointer he made came after a referee whistle, so he was actually (but not officially) 10 of 10. This performance harkens back to a game in which Boston Celtic Larry Bird hit every low-probability shot he put up, as he racked up 60 points against the Atlanta Hawks in 1985—https://www.youtube.com/watch?v=yX61Aurz3VM. (The best part of the video is the reaction by the Hawks’ bench to some of Bird’s last shots—those opponents knew Bird had the “hot hand”). |
| 2 | The new source of bias on improper reference groups is available under the “eResources” tab at https://www.routledge.com/Regression-Analysis-A-Practical-Introduction-1st-Edition/Arkes/p/book/9781138541405 or at https://tinyurl.com/yytmnq65. |
| 3 | |
| 4 |
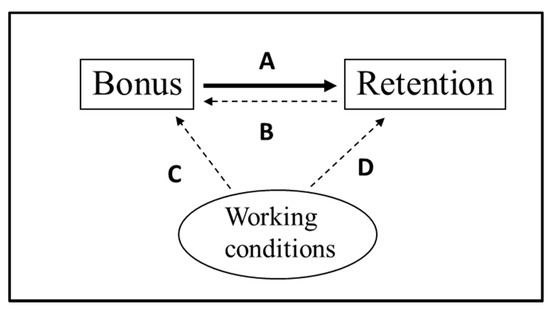
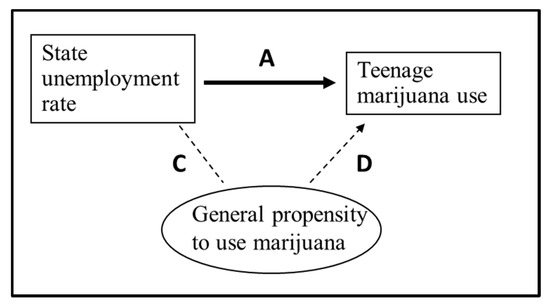

© 2020 by the author. Licensee MDPI, Basel, Switzerland. This article is an open access article distributed under the terms and conditions of the Creative Commons Attribution (CC BY) license (http://creativecommons.org/licenses/by/4.0/).