Volatility Analysis of Returns of Financial Assets Using a Bayesian Time-Varying Realized GARCH-Itô Model
Abstract
1. Introduction
2. Realized GARCH-Itô Model
3. Bayesian Time-Varying GARCH-Itô Model
4. Simulation Study
4.1. Data Generation Process
4.2. Simulation Results
5. Empirical Study
6. Conclusions
Supplementary Materials
Author Contributions
Funding
Data Availability Statement
Acknowledgments
Conflicts of Interest
Appendix A


Appendix B. Theorems and Proofs
- (i)
- The true parameter values () lie in the support of the prior ;
- (ii)
- The likelihood is continuous in (;
- (iii)
- The parameter space is compact via logit transform and ;
- (iv)
- The model is identifiable (Theorem A3).
References
- Andersen, T. G., & Bollerslev, T. (1997). Intraday periodicity and volatility persistence in financial markets. Journal of Empirical Finance, 4, 115–158. [Google Scholar] [CrossRef]
- Andersen, T. G., Bollerslev, T., & Diebold, F. X. (2007). Roughing it up: Including jump components in the measurement, modeling, and forecasting of return volatility. The Review of Economics and Statistics, 89(4), 701–720. [Google Scholar] [CrossRef]
- Andersen, T. G., Thyrsgaard, M., & Todorov, V. (2019). Time-varying periodicity in intraday volatility. Journal of the American Statistical Association, 114(528), 1695–1707. [Google Scholar] [CrossRef]
- Barndorff-Nielsen, O. E., Hansen, P. R., Lunde, A., & Shephard, N. (2008). Designing realized kernels to measure ex-post variation of equity prices in the presence of noise. Econometrica, 76(6), 1481–1536. [Google Scholar] [CrossRef]
- Barndorff-Nielsen, O. E., & Shephard, N. (2004). Power and bipower variation with stochastic volatility and jumps. Journal of Financial Econometrics, 2(1), 1–37. [Google Scholar] [CrossRef]
- Bollerslev, T. (1986). Generalized autoregressive conditional heteroskedasticity. Journal of Econometrics, 31(3), 307–327. [Google Scholar] [CrossRef]
- Carr, P., & Wu, L. (2003). What type of process underlies options? A simple robust test. The Journal of Finance, 58(6), 2581–2610. [Google Scholar] [CrossRef]
- Engle, R. F. (1982). Autoregressive conditional heteroscedasticity with estimates of the variance of United Kingdom inflation. Econometrica, 50(4), 987–1007. Available online: https://www.jstor.org/stable/1912773 (accessed on 20 May 2025). [CrossRef]
- Engle, R. F., & Gallo, G. M. (2006). A multiple indicators model for volatility using intra-daily data. Journal of Econometrics, 131, 3–27. [Google Scholar] [CrossRef]
- Fan, J., & Wang, Y. (2007). Multi-scale jump and volatility analysis for high-frequency financial data. Available online: https://papers.ssrn.com/sol3/papers.cfm?abstract_id=957607 (accessed on 20 May 2025).
- Gao, J., Peng, B., Wu, W. B., & Yan, Y. (2024). Time-varying multivariate causal processes. Journal of Econometrics, 240, 105671. [Google Scholar] [CrossRef]
- Ghosal, S., Ghosh, J. K., & van der Vaart, A. W. (2000). Convergence rates of posterior distributions. Annals of Statistics, 28(2), 500–531. [Google Scholar] [CrossRef]
- Huang, X., & Tauchen, G. T. (2005). The relative contribution of jumps to total price variance. Journal of Financial Econometrics, 3(4), 456–499. [Google Scholar] [CrossRef]
- Jacquier, E., Polson, N. G., & Rossi, P. E. (2004). Bayesian analysis of stochastic volatility models with fat-tails and correlated errors. Journal of Econometrics, 122(1), 185–212. [Google Scholar] [CrossRef]
- Kalli, M., & Griffin, J. E. (2014). Time-varying sparsity in dynamic regression models. Journal of Econometrics, 178(2), 779–793. [Google Scholar] [CrossRef]
- Kim, D., & Wang, Y. (2016). Unied discrete-time and continuous-time models and statistical inferences for merged low-frequency and high-frequency financial data. Journal of Econometrics, 194(2), 220–230. [Google Scholar] [CrossRef]
- Koop, G., & Korobilis, D. (2022). Bayesian dynamic variable selection in high dimensions. International Economic Review, 64(3), 1047–1074. [Google Scholar] [CrossRef]
- Opschoor, A., & Lucas, A. (2023). Time-Varying variance and skewness in realized volatility measures. International Journal of Forecasting, 39, 827–840. [Google Scholar] [CrossRef]
- Song, X., Kim, D., Yuan, H., Cui, X., Lu, Z., Zhou, Y., & Wang, Y. (2020). Volatility analysis with realized GARCH-Ito models. Journal of Econometrics, 222(1), 393–410. [Google Scholar] [CrossRef]
- Taspinar, S., DoGan, O., Chae, J., & Bera, A. K. (2021). Bayesian inference in spatial stochastic volatility models: An application to house price returns in Chicago. Oxford Bulletin of Economics and Statistics, 83(5), 1243–1272. [Google Scholar] [CrossRef]
- Todorov, V. (2009). Estimation of continuous-time stochastic volatility models with jumps using high-frequency data. Journal of Econometrics, 148, 131–148. [Google Scholar] [CrossRef]


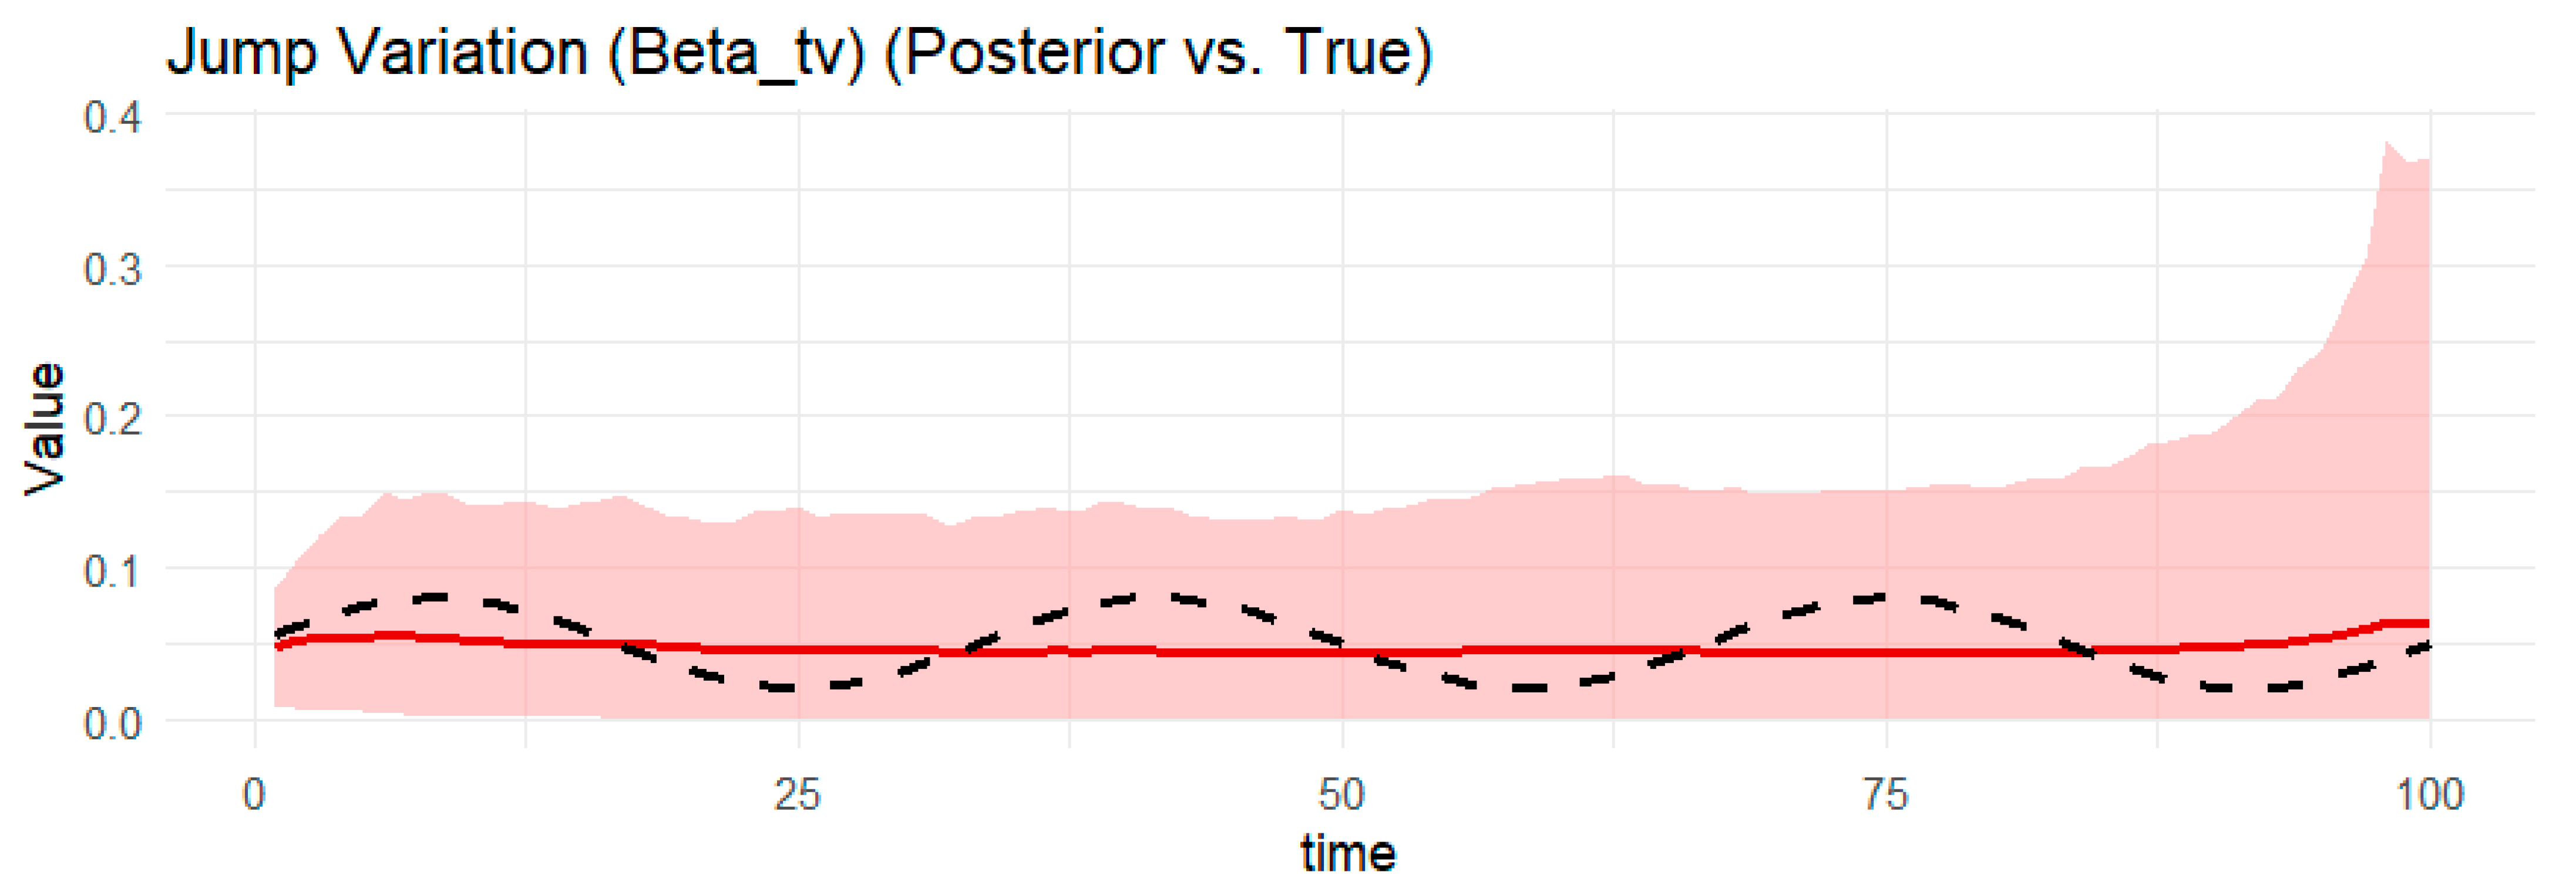
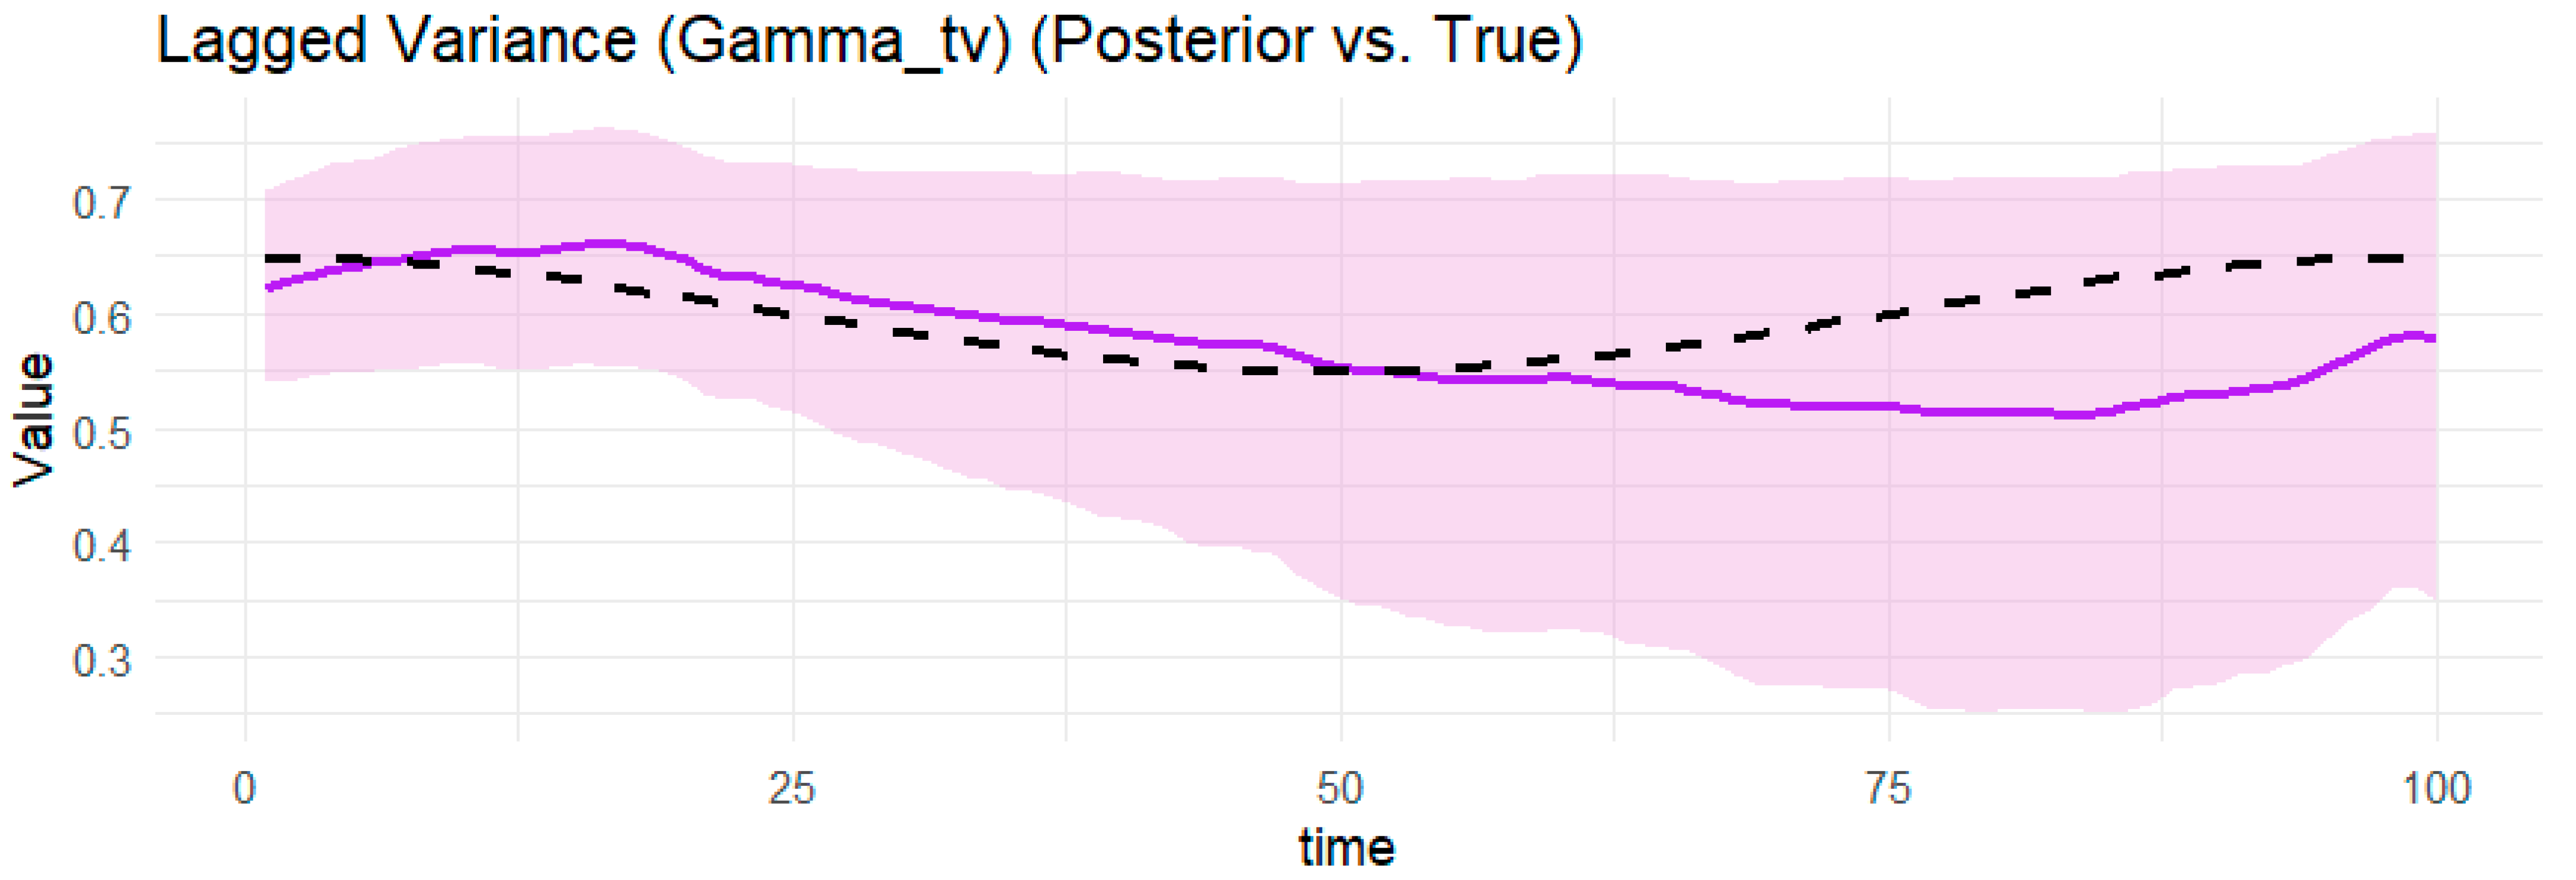
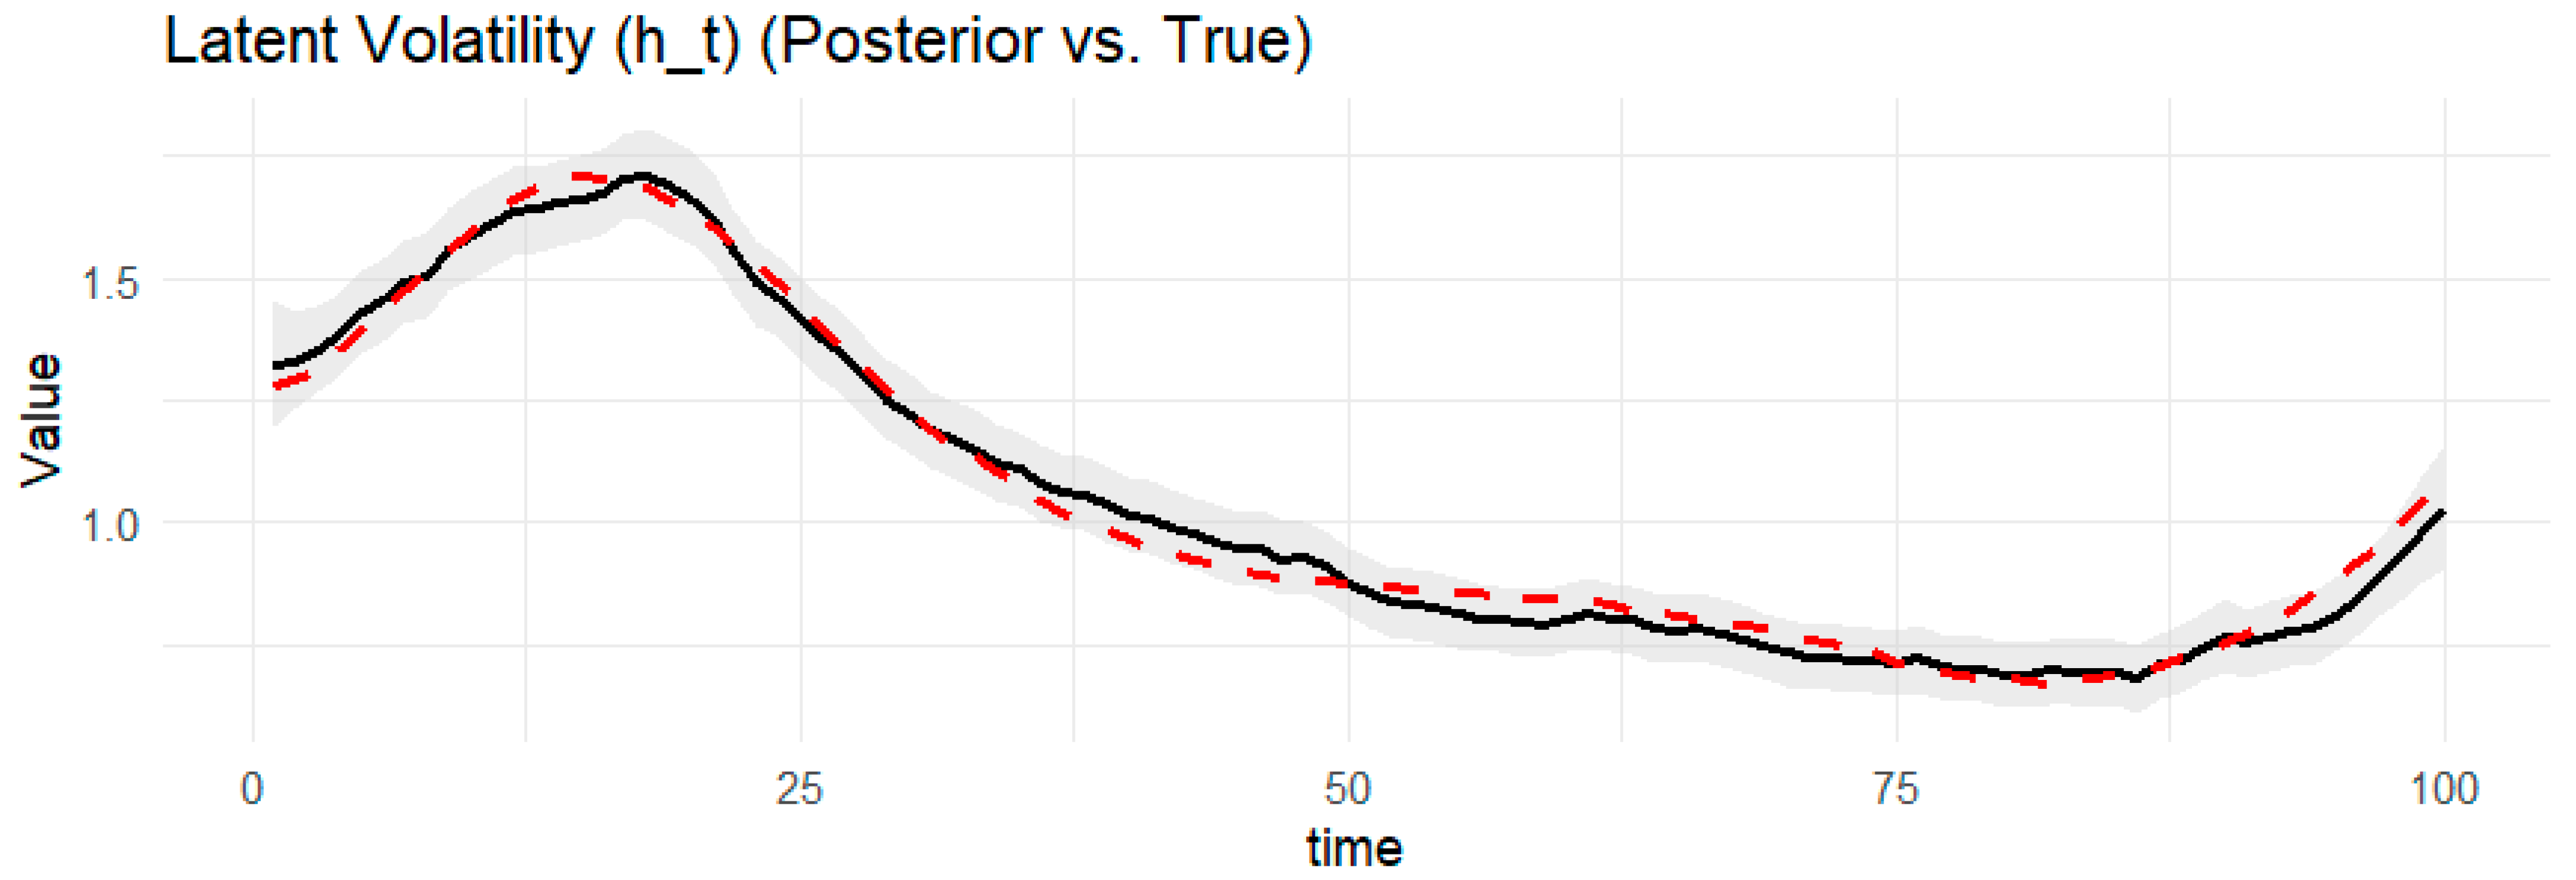



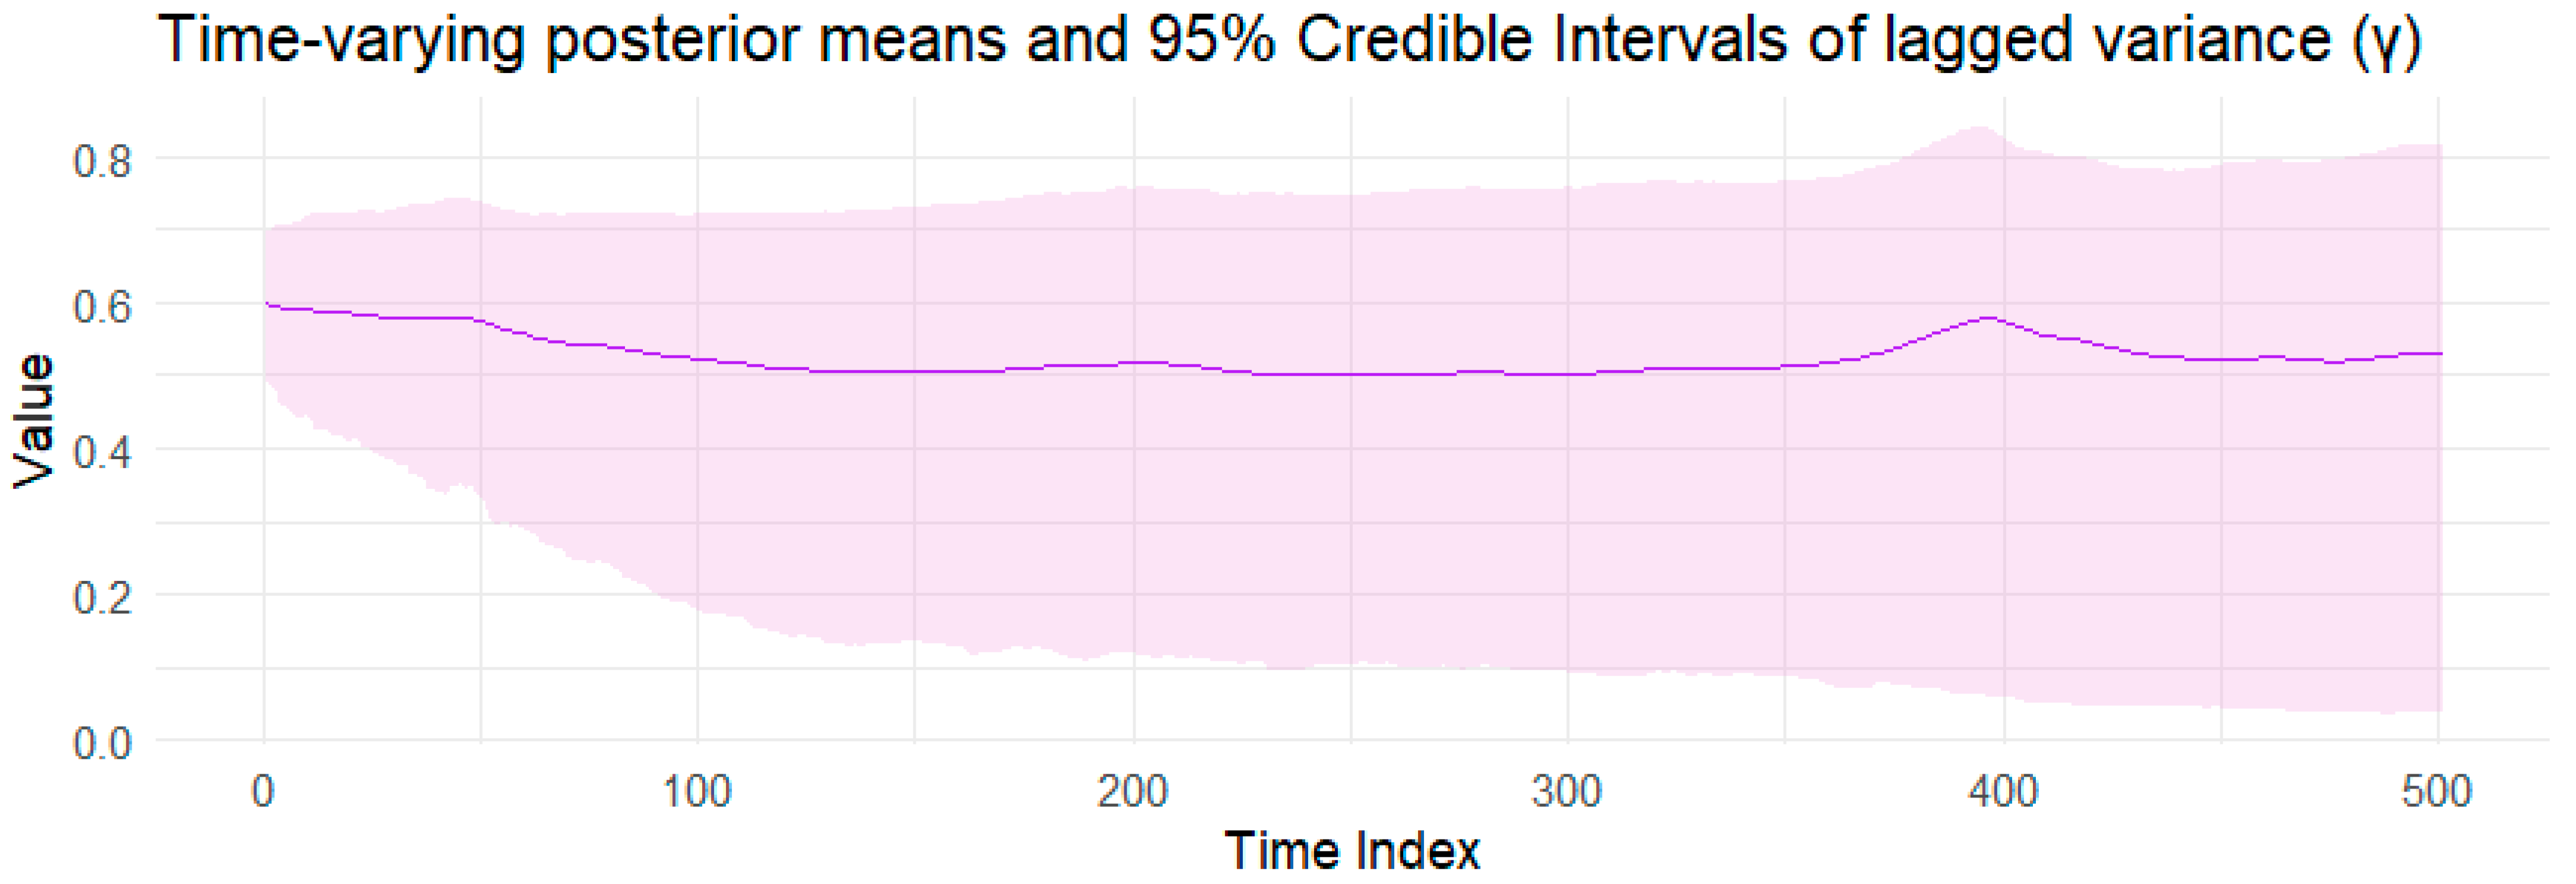


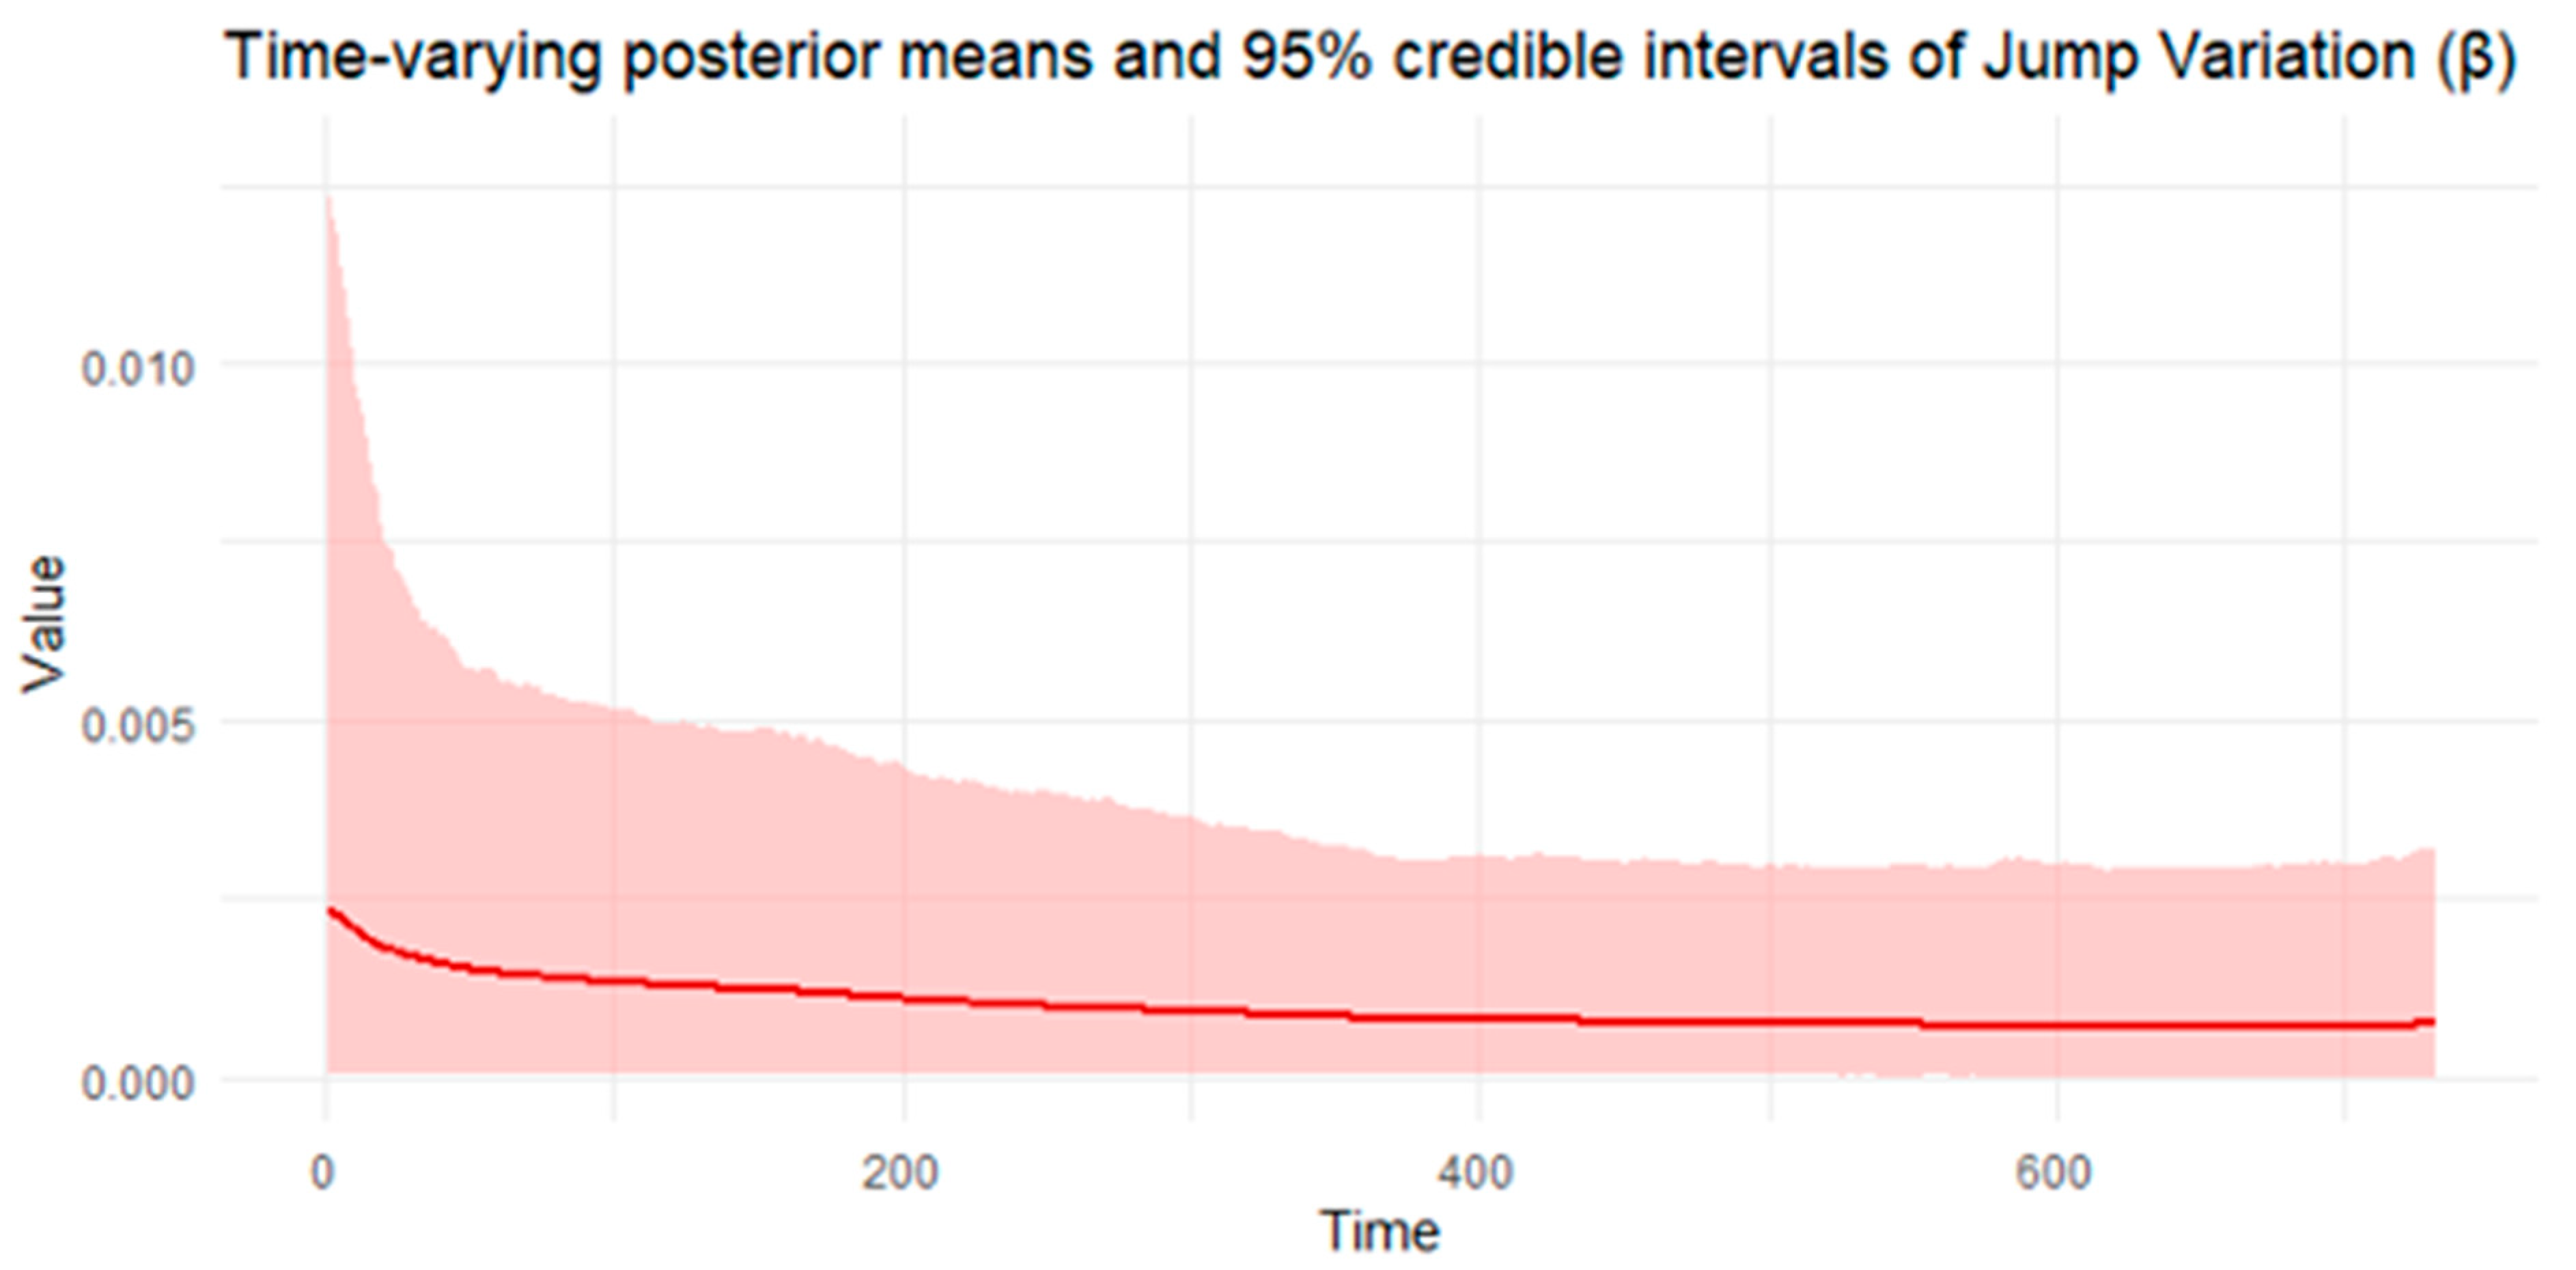
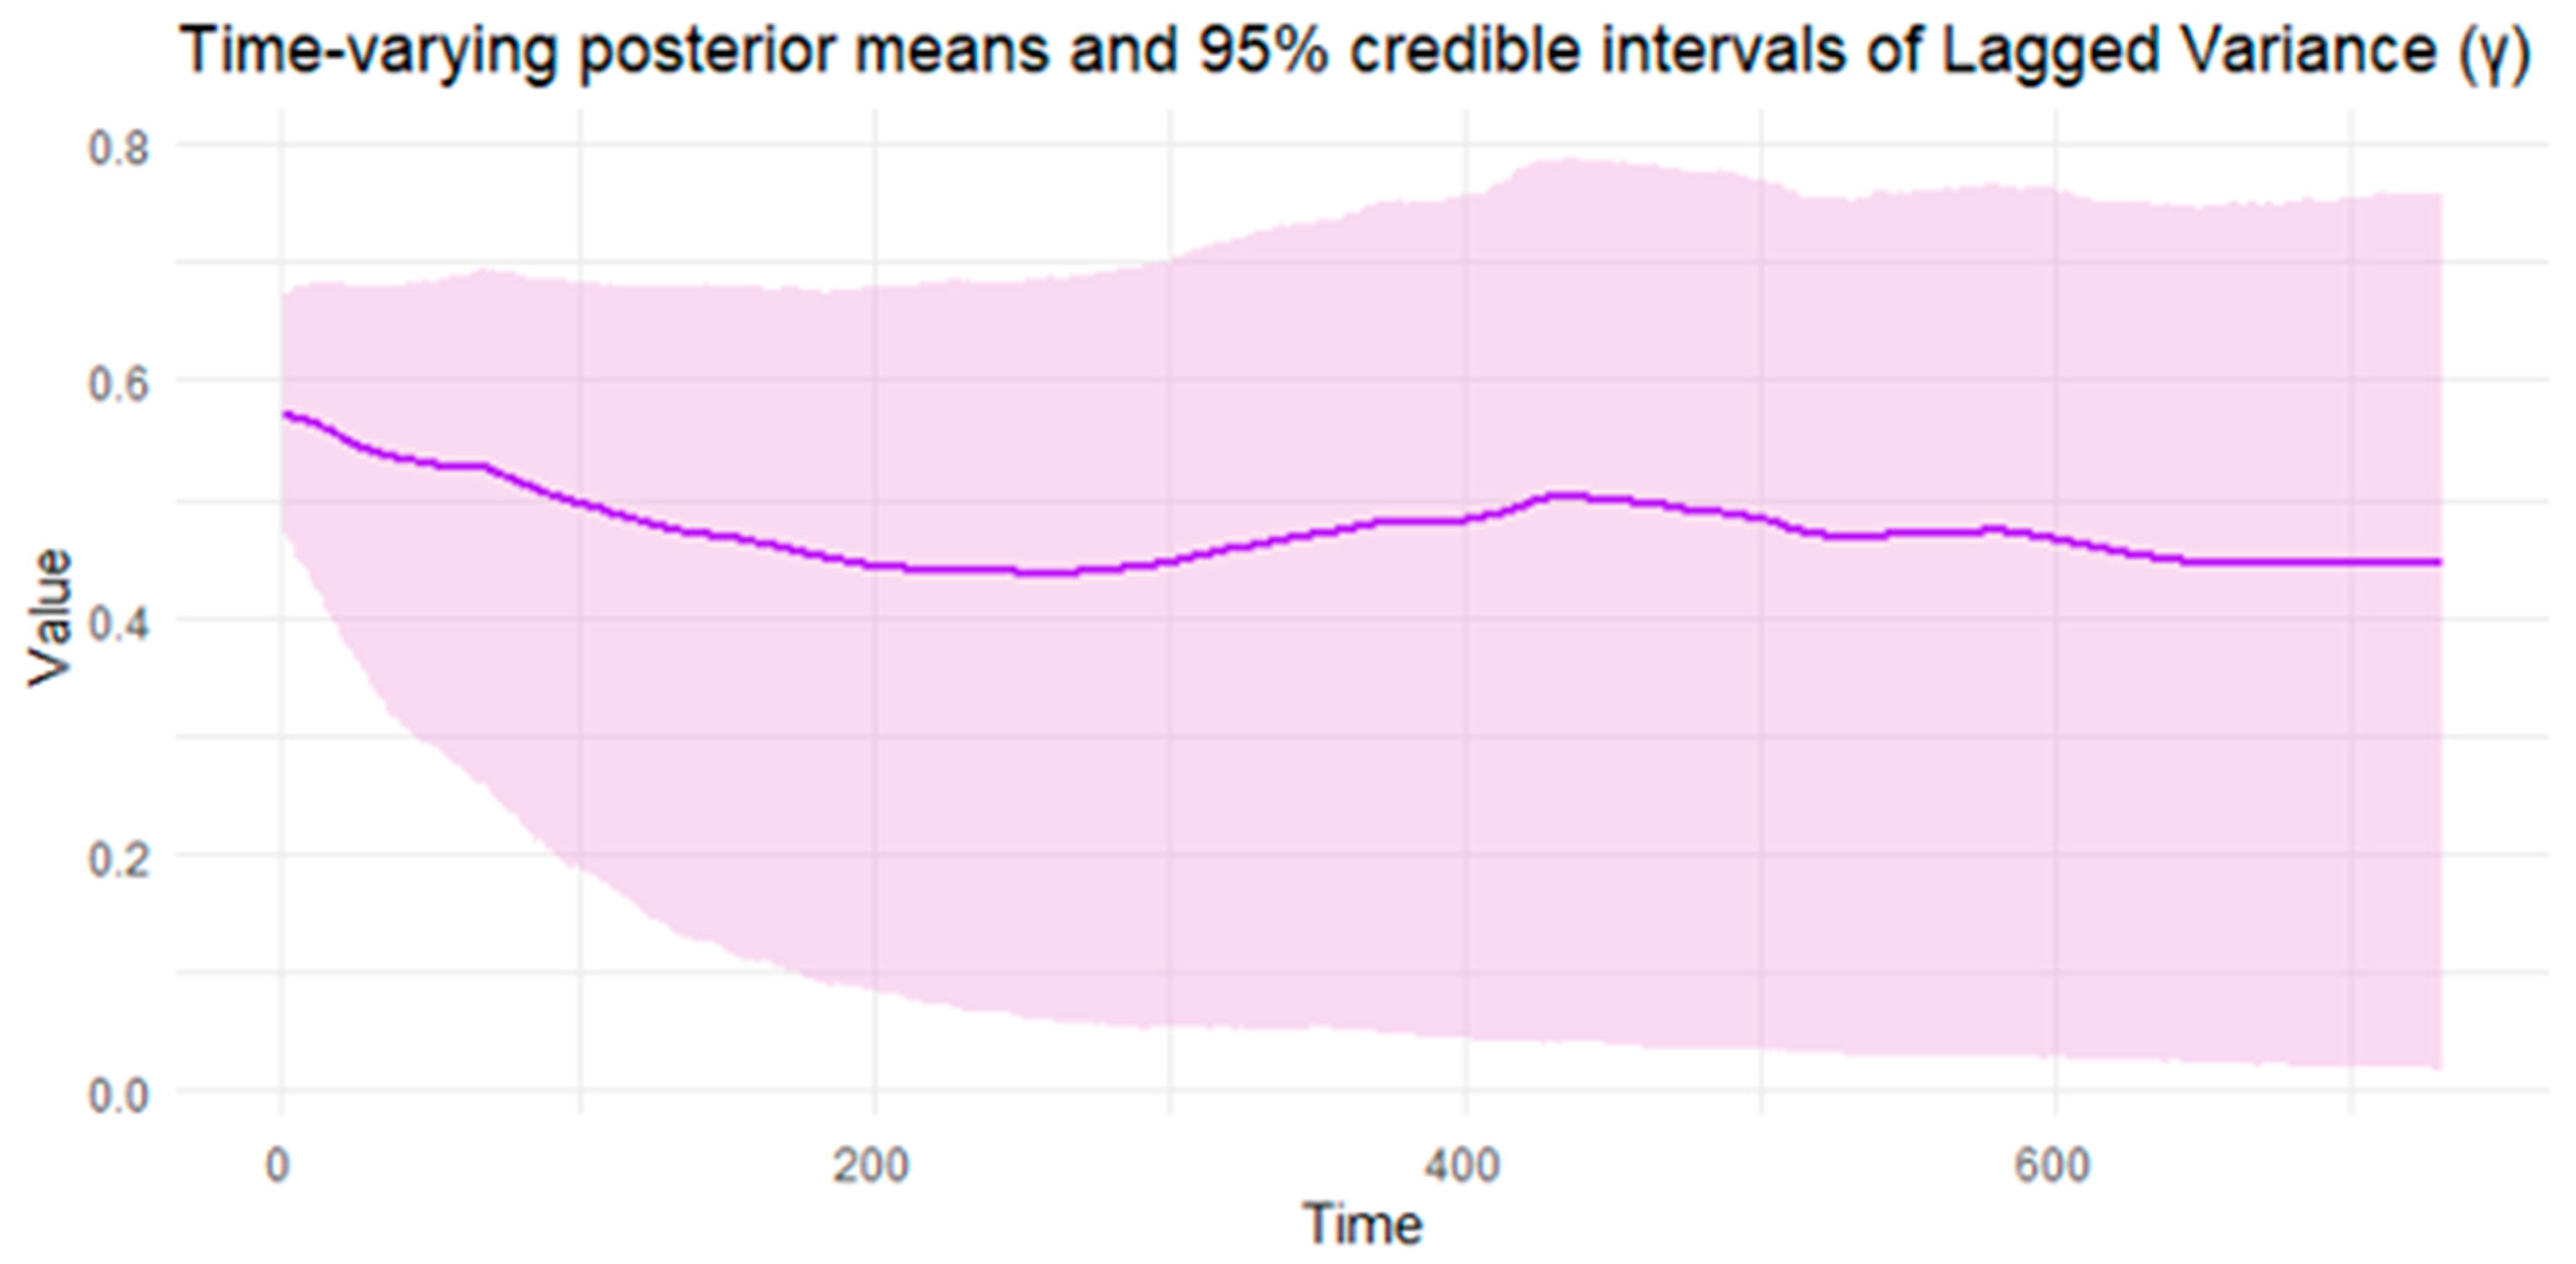

| Data | Parameter | Mean | Std. Dev. | q5 | q95 | Bulk-ESS | Tail-ESS | |
|---|---|---|---|---|---|---|---|---|
| −44.4 | 14.7 | −69 | −20.5 | 1.00 | 1608 | 2191 | ||
| 0.353 | 0.0667 | 0.243 | 0.462 | 1.00 | 2932 | 2605 | ||
| 0.106 | 0.0419 | 0.0375 | 0.177 | 1.00 | 2752 | 2037 | ||
| 0.0479 | 0.0197 | 0.0163 | 0.0805 | 1.00 | 3811 | 1606 | ||
| 0.622 | 0.0430 | 0.552 | 0.692 | 1.00 | 4132 | 2806 | ||
| N = 100 | 0.0517 | 0.0335 | 0.00449 | 0.111 | 1.01 | 872 | 1424 | |
| 0.100 | 0.154 | 0.00626 | 0.260 | 1.00 | 1538 | 1820 | ||
| 0.297 | 2.17 | 0.00662 | 0.754 | 1.00 | 3653 | 2416 | ||
| 0.0535 | 0.0328 | 0.00575 | 0.112 | 1.02 | 572 | 1300 | ||
| 0.0994 | 0.00823 | 0.0866 | 0.114 | 1.00 | 4589 | 2661 | ||
| −63.3 | 20.7 | −95.5 | −28.2 | 1.00 | 1737 | 2308 | ||
| 0.348 | 0.0651 | 0.238 | 0.452 | 1.00 | 1735 | 2117 | ||
| 0.0854 | 0.0394 | 0.0220 | 0.153 | 1.00 | 1478 | 1472 | ||
| 0.0492 | 0.0199 | 0.0164 | 0.0825 | 1.00 | 3298 | 1393 | ||
| 0.628 | 0.0448 | 0.556 | 0.703 | 1.00 | 2697 | 2556 | ||
| N = 200 | 0.0308 | 0.0189 | 0.00286 | 0.0639 | 1.00 | 533 | 1361 | |
| 0.0693 | 0.0652 | 0.00613 | 0.172 | 1.00 | 1904 | 2205 | ||
| 0.166 | 0.591 | 0.00612 | 0.511 | 1.00 | 3297 | 2468 | ||
| 0.0369 | 0.0195 | 0.00496 | 0.0688 | 1.01 | 374 | 668 | ||
| 0.0992 | 0.00549 | 0.0906 | 0.108 | 1.00 | 3642 | 3119 |
| Parameter | True | N = 100 | N = 200 | ||
|---|---|---|---|---|---|
| GARCH-Itô | BtvGARCH-Itô | GARCH-Itô | BtvGARCH-Itô | ||
| 0.3 | 0.18661 | 0.353 | 0.16149 | 0.348 | |
| 0.1 | 0.16321 | 0.106 | 0.05573 | 0.0854 | |
| 0.05 | 0.0000004 | 0.0479 | 0.00000002 | 0.0492 | |
| 0.6 | 0.59281 | 0.622 | 0.74135 | 0.628 | |
| Parameter | N = 100 | N = 200 | ||||||||||
|---|---|---|---|---|---|---|---|---|---|---|---|---|
| GARCH-Itô | BtvGARCH-Itô | GARCH-Itô | BtvGARCH-Itô | |||||||||
| MAE | MSE | RMSE | MAE | MSE | RMSE | MAE | MSE | RMSE | MAE | MSE | RMSE | |
| 0.1133 | 0.0128 | 0.1133 | 0.0432 | 0.00242 | 0.0492 | 0.1385 | 0.0191 | 0.1385 | 0.0469 | 0.0028 | 0.0529 | |
| 0.0632 | 0.0039 | 0.0632 | 0.0289 | 0.0011 | 0.0339 | 0.0442 | 0.0019 | 0.0442 | 0.0346 | 0.0019 | 0.0440 | |
| 0.0499 | 0.0024 | 0.0499 | 0.0198 | 0.0004 | 0.0218 | 0.0499 | 0.0024 | 0.0499 | 0.0188 | 0.0004 | 0.0212 | |
| 0.0072 | 0.0000 | 0.0071 | 0.0440 | 0.0033 | 0.0575 | 0.1413 | 0.0199 | 0.1413 | 0.0419 | 0.0023 | 0.0489 | |
| 0.0568 | 0.0085 | 0.0922 | 0.0299 | 0.0012 | 0.0348 | 0.0535 | 0.0072 | 0.0848 | 0.0192 | 0.006 | 0.0253 | |
| Parameter | Mean | Std. Dev. | q5 | q95 | Bulk-ESS | Tail-ESS | |
|---|---|---|---|---|---|---|---|
| 3288 | 33 | 3235 | 3343 | 1.00 | 1216 | 427 | |
| 0.0000417 | 0.0000156 | 0.0000214 | 0.0000714 | 1.00 | 1193 | 426 | |
| 0.0479 | 0.0336 | 0.00473 | 0.111 | 1.00 | 2878 | 4204 | |
| 0.0324 | 0.0227 | 0.00118 | 0.0713 | 1.00 | 1867 | 2415 | |
| 0.598 | 0.0515 | 0.512 | 0.681 | 1.00 | 3211 | 4578 | |
| 0.0607 | 0.0457 | 0.00621 | 0.138 | 1.01 | 625 | 304 | |
| 0.0399 | 0.0298 | 0.00315 | 0.0977 | 1.00 | 5547 | 3836 | |
| 0.0792 | 0.0356 | 0.0157 | 0.137 | 1.00 | 2179 | 1686 | |
| 0.0467 | 0.0368 | 0.00397 | 0.118 | 1.00 | 2080 | 4168 | |
| 0.000104 | 0.00000406 | 0.0000982 | 0.000110 | 1.00 | 782 | 282 |
| Parameter | Mean | Std. Dev. | q5 | q95 | Bulk-ESS | Tail-ESS | |
|---|---|---|---|---|---|---|---|
| 3215 | 37.3 | 3153 | 3276 | 1.00 | 3114 | 4280 | |
| 0.000211 | 0.0000660 | 0.000116 | 0.000329 | 1.00 | 8057 | 5696 | |
| 0.0642 | 0.0364 | 0.0112 | 0.131 | 1.00 | 5148 | 3616 | |
| 0.00245 | 0.00397 | 0.0000656 | 0.00917 | 1.00 | 4538 | 4545 | |
| 0.573 | 0.0477 | 0.495 | 0.652 | 1.00 | 13,966 | 6050 | |
| 0.0265 | 0.0167 | 0.00308 | 0.0564 | 1.00 | 2445 | 3339 | |
| 0.0417 | 0.0300 | 0.00341 | 0.0993 | 1.00 | 5523 | 4083 | |
| 0.04747 | 0.0344 | 0.00377 | 0.114 | 1.00 | 5144 | 3689 | |
| 0.0397 | 0.0296 | 0.00351 | 0.0975 | 1.00 | 3763 | 4089 | |
| 0.000944 | 0.0000252 | 0.000903 | 0.000987 | 1.00 | 18,236 | 5187 |
Disclaimer/Publisher’s Note: The statements, opinions and data contained in all publications are solely those of the individual author(s) and contributor(s) and not of MDPI and/or the editor(s). MDPI and/or the editor(s) disclaim responsibility for any injury to people or property resulting from any ideas, methods, instructions or products referred to in the content. |
© 2025 by the authors. Licensee MDPI, Basel, Switzerland. This article is an open access article distributed under the terms and conditions of the Creative Commons Attribution (CC BY) license (https://creativecommons.org/licenses/by/4.0/).
Share and Cite
Pastpipatkul, P.; Ko, H. Volatility Analysis of Returns of Financial Assets Using a Bayesian Time-Varying Realized GARCH-Itô Model. Econometrics 2025, 13, 34. https://doi.org/10.3390/econometrics13030034
Pastpipatkul P, Ko H. Volatility Analysis of Returns of Financial Assets Using a Bayesian Time-Varying Realized GARCH-Itô Model. Econometrics. 2025; 13(3):34. https://doi.org/10.3390/econometrics13030034
Chicago/Turabian StylePastpipatkul, Pathairat, and Htwe Ko. 2025. "Volatility Analysis of Returns of Financial Assets Using a Bayesian Time-Varying Realized GARCH-Itô Model" Econometrics 13, no. 3: 34. https://doi.org/10.3390/econometrics13030034
APA StylePastpipatkul, P., & Ko, H. (2025). Volatility Analysis of Returns of Financial Assets Using a Bayesian Time-Varying Realized GARCH-Itô Model. Econometrics, 13(3), 34. https://doi.org/10.3390/econometrics13030034


