Article

Exploiting Virtual Machine Commonality for Improved Resource Allocation in Edge Networks

1
Instituto de Telecomunicações, 3810-193 Aveiro, Portugal
2
Departamento de Eletrónica, Telecomunicações e Informática, Universidade de Aveiro, 3810-193 Aveiro, Portugal
*
Author to whom correspondence should be addressed.
J. Sens. Actuator Netw. 2020, 9(4), 58; https://doi.org/10.3390/jsan9040058
Submission received: 29 October 2020 / Revised: 4 December 2020 / Accepted: 7 December 2020 / Published: 13 December 2020

Abstract

:
5G systems are putting increasing pressure on Telecom operators to enhance users’ experience, leading to the development of more techniques with the aim of improving service quality. However, it is essential to take into consideration not only users’ demands but also service providers’ interests. In this work, we explore policies that satisfy both views. We first formulate a mathematical model to compute End-to-End (E2E) delay experienced by mobile users in Multi-access Edge Computing (MEC) environments. Then, dynamic Virtual Machine (VM) allocation policies are presented, with the objective of satisfying mobile users Quality of Service (QoS) requirements, while optimally using the cloud resources by exploiting VM resource reuse.Thus, maximizing the service providers’ profit should be ensured while providing the service required by users. We further demonstrate the benefits of these policies in comparison with previous works.

1. Introduction

Virtualization is being widely employed with the boom of Cloud Computing (CC). Additionally, MEC is becoming the emerging trend in CC. 5G telecom operators promise improved latency-sensitive services for mobile users, and envision moving data centers or just computational resources closer to their clients, as the means to enable such level of performance. However, this near-user deployment directly exposes the services to clients’ mobility, making mobility management more challenging and calling for careful service management to keep Service Level Agreement (SLA) limits preserved. Specifically, because as the user moves, other MEC hosts may be best suited, but context needs to be transferred and services reallocated. To facilitate mobility management, numerous techniques have been proposed. Some of these techniques address task offloading and optimal service migration, in addition to improved handover mechanisms. Following these techniques, service migration is often translated into proactive provisioning of the Cloud physical resources, in an optimal way to serve the changing needs of customers. While storage and computational resources are easy to be provisioned efficiently, latency requirements are more complex to account for. Also, the provider’s interest (SLA, cost, and resources) should be taken into consideration as well as the users’ needs (mostly SLA as cost is frequently fixed for a long period). Hence comes the need to come up with an optimal service migration policy, which satisfies the users´ needs, and provides optimal use of the cloud resources, from the point of view the of service providers.
Given that it is expected that users will share some commonality in their behavior, and applications they use, the consequence is the existence of commonalities in the operations executed by applications and services offloaded to the MEC subsystem. We envision that this particular aspect can be used to further optimize network management operations, both towards reducing the cost of allocating MEC applications and services, and towards providing better performance figures. In particular, we focus on the impact to the latency experienced by users.
Our work addresses these issues, leading the way towards solutions providing enhanced service for MEC-enabled future networks, where there are resource and behavior commonality. The main contributions presented can be summarized as follows:
  • Identify the main contributors to the delay in MEC environments and formulate a pragmatic mathematical model for E2E delay experienced by mobile users.
  • Propose dynamic VM allocation policies to achieve minimal resources provisioning for VMs while satisfying the delay constraints defined for the service.
We further compare the proposed allocation strategies with two referenced approaches: always migrate and static placement (also referred to as never migrate).
The paper is structured as follows. In  Section 2, we describe other related works. The user experienced delay modeling is formally described in Section 3, including the factors influencing delay. Three algorithms for dynamic VM allocation are presented in Section 4, and then evaluated in Section 5. Finally, the conclusions and future work are detailed in Section 6.

2. Related Works

Although VM migration has been thoroughly studied in Virtualized Edge (VE) environments to minimize delay [1,2,3], efficient resource use has not been considered a principal objective in such studies. However, optimal resource use has been a main focus of numerous works in CC environments [4,5,6,7], as the resources required rapidly scale with the service popularity.
As we aim to achieve improved resources use on a pool of MEC hosts, we acknowledge that VM allocation policies may benefit from VMs commonality, as similar VMs may share high amount of memory and storage pages. This is present in current operating systems in features such as the Linux Same Page Merging, helped by VM ballooning, and has been studied at larger scales in much research [8].
In scenarios where VMs are migrated across the infrastructure, taking advantage of shared pages helps to accelerate the migration process significantly [9]. It also helps allocate less resources for the VM on the same host. Effective policies must take this into consideration, as simple decisions between using host A or B can result in better performance. To illustrate this fact, it can be considered the situation of migrating a VM that commonly has a persistent connection with the destination host. Moving this VM nearer to the target host will help freeing an amount of Bandwidth (BW) across the network, or if the host where the VM resides is BW constricted, VMs can be moved to alleviate its resource usage. It should be noticed that network BW also generates load and resource usage at other components, especially the Central Processing Unit (CPU) and input-output subsystems, leading to issues such as Interrupt Request (IRQ) storms. Being aware of these issues is a common part of the operational envelope in cloud deployments and is vital for optimal infrastructure usage. Edge computing adds an additional dimension due to user mobility, and its impact in the edge computing infrastructure.
Some techniques were proposed to optimally use the host resources by reducing the size of memory and disk allocated for the VM when migrated, such as ballooning, hash-based compression, and memory deduplication techniques [10]. In the ballooning process, the nonessential data is flushed out of memory and only a smaller working set is transferred, the rest of the data is paged as needed. Hash-Based Compression implicates sending a hash of data blocks instead of the data itself. When hashes of the same value are found on the destination node, the data is copied from the local storage instead of transferring it from the source host.
Deduplication based on block sharing and page sharing among VMs can also be exploited to reduce the disk state size, where the pre-existence of a VM template and software installer packages on the destination accelerate the migration, as the data blocks that already exist on both sides will not be sent. The same applies when there happens to be a similarity between a migrated VM and a pre-deployed VMs on the target node [8].
Another explored optimization source is the exploration of VM commonalities to achieve optimal placement, by considering hosts with similar VMs to the migrated one as more suitable to be target hosts. With the polarization towards popular applications and a small set of smartphone vendors, MEC apps supporting a pool of users tend to have high levels of commonalities.
Several approaches exploiting the principle of memory similarities between VMs to achieve optimal placement and migration have already been suggested in previous works such as [11,12,13]. However, these approaches were proposed for Cloud environments, for the purpose of reducing migration downtime. Edge networks greatly increase the performance requirements and the effectiveness of these mechanisms as the network resources may not be as abundant as in the cloud, computational pools are smaller and there is a greater dependency between service and customer locations.
Reference [11] describes methods for placing virtual machines among physical hosts based on the number of identical memory pages between every pair of VMs. According to this proposal, the process is started when a software image content classification is performed for each of the plurality of virtual machines. The solutions identify two or more of the VMs with several common memory pages greater than an administratively set threshold. Then, the proposed solution performs dynamic migration of the first of the two or more VMs to a physical server. Because pages are shared, both the amount of traffic produced into the network and the resulting migration time will be reduced. Exploiting same host deduplication techniques, such as Linux Same Page merging, further increases the impact. As a drawback, the process becomes slightly more complex as the analysis stage must take place before the actual migration.
In [13], a memory fingerprinting technique was first proposed to identify VMs with high page sharing potential. These fingerprints are deducted from the memory contents of the VMs. Then, a system called “Memory Buddies” was proposed, which tries to exploit page sharing by co-locating VMs intelligently within a data center. Both initial placement and VM migration are used to achieve such co-location.
While previous works exploit memory sharing to identify the optimal migration target, the work in [12] exploits memory similarity to perform efficient migrations in terms of reducing migration time. The contents of the VMs residing on the source and the destination hosts are described using unique signatures, which are hash identifiers derived by applying a predetermined hash function to the associated content. The signatures of the source and target hosts VMs are compared. When similarity is determined, only the signature is sent from the source to the destination instead of the content. Thus, exploiting the shared memory among VMs to reduce migration time. A similar approach was implemented in [14] but for storage resources, and is much relevant as it is typical for an infrastructure to use a reduced number of base operating systems and distributions.
While these solutions may be viable to MEC scenarios, they could hardly cope with the dynamism required due to user mobility and behavior. It should be noticed that in a datacenter, the set of services provided presents some stability, or at least services are longer lived than code offloaded to a MEC host. Moreover, datacenters are arranged in clusters following a pyramidal scheme with multiple layers of traffic/load balancing. Thus, page analysis and comparison between all VM instances are both viable and practical, even when using processes that are prone to additional computation and higher latency. For a MEC scenario, we argue that this may not be true as there is little time to perform analysis steps, or that the analysis will incur in unacceptable overhead due to the frequent updates, over a network that is not so powerful as a large datacenter. However, techniques to reduce migration time and VM instantiation are extremely helpful to enable network optimization, while limiting the impact to services, especially those with low latency characteristics. We also argue that most offloaded applications are previously known to the Telecom provider, or can be analyzed a priori as the pool is small, even if only focusing on strongly static memory pages. This is the case for most of the operating system, shared libraries and application text area, and will exclude the kernel and application stack and heap sections.
In this work, we propose and evaluate three dynamic VM allocation policies to optimally use the VE resources. These policies are analysed and compared against two conventional approaches: static deployments, also called the never migrate strategy, and the follow-me cloud [15], also referred to as always migrate strategy. In the never migrate approach, the initial placement of the VMs on the host does not change, and is determined by the service usage pattern by the user. That is, the service is instantiated in a MEC host near the user location, and this host will be always used, independently of the user location. In the always migrate approach, the VM associated with a mobile user moves in harmony with its movement, in an attempt to provide the lowest possible latency. As there has been no previous work in MEC where both experienced latency and resource use were regarded as objectives simultaneously, we chose these two reference approaches.

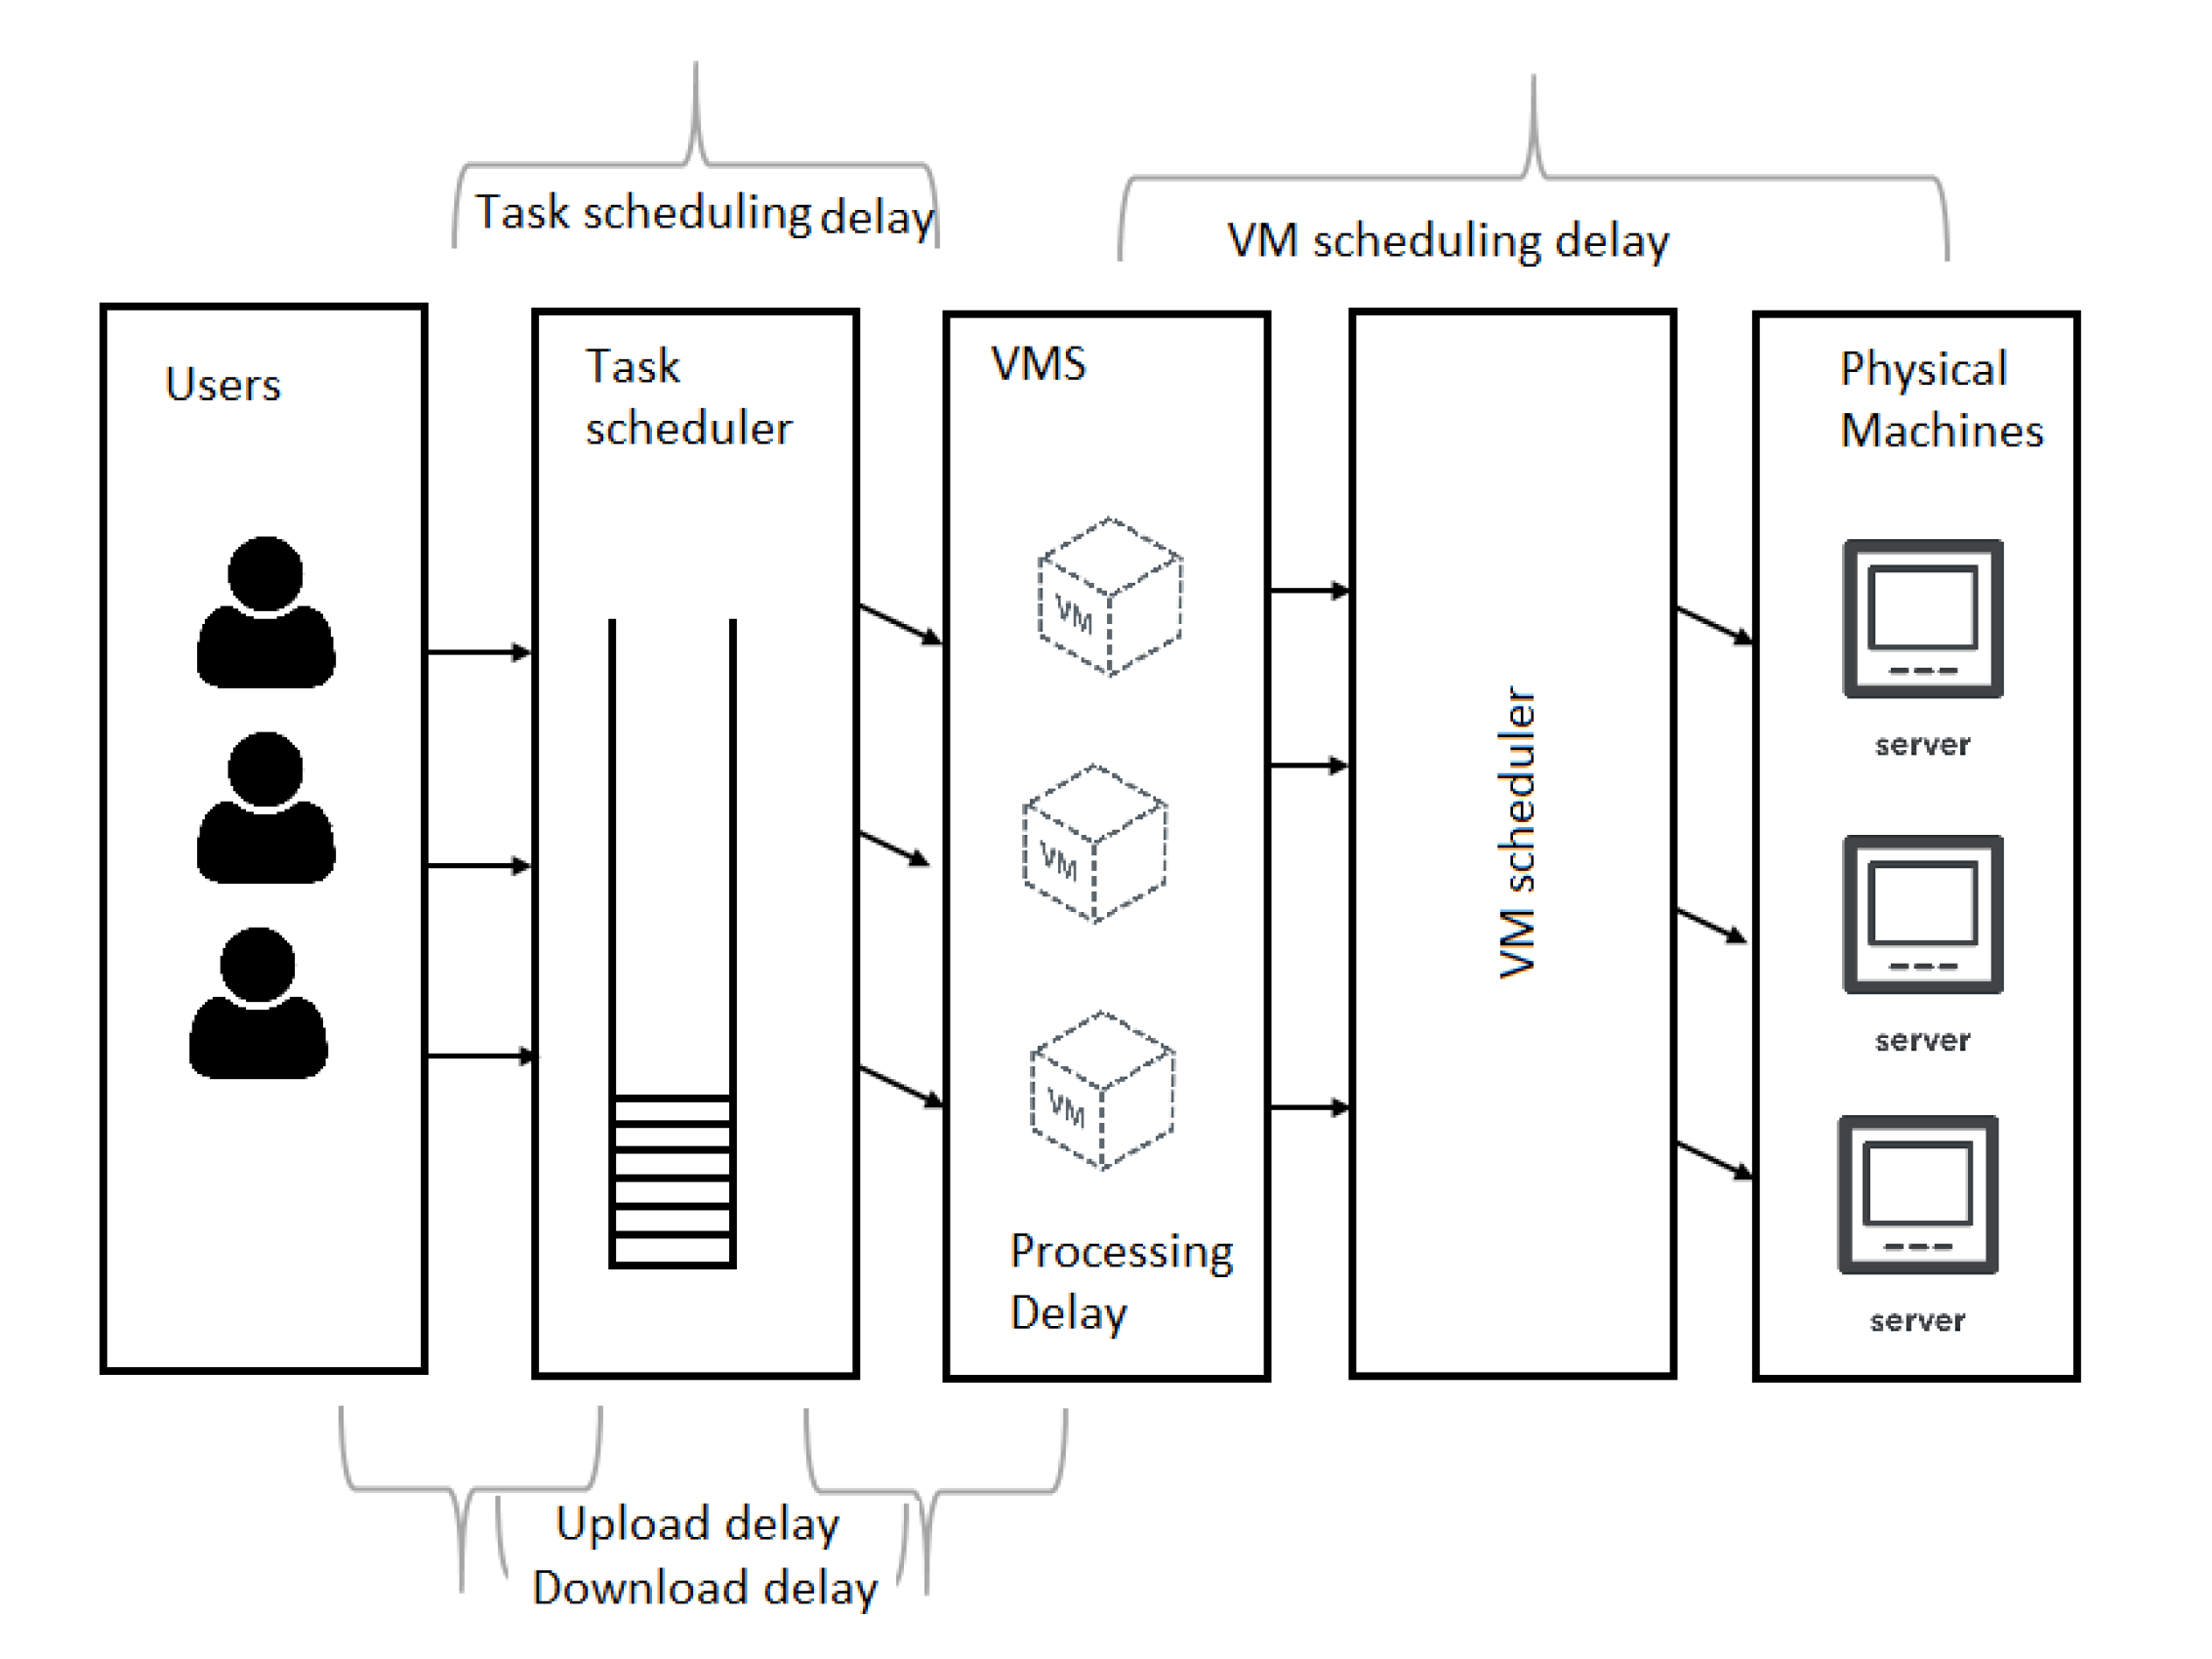
3. User Experienced Delay Modeling

Numerous factors contribute to the measurement of user experience quality, such as latency, packet loss, jitter, and bandwidth. Many QoS-oriented metrics regard latency as the principal indicator of service delivery quality [16,17], especially when user interaction is involved. However, in contrast to bandwidth, which has observed gigantic improvements over the history of telecommunications, latency has evolved at a slower pace and currently presents limitations to several systems [18]. This is especially relevant for future network architectures, such as 5G and beyond, which flag latency reduction as a major improvement over previous networks, to enable new scenarios for fog computing, MEC, and generalized tactile Internet. Our work is particularly focused on such environments, and in particular on latency minimization for MEC with mobile users, as this is one of the Network Performance Indicators (NPIs) for MEC applications.
Several factors significantly contribute to the latency experienced by mobile users in a MEC scenario and some are specific to the offload process. They are: (a) task upload latency, (b) scheduling latency, (c) task processing latency, and (d) task results download latency. These tasks should not be seen with a High performance computing (HPC) focus, as the tasks exist in any request/response interaction model. In this scope, the total delay ( D t o t a l ) experienced by a user can be expressed as Equation (1).
D t o t a l = D u p l o a d + D s c h e d u l i n g + D p r o c e s s i n g + D d o w n l o a d
These delays are depicted in Figure 1, which details how they are distributed in a virtualized infrastructure.
The following subsections detail the modeling of each component in Equation (1).

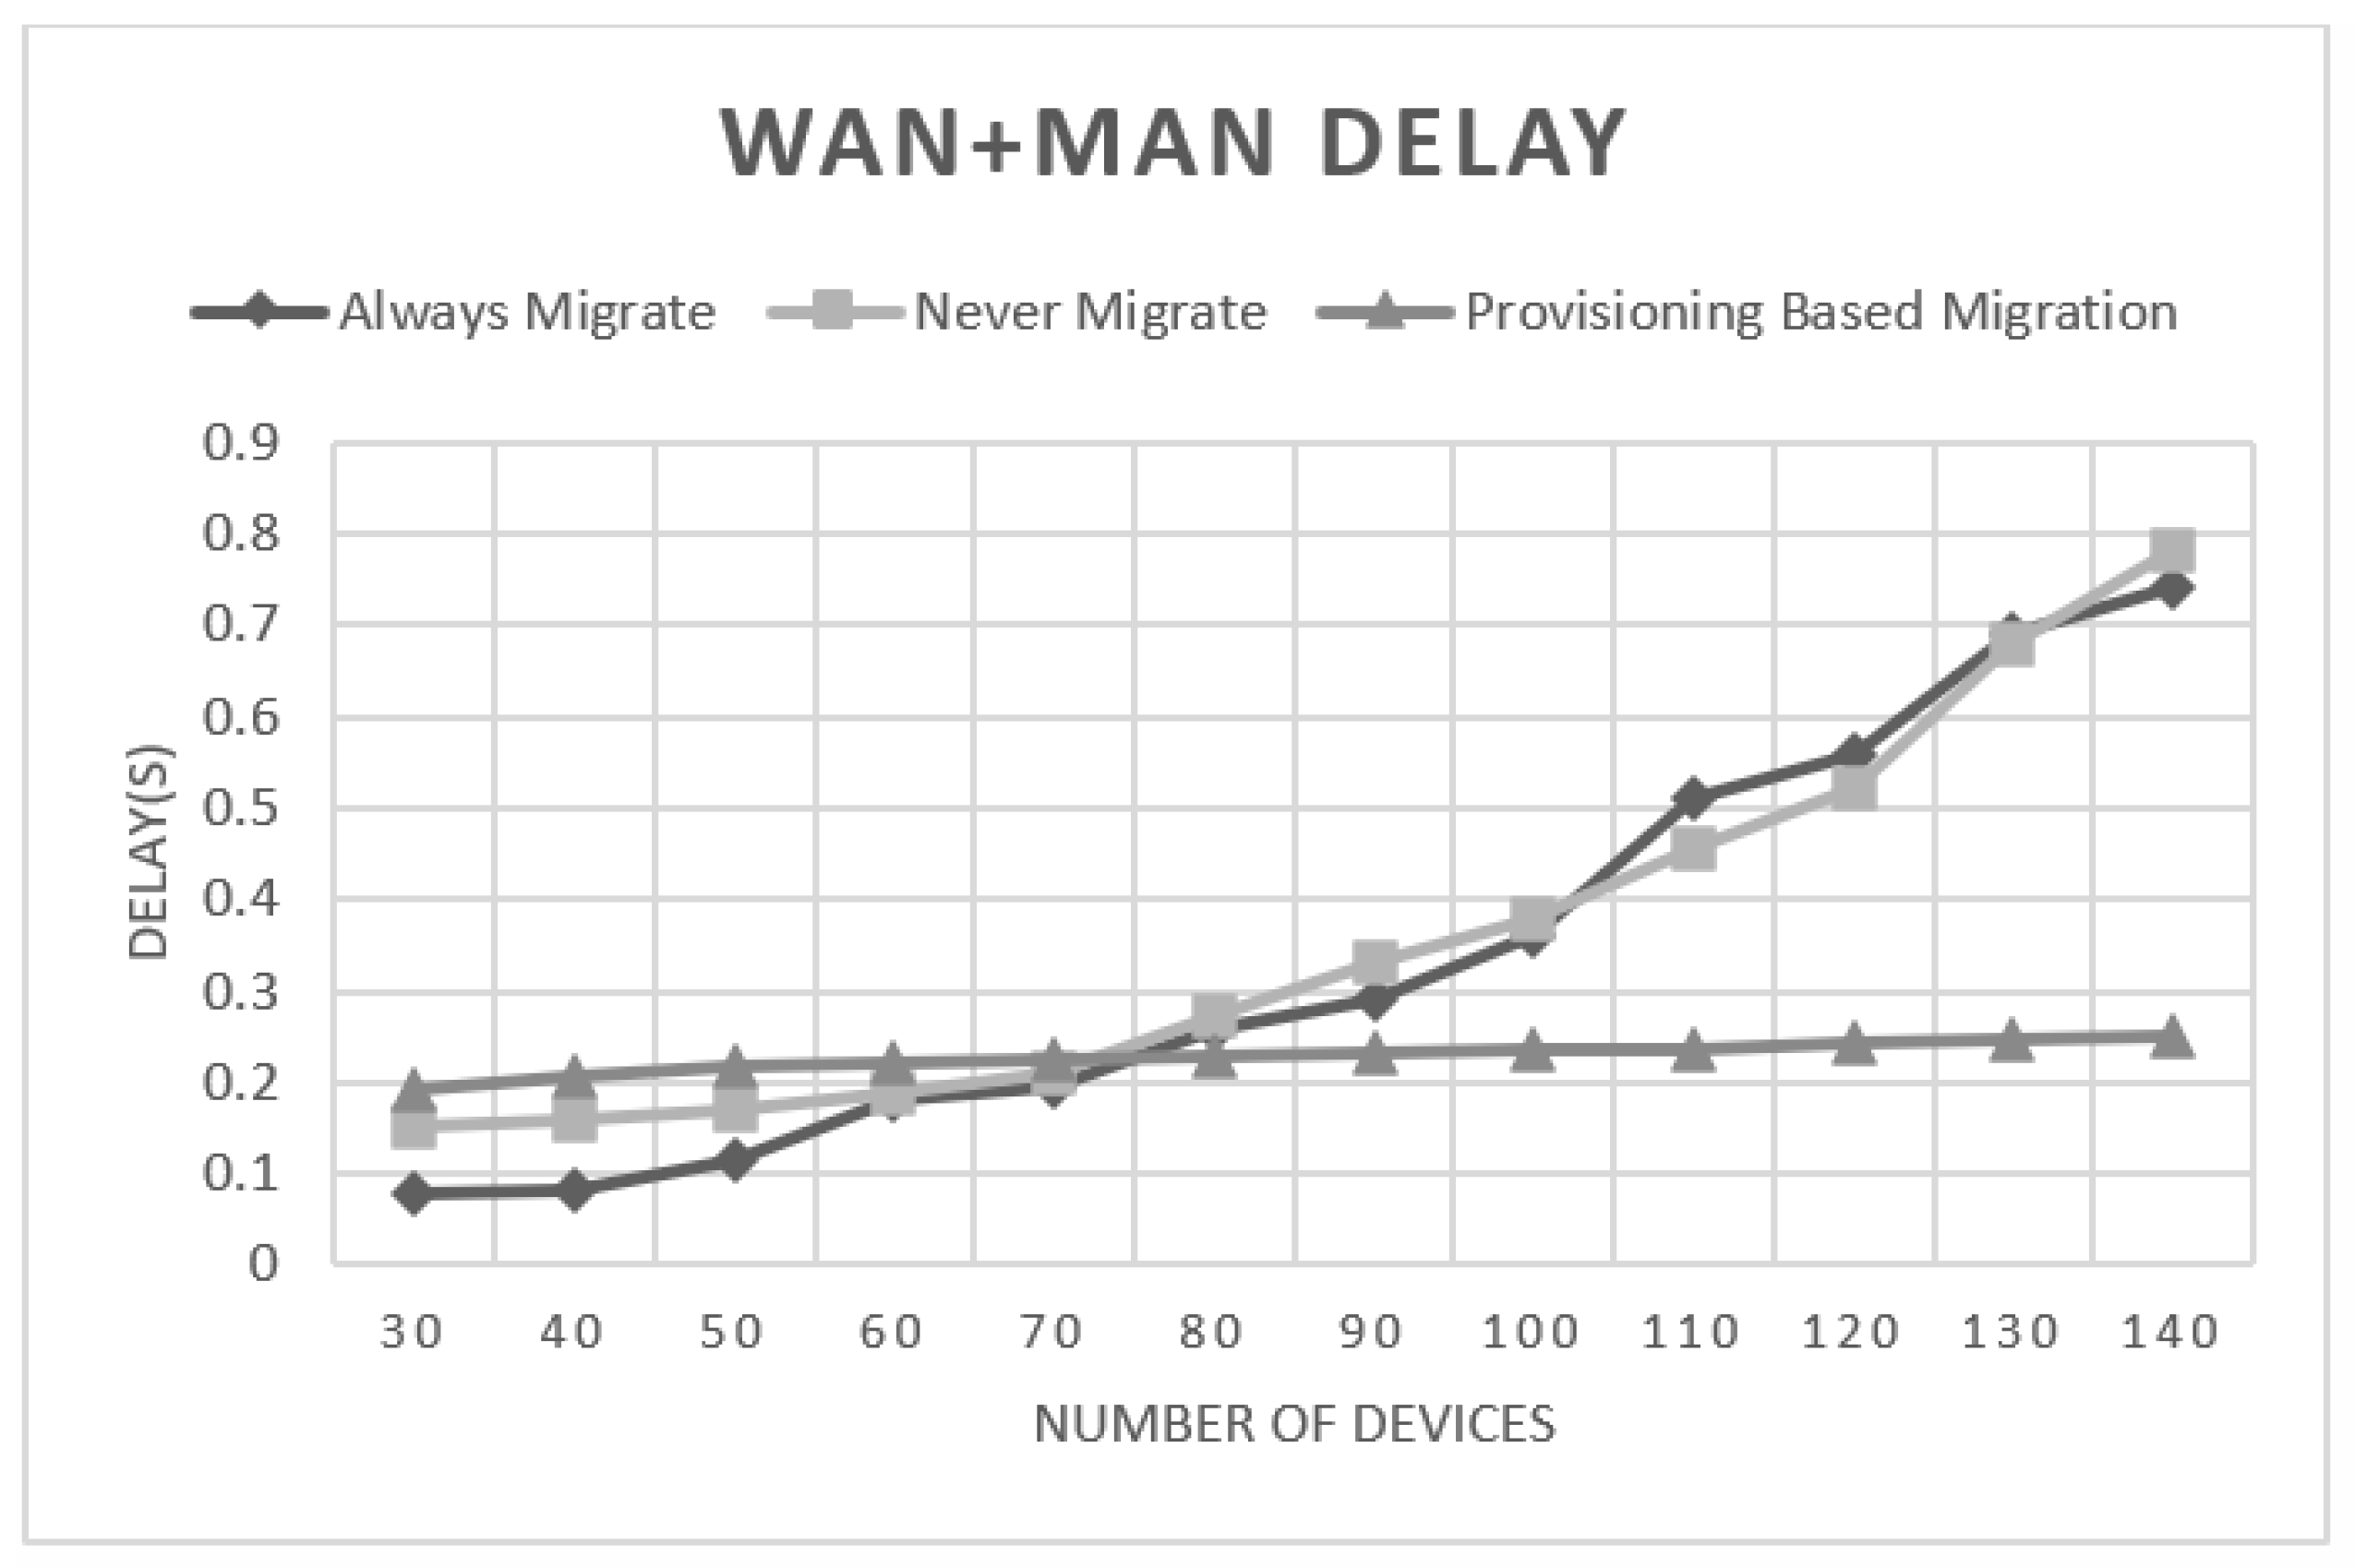
3.1. Communication Delay Modeling

The communication delay consists of the upload delay and download delay. The upload delay ( D u p l o a d ) refers to the time needed for the user to transmit its computing task to an edge node. This delay is mainly affected by the task input file size (e.g., a photo), the bandwidth effectively allocated to the user-network connection, and the distance between the user and the edge node. The first aspect is mostly influenced by technology and commercial contracts, while the second is what drives MEC and other forms of edge computing.
Considering a task, denoted by T, has the characteristics { T i n , T l , T o u t , T d e a d l i n e }, where T i n is the task input file size, T l is the task length and is measured by Millions of Instructions (MI). T o u t is the output file size resulting from the task execution. T d e a d l i n e is the task deadline which if violated, the task will be regarded as failed.
D u p l o a d = T i n R
Symbol R represents the bit rate expressed in bits per second (bps). Considering that the theoretical maximum data rate of a noisy channel derived from Shannon’s Capacity law, is given as in Equation (3).
C a p a c i t y = B W · log 2 ( 1 + S N R )
B W is the bandwidth of the communication channel and S N R is the signal to noise ratio. From Equations (2) and (3), we can define the task upload delay as in Equation (4).
D u p l o a d T i n B W · log 2 ( 1 + S N R )
The download delay ( D d o w n l o a d ), similar to D u p l o a d , is related to the user-network connection bandwidth, the size of the computation result, and the distance between the user and the serving node. It should be noticed that in the access segments of telecommunication networks, it is common for resources to be allocated in an asymmetric manner, resulting in differentiated download and upload delays. Moreover, there may be an asymmetry between the size of task input and output (e.g., an image versus a JSON object). When the serving node is different from the computing one, then the transmission delay between the nodes is added to the download delay. The download delay is thus expressed as in Equation (5).
D d o w n l o a d T o u t B W · log 2 ( 1 + S N R )
B W and S N R are the bandwidth and signal to noise ratio corresponding to the download channel. From Equations (4) and (5), the communication delay formula can be written as in Equation (6).
D C o m m u n i c a t i o n T i n B W · log 2 ( 1 + S N R ) + T o u t B W · log 2 ( 1 + S N R )
These are slightly optimistic absolute values, as the Shannon capacity is never perfectly achieved. Still, the analysis is valid to derive relative values for the potential improvement of resource sharing solutions that are constrained by the communication delay.

3.2. Processing Delay Modeling

Let each Virtual Machine have the following characteristics { V c , V m i p s , V P e s N u m b e r , V r a m , V s t o r a g e }, where V c represents the computing speed of the VM, V P e s N u m b e r refers to the number of processors used at the VM level and V m i p s represents the VM processor capability, which is measured in Millions of Instructions Per Second (MIPS). Therefore, the processing latency, which refers to the amount of time needed to process the task on the cloud node can be expressed as in  [19] (Equation (7)).
D p r o c e s s i n g = T l V c
The computing speed of the VM, for a fully predictable processor environment, is defined according to Equation (8).
V c = V m i p s · V P e s N u m b e r
Therefore, the processing delay can be expressed as in Equation (9).
D p r o c e s s i n g = T l V m i p s V P e s N u m b e r
We assume a perfect CPU with known and stable MIPS efficiency over a range of tasks. This is not true with real software as it does not capture the efficiency of executing the said task. However, doing fixed tasks over objects, such as recognizing objects in a picture, will result in a mostly constant computation time for the same algorithm and picture size. Once again we will focus on the relative effectiveness of our solutions as execution efficiency would impact different solutions in similar ways.

3.3. Scheduling Delay Modeling

The scheduling latency ( D s c h e d u l e ) is the outcome of both VM scheduling and task scheduling procedures in the cloud. VM scheduling delay is a result of the policy implemented to assigning VMs to the physical hosts [20], whereas the task scheduling delay is due to the mechanism and policy adopted to distribute the users´ submitted tasks to the system VM [21]. This usually is the responsibility of the orchestrator in a multi-tier edge computing platform [22]. The tasks are presumed to be buffered in a queue before being submitted to the adequate VM chosen by the orchestration policy. This can be represented as in Equation (10).
D S c h e d u l i n g = D V m S c h e d u l i n g + D T a s k S c h e d u l i n g
From the perspective of a cloud infrastructure, task scheduling delay can be modeled as a stochastic process. Considering a cloud computing system where the tasks arrive with a mean rate of λ (as users interact with their smartphones and move around), and the mean number of users in the system queue is L q . The mean waiting time spent by the task in the system, which represents the task scheduling delay, can be expressed using the queuing formula in  [23] (Equation (11)).
D T a s k S c h e d u l i n g = L q λ
Considering a CC system with a single task queue and c identical (homogeneous) servers in parallel, the mean number of customers in the queue can be determined as in  [24] (Equation (12)).
L q = P 0 ( λ μ ) c ρ c ! ( 1 ρ ) 2
Therefore, the task scheduling delay can be defined by the formula in Equation (13)
D T a s k S c h e d u l i n g = P 0 ( λ μ ) c ρ c ! ( 1 ρ ) 2 λ
P 0 denotes the probability that there are no customers in the system, ρ is the use of the server. It also represents the probability that the server is busy or the proportion of time the server is busy. Symbol μ represents the mean service rate, and the relation can be expressed as in Equation (14).
ρ = λ c μ
From Equations (6), (9), and (13), we can define the End-to-End delay in Equation (15).
D T i n B W · l o g 2 ( 1 + S N R ) + T o u t B W · l o g 2 ( 1 + S N R ) + + D V m S c h e d u l i n g + P 0 ( λ μ ) c ρ c ! ( 1 ρ ) 2 λ + T l V m i p s V P e s N u m b e r
In a typical CC environment, VM scheduling delay is insignificant, or at least small, as VMs deployment among data-centers is already established preceding to the task offloading process. However, when the VM assigned to a User Equipment (UE) is not ready at the moment that the computing task is being offloaded, the user will experience an additional delay, resulting from the VM instantiation on that specific physical hosts or the migration of the VM from one host to another. This delay is more substantial in MEC environments, where the concept of moving the VM in parallel to the user movement is used as a mean to maintain a controlled quality of service [15]. Even if this coordination method is not used, VM migration can still occur as a result of maintenance or failure recovery mechanisms. From an optimization perspective, the capability of dynamically migrating VMs in the infrastructure is beneficial in order to handle the potential over-use of one host computational resources. To illustrate this we can consider that edge hosts near popular monuments, or in the cities downtown, will have a higher number of Machine Learning (ML) tasks related to object or scene detection/classification. Thus, in a MEC platform, VM allocation delay, which is normally associated with VM scheduling delay, may be relevant, and must be minimized in order for the provider to support highly available, low latency services.
The VM dynamic allocation procedure is normally performed by management daemons running on the VMs of the source and destination hosts. These are responsible for creating a new VM on the target host, and coordinating the transfer of live system state between the two hosts [25]. Several approaches can be used for this process, being live and cold VM migration broadly the most common approaches, and the choices with most relevant impact to our context.
When following a cold migration strategy, the VM is completely turned off, which means freezing the memory and all state to files. These files are then moved from one physical server to another, and used to resume the execution at the new location. This is suitable for poorly available server environments, and predictable management operations, but not at all suited for dynamic optimization in MEC environments.
In the case of live migration, a running virtual machine is moved between physical servers [26], while running and with minimal disruption. Live migration itself has several sub-strategies, with pre-copy and post-copy being the most prevalent ones. In the pre-copy strategy, all memory pages are first transferred, then the dirty pages are copied iteratively. When the page dirtying rate becomes small, the VM is suspended and only CPU state and remaining dirty pages in the last round are sent out to the destination [25]. In the post-copy strategy [27], the VM execution is suspended at the source, then the minimal CPU state is moved to the destination host. The VM is resumed at the destination host, and the virtualization infrastructure begins fetching memory pages over the network from the source as required. Essentially, post-copying infrastructures transfer the memory just once, thus avoiding duplicate transmission overhead of pre-copying strategy. However, the downtime is usually higher than the one experienced in the pre-copy approach [27].
The migration delay refers to the time needed to move the entire VM state from the source to the target edge host. This delay is highly dependent on several factors, deriving from capacity and architectural decisions. For example, VM migration in a Local Area Network (LAN) environment is quite different from the migration in a Wide Area Network (WAN). The former may imply the transfer of the memory state alone, as the disk state is presumably stored on some shared networked storage (SAN/NAS) so that it can be immediately accessible to any destination host. Furthermore, LAN migration may not call for Internet Protocol (IP) address change. Meanwhile, WAN-based migration may implicate the transfer of both memory and disk states if a SAN does not span multiple data centers. It may also require obtaining a new IP address [28], and Software Defined Network (SDN)-based indirection, or proxies must be developed in order to keep application endpoints stable (to support long-lived sessions).
In this work, we propose a model characterizing pre-copy VM migration delay. The model is focused on aspects directly related to VM migration, such as disk (full disk or just changes from a disk-based snapshot) and memory transfer time, which is the norm for WAN migration and LAN with storage migration. Meanwhile, the model disregards the time needed for selecting the destination, as well as the latency resulting from IP address reconfiguration as their are not clearly characterized by state of the art works.
Independently of the specific mechanism, migration delay is correlated with the memory state size, whose size is volatile. When transferring the memory image of a running Operating System (OS), the page dirty rate is the main contributor to the memory size when the pre-copy strategy is carried out.
We propose exploiting the fact that applications can be characterized (some at least), and the cost of knowing if two edge hosts are running the same application is reduced, therefore avoiding the need for greedy search and bulk page comparison. In our case, we preselect candidate edge hosts that have the same application (hence, a similar VM) running, in an attempt to minimize resource usage and migration delay.
Taking as an example the Xen hypervisor, the pre-copy migration mechanics used considers that the entire Random Access Memory (RAM) is sent first, and the memory pages modified are transferred to the destination in an iterative manner. Then, the transmission will be stopped when one of the following conditions is met [29]:
  • Condition 1: Less than 50 pages were dirtied during the last pre-copy iteration.
  • Condition 2: 29 pre-copy iterations have been realized.
  • Condition 3: More than 3 times the total amount of RAM provisioned to the VM has been copied to the target node.
After one of these conditions is realized, the VM on the source is deactivated and a final RAM transfer round is performed.
Considering an average page dirtying rate ω measured in pages per second, the modified memory at each iteration is defined as P according to Equation  (16).
P = ω × c e i l i n g ( V r a m P a g e S i z e )
Page size is usually determined by the processor architecture. Commonly, the page size is 4096 bytes. If the number of iterations needed for memory transmission is n, then the total amount of memory transmitted is M, as in Equation (17), with V r a m defined as in Equation (18).
M = V r a m + P a g e S i z e · P · n
V r a m M 5 · V r a m 1 · p a g e
The lower bound of the memory (M) represents the case where RAM transmission needs a single iteration and the upper bound considers the case where the entire memory pages are being modified in each iteration. These bounds are further explained in [29]. Considering the second condition where n 29 . The VM migration time is then given as in Equation (19).   
D V m S c h e d u l i n g = M i g r a t i o n T i m e = V s t o r a g e + M R = V s t o r a g e + V r a m + P a g e S i z e · P · n R = V s t o r a g e + V r a m + P a g e S i z e · ω · c e i l i n g ( V r a m P a g e S i z e ) · n R
Considering an optimal condition with a maximum bit rate equal to the channel capacity, and considering the VM scheduling delay equal to the VM migration delay, then we can express this time as in Equation (20).
D V m S c h e d u l i n g = V s t o r a g e + V r a m B W · l o g 2 ( 1 + S N R ) + P a g e S i z e · ω · c e i l i n g ( V r a m P a g e S i z e ) · n B W · l o g 2 ( 1 + S N R )

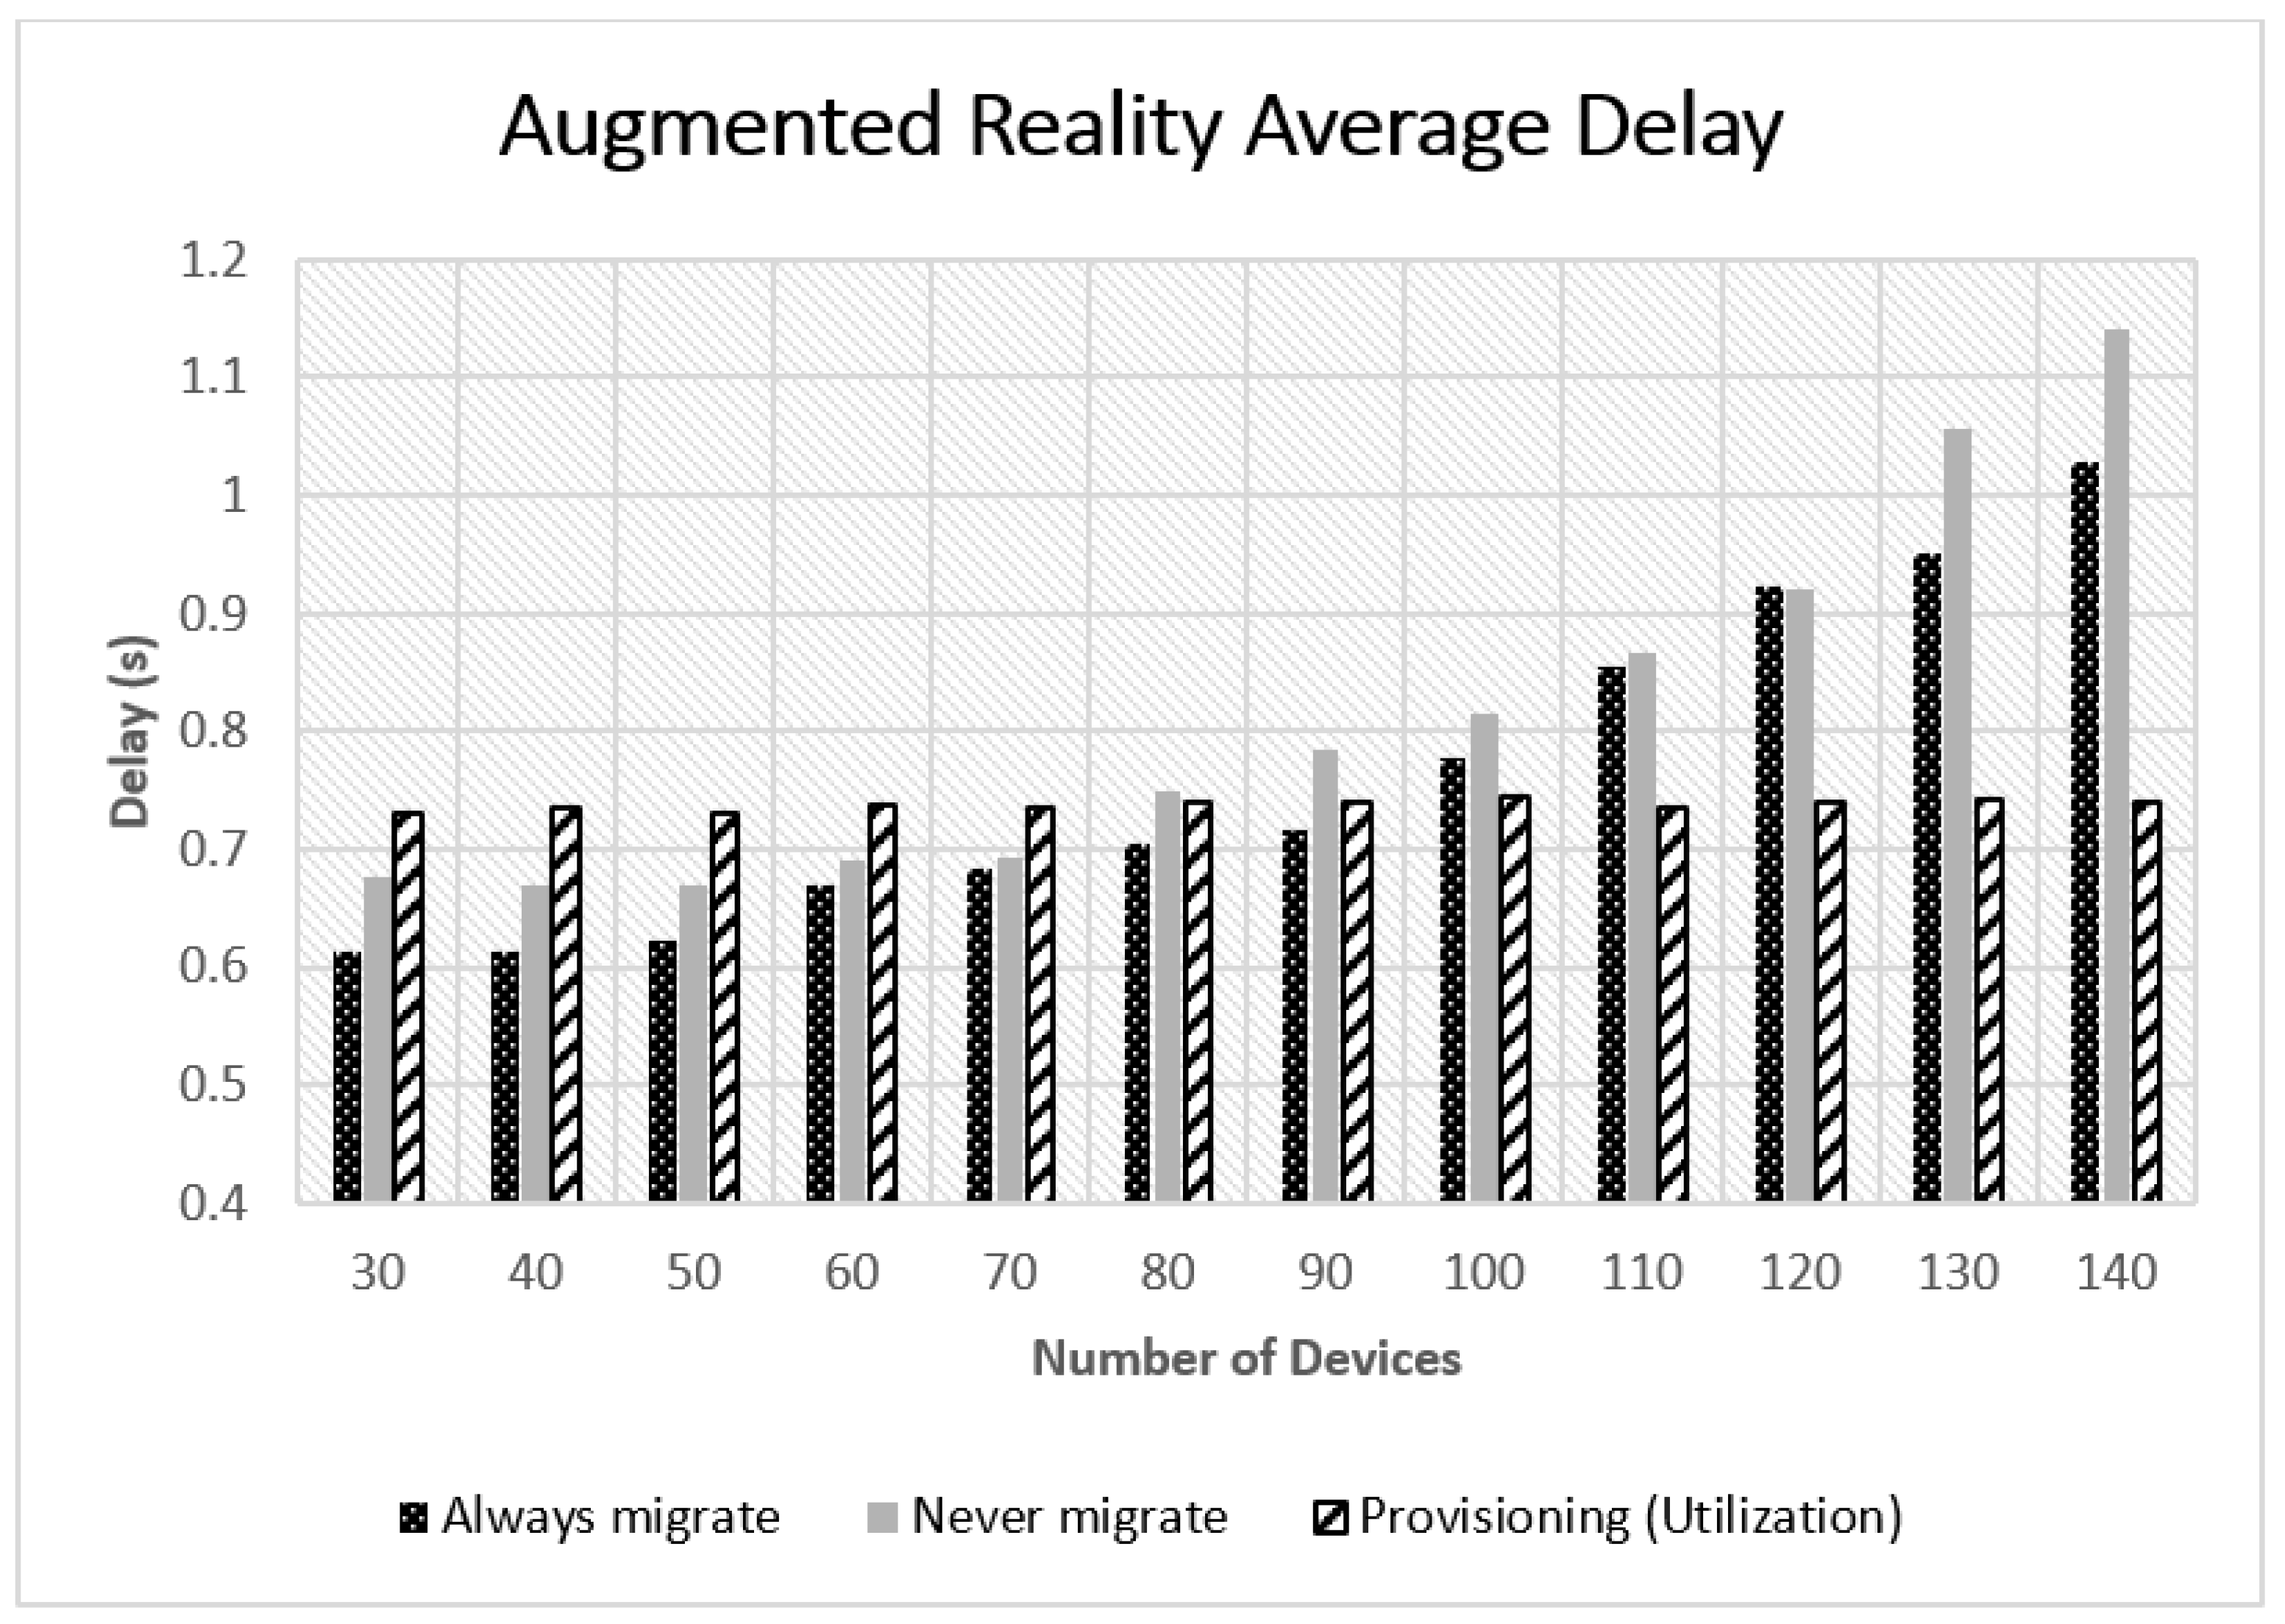
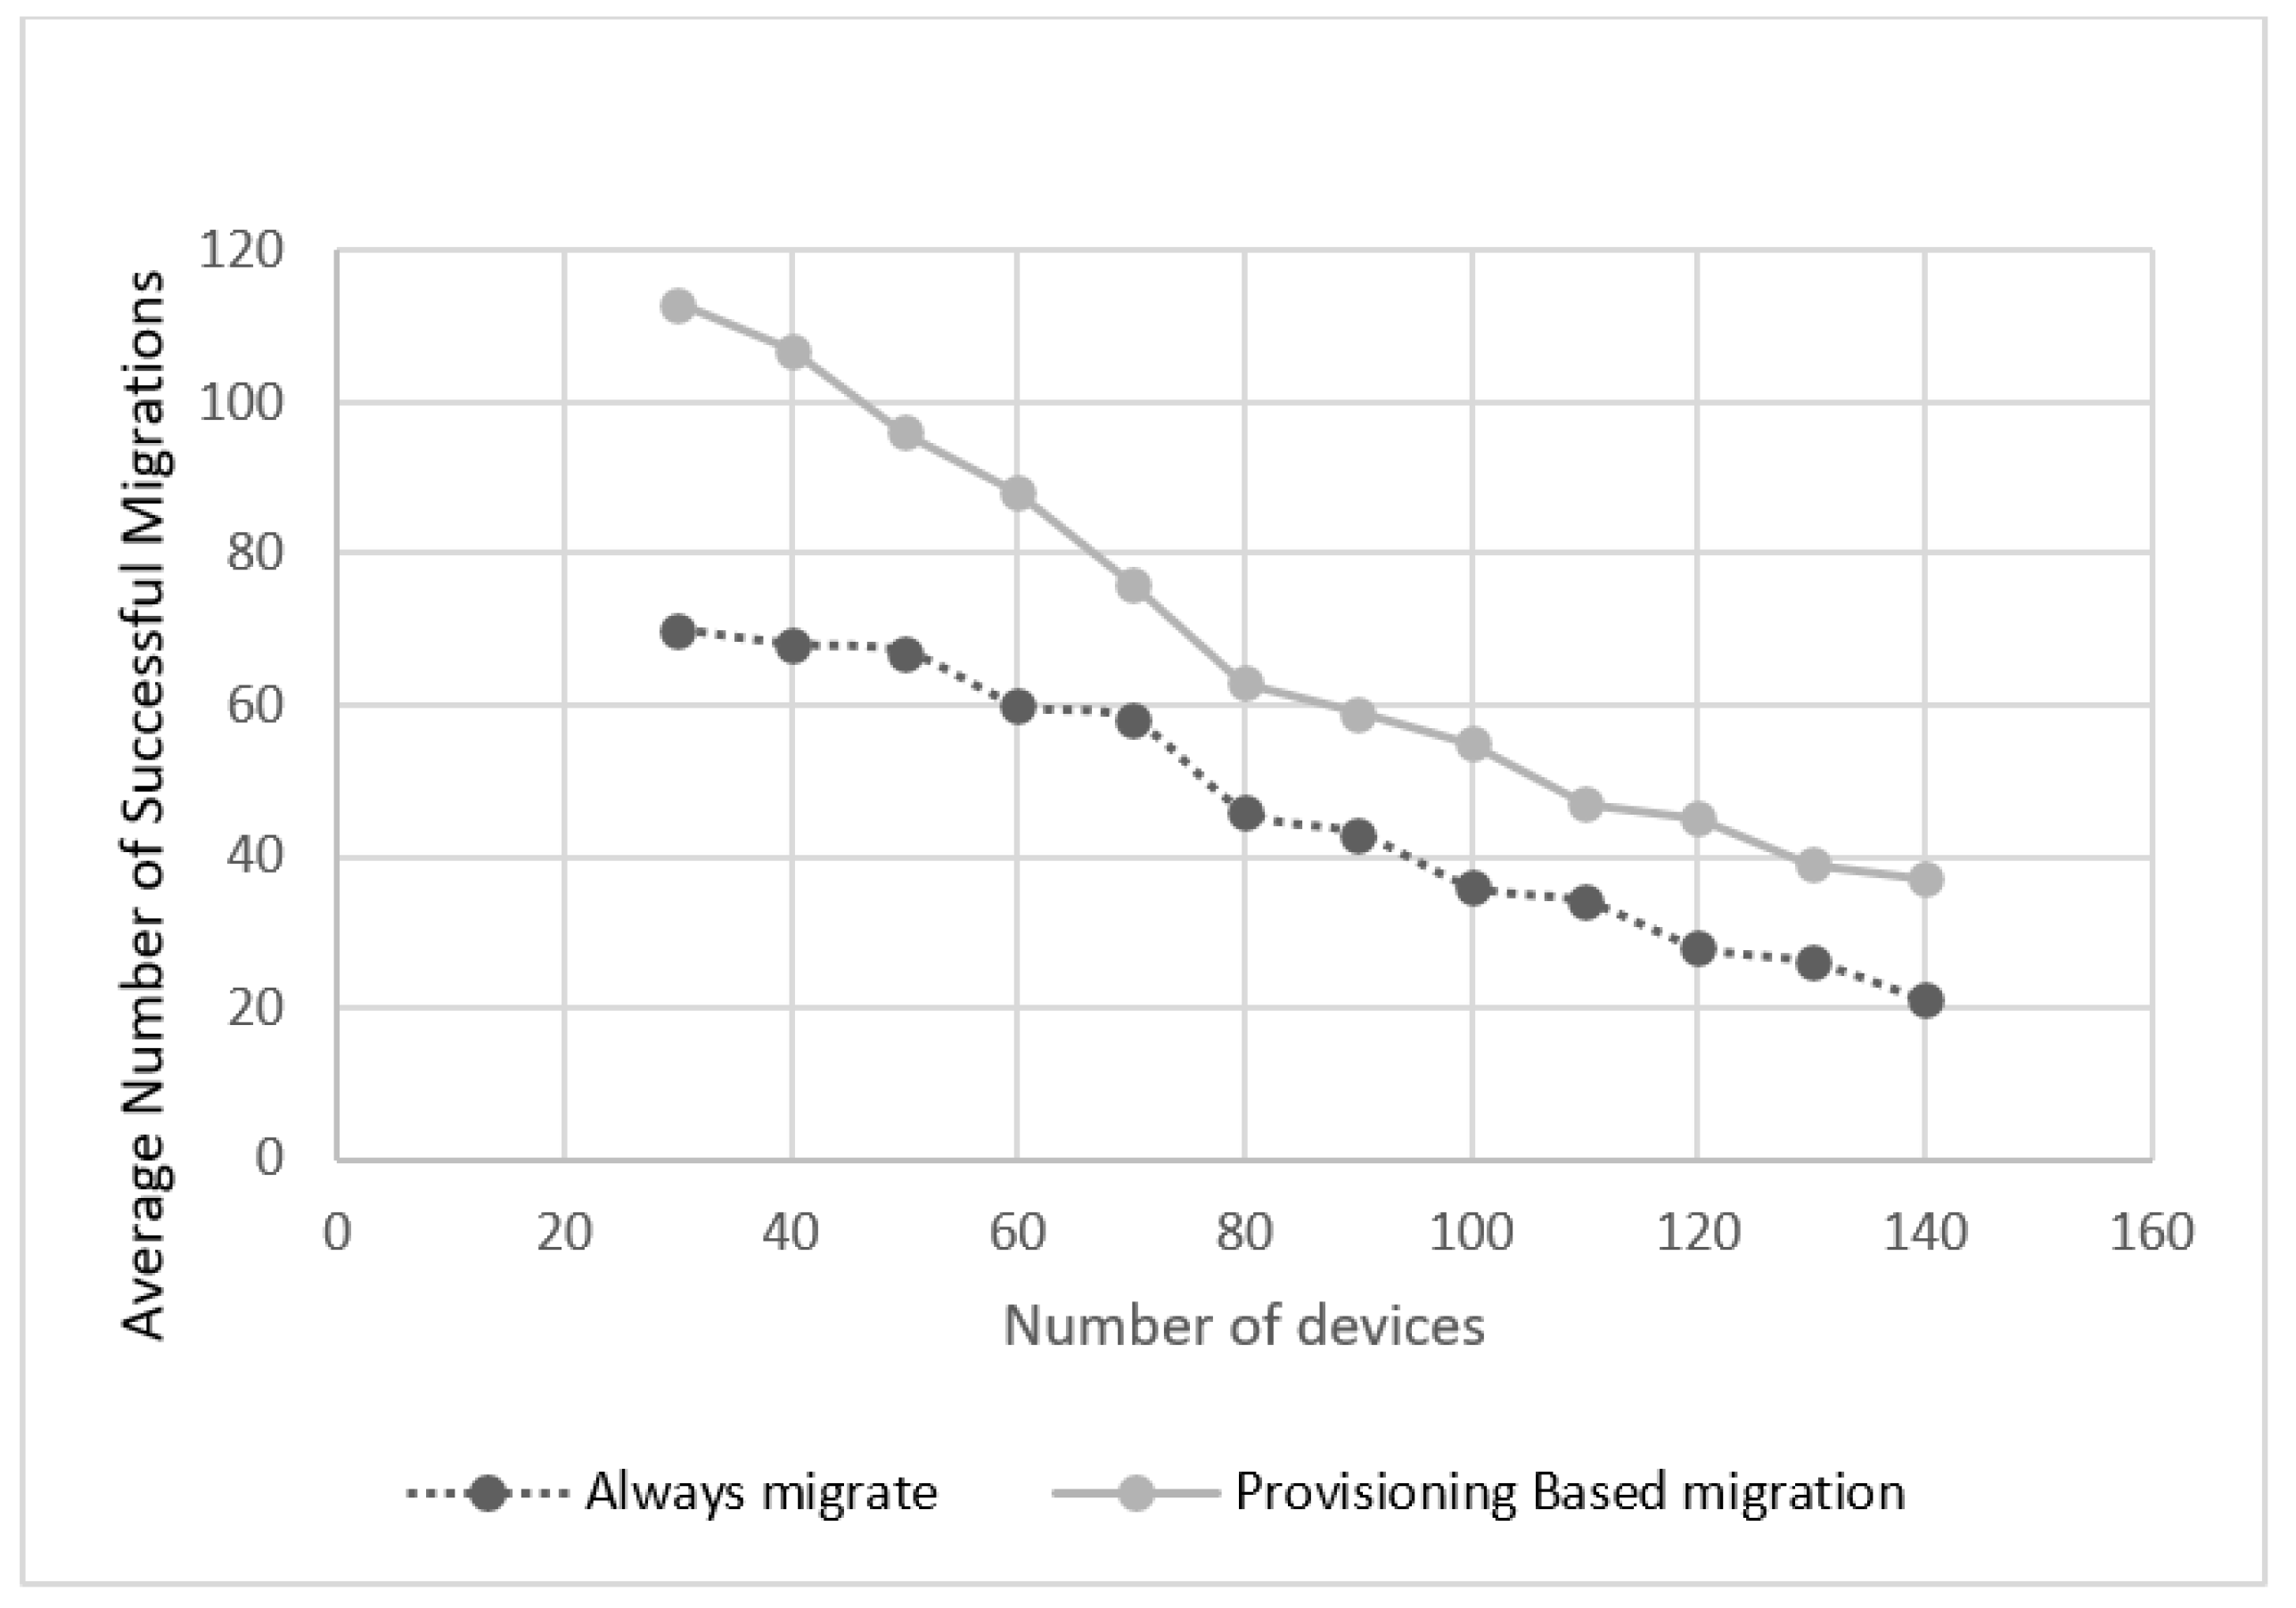
3.4. E2E Influential Factors

From Equations (15) and (20), we can write the final E2E delay formula as in Equation (21).
D = T i n B W · l o g 2 ( 1 + S N R ) + T o u t B W · l o g 2 ( 1 + S N R ) + T l V m i p s V P e s N u m b e r + P 0 ( λ μ ) c ρ c ! ( 1 ρ ) 2 λ + V s t o r a g e + V r a m B W · l o g 2 ( 1 + S N R ) + + P a g e S i z e · ω · c e i l i n g ( V r a m P a g e S i z e ) · n B W · l o g 2 ( 1 + S N R )
From this result, we can conclude that the influential factors affecting E2E delay can be both positive and negative. As positive influential parameters it is relevant to refer: (a) Bandwidth: This includes three different bandwidth values, the bandwidths of the upload and download channels between the UE and the network attachment point, and the bandwidth between the source and the target hosts in case of the occurrence of VM migration; (b) Signal to Noise Ratio (SNR), including the SNR between the UE and the network and between the source and the target hosts of the migration. This is usually negligible considering the medium between the nodes is commonly optical; (c) The number of the servers executing the users’ tasks. In a virtualized environment, this number represents the number of VMs. (d) The VM computing capability determined by the number of processors used at the VM level and the processing speed.
While as negatively influential parameters it is relevant to consider: (a) VM sizing: including the VM storage and VM memory size; (b) VM memory dirty rate; (c) Task input file size and output file size; (d) Task length or the number of instructions needed to be executed for the task to be completed, frequently measured in millions of instructions (MI).
Our problem formulation for the migration decision making takes into consideration the aforementioned influential factors. More specifically, the VM’s commonality is exploited to reduce the resources, which need to be provisioned for the migrated VM. Thus, increasing the number of VMs hosted by the network nodes, hence the network will be able to accommodate more of the users’ demands, and with better QoS. Furthermore, the delay relationship obtained in Equation (21) can be used to guarantee the delay restrictions correspondent to service type or defined in the SLA.

4. Resource Provisioning-Aware VM Allocation

A server hosting a VM has to purvey a certain amount of its computational resources to this VM, such as processing capacity (CPU bandwidth), memory, network BW, and disk size.
While provisioning network BW, storage and memory is a straightforward process, CPU provisioning is somehow different as allocating CPU for a VM is realized by hypervisor virtual CPU schedulers. Xen hypervisor project has several scheduling approaches such as Credit, Credit 2, RTDS and ARINC653 [30]. The default is Credit, which assigns a weight to the VM and the underlying scheduler allocates CPU bandwidth in proportion to the weight [31].
Our approach focuses on establishing an efficient dynamic mapping of virtual to physical resources, optimized for MEC environments, where the VMs are exposed to the users’ movement and may move in harmony among network nodes, or where user mobility may enable or create the need for optimizations in the MEC environment. By choosing the server which can host the VM, while provisioning minimum resources, we aim to increase the capacity of the edge virtualization infrastructure, and thus accommodate users’ demands more efficiently than reference migration models. In particular we focus on providing an improvement of strategies such as static deployments and always migrate on user movement. Moreover, we aim to establish dynamic VM allocation in the network helping to avoid underused as well as hotspot nodes.
In this section, three VM allocation cost problems are formulated. Using each of these approaches, we evaluate if the host and VM deployments are more adequate than the others, in a environment with strict, latency bound SLAs. The chosen host must realize the least resources provisioning for the VM, while fulfilling the end to end delay limits in accordance with the SLA restrictions for that service.
To realize the least resource provisioning of a VM on a host, we consider the commonality between the migrated VM and the VMs already allocated to the host, as well as the bandwidth attributed to the communications between the migrated VM and the target host. Moreover, we take in consideration the resources which can be freed when the migration is performed (as they will become internal, RAM bounded, transfers). The VM allocation cost will differ as the sizing of a particular VM differs in between hosts.
Following this strategy, three resource allocation cost problem formulations are presented. After its description, we will present the impact of implementing a resource provisioning-aware migration policy based on these costs, and will evaluate it against two reference approaches from the state of the art.

4.1. Common Notations

For all three problem formulations, the same notations are used in order to increase readability. Each host in the network is characterized by a set of resources { H c p u , H n e t , H s t o , H m e m } representing the host CPU processing capability measured in M Hz or MIPS, the bandwidth measured in Mbps, storage measured in GiB, and the memory measured in MiB, respectively.
The pre-existing VM on the host makes use of a determined amount of its resources, i.e., CPU power, network, memory, and storage. The current allocation of these resources on the host is denoted as U c p u h , U n e t h , U s t o h , and  U m e m h . The available proportion of resources is thus given as ( 1 U ). The allocated and available resources are given as percentile values.
Meanwhile, the real amount of resources available on the host are referred to as { A c p u , A n e t , A s t o , A m e m }. The VM is characterized as { V c p u , V n e t , V s t o , V m e m }, which expresses the resources sizing of this VM. As a real network may have heterogeneous hosts, it is more realistic to consider that the proportion of the server resources allocated to the VM will differ among the different hosts, as it is subject to the host specifications. Thus, the VM resource allocation on the host h is denoted as U c p u v ( h ) , U n e t v ( h ) , U s t o v ( h ) , and  U m e m v ( h ) .

4.2. Use-Based Problem Formulation

VM sizing is considered static and based on VM runtime requirements, but the host resources actually used by the VM on a virtualization host are volatile, and dependent on the pre-existing VMs, as well as the provisioning policy carried out by the hypervisor or the Virtual Machine Manager (VMM).
In this first cost formulation, we define a metric called the VM resource allocation cost (R) defined in Equation (22).
R = w c p u · V c p u A c p u + w m e m · V m e m C m e m A m e m +   w s t o · V s t o C s t o A s t o + w n e t · V n e t A n e t + C n e t
where w is the weigh of the associated resource and can be configured by the network administrator.
C m e m is the common amount of memory between the candidate VM and the VMs already deployed on the target host, measured in MB. C s t o is the common amount of storage between the migrated VM and the residing VMs on the target host.
As many services in a cloud computing environment call for communication between several VMs deployed on different hosts, we assume that migrating a VM to a host can free a certain amount of its network bandwidth. Thus, C n e t is the amount of the bandwidth freed in the case of migration. The optimization problem is thus defined as in Equation (23).
min(R), subject to:
D < S L A D e l a y L i m i t V c p u < A c p u V m e m C m e m < A m e m V s t o C s t o < A s t o V n e t < A n e t + C n e t

4.3. Distance-Based Problem Formulation

For this formulation, the VM and the host states in terms of resources use are represented as points of ( U c p u , U r a m , U s t o r a g e , U b w ) in a Cartesian coordinate system for a four-dimensional space. The origin with the coordinates (0, 0, 0, 0) representing a host with all resources free, and (1, 1, 1, 1) represents a host without any free resources. The VM is represented as a point V ( U c p u v ( h ) , U m e m v ( h ) , U s t o v ( h ) , U n e t v ( h ) ) between this two limits, and the unused resources of the host are represented as S ( S c p u , S m e m , S s t o , S n e t ).
To evaluate the allocation efficiency, we used the euclidean distance between S and V. The greater the distance, the better, as it indicates less resources will be provisioned for the VM on the corresponding host. The distance is expressed as Equation (24), and the the optimization problem is thus defined as Equation (25)
P = w r ( S r U r v ( h ) ) 2
where S r = 1 U r h , w r is the weight of the resource ( r ) , r { c p u , m e m , s t o , n e t } .
max(P), subject to:
D < S L A D e l a y L i m i t U r v ( h ) < 1 U r h w h e r e r { c p u , m e m , s t o , n e t }

4.4. Volume-Based Problem Formulation

Many representations and parameters have been proposed to express VMs and hosts in accordance with their resource specifications. For example, Sandpiper [32] defines a metric called a v o l u m e to express the virtual machine and the physical server as a three-dimensional object. The volume is defined as the product of CPU, network, and memory loads stated in Equation (26).
S a n d p i p e r v o l u m e = 1 1 U c p u · 1 1 U m e m · 1 1 U n e t
According to the formulation stated in Equation (26), the higher the use of a resource, the greater the volume will be. A use volume metric was also defined in [33]. However, the definition is quite different as it is defined as in Equation (27).
V o l u m e = U c p u · U m e m · U n e t .
The total use volume metric defined in Equation (27) considers the virtual machine and the physical servers to be a 3-D object with the memory, CPU, and network as dimensions while ignoring the storage component presuming the VM migration to be in LAN network where the storage is shared. As it is expected to have datacenters on the edge of the network in the MEC platform, it is more likely to not have shared storage spanning across multiple Datacenters (DCs). Thus, the metric should be altered to include the storage and represent the used volume of a four-dimensional virtual machine or physical server, where the memory, storage, CPU, and network are the dimensions (Equation (28)). The available volume of a host can be defined as in Equation (29).
U s e d V o l u m e = U c p u · U m e m · U n e t · U s t o
A v a i l a b l e V o l u m e = ( 1 U c p u h ) · ( 1 U m e m h ) · ( 1 U n e t h ) · ( 1 U s t o h )
For this problem formulation approach, we define a metric called VM resource provisioning, which can be expressed as in Equation (30).
P = V M U s e d V o l u m e H o s t A v a i l a b l e V o l u m e = ( U r v ( h ) ) ( 1 U r h )
with r { c p u , m e m o r y , s t o r a g e , n e t w o r k } .
The optimization problem is then defined as in Equation (31)
min(P), subject to:
U r v ( h ) < 1 U r h D < S L A D e l a y L i m i t
where r { c p u , m e m , s t o , n e t }

5. Evaluation

In this section, the proposed decision-making algorithms are evaluated, one is further evaluated against two reference approaches, which are: static deployment (no migration), and the always migrate strategy.

5.1. Experimental Setup

For the purpose of evaluating the performance of the decision making policies proposed, while allowing the creation of richer and larger dimension scenarios, we resorted to the well established EdgeCloudSim [34] simulator.
Figure 2 illustrates the topology used for this evaluation. The scenario assumes a multi-tier network managed by a single administrative domain. The tiers are: the base tier, which includes all mobile devices; the second tier or the VE with a distributed edge orchestrator; and finally a global cloud tier. This last tier would correspond to a compute ecosystem in a public cloud, outside the telecom operation administrative domain.
Mobile users at the base tier are moving through the network following different paths and crossing locations, which are assumed to have different attractiveness levels. The attractiveness level affects the dwell time of the location, i.e., the time a mobile device spends in this place. Mobile users are connected to the network via a wireless connection, and each user uses a certain service offloaded to the edge infrastructure. Five types of services are distinguished in our scenario, where the main difference lies in the amount of resources provisioned for the service VM, and its typical task profile. These specifications are further detailed in Table 1 and Table 2, and represent relevant tasks that can be executed in a MEC environment. While they do not strictly correspond to commercial applications, they can be seem as stereotypes of applications of a specific behaviour. The tasks are generated according to a Poisson distribution via active/idle task generator model.
The VE tier consists of fourteen Edge Datacenters (EDCs) located in a region. For simplification, we assume each EDC to encompass a single host with, but the results are valid for more complex scenarios with multiple hosts as this host simply represents some computation capacity. EDCs can reach the global cloud through a WAN connection with a propagation delay of 10 ms. This value was obtained by sampling key Telecom agnostic datacenters in Portugal, representing a computation facility that is nearby, but outside the Telecom operator domain.
The global cloud represents global cloud servers typically provided by the cloud service providers such as Google Cloud Platform (GCP), Amazon Web Services (AWS), or Microsoft Azure.
The edge orchestrator has updated information regarding the status of the edge servers and the network resources. This orchestrator can be a centralized entity or it can be distributed, where each EDC has an orchestration agent that monitors the resource use on the associated EDC and receives information from the orchestration agents on the neighboring EDCs. In our scenario, the orchestrator is the entity responsible for tasks scheduling, where the tasks from different users are sent to a rendezvous point (such as load balancer) first, and then are forwarded to the corresponding VM. The selection of a VM considers the existing pool and new VMs can be placed (new allocation or migration), depending on the strategy employed as described in Algorithm 1. The migration decision is assisted every time a user submits a task to the rendezvous point.
The simulation settings regarding the network hosts, applications and VMs sizing are detailed in Table 1 and Table 2.
The users are assumed to be using one of the following applications (a) Augmented reality App: like a real time video processing with augmentation, where a stream of inertial data is sent, a augmentation algorithm is used to provide further information, and a result is returned. (b) Health App: such as a sports bracelet monitoring heartbeat or determining the sleep state, where chunks of data are sent periodically and the return consists of another data object. (c) Heavy computation App: like taking a picture, sending this picture to be used by a ML algorithm that identifies faces, objects or landmarks, providing some data as a result. (d) Infotainment App: like searching for words or getting pictures related to specific terms. Each VM in the network is associated to a single user and instantiated or migrated in accordance to its user´ mobility and the migration policy deployed. Due to the limitations in the simulation environment, the VMs and tasks specifications are determined to resemble the different requirements of these applications to correspond in size to the simulator limitations. Once again, the task specification should be considered as stereotypes for possible applications.

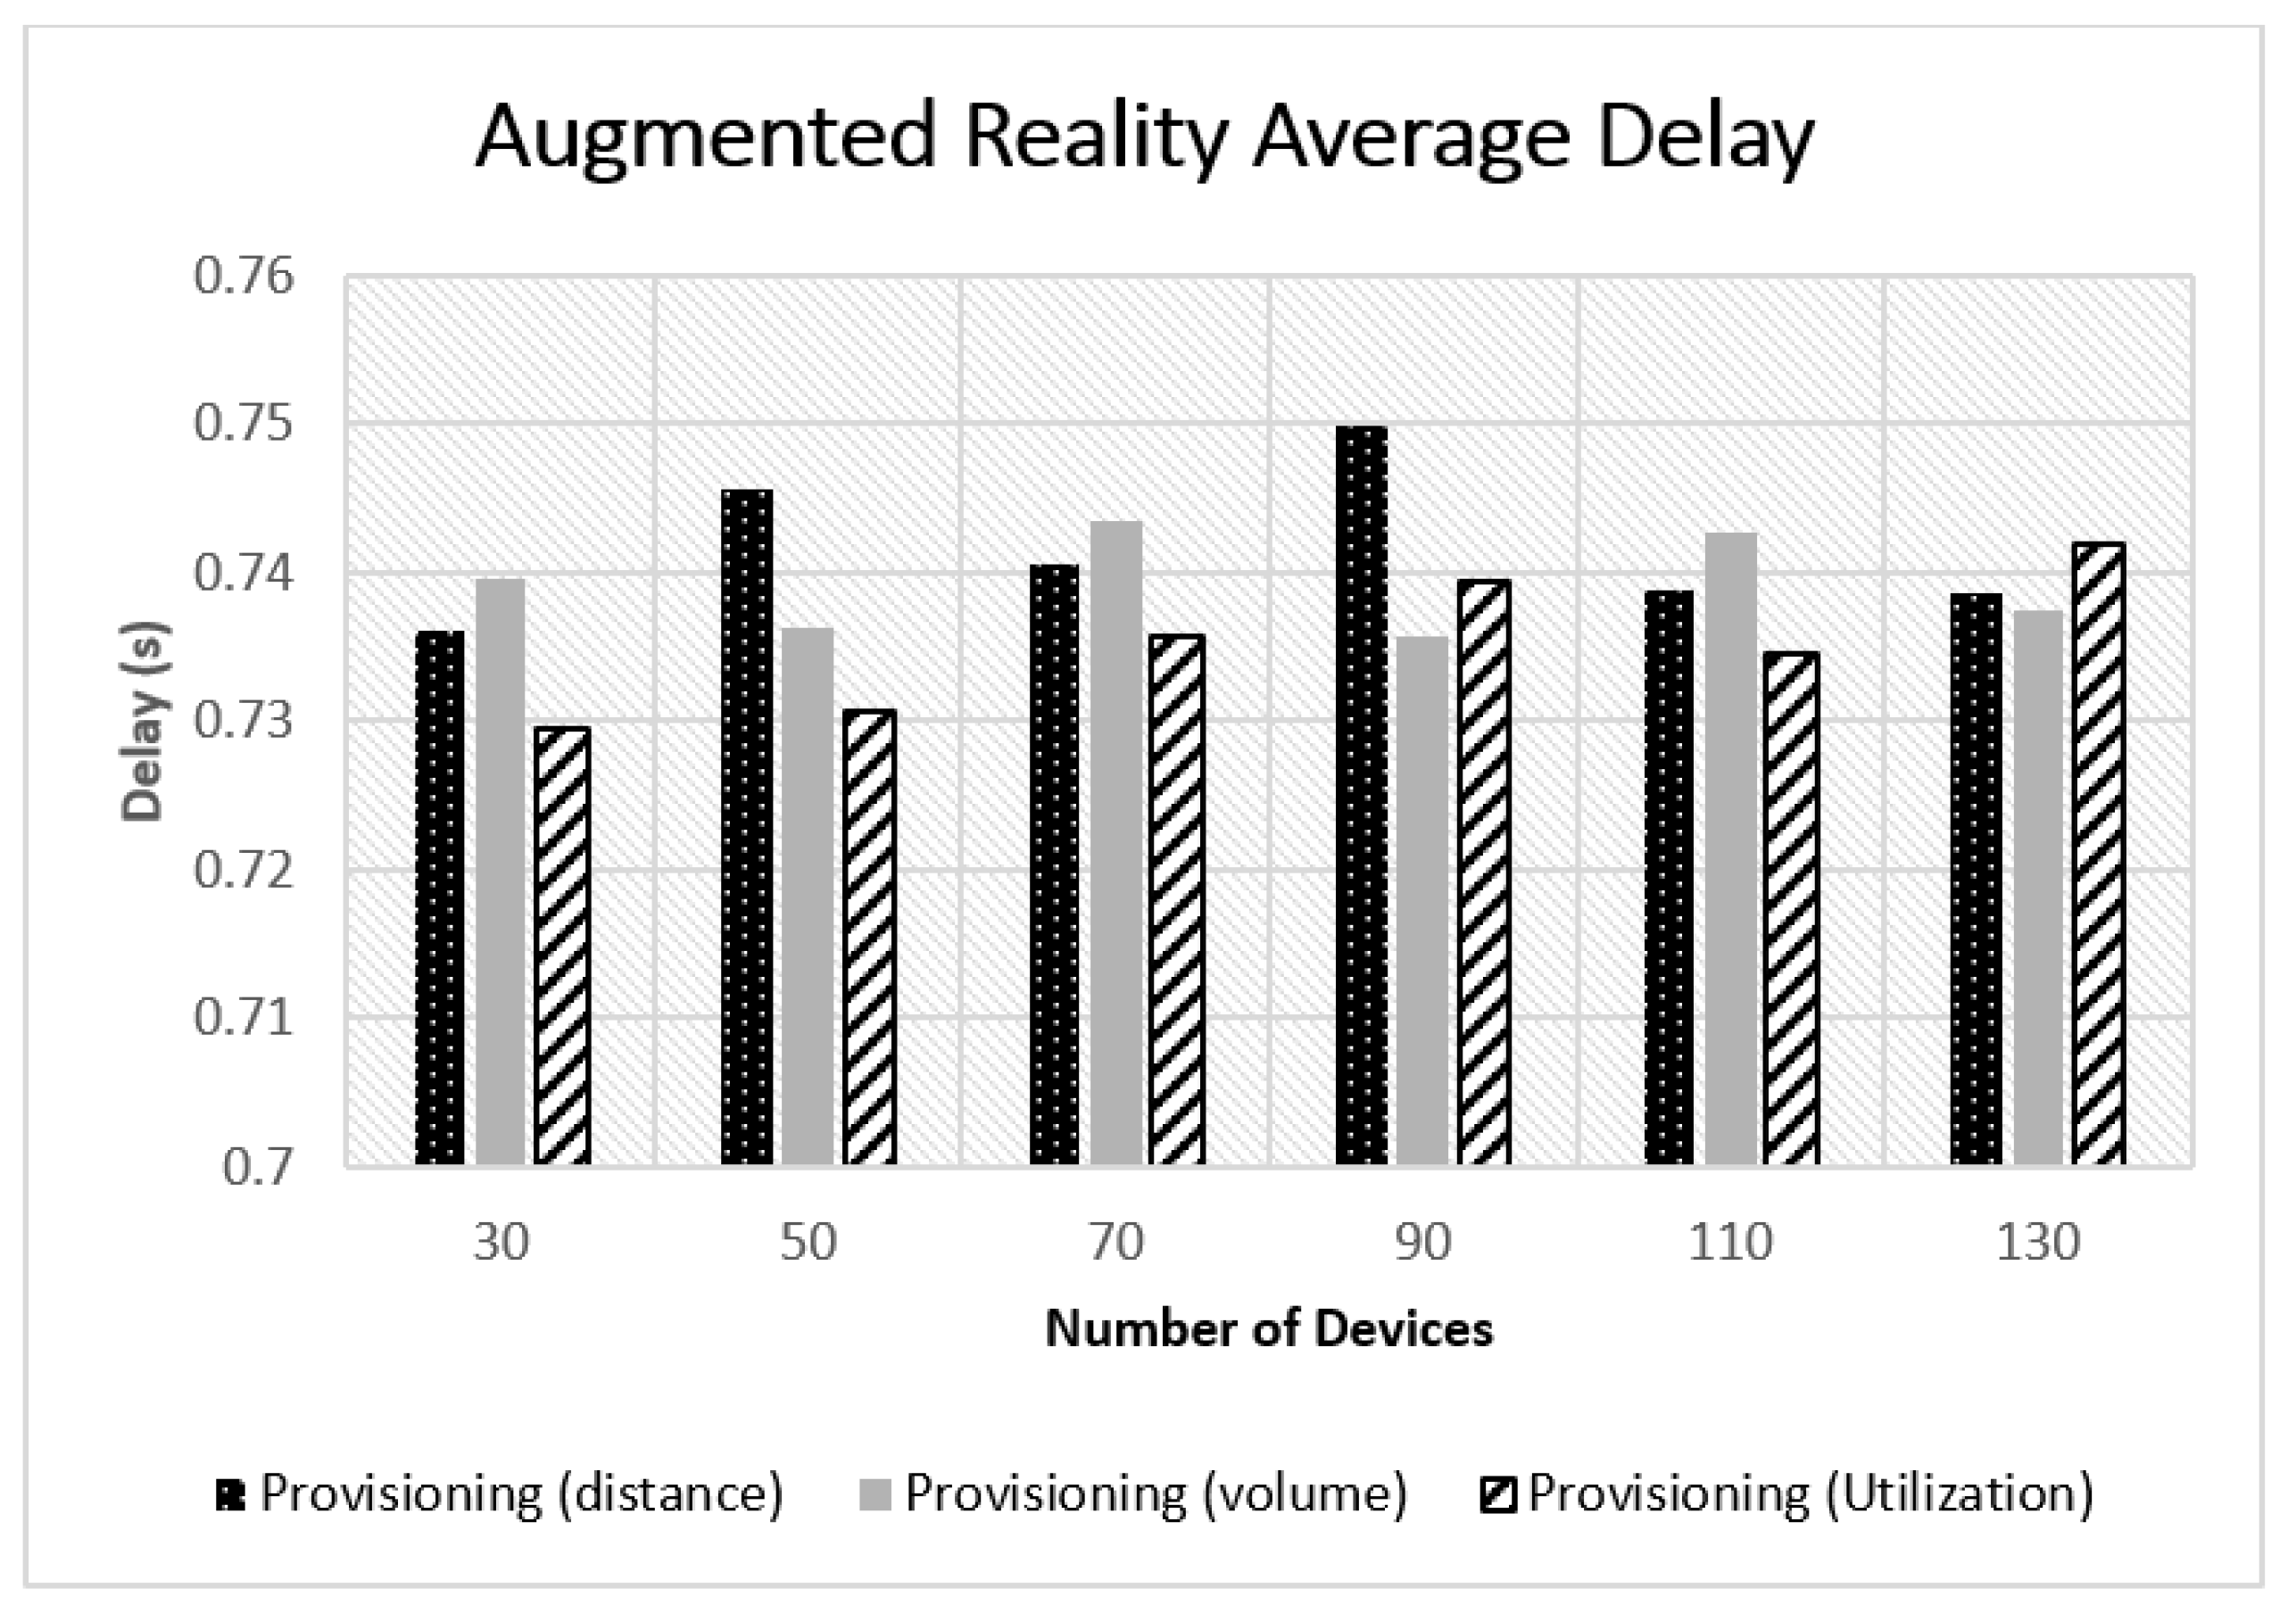
5.2. Experimental Results

We compare the proposed service migration strategies performance in regards to the UE experienced delay to the performance of two reference approaches. The pseudocode of these algorithms are illustrated in (Algorithm 1). Since several processes as well as tasks sizing are randomized, each simulation was executed 10 times, and all results in this paper are taken as the average results from the different runs.
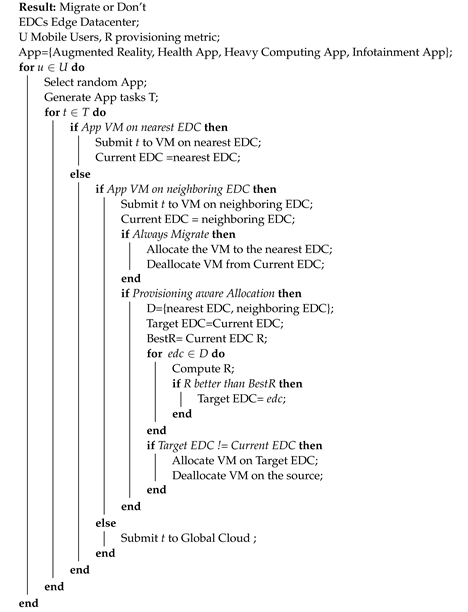
Algorithm 1: Migration Strategies Algorithms.
Jsan 09 00058 i001
In the case of always migrate approach, the service task is offloaded to the VM associated with the mobile user. When this VM is not located on the host closest to the user, the migration will be triggered to move the VM closer to the user in a reactive manner. When there is no VM associated with the user on the VE tier, then the task will be offloaded to the global cloud provider.
In the never migrate approach, the tasks are offloaded to the VM corresponding to the mobile user on the VE. When there is no associated VM on the edge, the tasks are offloaded to the global cloud provider, Figure 3 demonstrates the average service delay experienced by mobile users when applying the always migrate, never migrate, and provisioning based migration algorithms. More specifically, it demonstrates the result of the use based problem formulation.
Although different service typologies are used in the simulation scenario, all were evaluated, for the sake of readability, only the delay experienced by a single service type depicted in Figure 4. Similar results were obtained for the remaining service types.
Since implementing our methods calls for identifying a delay threshold, the SLA delay value is chosen as three times the average E2E delay needed for the task of the corresponding type of service. For example, for a single augmented reality task, the E2E delay is the summation of the processing delay Equation (9) and communication delay Equation (6) and task scheduling delay which we considered to have a random value of 0.05 s. This value could be adjusted by a network provider according to the latency bounds observed in its network, and should be considered as valid only for relative comparisons. Thus, the SLA delay value for augmented reality is defined as 900 ms, which is calculated according to Equation (32).
E 2 E = D p r o c e s s i n g + D c o m m u n i c a t i o n + D t a s k S c h e d u l i n g E 2 E = ( 3000 / ( 2 × 7000 ) ) + ( ( 1500 + 25 ) / 40,000 ) + 0.05 0.3 s S L A l i m i t 0.9 s
We observed that applying always migrate performs better when the number of devices in the network is low. The provisioning-based approach attained results close to those of the always migrate approach when the number of devices is low. However, it attained better results than both always and never migrate algorithms when the network encompasses more devices as shown in Figure 3 and Figure 4. Further inspections on these results showed that network delay was the dominant factor in the experienced delay as shown in Figure 5. The network delay was almost static when applying the provisioning-based migration. The network delay of the always and never migrate approaches increased exponentially with the number of mobile users in the network. This was mainly due to the existence of more traffic to be forwarded to far away nodes or to the global cloud in the case of never migrate, as the users are going further away from their associated VMs. Figure 6 illustrates the rapid increase of MAN and WAN delays when the number of nodes increases. Thus, emphasizing that more traffic was forwarded to remote nodes or to the global cloud in the case of always migrate and never migrate strategies.
Similarly, we found the network delay to be the principal contributor to the delay witnessed in the case of always migration when the number of devices is increased. This was due to the inefficient use of resources, thus, the incapability of migrating all the VMs following their correspondent users. As many migration processes were aborted due to the hosts resources limitation and the inability to allocate enough resources to all migrating VMs. Therefore, more tasks were sent to the cloud or to hosts farther away, resulting in higher network delay. Meanwhile, due to the efficient resource use achieved when applying a provisioning-based migration algorithm, we found the number of successful migrations to surpasses the number of successful migrations when applying always migrate. This is further illustrated in Figure 7. This leads to satisfying users´ needs more adequately resulting in lower delay values. Although provisioning-based approach performed better than the two reference algorithms, the results indicate that opting for always migrate strategy attains better results when there are fewer number of mobile users in the network. In that case the network resources allow for more VM migration requests to be executed successfully.
Figure 8, shows the results of comparing the three provisioning-aware approaches regarding the user experienced delay in the case of augmented reality service. We observe that all three approaches obtained similar results with a maximum difference of about 10 ms.
The results obtained from the previous experiments also highlighted some essential issues. For example, identifying the weight of the resource is of high importance. For the simulation scenario, it was assumed that all resources have the same weight (1 in this case). However, we noticed that the storage and memory were quickly exhausted on the hosts due to VM migrations, whereas the BW and CPU were not consumed as fast. This creates a higher number of storage and memory hotspots than BW or CPU hotspots. In a real deployment the exhaustion could target other metric besides memory, but it remains the issue that one type of resource may be exhausted before others. This intensifies the importance of identifying precise weights for the different resources, which is normally the responsibility of the network manager, and maybe changed as a result of processing monitoring data.
Furthermore, we carried out several tests with different application settings regarding the tasks upload and download data. We noticed that, for applications with small data size to be transmitted and when the Edge nodes are connected via high-speed connection compared to the data size, the static placement was actually a good approach as for such applications the communication delay has little effect on the overall end to end delay. Thus, forwarding the data from the serving edge node to the computing edge node or to the global cloud has achieved better results than migrating the VM. In fact, performing a migration leads to worsening the processing delay. Thus, in such cases, the static placement performed better than both always migrate and provisioning-based migration. Static placement, however, suffers from underused resources on the edge nodes and putting more pressure on the core cloud.

6. Conclusions and Future Work

In this paper, we first formulated a mathematical model to compute the E2E delay experienced by mobile users in a virtualized edge environment. Then, we proposed three dynamic VM allocation cost problems with the attempt to realize the least resource provisioning for the VM on the host while fulfilling the E2E delay limits in accordance with the SLA. The proposed policies are then compared with two reference models namely, never migrate and always migrate. The results showed that applying the proposed approaches can obtain better results particularly when the number of clients increases. In future work, we plan to extend our work by investigating the ideal manner to identify the resource weighs. Furthermore, we plan to perform a study to determine the optimal time interval between the multiple executions of the migration decision process.

Author Contributions

Conceptualization, methodology, validation, analysis, H.A.; funding acquisition, review, editing, J.P.B.; supervision, J.P.B. and R.L.A. All authors have read and agreed to the published version of the manuscript.

Funding

This work is partially funded by the IT—Instituto de Telecomunicações, and FCT - Fundação para a Ciência e a Tecnologia under Grant SFRH/BD/136361/2018, by FCT/MCTES through national funds, and when applicable co-funded EU funds under the project UIDB/50008/2020-UIDP/50008/2020.

Conflicts of Interest

The authors declare no conflict of interest. The funders had no role in the design of the study; in the collection, analyses, or interpretation of data; in the writing of the manuscript, or in the decision to publish the results.

References

  1. Kikuchi, J.; Wu, C.; Ji, Y.; Murase, T. Mobile edge computing based VM migration for QoS improvement. In Proceedings of the 2017 IEEE 6th Global Conference on Consumer Electronics (GCCE), Nagoya, Japan, 24–27 October 2017; pp. 1–5. [Google Scholar]
  2. Yunoki, K.; Shinbo, H. Carry-on state service handover between edge hosts for latency strict applications in mobile networks. In Proceedings of the 2018 21st International Symposium on Wireless Personal Multimedia Communications (WPMC), Chiang Rai, Thailand, 25–28 November 2011; pp. 472–477. [Google Scholar]
  3. Kikuchi, J.; Wu, C.; Ji, Y.; Murase, T. VM Migration in Mobile Edge Computing for QoS Improvement with Wireless Multi-Hop Access Networks. In Proceedings of the 12th International Conference on Ubiquitous Information Management and Communication, Langkawi, Malaysia, 5–7 January 2018; pp. 1–8. [Google Scholar]
  4. Choi, H.W.; Kwak, H.; Sohn, A.; Chung, K. Autonomous learning for efficient resource utilization of dynamic VM migration. In Proceedings of the 22nd Annual International Conference on Supercomputing, Island of Kos, Greece, 7–12 June 2008; pp. 185–194. [Google Scholar]
  5. Seth, S.; Singh, N. Dynamic threshold-based dynamic resource allocation using multiple VM migration for cloud computing systems. In International Conference on Information, Communication and Computing Technology; Springer: Singapore, 2017; pp. 106–116. [Google Scholar]
  6. Feng, Y.; Li, B.; Li, B. Bargaining towards maximized resource utilization in video streaming datacenters. In Proceedings of the 2012 Proceedings IEEE INFOCOM, Orlando, FL, USA, 25–30 March 2012; pp. 1134–1142. [Google Scholar]
  7. Farahnakian, F.; Pahikkala, T.; Liljeberg, P.; Plosila, J.; Tenhunen, H. Utilization prediction aware VM consolidation approach for green cloud computing. In Proceedings of the 2015 IEEE 8th International Conference on Cloud Computing, New York, NY, USA, 27 June–2 July 2015; pp. 381–388. [Google Scholar]
  8. Bazarbayev, S.; Hiltunen, M.; Joshi, K.; Sanders, W.H.; Schlichting, R. Content-based scheduling of virtual machines (VMs) in the cloud. In Proceedings of the 2013 IEEE 33rd International Conference on Distributed Computing Systems, Philadelphia, PA, USA, 8–11 July 2013; pp. 93–101. [Google Scholar]
  9. Lawton, K.P.; Vlaovic, S. Using Memory Equivalency Across Compute Clouds for Accelerated Virtual Memory Migration And Memory De-Duplication. U.S. Patent Application 12/368,247, 13 August 2009. [Google Scholar]
  10. Sapuntzakis, C.P.; Chandra, R.; Pfaff, B.; Chow, J.; Lam, M.S.; Rosenblum, M. Optimizing the migration of virtual computers. ACM SIGOPS Oper. Syst. Rev. 2002, 36, 377–390. [Google Scholar] [CrossRef] [Green Version]
  11. Bozek, J.J.; Hansson, N.P.J.; Suffern, E.S.; Wooldridge, J.L. Virtual Machine Placement to Improve Memory Utilization. U.S. Patent 8,490,091, 16 July 2013. [Google Scholar]
  12. Waldspurger, C.; Colbert, O.K.; Chen, X.; Venkatasubramanian, R. Page Signature Disambiguation for Increasing the Efficiency of Virtual Machine Migration in Shared-Page Virtualized Computer Systems. U.S. Patent 7,925,850, 12 April 2011. [Google Scholar]
  13. Wood, T.; Tarasuk-Levin, G.; Shenoy, P.; Desnoyers, P.; Cecchet, E.; Corner, M.D. Memory buddies: Exploiting page sharing for smart colocation in virtualized data centers. ACM SIGOPS Oper. Syst. Rev. 2009, 43, 27–36. [Google Scholar] [CrossRef]
  14. Frank, S.; Baron, A. Hashing Storage Images of a Virtual Machine. U.S. Patent 8,701,106, 15 April 2014. [Google Scholar]
  15. Taleb, T.; Ksentini, A. Follow me cloud: Interworking federated clouds and distributed mobile networks. IEEE Netw. 2013, 27, 12–19. [Google Scholar] [CrossRef]
  16. Rodrigues, T.G.; Suto, K.; Nishiyama, H.; Kato, N. Hybrid method for minimizing service delay in edge cloud computing through VM migration and transmission power control. IEEE Trans. Comput. 2016, 66, 810–819. [Google Scholar] [CrossRef]
  17. Zhang, J.; Ren, F.; Lin, C. Delay guaranteed live migration of virtual machines. In Proceedings of the IEEE INFOCOM 2014-IEEE Conference on Computer Communications, Toronto, ON, Canada, 27 April–2 May 2014; pp. 574–582. [Google Scholar]
  18. Hennessy, J.L.; Patterson, D.A. Computer Architecture: A Quantitative Approach; Elsevier: Amsterdam, The Netherlands, 2011. [Google Scholar]
  19. Ge, J.; He, Q.; Fang, Y. Cloud computing task scheduling strategy based on improved differential evolution algorithm. In AIP Conference Proceedings; AIP Publishing: Melvile, NY, USA, 2017; Volume 1834, p. 040038. [Google Scholar]
  20. Cho, K.M.; Tsai, P.W.; Tsai, C.W.; Yang, C.S. A hybrid meta-heuristic algorithm for VM scheduling with load balancing in cloud computing. Neural Comput. Appl. 2015, 26, 1297–1309. [Google Scholar] [CrossRef]
  21. Li, K.; Xu, G.; Zhao, G.; Dong, Y.; Wang, D. Cloud task scheduling based on load balancing ant colony optimization. In Proceedings of the 2011 Sixth Annual ChinaGrid Conference, Liaoning, China, 22–23 August 2011; pp. 3–9. [Google Scholar]
  22. Bian, S.; Huang, X.; Shao, Z. Online task scheduling for fog computing with multi-resource fairness. In Proceedings of the 2019 IEEE 90th Vehicular Technology Conference (VTC2019-Fall), Honolulu, HI, USA, 22–25 September 2019; pp. 1–5. [Google Scholar]
  23. Little, J.D. A proof for the queuing formula: L = λ W. Oper. Res. 1961, 9, 383–387. [Google Scholar] [CrossRef]
  24. Sztrik, J. Basic queueing theory. Univ. Debrecen, Fac. Inform. 2012, 193, 60–67. [Google Scholar]
  25. Clark, C.; Fraser, K.; Hand, S.; Hansen, J.G.; Jul, E.; Limpach, C.; Pratt, I.; Warfield, A. Live migration of virtual machines. In Proceedings of the 2nd Conference on Symposium on Networked Systems Design & Implementation, Boston, MA, USA, 2–4 May 2005; USENIX Association: Berkeley, CA, USA; Volume 2, pp. 273–286. [Google Scholar]
  26. VMware Inc. VMware VirtualCenter—Centralized Management, Automation and Optimization for IT Infrastructure; Product Datasheet, VMware Inc.: Palo Alto, CA, USA; Available online: https://www.vmware.com/pdf/vc_datasheet.pdf (accessed on 30 September 2019).
  27. Hines, M.R.; Gopalan, K. Post-copy based live virtual machine migration using adaptive pre-paging and dynamic self-ballooning. In Proceedings of the 2009 ACM SIGPLAN/SIGOPS International Conference on Virtual Execution Environments, Washington, DC, USA, 11–13 March 2009; pp. 51–60. [Google Scholar]
  28. Wood, T.; Ramakrishnan, K.; Shenoy, P.; Van der Merwe, J. CloudNet: Dynamic pooling of cloud resources by live WAN migration of virtual machines. In ACM Sigplan Notices; ACM: New York, NY, USA, 2011; Volume 46, pp. 121–132. [Google Scholar]
  29. Akoush, S.; Sohan, R.; Rice, A.; Moore, A.W.; Hopper, A. Predicting the performance of virtual machine migration. In Proceedings of the 2010 IEEE International Symposium on Modeling, Analysis and Simulation Of Computer And Telecommunication Systems, Miami Beach, FL, USA, 17–19 August 2010; pp. 37–46. [Google Scholar]
  30. Xen Project Schedulers. Available online: https://wiki.xenproject.org/wiki/Xen-Project-Schedulers (accessed on 30 September 2019).
  31. Wood, T.; Shenoy, P.J.; Venkataramani, A.; Yousif, M.S. Black-box and Gray-box Strategies for Virtual Machine Migration. In Proceedings of the NSDI 2007—4th US ENIX Symposiumon Networked Systems Design & Implementat, Cambridge, MA, USA, 11–13 April 2007; Volume 7, p. 17. [Google Scholar]
  32. Wood, T.; Shenoy, P.; Venkataramani, A.; Yousif, M. Sandpiper: Black-box and gray-box resource management for virtual machines. Comput. Netw. 2009, 53, 2923–2938. [Google Scholar] [CrossRef]
  33. Mishra, M.; Sahoo, A. On theory of VM placement: Anomalies in existing methodologies and their mitigation using a novel vector based approach. In Proceedings of the IEEE 4th International Conference on Cloud Computing, Washington, DC, USA, 4–9 July 2011; pp. 275–282. [Google Scholar]
  34. Sonmez, C.; Ozgovde, A.; Ersoy, C. EdgeCloudSim: An environment for performance evaluation of edge computing systems. Trans. Emerg. Telecommun. Technol. 2018, 29, e3493. [Google Scholar] [CrossRef]
Figure 1. Delay types in multi-access edge computing.
Jsan 09 00058 g001
Figure 2. Network topology.
Jsan 09 00058 g002
Figure 3. Always, never, and provisioning-based migrations comparison.
Jsan 09 00058 g003
Figure 4. Augmented reality average E2E delay for different algorithms.
Jsan 09 00058 g004
Figure 5. Network average delay for different algorithms.
Jsan 09 00058 g005
Figure 6. MAN and WAN average delay for different algorithms.
Jsan 09 00058 g006
Figure 7. Comparing always migrate and provisioning-based successful migrations numbers.
Jsan 09 00058 g007
Figure 8. Provisioning-based algorithms comparison.
Jsan 09 00058 g008
Table 1. Hosts and VMs settings.
EntityCPU
( P e × m i p s )
Ram
(Gb)
Storage
(Gb)
BW
(Mbps)
RAM
Commonality
%
Storage
Commonality
%
Edge Host( 16 × 10,000 )12300 --
Augmented Reality( 2 × 7000 )1.540401040
Health App VM( 1 × 6000 )130302040
Heavy Computing App VM( 3 × 10,000 )250503030
Infotainment APP VM( 1 × 5000 )120255015
Table 2. Applications settings.
AppActive Period
(s)
Idle Period
(s)
Avg Data Upload
(KB)
Avg Data Download
(KB)
Avg Task Length
(MI)
Augmented Reality40201500253000
Health App45902012501000
Heavy Computing App6012025002004500
Infotainment App30452510001500
Publisher’s Note: MDPI stays neutral with regard to jurisdictional claims in published maps and institutional affiliations.

