Article

Prototyping and Validation of MEMS Accelerometers for Structural Health Monitoring—The Case Study of the Pietratagliata Cable-Stayed Bridge

Department of Engineering and Architecture, University of Trieste, Piazzale Europa 1, 34127 Trieste, Italy
*
Author to whom correspondence should be addressed.
J. Sens. Actuator Netw. 2018, 7(3), 30; https://doi.org/10.3390/jsan7030030
Submission received: 23 June 2018 / Revised: 16 July 2018 / Accepted: 24 July 2018 / Published: 27 July 2018

Abstract

:
In recent years, thanks to the simple and yet efficient design, Micro Electro-Mechanical Systems (MEMS) accelerometers have proven to offer a suitable solution for Structural Health Monitoring (SHM) in civil engineering applications. Such devices are typically characterised by high portability and durability, as well as limited cost, hence resulting in ideal tools for applications in buildings and infrastructure. In this paper, original self-made MEMS sensor prototypes are presented and validated on the basis of preliminary laboratory tests (shaking table experiments and noise level measurements). Based on the well promising preliminary outcomes, their possible application for the dynamic identification of existing, full-scale structural assemblies is then discussed, giving evidence of their potential via comparative calculations towards past literature results, inclusive of both on-site, Experimental Modal Analysis (EMA) and Finite Element Analytical estimations (FEA). The full-scale experimental validation of MEMS accelerometers, in particular, is performed using, as a case study, the cable-stayed bridge in Pietratagliata (Italy). Dynamic results summarised in the paper demonstrate the high capability of MEMS accelerometers, with evidence of rather stable and reliable predictions, and suggest their feasibility and potential for SHM purposes.

1. Introduction, State-of-the-Art and Objectives

Nowadays, buildings and infrastructure are designed to sustain ordinary or extreme dynamic loads (such as wind, traffic, earthquakes, impacts, etc.), whose magnitude is determined from probabilistic approaches (i.e., EN 1991 [1]). In most of the cases, simplified design methods and simulation techniques are conventionally used, to describe the mechanical features of different structural typologies. However, their actual structural behaviour (i.e., fundamental period, vibration shapes, etc.) is properly assessed for a limited number of cases only, i.e., for critical buildings and infrastructures whose integrity and serviceability is of high importance for public safety and civil protection. Only a few of these strategic constructional facilities are then equipped with continuous monitoring systems.
The information that is typically obtained from structural monitoring tools, in this regard, is of fundamental importance in view of the consequences associated to possible collapse phenomena. Those systems provide in fact the authorities with a careful evaluation of the damage evolution, supporting the planning of the restoration interventions (e.g., [2,3,4,5], etc.). Structural Health Monitoring (SHM) and non-destructive testing have key roles for structural systems in operational conditions, for monumental buildings ([6,7,8], etc.), industrial facilities, or aerospace components [9,10,11,12,13], tunnels, and underground environments [14,15].
Several research efforts have been devoted in the last decade to the development of reliable and cost-effective monitoring devices equipped with Micro Electro-Mechanical Systems (MEMS). MEMS technology has evolved considerably, leading to a general improvement of the sensors performance, as well as to a price minimization [16,17]. Comparative experimental studies of literature report a 1-to-10 cost ratio of MEMS, with respect to traditional piezoelectric accelerometers (i.e., [18,19], etc.). MEMS-based systems, in addition, proved to be efficient for several types of dynamic applications. Dynamic measurements of human body movements, for example, were carried out via MEMS accelerometers by Benevicius et al. [20]. Hand-arm and whole-body MEMS-based vibration records were critically discussed, aiming at investigating the reliability of MEMS techniques for biomedical applications. The so-called bioMEMS gave evidence of their potential for the medical field especially, in the last five years [21]. At the same time, MEMS accelerometers proved to be efficient also for vibration monitoring in industrial machines and rotors (e.g., [22,23,24,25], etc.).
Since the 1990s, major efforts and well-promising results were reported in the literature from the application of MEMS accelerometers in the SHM of civil engineering facilities, as well as in the early-bird monitoring of seismological hazards. In the first case, MEMS systems have been efficiently used for the monitoring of strong-motion events in rigid structures, but positive efforts have been also achieved from continuous MEMS measurements of flexible structures (such as vehicular and pedestrian bridges), as deeply discussed in several research papers. Bassoli et al. [26] reported on the dynamic identification of an ancient masonry bell tower in Italy, seriously damaged after the Emilia earthquake of 2012 and subjected to experimental tests after the retrofitting interventions. Dynamic tests were carried out based on a MEMS acquisition system, including comparative measurements and a critical discussion of experimental results, as derived from the installed MEMS-based system or from traditional analogue instruments. This study is in line with the investigation presented in [27], where numerical model updating is carried out for ancient masonry bell towers, based on continuous SHM via a wired piezoelectric sensor network (commercially available, mono-axial accelerometers).
Feng et al. [28] explored the potential use of smartphone accelerometers for measuring the structural vibrations in buildings, hence as active instruments for SHM and post-event damage diagnostics. The shake table tests discussed in [28] gave evidence of well promising MEMS performances and results, both for low-amplitude ambient vibrations and high-amplitude seismic responses. Wargantiwar et al. [29] gave further evidence of the high potential of MEMS accelerometers, when working as earthquake alarm tools for buildings and civil engineering infrastructures. Major benefits were found in their typical low cost, limited power consumption and relatively small size. Kok et al. [30] experimentally assessed the accuracy of MEMS accelerometers for modal analysis purposes, giving evidence of maximum expected frequency errors up to 5%, within their working range. In [31,32], experimental shaking table tests are discussed for tri-axis MEMS accelerometers. The collected vibration data showed close agreement with the experimental measurements derived from commercial devices for SHM purposes. Beskhyroun and Ma [33] also presented an application of MEMS accelerometers for the experimental modal analysis of a high rise, reinforced concrete building subjected to strong aftershocks. The experimental study highlighted the high accuracy of MEMS accelerometers for the prediction of the modal parameters of the monitored building, compared to traditional testing instruments. A list of additional positive MEMS applications for the SHM and dynamic identification of civil engineering constructions, including wireless options, can be found in the literature (see for example [30,34,35,36,37]). In [38], the use of MEMS devices is proposed for the SHM of a suspension bridge in Istanbul. Domaneschi et al. [39] also explored the seismic performance of the Shimotsui-Seto suspension bridge in Japan. In [39], two MEMS sensor families (with low- and high-density noise levels) were taken into account, giving evidence of the related effects and sensitivity of measurements for localised damage detection purposes. The same suspension bridge was further numerically investigated in [40] under wind excitation, exploring the MEMS noise effects on the damage detection, for different scenarios of technical interest (i.e., damage location and severity).
A number of research projects aimed to assess the feasibility of MEMS applications in the form of seismological alarm systems can then be found in the literature. Dashti et al. [41], for example, explored the use of cellular phones as ground motion instruments, giving evidence of their accuracy as seismic monitoring devices via comparative shake table tests. Similar results are also reported in [42,43], etc.
In this context, the paper presents original self-made MEMS accelerometers, as a possible suitable tool for SHM of engineering systems and constructed facilities. Major features of the prototyped devices are first described in Section 2, including a preliminary experimental validation of the assembled sensors via shacking table tests and noise level measurements (see Section 3). The collected test measurements are compared with commercially available devices. The feasibility and potential of the proposed self-made MEMS sensors are then emphasized via a full-scale Experimental Modal Analysis (EMA) investigation, carried out on the cable-stayed bridge of Pietratagliata (Italy). Compared to existing literature efforts, the current study aims at further assessing the reliability of SHM via low-cost, portable MEMS sensors that could be used for the continuous, on-site monitoring of constructed facilities. The selected bridge was opened to traffic in 2008, and is of particular interest for SHM and diagnostic purposes, due to its intrinsic dynamic behaviour. In addition, the bridge is representative of a strategic infrastructure located in a high seismic region. During 2010 and 2012, moreover, the bridge was affected by localised damage in two of the cables-to-deck connections, hence resulting in partial modification of its actual boundary conditions and suggesting detailed investigations with continuous data acquisition. In Section 4, for comparative purposes, MEMS experimental results are hence post-processed and assessed towards past EMA predictions and Finite Element Analytical (FEA) data available in the literature for the same structural system [44].

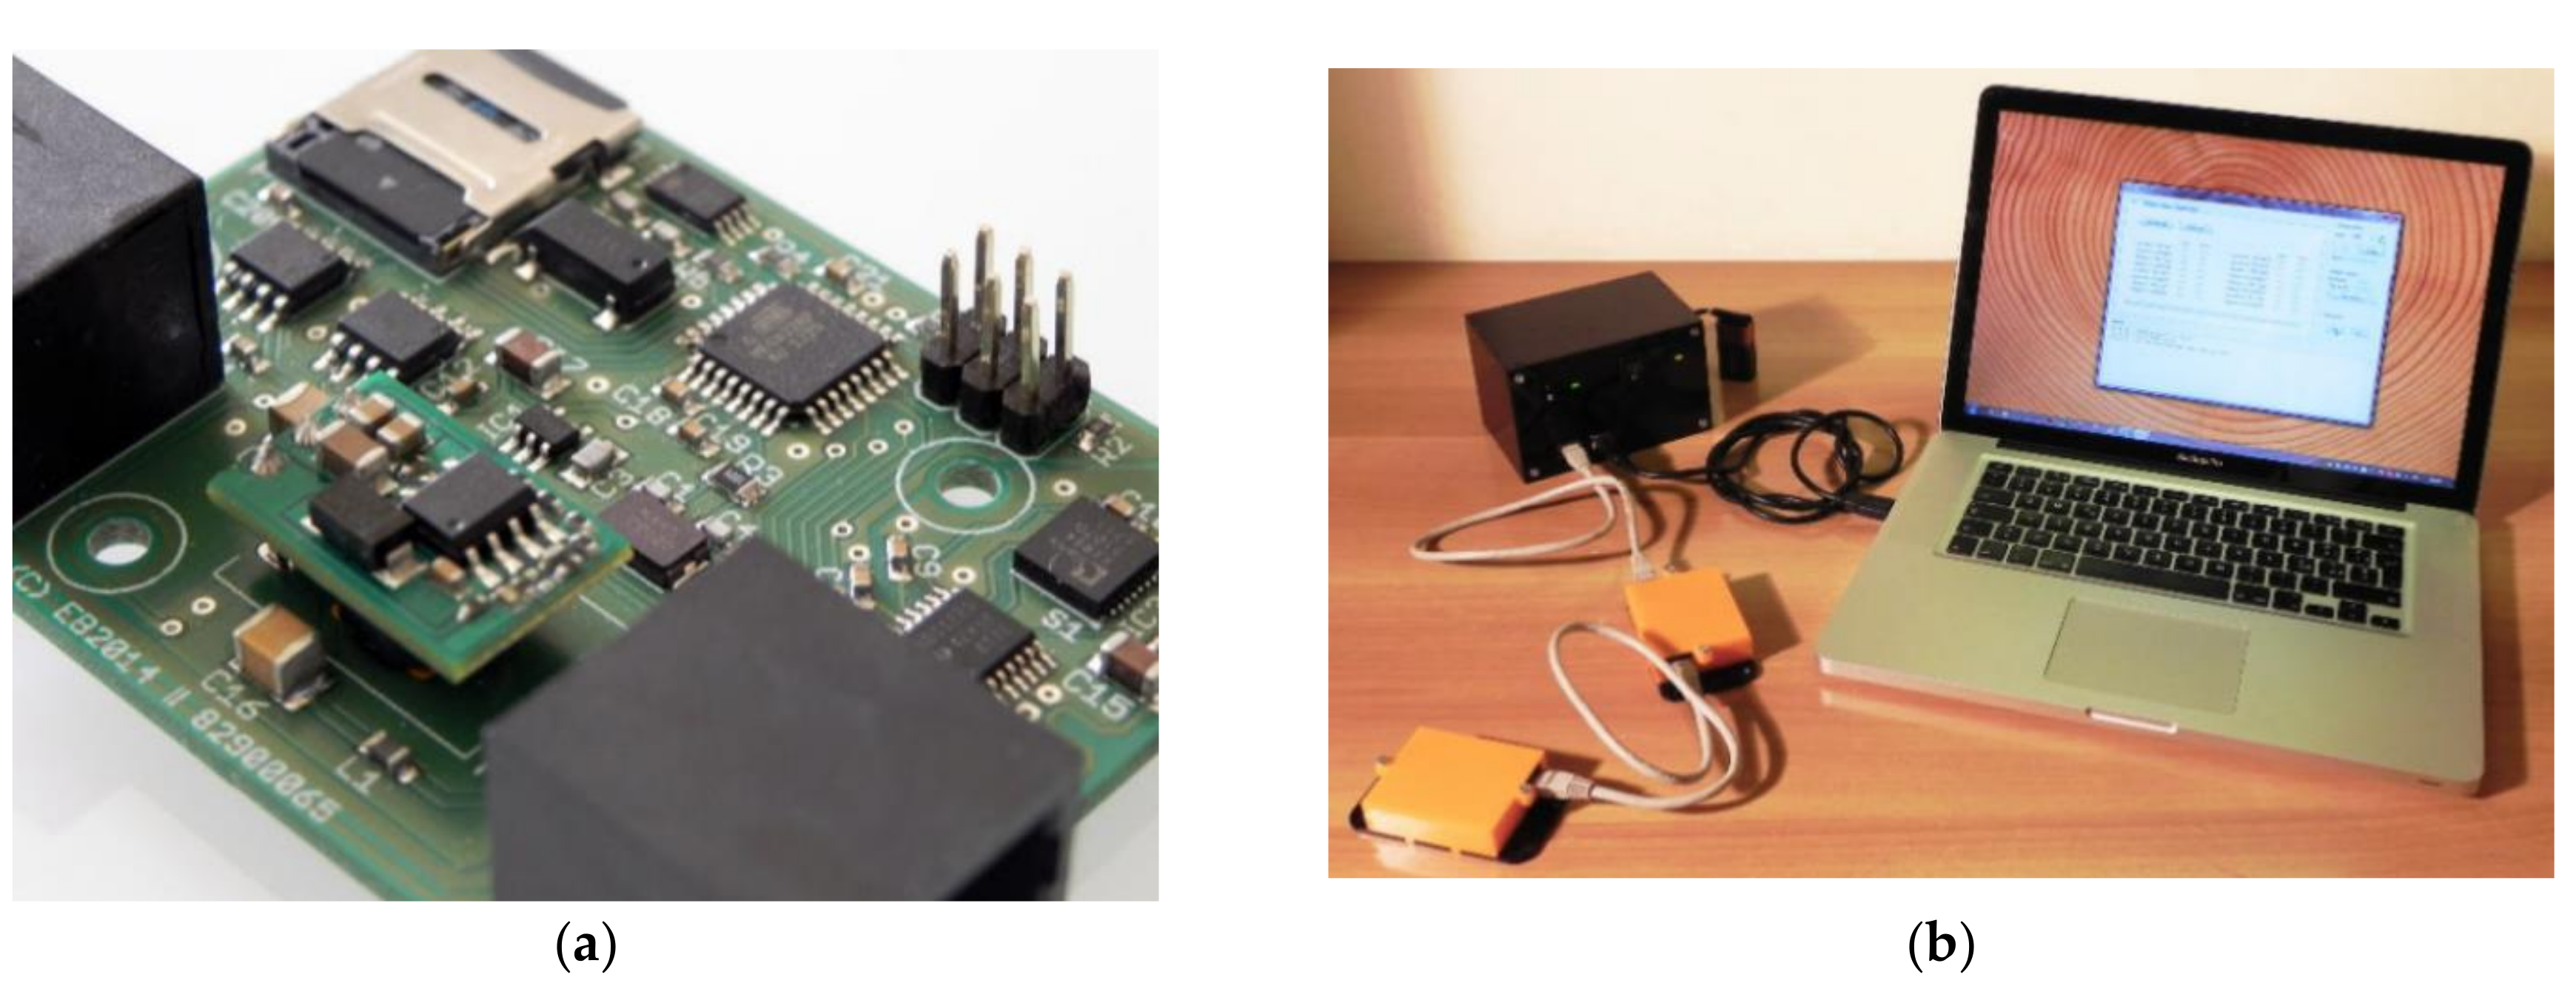
2. Measuring Devices

The typical measuring device considered in this study is composed of a printed circuit (PC) board with two RJ45 connectors for in-and-out connections (see Figure 1a). The main components of the PC board are:
(i)
a logic unit, programmed with the synchronisation and recording routines;
(ii)
an accelerometer;
(iii)
an Analogue-to-Digital Converter (ADC);
(iv)
a micro SD memory card, to store the recorded data;
(v)
a real-time clock, to keep the synchronisation between the devices consistent.
Each measuring device uses two CAT6 24AWG Ethernet cables with four couples of twisted wires: two couples of wires carry the power supply and the other two are used for the data transmission and the synchronisation signal.
The synchronisation of the devices is provided—prior to starting each registration—by a personal computer (Figure 1b), which sends data packets with the current date and time. Each data packet has a trigger, which activates the oscillators simultaneously. Furthermore, to ensure the consistence of the measurements when recording, a check square wave with 1 Hz frequency is sent from the personal computer and is recorded by each device. The sensors generate a square wave (1024 Hz), which allows collecting the input data at the sampling frequencies of 256 Hz, 128 Hz, and 64 Hz. The precision of the sensors strictly depends on the quality of the installed crystal, typically in the order of 20 ppm. Finally, in the post-processing phase, each synchronisation trace is compared with the reference trace and any small delay is corrected. Consequently, the alignment of the square wave recorded by each sensor with respect to the original signal is verified.
At the time of the prototyping, the accelerometer was chosen based on the most convenient trade-off between price and self-noise level. Several sensors were analysed before choosing the Kionix KXR94-2050 (Kionix, Inc.®, Ithaca, NY, USA), a tri-axis silicon micromachined accelerometer with a full-scale output range of ±2 g. The acceleration sensing is based on the principle of a differential capacitance arising from the acceleration-induced motion of the sensor. Furthermore, each board is equipped with an ADC Texas Instrument device, ADS1220 type (Texas Instruments, Dallas, TX, USA), which has a resolution of 24 bits and features two differential or four single-ended inputs through an input multiplexer. Table 1 lists the electrical properties of the chosen accelerometer and ADC.
The resolution R of the prototyped MEMS accelerometer is rationally calculated as follows:
R = 3.3   V 2 23   counts · 0.66   V / g = 0.596   µ g / count
where 0.66 V/g and 223 counts are the sensitivity and the quantisation levels available in each accelerometer, respectively, and 3.3 V is the operating voltage of the ADC. The electro-mechanical noise of the accelerometer, conversely, is evaluated using the nominal specifications declared by the supplier in the product datasheet. The theoretical root-mean-square (rms) noise is evaluated by filtering the noise density with a first-order low-pass 20 Hz filter leading to:
r m s = 45 µ g Hz · 20   Hz · 1.57 = 0.252   mg
In this context, the result of Equation (2) is a theoretical value; the actual electro-mechanical noise might be even higher, being influenced by the final layout of the PC board, the production techniques, the frequency of the power supply, and the temperature.

3. Laboratory Testing and Validation

3.1. Shaking Table Testing

Preliminary hardware tests were carried out at the University of Trieste (Italy), Department of Engineering and Architecture, aimed at assessing the accuracy of the measuring devices with respect to commercial products available on the market. Tests compared the output response of the PC boards (Figure 2a) with a reference accelerometer used for laboratory measurements, the PCB 356A16 type of Figure 2b. To this aim, three boards were randomly selected from the full set of instruments (S#1, S#2 and S#3 in Table 2) and were simultaneously mounted on a vertical shaking table, together with the PCB 356A16 accelerometer. The shaking table operates at a frequency range of 5–50 Hz, while the PCB 356A16 has a sensitivity of 100 mV/g, an acceleration range of ±50 g and a frequency range of 0.5–5000 Hz.
The experimental tests investigated the response of three randomly-selected PC boards (see Table 2), at the frequency of 5 Hz, 8 Hz, and 11 Hz. Such an interval of tested frequencies was taken into account to assess the reliability of MEMS measurements, in a sufficiently wide frequency range of interest for the SHM and dynamic identification of buildings and civil engineering infrastructures.
For each one of these frequencies, a two-minute recording was carried out at a sampling rate of 128 Hz. The shaking table was activated at the desired frequency and a recording window of 45 s was selected for comparative purposes, 60 s after the activation of the shaking to avoid the occurrence of transient starting frequencies. To optimise the experimental output and to assess the response of the accelerometers, three test setups were considered (i.e., one for each axis), resulting in 27 measurements (three axes multiplied by three sensors, multiplied by three frequencies).
Comparative test calculations and a correlation assessment between the recorded signals from all sensors were carried out using the Pearson’s correlation coefficients ρX,Y and the ratio between the root-mean-squares rmsX,Y of the prototypes (X) and the reference (Y) sensors, respectively. The ρX,Y coefficient, defined in Equation (3), measures the correlation between two variables X and Y, giving a value in the range from 1 to −1 and allowing to quantify the linearity and phase distortion of the tested sensors. The rmsX,Y (Equation (4)), conversely, is a statistical measure for the magnitude of a varying quantity and was used to quantify the difference in the amplitude response. In both the cases, a ρX,Y or rmsX,Y value equal to 1 means that two signals are identical (i.e., perfect match), while −1 denotes two opposite signals.
ρ X , Y = i ( x i x ¯ ) ( y i y ¯ ) i ( x i x ¯ ) 2 k ( x k y ¯ ) 2 = C O V ( X , Y ) σ x σ y
r m s X , Y = 1 n i x i 2 1 n i y i 2 = r m s ( X ) r m s ( Y )
Table 2 lists the statistical coefficients derived from the measurements. A rather close correlation is observed for the Z-axis, while a major scatter is progressively perceived for the X- and Y-axes as far as the reference frequency f is increased. Such an effect could be partly justified by different internal production processes for the X- and Y-axes; however, most probably, it is due to alignment issues during the setup of the tests. Nevertheless, Table 2 suggests a rather good stability of the tested instruments for all the recorded frequencies, and a sufficient reliability of the test measurements under a repeated input.

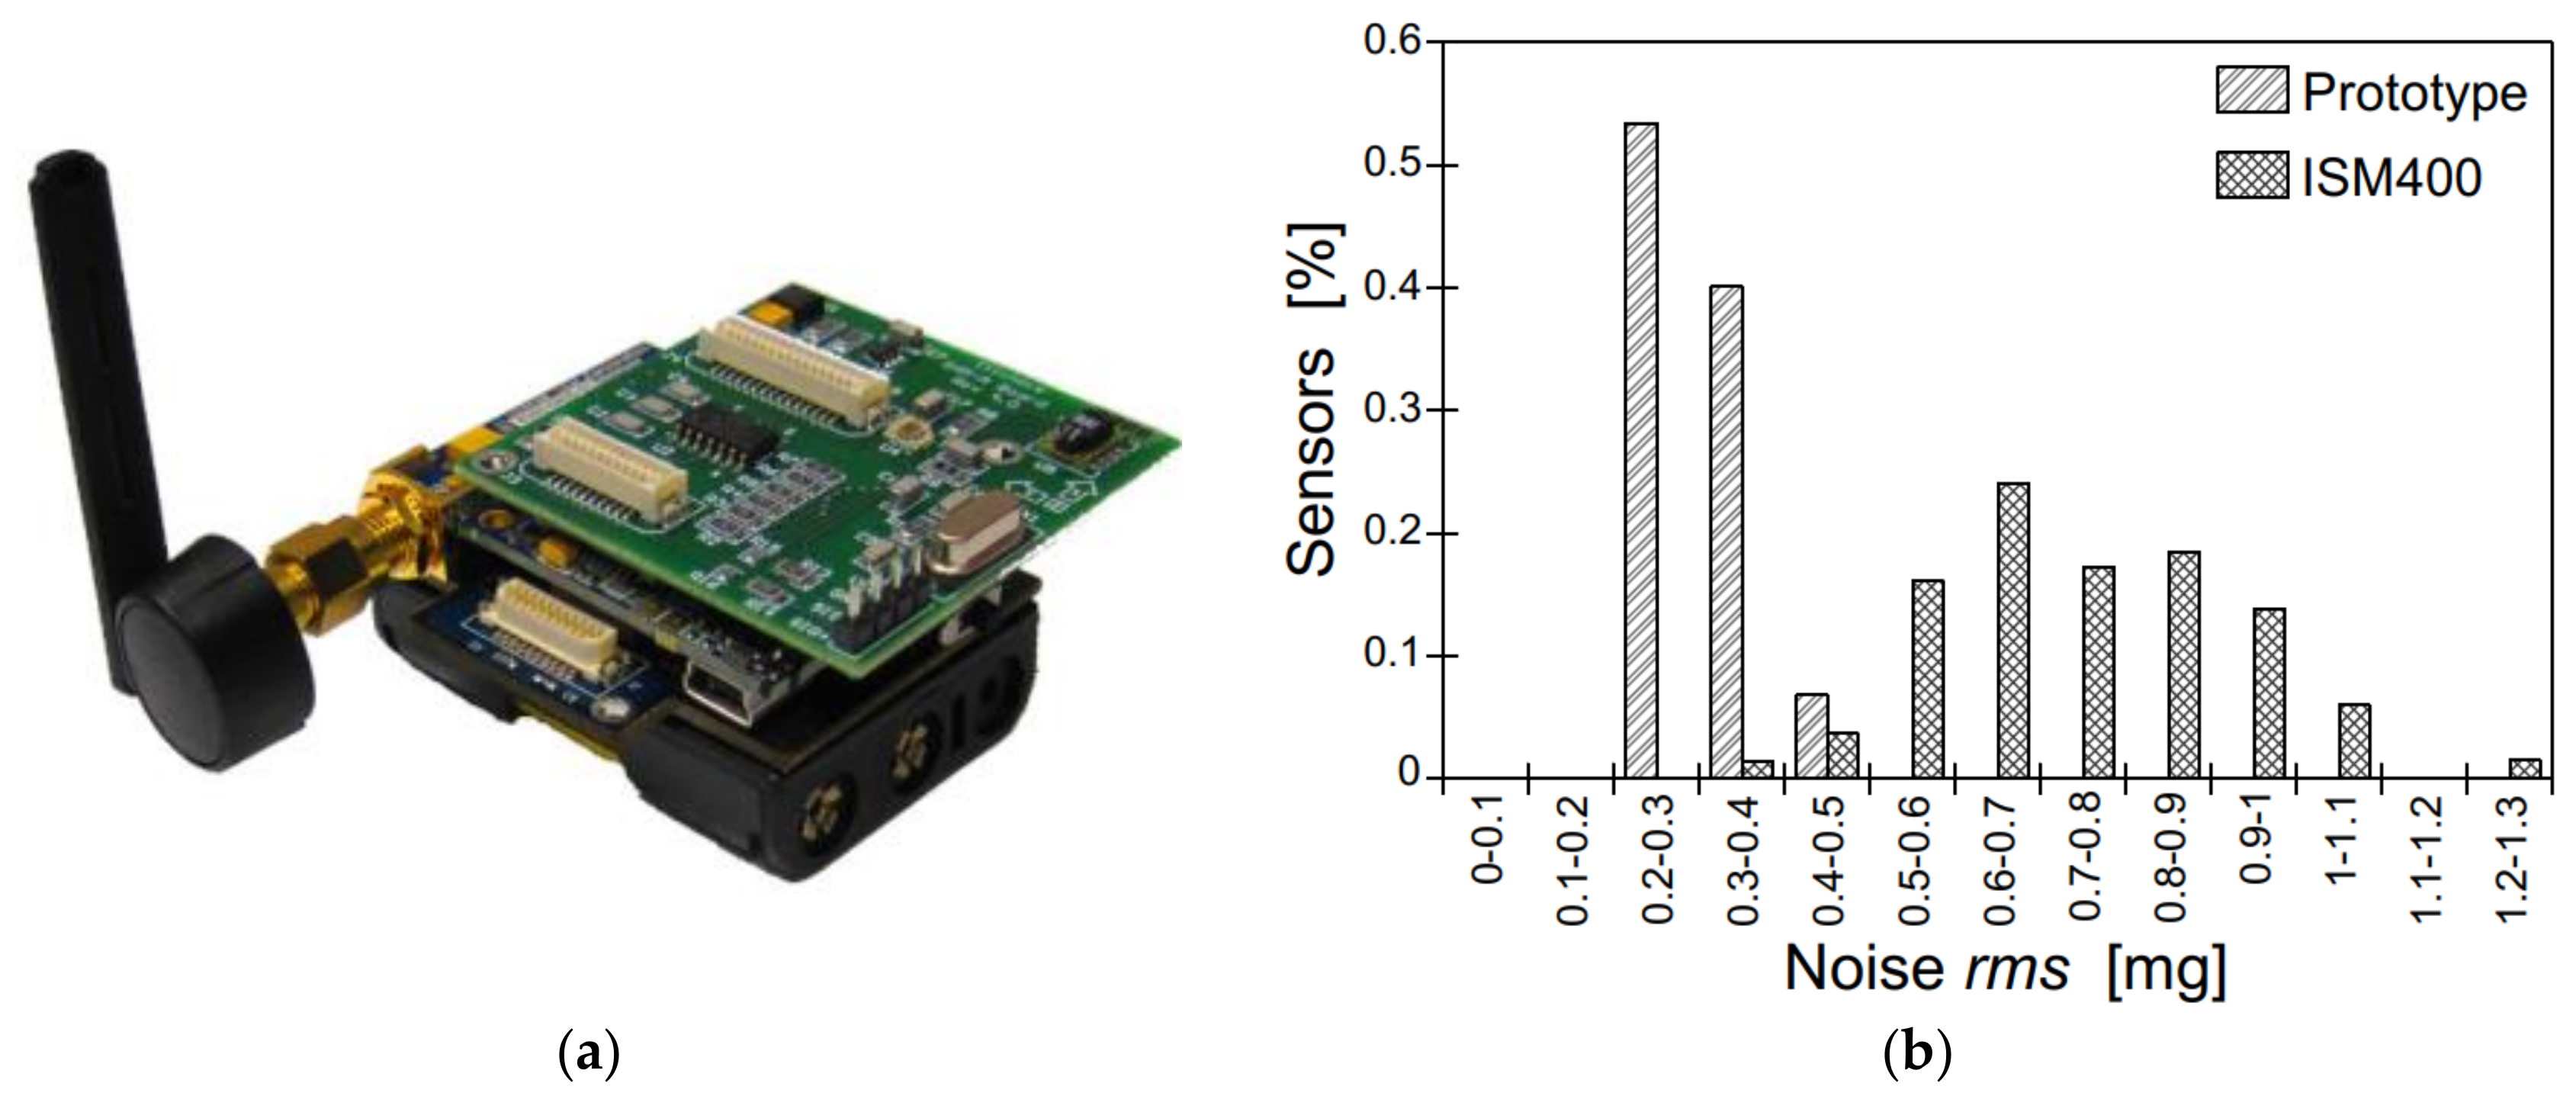
3.2. Noise Level Assessment

The noise level of the prototyped devices was also preliminary assessed, due to its effects on the quality of measurements (see for example [39,40]). To this aim, all the MEMS sensors were installed on a rigid foundation block and additional records were collected (steady-state regime, Z-axis component only), at the sampling frequencies of 256 Hz, 128 Hz, and 64 Hz. The actual noise level was, hence, evaluated by filtering the noise density with a first-order low-pass 20 Hz filter.
Compared to the theoretical noise value expected from the sensors (0.252 mg, see Table 1 and Equation (1)), the experimentally-derived noise level was generally found to lie in the order of 0.317 mg (+25% the nominal value), suggesting a rather stable performance for the full set of prototyped sensors. Additional calculations were carried out by taking into account further MEMS sensors available in the literature, and in particular the wireless, three-axis MEMS devices designed by the University of Illinois, Urbana-Champaign, see [45] and Figure 3a. Such a solution was used for the SHM of the historical Basilica Santa Maria of Collemaggio in L’Aquila, Italy, after the 2009 seismic event [46,47,48]. The typical device—with a sampling range of DC-1500 Hz—consists of ISM400 sensor boards [49], and accelerometers (LIS344ALH type) produced by ST Microelectronics (Geneva, Switzerland). In [46,47,48], positive feedback was reported for the adopted wireless MEMS sensors, based on preliminary laboratory tests. At the same time, after one-year on-site data acquisition, the limited performance of LIS344ALH accelerometers was also highlighted, being responsible of major troubles for the identification of the dynamic parameters for the basilica object of study. In Figure 3b, the herein collected comparative results are proposed, in the form of the noise level as a function of the percentage of tested sensors. As shown, the prototyped devices generally proved to offer a more stable performance even compared to the ISM400 sensor board solution, with a significantly lower noise density, hence giving evidence of the potential of the proposed MEMS.

4. Dynamic Identification of the Pietratagliata Cable-Stayed Bridge

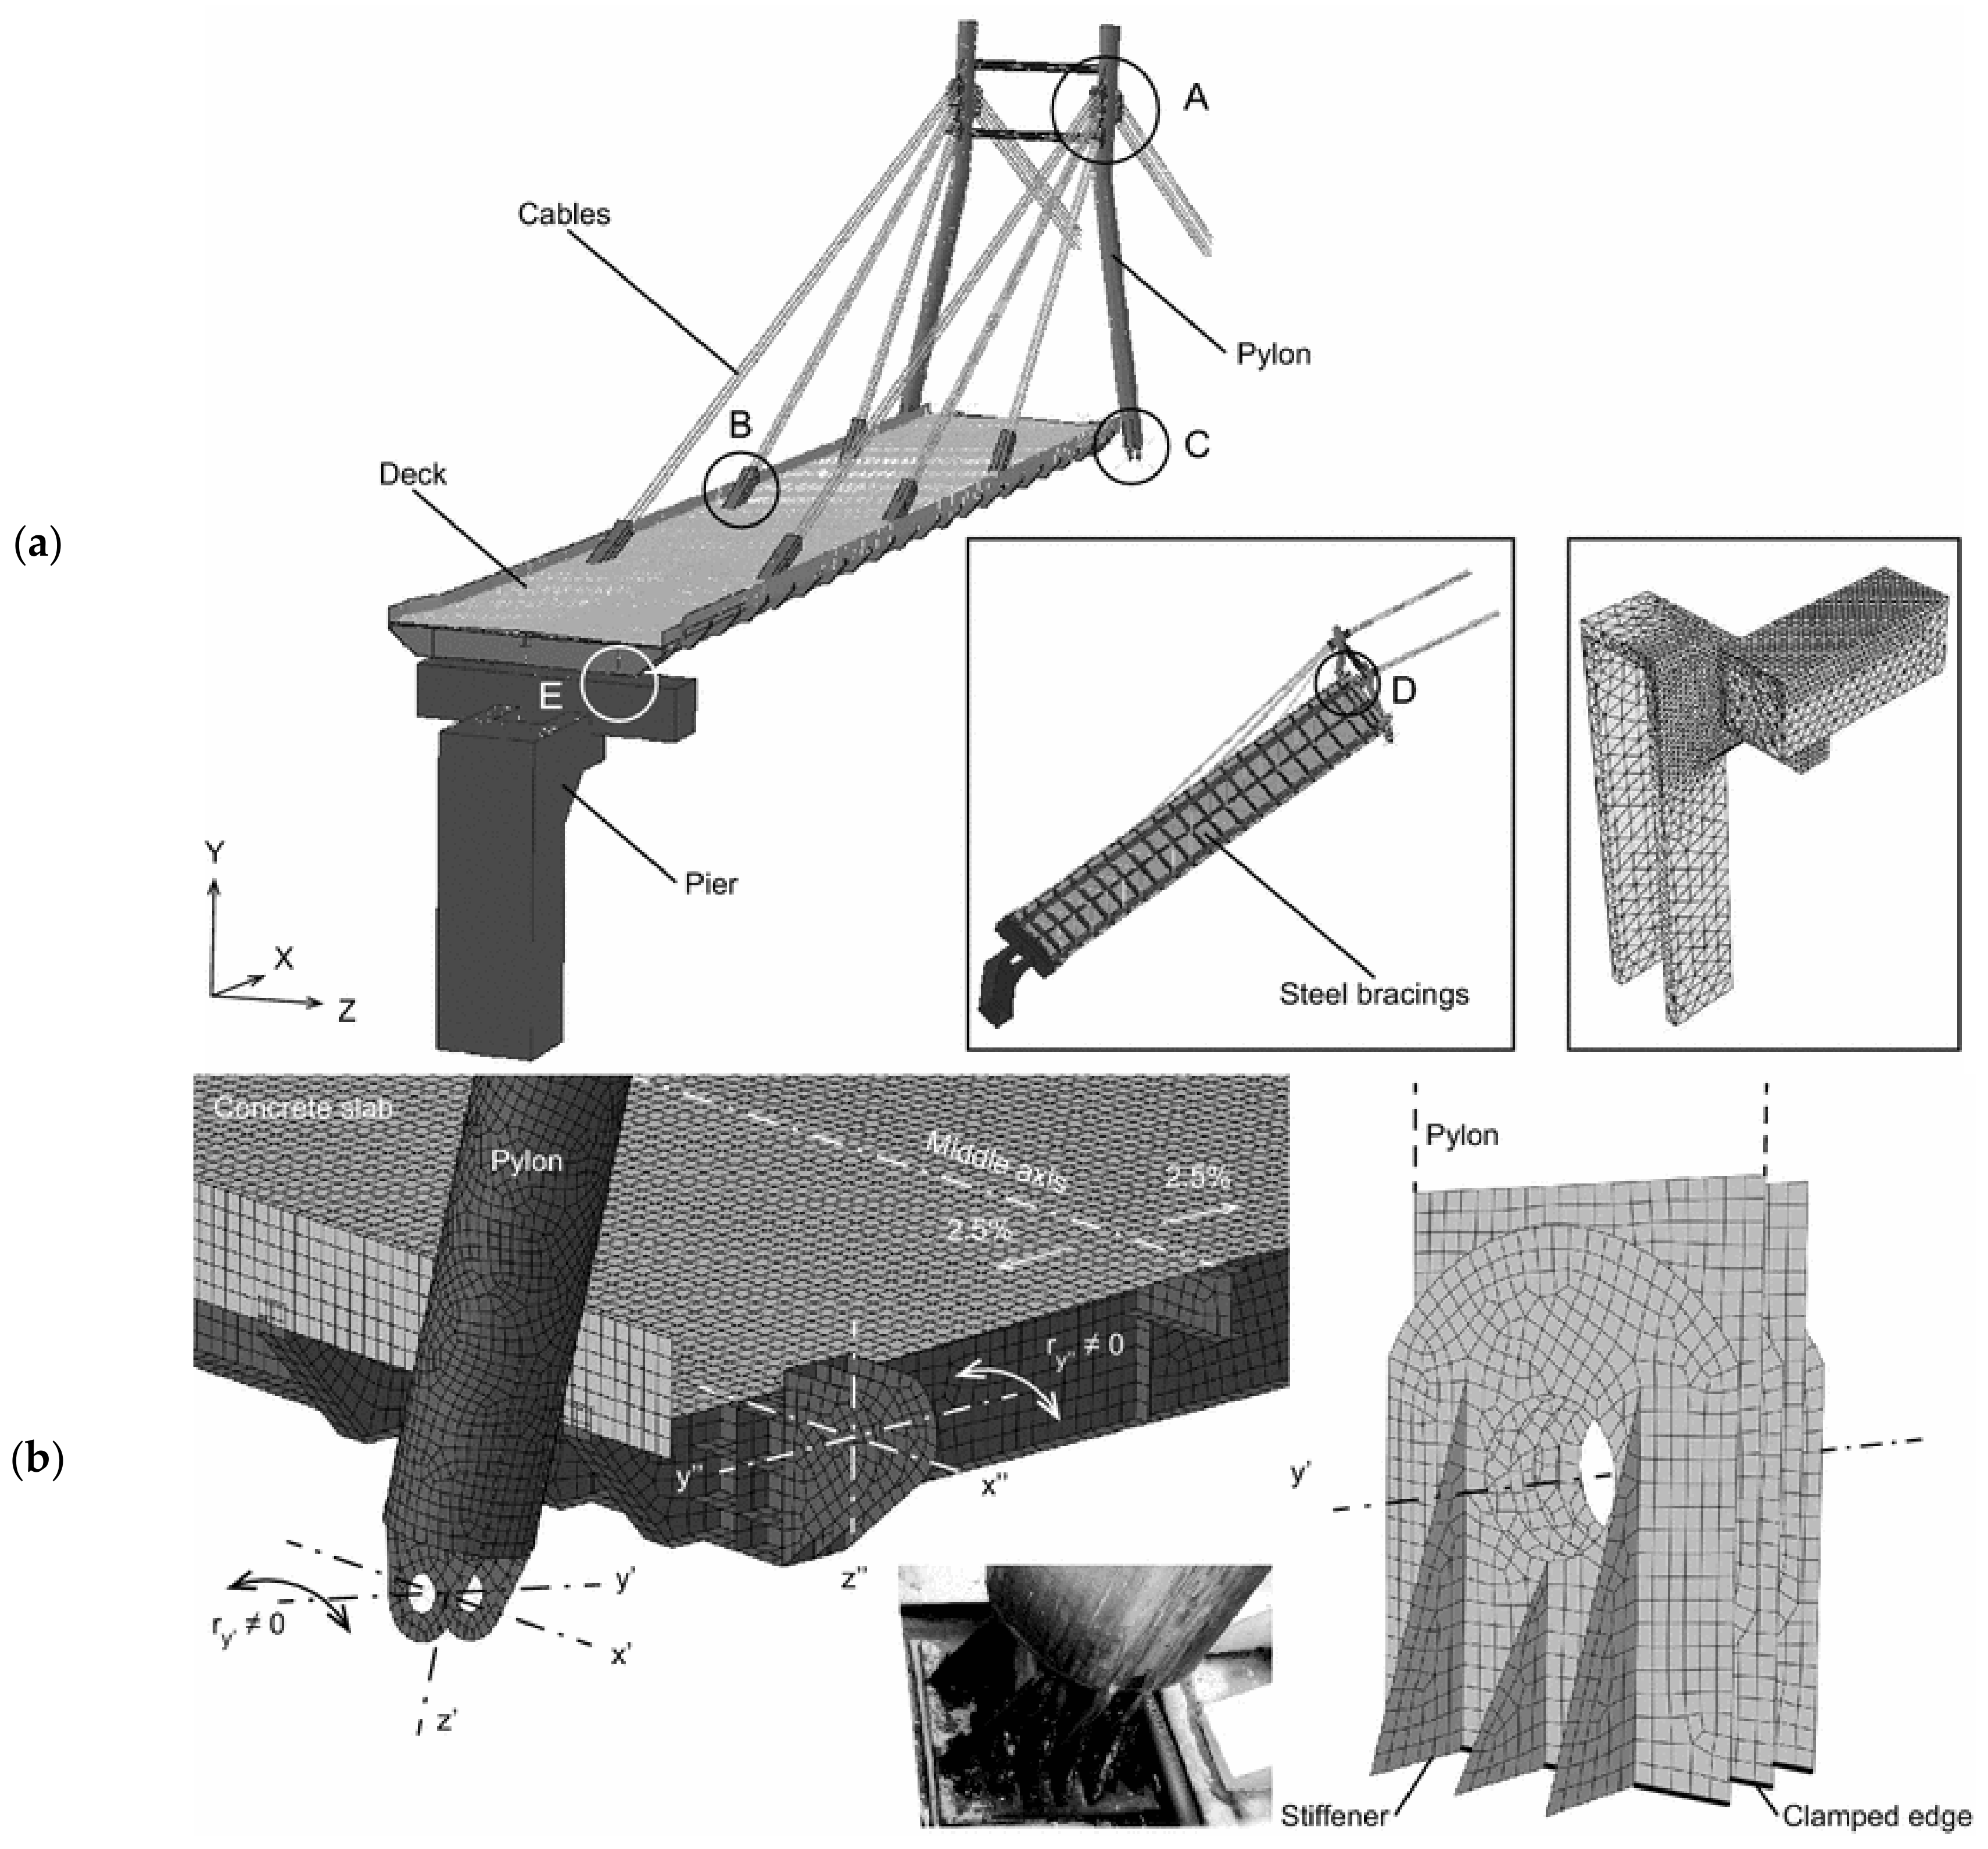
4.1. The Case-Study Bridge

On-site experimental tests were then carried out and compared with earlier research efforts available in the literature, to validate the reliability of the assembled measuring devices when in use for SHM of existing structural systems. To this aim, the dynamic identification of the Pietratagliata Bridge (Italy) was taken into account, in accordance with [44].
The bridge consists of a steel-concrete composite deck simply supported at the ends, a system of double-plane cables supporting the deck, and an inclined steel tower (Figure 4). The total length of the deck is 67 m, while the bridge width is 11.1 m including two lanes and two lateral footways. The deck structure consists of “Predalles” concrete panels and a reinforced concrete (RC) slab supported by two lateral steel girders and a longitudinal central beam. The lateral longitudinal and transverse girders have double-T cross-section with height equal to 1.27 m and 1.2 m, respectively; the central longitudinal girder, conversely, is an H-shaped profile, with 0.5 m its height (HEB500 cross-section type, according to European standard, wide flange H steel beam specifications). The interaction between the RC slab and the upper flange of the longitudinal girders consists of welded steel stud connectors. The bridge deck is supported on a RC pier on the National Route (NR) n.13 side and on a cast-in-place RC foundation block on the Pietratagliata side (Figure 4a,b). On the NR n.13 side, two unidirectional bearing supports are used to sustain the lateral girders. On the Pietratagliata side, conversely, the lateral girders are restrained by means of spherical hinges. Three groups of forestays on the upstream and downstream side of the bridge provide additional support to the deck. Each group of cables consists of four Dywidag bars, which are connected to the main girders by means of special metal devices (see the detail of Figure 4c). Furthermore, the backstays connect the steel tower to a RC foundation block. The tower consists of two inclined columns having a thin-walled circular cross-section (1.1 m in diameter and 20 mm thickness). The connection between the inclined columns is given by two additional thin-walled tubes, 0.5 m in diameter (thickness 15 mm). Special steel restraints are located at the base of the steel tower, to reproduce the effect of spherical hinges.

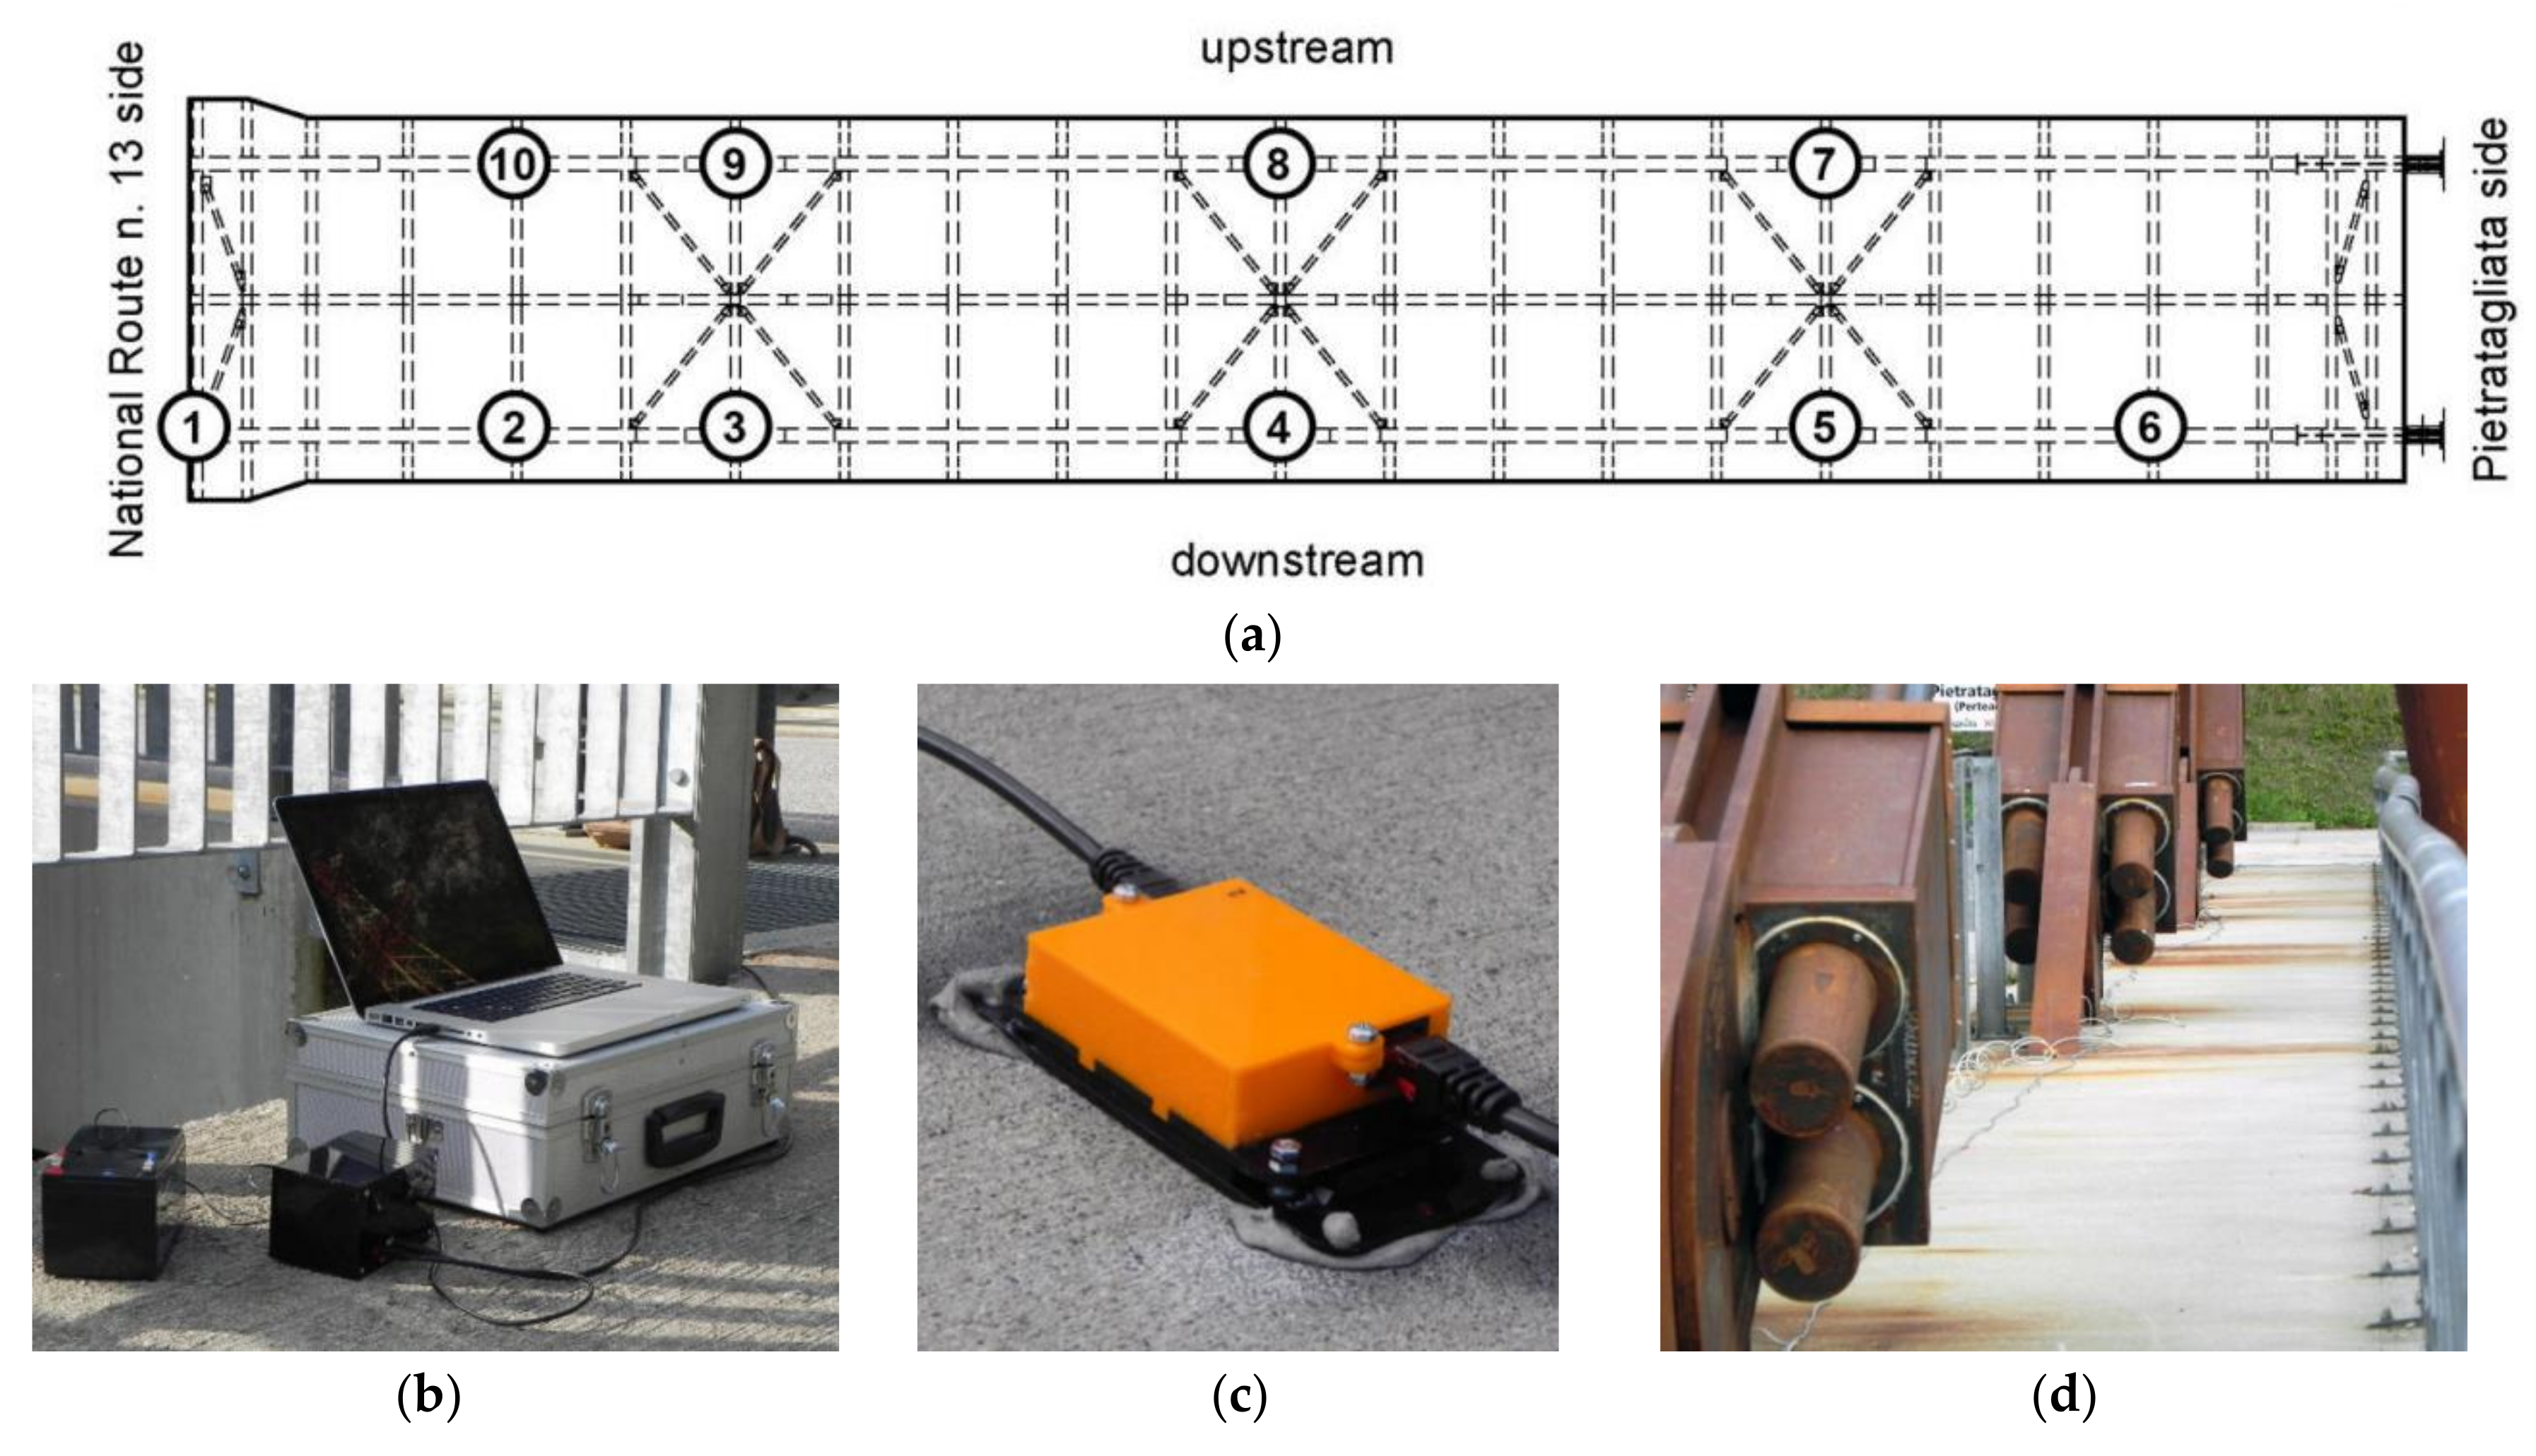
4.2. On-Site Experimental Testing and Dynamic Identification

4.2.1. Summary of Past EMA and FEA Predictions

For comparative purposes, past EMA and FEA dynamic estimations reported in [44] were taken into account for the examined bridge. There, on-site vibration test measurements have been presented to assess the dynamic parameters of the cable-stayed bridge under investigation, including an advanced FEA analysis aimed at further exploring the experimental observations and at assessing the effects of some key input parameters on the overall performance of the bridge (i.e., boundaries, structural detailing, pre-stressing force in the stays, etc.).
More in detail, in terms of EMA measurements (herein referred as “TEST0”), an ambient vibration dynamic test has been carried out with the aim of identifying the low vibration modes of the bridge (see [44]). At the time of past experiments, no additional excitation due to traffic was accounted for, due to strict requirement of the Pietratagliata Municipal Authority. The instrumentation chain consisted of a 16-channel data acquisition system, connected to a remote personal computer, and 11 Sprengnether mono-axial servo-accelerometers sensors, operating in the frequency range of 0–25 Hz. Each sensor was provided with a pre-amplifier having variable gain controlled by the remote computer. The instruments were located at 20 selected points (16 on the deck and four on the tower), to capture the deformed shapes of both the deck and the tower. Regarding the numerical simulations, the here referred FEA model was implemented by means of the ABAQUS/Standard computer package [50], see Figure 5 and [44]. The geometrical description of the bridge components (deck, pylon, cables, and pier, see the A-to-E key details in Figure 5a), and the definition of their reciprocal mechanical interaction was, hence, carried out based on technical drawings and preliminary sensitivity studies. To this aim, additional FEA models representative of structural details were presented for a further assessment of boundary conditions effects on the dynamic parameters of the bridge. Refined calibration of major input features was, hence, carried out, by including fine-tuning towards available on-site measurements (see [44]).
Additional local EMA measurements for the natural frequencies of the stay cables were also reported in [44] from ambient vibration tests, and used to identify the axial force on the supporting cables. Based on combined parametric FEA simulations, it was shown that the vibration frequencies of the bridge are not particularly sensitive to these structural modifications, with an average reduction up to 0.5–1% the fundamental frequencies of the reference, undamaged configuration. A maximum scatter up to −5% was estimated for some torsional shapes only, when damage was imposed in the stays with the closest connection to the tower (i.e., with a key role for restraining the bridge deck for the modal shapes of interest). On the contrary, possible variation in the axial force amount, and/or damage in the cables-to-deck restraints was found to induce even important changes in the shape of the lower vibration modes (i.e., loss of symmetry of restraints for the deck and, hence, of the corresponding deformations, with respect to the longitudinal axis of the bridge), suggesting a potential use of such a kind of information for diagnostic purposes.

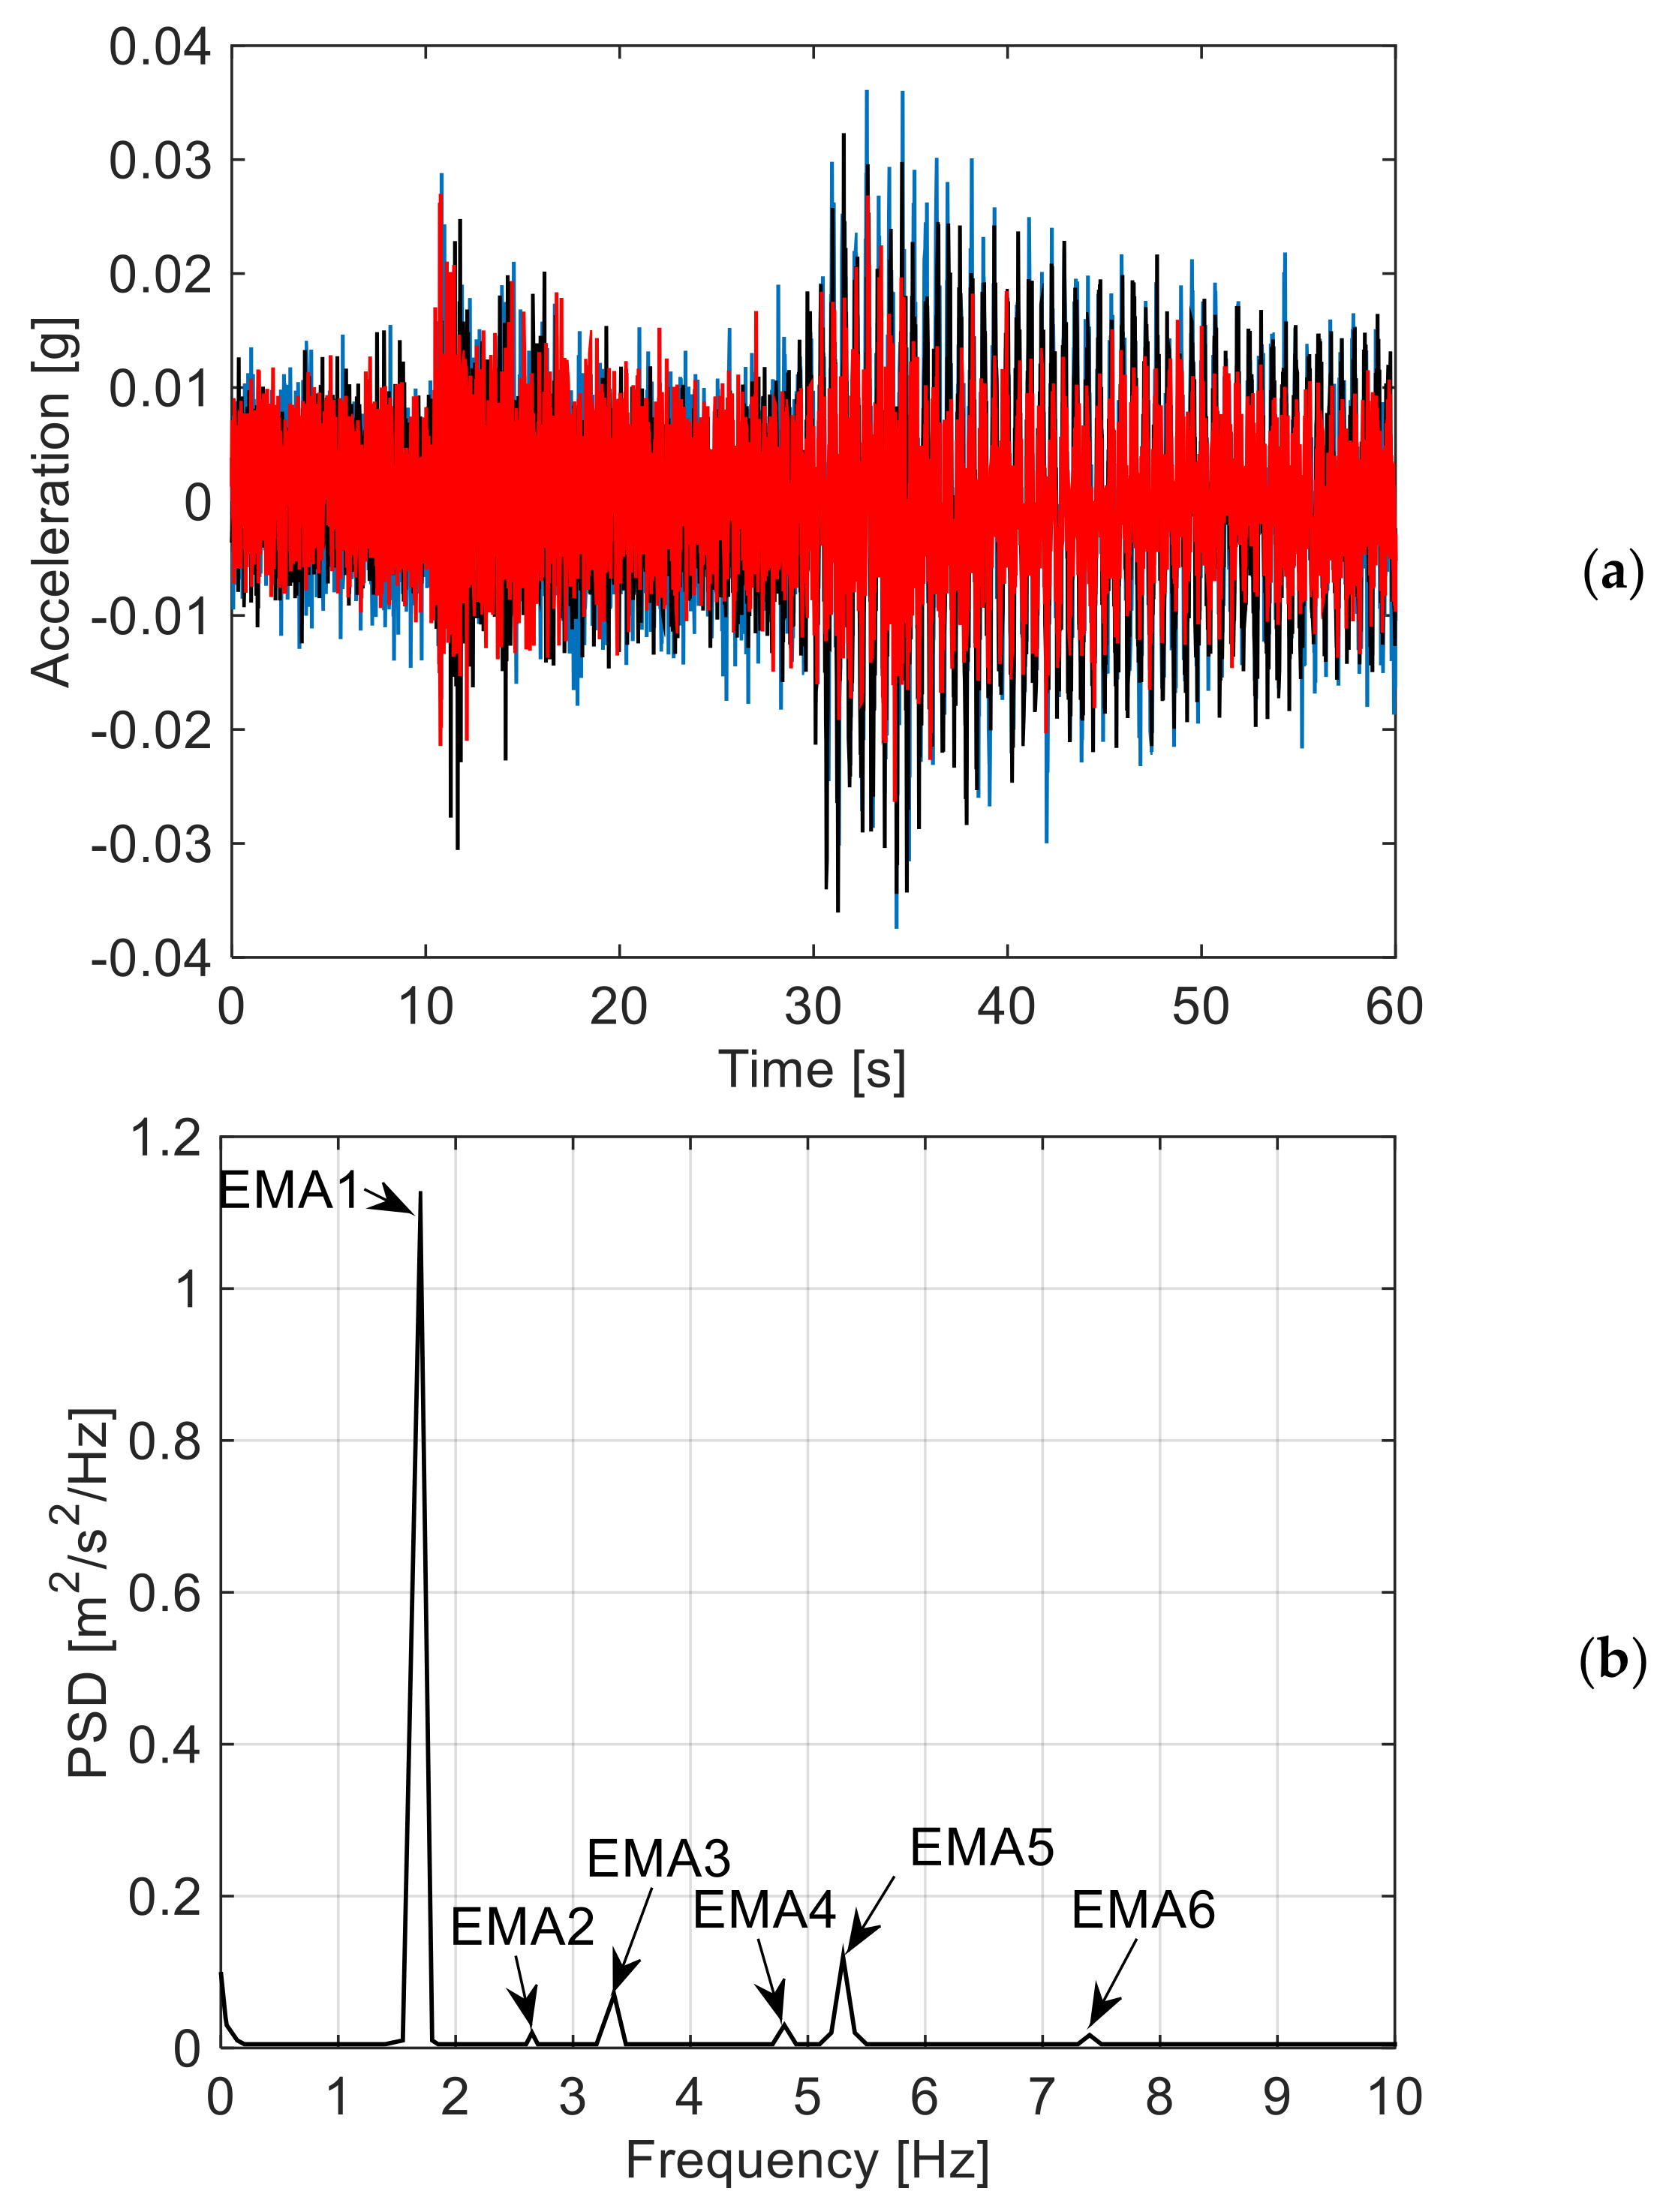
4.2.2. MEMS Experiments: Test Methods and Setup

The experimental investigation was carried out using ten sensors, aiming at acquiring and monitoring the slab deformations under the imposed input vibrations. In accordance with [44], three-component deformations of the deck were separately recorded for each control point, in accordance with the test setup reported in Figure 6a. Given the limited number of available instruments, the final setup of measuring devices was optimised based on preliminary investigations and past experimental findings summarized in Section 4.2.1, to capture the modal deformations of the deck. In this regard, the dynamic contribution of the pylon was not accounted for through the on-site investigation. Compared to [44], ambient vibration testing of the bridge was carried out under ordinary traffic loading.

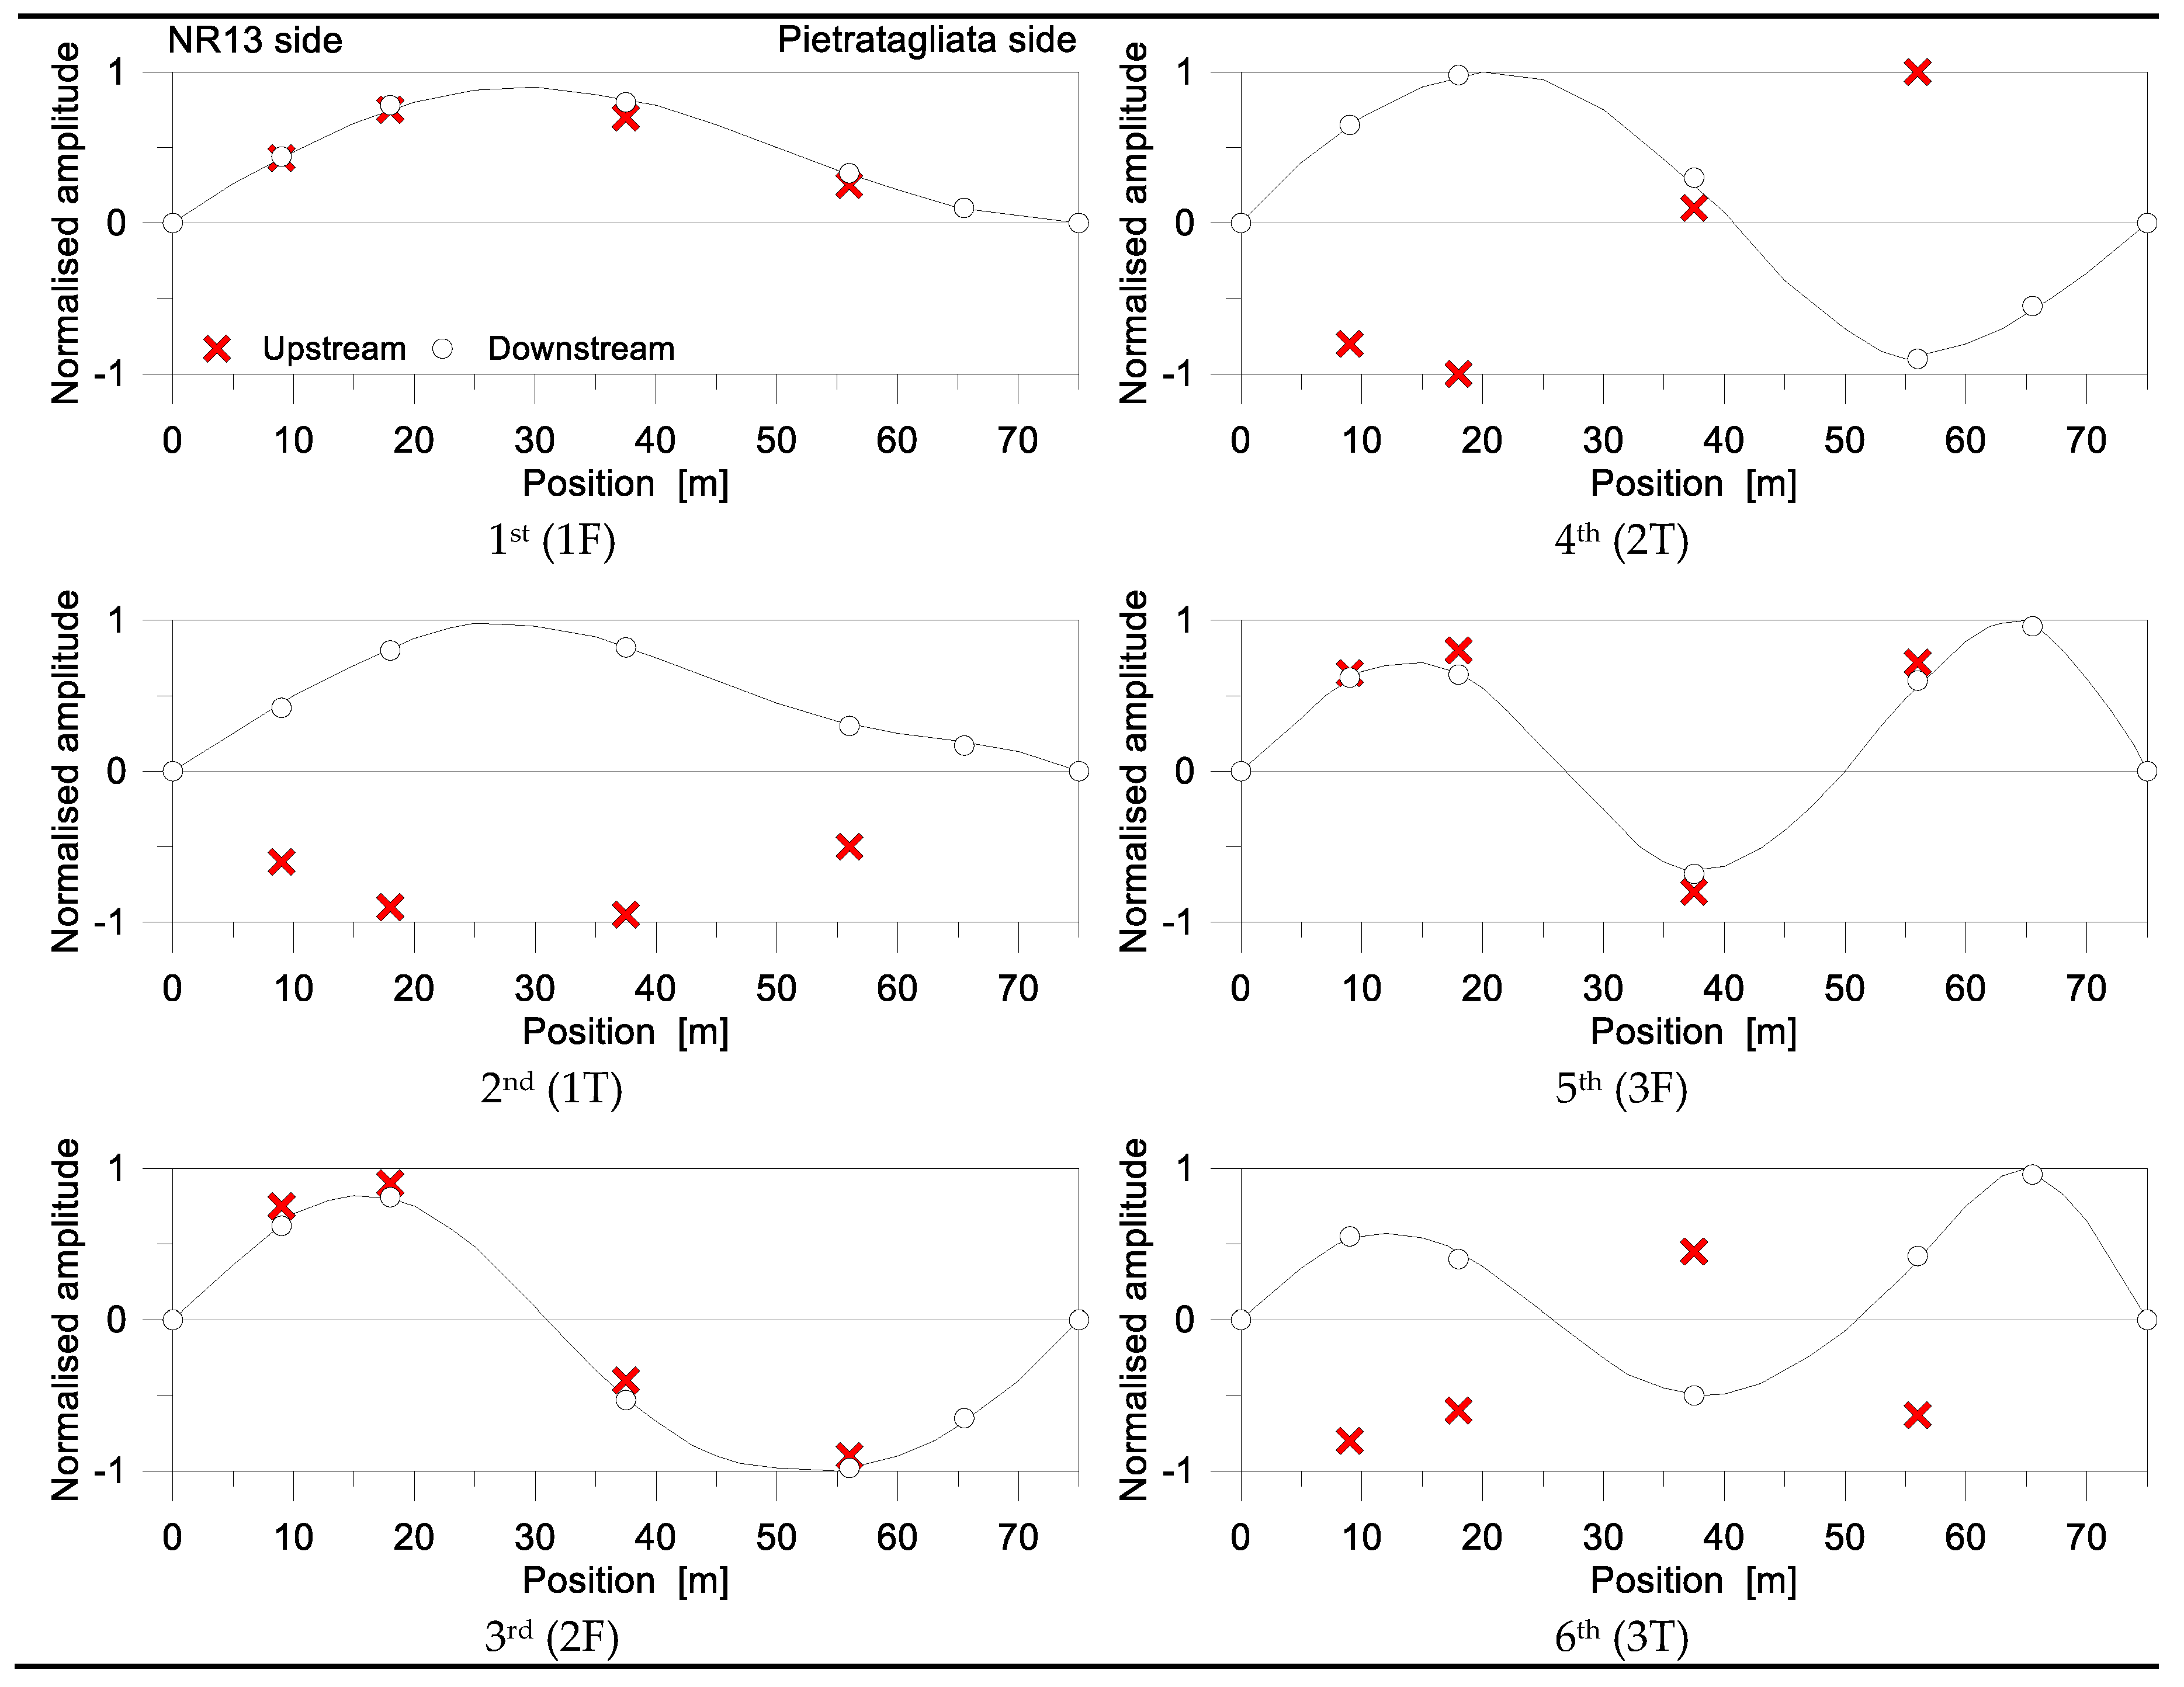
4.2.3. Vibration Modes and Modal Correlation

Based on the available MEMS sensors and the collected measurements, the dynamic parameters of the bridge were estimated by means of the Structural Modal Identification Toolsuite software (SMIT [51]). The ERA-OKID-OO approach [52,53], being representative of the extension of the simple ERA technique to vibrating systems whose initial conditions and dynamic external excitation are unknown, was used for natural frequencies, damping ratios, vibration shapes (see Figure 7 and Figure 8, and Table 3). In general, the ERA-OKIDO-OO technique offers more stable identification results, compared to other approaches (see [52,53]).
In this regard, Figure 7a shows the typical test measurements for the examined bridge under ambient vibration, while Figure 7b gives evidence of six vibration modes—i.e., PSD peaks—emerging from the noise level.
Due to the test setup configuration and input vibrations, the post-processing of the collected experimental data proved to allow a clear detection of the first six modes of the bridge, especially the flexural ones (i.e., major peaks in Figure 7b, where the EMA modes #1, #3, and #5 are emphasized), but also giving evidence of the fundamental torsional modes for the deck (EMA #2, #4, and #6 in Figure 7b).
The experimentally-predicted vibration shapes are, in fact, reported in Figure 8 (lateral view of the bridge deck), while the corresponding vibration frequencies and damping ratios are listed in Table 3 and Table 4.
Compared to past literature results, a close qualitative correlation was found for the detected modes. The fundamental mode of the bridge, see Figure 8, was found to be a first order flexural mode (1F), followed by the first torsional mode (1T) and higher flexural/torsional vibration shapes (2F, 2T, 3F, and 3T in Figure 8).
In Table 3, the detected vibration modes were compared to past experimental frequencies and damping ratios. Generally, a rather close correlation was observed in terms of vibration frequencies, with average scatter in the order of ≈0.6%, hence suggesting the potential of the proposed solution. The exception is represented by the second flexural mode, where the MEMS estimations underestimate the past experiment up to 2% of the reference value.
In terms of damping ratios for the same detected modes, the MEMS measurements led to a higher uncertainty with respect to the past EMA predictions, see Table 3. In general, however, the predicted damping ratios were found to lie in the range of 0.5–1% and to suggest a certain reliability of MEMS measurements, given the actual sensitivity of damping estimations to several parameters ([44,54,55,56,57,58], etc.).
Careful consideration, based on the available test measurements, was indeed spent for the correlation of the flexural and torsional vibration shapes of the bridge with past literature measurements. Given the limited number of control points, modal correlation was carried out by considering the FEA vibration shapes reported in [44], where the accuracy of such an advanced numerical model was emphasised.
For dynamic identification purposes, the MAC (modal assurance criterion) coefficients were calculated for the MEMS experimental data to the past FEA predictions (in Table 4, the graphical representation of the so calculated MAC values is proposed as a function of the i-th mode number). Given the i-th vibration shape, in particular, the MAC value is conventionally determined as:
MAC i = [ j = 1 n ϕ i j ϕ i j * ] 2 j = 1 n ϕ i j 2 j = 1 n ϕ i j * 2
where ϕij and ϕ*ij are the vibration modal shapes, n the grid point numbers.
According to Equation (5), the MAC values vary from 0 to 1, meaning that there is no similarity between the compared modes, or that the examined modal shapes are consistent.
As shown in Table 4, a rather close correlation was generally observed for the experimentally-detected vibration modes, for both flexural and torsional shape types, and especially for the lowest ones. MAC values proved the reliability of test measurements, even with major scatter for higher and complex vibration shapes, with MAC > 96.8 for the first fundamental modes. Given the actual goals and limitations of MAC estimations (see for example [59,60]), the collected results can be considered as well-representative of the potential of MEMS sensors.
Frequency results were also found to have close correlation with FEA calculations, being experimentally estimated with mostly a limited scatter (in the order of 1–3%) and with major discrepancies (3.5%) in the case of the first and third modes only. The scatter for these vibration modes (corresponding to the 1F and 2F flexural shapes) could be affected by local effects of the pier, since resulting in a flexible end support for the FEA deck. Based on the limited number of control points, however, a reasonable accuracy of the prototyped instrumentation can, again, be deducted, even if additional testing and assessment are required.
The good qualitative correlation between experimental and FEA modal shapes is further emphasised in Table 5, in the form of 3D axonometric views for the detected vibration modes, as obtained from further post-processing of modal shape amplitudes [61]. There, in particular, the normalized modal displacements (vertical component only) are assigned at each grid control point, hence, the input takes the form of a table with nodal coordinates and normalized deformations (EMA and FEA estimations, corresponding to red and blue deformed shapes of Table 5).

5. Conclusions

In this paper, original self-made Micro Electro-Mechanical System-based (MEMS) accelerometers have been prototyped and validated via laboratory and on-site experimental tests. To this aim, laboratory experimental comparisons have been first reported, so to assess the expected accuracy of MEMS-based measurements towards traditional accelerometers commercially available on the market, including noise level assessment. Based on the observed close correlation between the tested instruments, a full-scale application has been then reported. As a case study, the cable-stayed bridge in Pietratagliata (Italy) has been taken into account. The capability and potential of MEMS accelerometers has been assessed on the basis of Experimental Modal Analysis (EMA) testing and Finite Element Analytical (EMA) estimations derived from past literature efforts. As shown, the prototyped MEMS accelerometers proved to offer reliable estimations for the dynamic features of the bridge, hence confirming their potential use for structural monitoring in the form of low-cost, but practical, instruments. In this regard, further investigations are also expected to verify the reliability of MEMS estimations for different structural typologies.

Author Contributions

All the authors wrote and revised the paper collaboratively. The presented self-made MEMS accelerometers are the extended result of E.B. Master Thesis project. For the paper drafting, C.B. and M.I. conceived of and pursued the literature survey on MEMS-based sensors. E.B. managed the laboratory and on-site MEMS measurements. C.B. carried out the past FEA studies, while S.N. supervised the overall project.

Funding

This research project received no external funding. The APC was funded by MDPI (voucher discounts for the first author acting as a reviewer for MDPI journals).

Acknowledgments

The research results discussed in this paper have been orally presented at the GNGTS National Conference (November 2017, Trieste, Italy). In this regard, Dr. Luigi Bregant (Assistant Professor in Applied Mechanics for Machinery at University of Trieste, Department of Engineering and Architecture, Italy), is acknowledged for his technical support during the laboratory tests.

Conflicts of Interest

The authors declare no conflict of interest.

References

  1. EN 1991. Eurocode 1: Actions on Structures. European Standard. European Committee for Standardization (CEN): Brussels, Belgium, 2010. Available online: http://www.phd.eng.br/wp-content/uploads/2015/12/en.1991.1.4.2005.pdf (accessed on 27 July 2018).
  2. Nakano, Y.; Maeda, M.; Kuramoto, H.; Murakami, M. Guideline for post-earthquake damage evaluation and rehabilitation of RC buildings in Japan. In Proceedings of the 13th WCEE World Conference on Earthquake Engineering, Vancouver, BC, Canada, 1–6 August 2004. [Google Scholar]
  3. Xue, Q.; Chen, C.C.; Chen, K.C. Damage loss assessment for the basic earthquake insurance claim of residential RC buildings in Taiwan. J. Build. Apprais. 2011, 6, 213–226. [Google Scholar] [CrossRef]
  4. Pozzi, M.; Zonta, D.; Trapani, D.; Athanasopoulos, N.; Amditis, A.J.; Bimpas, M.; Garetsos, A.; Stratakos, Y.E.; Ulieru, D. MEMS-based sensors for post-earthquake damage assessment. J. Phys. Conf. Ser. 2011, 305, 012100. [Google Scholar] [CrossRef] [Green Version]
  5. Menderes, A.; Erener, A.; Sarp, G. Automatic Detection of Damaged Buildings after Earthquake Hazard by Using Remote Sensing and Information Technologies. Procedia Earth Planet. Sci. 2015, 15, 257–262. [Google Scholar] [CrossRef]
  6. Ubertini, F.; Comanducci, G.; Cavalagli, N. Vibration-based structural health monitoring of a historic bell-tower using output-only measurements and multivariate statistical analysis. Struct. Health Environ 2016, 15, 438–457. [Google Scholar] [CrossRef]
  7. Di Tommaso, A.; Gentilini, C.; Castellazzi, G. Structural Interpretation of Data from Static and Dynamic Structural Health Monitoring of Monumental Buildings. Key Eng. Mater. 2017, 747, 431–439. [Google Scholar]
  8. Ramos, L.; Marques, L.; Lourenço, P.; De Roeck, G.; Campos-Costa, A.; Roque, J. Monitoring historical masonry structures with operational modal analysis: Two case studies. Mech. Syst. Sig. Process. 2010, 24, 1291–1305. [Google Scholar] [CrossRef] [Green Version]
  9. Jouan, B.; Rudolph, J.; Bergholz, S. Structural Health Monitoring Solutions for Power Plants. In Proceedings of the EWSHM—7th European Workshop on Structural Health Monitoring, Nantes, France, 8–11 July 2014; pp. 623–630. [Google Scholar]
  10. Lemu, H.G. Assessment and analysis of structural health monitoring techniques for rotating machines. In Proceedings of the 27th International Ocean and Polar Engineering Conference, San Francisco, CA, USA, 25–30 June 2017. [Google Scholar]
  11. Schubert, F.; Frankenstein, B.; Fröhlich, K.J.; Kuttner, M.; Lamek, B.; Schwenkkros, J.; Kerkhof, K.; Petricevic, R. Structural Health Monitoring of Industrial Piping Systems Based on Guided Elastic Waves. DGZfP 2007, 32, 14–16. Available online: https://pdfs.semanticscholar.org/05e1/ed16583d17c76793c3a65bec592b91ffad15.pdf (accessed on 26 July 2018).
  12. Giglio, M.; Manes, A.; Sbarufatti, C. MEMS for structural health monitoring in aircraft. In MEMS for Automotive and Aerospace Applications; Woodhead Publishing: Sawston, UK; Cambridge, UK, 2013; pp. 220–244. ISBN 978-0-85709-118-5. [Google Scholar]
  13. Giurgiutiu, V. Structural Health Monitoring (SHM) of aerospace components. In Polymer Composites in the Aerospace Industry; Woodhead Publishing: Sawston, UK; Cambridge, UK, 2015; pp. 449–507. ISBN 978-0-85709-523-7. [Google Scholar]
  14. Mecocci, A.; Peruzzi, G.; Pozzebon, A.; Vaccarella, P. Architecture of a hydroelectrically powered wireless sensor node for underground environmental monitoring. IET Wirel. Sens. Syst. 2017, 7, 123–129. [Google Scholar] [CrossRef]
  15. Bennet, P.; Soga, K.; Wassel, I.; Fidler, P.; Abe, K.; Kobayashi, Y.; Vanicek, M. Wireless sensor network for underground railway applications: Case studies in Prague and London. Smart Struct. Syst. 2010, 6, 619–639. [Google Scholar] [CrossRef]
  16. Cochran, E.S.; Lawrence, J.F.; Kaiser, A.; Fry, B.; Chung, A.; Christensen, C. Comparison between low-cost and traditional MEMS accelerometers: A case study from the M7.1 Darfield, New Zealand, aftershock deployment. Ann. Geophys. 2011, 54, 728–737. [Google Scholar]
  17. Evans, J.R.; Allen, R.M.; Chung, A.I.; Cochran, E.S.; Guy, R.; Hellweg, M.; Lawrence, J.F. Performance of Several Low-Cost Accelerometers. Seismol. Res. Lett. 2014, 85, 147–158. [Google Scholar] [CrossRef] [Green Version]
  18. Cigada, A.; Lurati, M.; Redaelli, M.; Vanali, M. Mechanical performance and metrological characterization of MEMS accelerometers and application in modal analysis. In Proceedings of the IMAC XXV International Modal Analysis Conference, Orlando, FL, USA, 19–22 February 2007; pp. 236–244. [Google Scholar]
  19. Sun, Z.; Chen, D.; Chen, J.; Deng, T.; Li, G.; Xu, C.; Wang, J. A MEMS based electrochemical seismometer with low cost and wide working bandwidth. Procedia Eng. 2016, 168, 806–809. [Google Scholar] [CrossRef]
  20. Benevicius, V.; Ostasevicius, V.; Gaidys, R. Identification of capacitive MEMS accelerometer structure parameters for human body dynamics measurements. Sensors 2013, 13, 11184–11195. [Google Scholar] [CrossRef] [PubMed]
  21. Ciuti, G.; Ricotti, L.; Menciassi, A.; Dario, P. MEMS Sensor Technologies for Human Centred Applications in Healthcare Physical Activities, Safety and Environmental Sensing: A Review on Research Activities in Italy. Sensors 2015, 153, 6441–6468. [Google Scholar] [CrossRef] [PubMed]
  22. Chaudhury, S.B.; Sengupta, M.; Mukherjee, K. Vibration Monitoring of Rotating Machines Using MEMS Accelerometer. Int. J. Sci. Eng. Res. 2014, 2, J2013358. [Google Scholar]
  23. Jimenez, S.; Cole, M.O.T.; Keogh, P.S. Vibration sensing in smart machine rotors using internal MEMS accelerometers. J. Sound Vib. 2016, 377, 68–75. [Google Scholar] [CrossRef] [Green Version]
  24. Pedotti, L.A.S.; Zago, R.M.; Fruett, F. Instrument based on MEMS accelerometer for vibration and unbalance analysis in rotating machines. In Proceedings of the 1st INSCIT—International Symposium on Instrumentation Systems, Circuits and Transducers, Belo Horizonte, Brazil, 29 August–3 September 2016; pp. 25–30. [Google Scholar] [CrossRef]
  25. Son, J.-D.; Ahn, B.-H.; Ha, J.-M.; Choi, B.-K. An availability of MEMS-based accelerometers and current sensors in machinery fault diagnosis. Measurement 2016, 94, 680–691. [Google Scholar] [CrossRef]
  26. Bassoli, E.; Vincenzi, L.; Bovo, M.; Mazzotti, C. Dynamic identification of an ancient masonry bell tower using MEMS-based acquisition system. In Proceedings of the 2015 EESMS Workshop on Environmental, Energy and Structural Monitoring Systems, Trento, Italy, 9–10 July 2015. Paper number 15347414. [Google Scholar] [CrossRef]
  27. Clementi, F.; Pierdicca, A.; Milani, G.; Gazzani, V.; Poiani, M.; Lenci, S. Numerical model upgrading of ancient bell towers monitored with a wired sensor network. In Proceedings of the 10th International Masonry Conference (IMC), Milan, Italy, 9–11 July 2018. [Google Scholar]
  28. Feng, M.; Fukuda, Y.; Mizuta, M.; Ozer, E. Citizen Sensors for SHM: Use of Accelerometer Data from Smartphones. Sensors 2015, 15, 2980–2998. [Google Scholar] [CrossRef] [PubMed] [Green Version]
  29. Wargantiwar, N.K.; Barbade, A.S.; Shingade, A.P.; Shire, A.N. Wireless Earthquake Alarm Design based on MEMS Accelerometer. Int. Adv. Res. J. Sci. Eng. Technol. 2017, 4, 128–132. [Google Scholar]
  30. Kok, R.; Furlong, C.; Putniewicz, R.J. Development of a Wireless MEMS Inertial System for Health Monitoring of Structures. In Materials Research Society Symposium Proceedings; Cambridge University Press: Cambridge, UK, 2003; Volume 785. [Google Scholar] [CrossRef]
  31. Jung, J.W.; Moon, D.J.; Jung, J.W.; Lee, B.L.; Lee, S.J. A performance test of a 3-axis accelerometer and modal analysis. In Proceedings of the FIG Congress 2014—Engaging the Challenges, Enhancing the Relevance, Kuala Lumpur, Malaysia, 16–21 June 2014. [Google Scholar]
  32. Rajashri, P.P.; Chaudhari, V.D.; Rane, K.P. ARM based 3-axis seismic data acquisition system using Accelerometer sensor and Graphical User Interface. Int. J. Eng. Res. Gen. Sci. 2015, 3, 833–838. [Google Scholar]
  33. Beskhyroun, S.; Ma, Q. Low-Cost Accelerometers for Experimental Modal Analysis. In Proceedings of the 15th WCEE—World Conference in Earthquake Engineering, Lisbon, Portugal, 24–28 September 2012; Available online: http://www.iitk.ac.in/nicee/wcee/article/WCEE2012_0771.pdf (accessed on 26 July 2018).
  34. Spencer, B.F.; Ruiz-Sandoval, M.; Kurata, N. Smart sensing technology for structural health monitoring. In Proceedings of the 13th WCEE—World Conference on Earthquake Engineering, Vancouver, BC, Canada, 1–6 August 2004. [Google Scholar]
  35. Torfs, T.; Sterken, T.; Brebels, S.; Santana, J.; van den Hoven, R.; Spiering, V.; Bertsch, N.; Trapani, D.; Zonta, D. Low Power Wireless Sensor Network for Building Monitoring. IEEE Sensors J. 2013, 13, 909–915. [Google Scholar] [CrossRef] [Green Version]
  36. Renjan Raj, V.C. Wireless Sensor Network for Building Monitoring. Int. J. Eng. Sci. 2014, 3, 13–18. [Google Scholar]
  37. Pradeepkumar, N.J.; Ramesh, R.M.; Shalini, K.S.; Sujatha, H.R.; Hemanth Kumar, C.S. Smart System Sensor Network for Building Monitoring. SSRG IJECE 2015, 2, 116–121. [Google Scholar]
  38. Picozzi, M.C.; Milkereit, C.; Zulfikar, C.; Fleming, K.; Ditommaso, R.; Erdik, M.; Zschau, J.; Fischer, J.; Safak, E.; Ozel, O.; et al. Wireless technologies for the monitoring of strategic infrastructures: An ambient vibration test on the Fatih Sultan Mehmet suspension bridge in Istanbul, Turkey. Bull. Earthq. Eng. 2009, 8, 671–691. [Google Scholar] [CrossRef]
  39. Domaneschi, M.; Limongelli, M.P.; Martinelli, L. Structural damage localization in a suspension bridge under seismic excitation. In Proceedings of the 15th WCEE Conference—World Conference on Earthquake Engineering, Lisbon, Portugal, 24–28 September 2012. [Google Scholar]
  40. Domaneschi, M.; Limongelli, M.P.; Martinelli, L. Interpolation damage detection method on a suspension bridge model: influence of sensors disturbances. Key Eng. Mater. 2013, 569–570, 734–741. [Google Scholar] [CrossRef]
  41. Dashti, S.; Bray, J.D.; Reilly, J.; Glaser, S.; Bayen, A. iShake: The Reliability of Phones as Seismic Sensors. In Proceedings of the World Conference Earthquake Engineering, Lisbon, Portugal, 24–28 September 2012. [Google Scholar]
  42. D’Alessandro, A.; D’Anna, G. Suitability of Low-Cost Three-Axis MEMS Accelerometers in Strong-Motion Seismology: Tests on the LIS331DLH (iPhone) Accelerometer. Bull. Seismol. Soc. Am. 2013, 103, 2906–2913. [Google Scholar] [CrossRef]
  43. Kong, Q.; Allen, R.M.; Schreier, L.; Kwon, Y.-W. MyShake: A smartphone seismic network for earthquake early warning and beyond. Sci. Adv. 2016, 2. [Google Scholar] [CrossRef] [PubMed]
  44. Bedon, C.; Dilena, M.; Morassi, A. Ambient vibration testing and structural identification of a cable-stayed bridge. Meccanica 2016, 51, 2777–2796. [Google Scholar] [CrossRef] [Green Version]
  45. Rice, J.A.; Spencer, B.F. Flexible Smart Sensor Framework for Autonomous Full-Scale Structural Health Monitoring. NSEL Report Series, Report n. NSEL-018, August 2009. Available online: https://core.ac.uk/download/pdf/4822684.pdf (accessed on 1 July 2018).
  46. Federici, F.; Alesii, R.; Colarieti, A.; Faccio, M.; Graziosi, F.; Gattulli, V.; Potenza, F. Design of Wireless Sensor Nodes for Structural Health Monitoring Applications. Procedia Eng. 2014, 87, 1298–1301. [Google Scholar] [CrossRef]
  47. Gattulli, V.; Graziosi, F.; Federici, F.; Potenza, F.; Colarieti, A. Structural Health Monitoring of the Basilica S. Maria di Collemaggio. In Proceedings of the 5th International Conference on Structural Engineering, Cape Town, South Africa, 2–4 September 2013. [Google Scholar]
  48. Antonacci, E.; Ceci, A.; Colarieti, V.; Gattulli, V.; Graziosi, F.; Lepidi, M.; Potenza, F. Dynamic testing and health monitoring via wireless sensor networks in the post-earthquake assessment of structural condition at L’Aquila. In Proceedings of the Eurodyn 2011—8th European Conference on Structural Dynamics, Leuven, Belgium, 4–6 July 2011; pp. 2440–2447. [Google Scholar]
  49. ISM400—Multimetric Imote2 Sensor Board—Datasheet and User’s Guide. Available online: http://shm.cs.uiuc.edu (accessed on 1 July 2018).
  50. ABAQUS Computer Software; Simulia: Johnston, RI, USA, 2018.
  51. SMIT. Available online: http://smit.atlss.lehigh.edu/?page_id=23 (accessed on 1 March 2018).
  52. Chang, M.; Leonard, R.L.; Pakzad, S.N. SMIT User’s Guide. Release 1.0, 2012. Available online: http://smit.atlss.lehigh.edu/wp-content/uploads/2012/07/SMIT-Users-Guide.pdf (accessed on 26 July 2018).
  53. Chang, M.; Pakzad, S.N. Observer Kalman Filter Identification for Output-Only Systems Using Interactive Structural Modal Identification Toolsuite. J. Bridge Eng. 2014, 19, 04014002. [Google Scholar] [CrossRef]
  54. Frizzarin, M.; Feng, M.Q.; Franchetti, P.; Soyoz, S.; Modena, C. Damage detection based on damping analysis of ambient vibration data. Struct. Control Health Monit. 2010, 17, 368–385. [Google Scholar] [CrossRef]
  55. Turek, M.E.; Bentura, C.E.; Shawwaf, K. Vibration testing of bridge stay cables to obtain damping values. Struct. Dyn. 2011, 3, 331–340. [Google Scholar]
  56. Gonzalez, A.; Obrien, E.J.; McGetrick, P.J. Identification of damping in a bridge using a moving instrumented vehicle. J. Sound Vib. 2012, 331, 4115–4131. [Google Scholar] [CrossRef] [Green Version]
  57. Liu, Y.; Ge, Y.; Cao, F.; Zhou, Y.; Wang, S. Statistics and identification of mode-dependent structural damping of cable-supported bridges. In Proceedings of the APCWE-VIII—The 8th Asia-Pacific Conference on Wind Engineering, Chennai, India, 10–13 December 2013. [Google Scholar]
  58. Bedon, C.; Morassi, A. Dynamic testing and parameter identification of a base-isolated bridge. Eng. Struct. 2014, 60, 85–99. [Google Scholar] [CrossRef]
  59. Allemang, R.J.; Brown, D.L. A correlation Coefficient for Modal Vector Analysis. In Proceedings of the 1st International Modal Analysis (IMAC) Conference, Orlando, FL, USA, 8–10 November 1982; pp. 110–116. [Google Scholar]
  60. Allemang, R.J. The Modal Assurance Criterion—Twenty Years of Use and Abuse. Sound Vib. 2003, 37, 14–23. [Google Scholar]
  61. DDS. FEMtools Computer Software. Customer Support Documentations. Available online: www.femtools.com (accessed on 26 July 2018).
Figure 1. (a) PC board and (b) assembled system.
Jsan 07 00030 g001
Figure 2. Laboratory shaking table tests: (a) MEMS and (b) comparative PCM sensors; (c,d) examples of test measurements in terms of acceleration-time plots and pseudo-spectral density (PSD).
Jsan 07 00030 g002
Figure 3. Noise level assessment: (a) detail for the wireless MEMS designed by the University of Illionis, Urbana-Champaign, and (b) noise level comparisons (Z-axis), as obtained from laboratory testing and the literature [45,49].
Jsan 07 00030 g003
Figure 4. Pietratagliata Bridge (Italy): (a) general view; (b) technical drawings with lateral view, plan, and transversal cross-section; (c) stays-to-tower and stays-to-deck connection details (dimensions in meters). Figures reproduced from [44] with permission from Springer Nature, Copyright © license agreement no. 4386400703508 (July 2018).
Jsan 07 00030 g004
Figure 5. Refined FEA model for the dynamic identification of the Pietratagliata Bridge (ABAQUS), (a) global assembly and bottom/pier detailing, in accordance with [44], and (b) selected details. Figures reproduced from [44] with permission from Springer Nature, Copyright © license agreement no. 4386400703508 (July 2018).
Jsan 07 00030 g005
Figure 6. Experimental testing on the Pietratagliata bridge. (a) test setup (top view of the steel-concrete composite slab (dimensions in meters); in the circles, the instruments labels) and (bd) instrumentation details.
Jsan 07 00030 g006
Figure 7. Dynamic identification of the Pietratagliata bridge via MEMS sensors: (a) example of test measurements (three sensors only are shown) and (b) pseudo spectral density with evidence of fundamental modes.
Jsan 07 00030 g007
Figure 8. EMA vibration modes (normalised amplitudes), as obtained from MEMS measurements and SMIT post-processing [51].
Jsan 07 00030 g008
Table 1. Electrical properties for the chosen accelerometer and ADC.
Accelerometer: Kionix KXR94-2050ADC: Texas Instrument ADS1220
Measurement axes3TypeSigma-Delta
Measurement range±2 gResolution24 bit
Sensitivity0.66 V/gChannels2 diff./4 single ended
Noise density45 µg/ Hz Data rate2000 SPS
Supply voltage3.3 V (typical)Supply voltage3.3 V (typical)
Temperature rangefrom −40 °C to 85 °CTemperature rangefrom −40 °C to 125 °C
Table 2. Statistical coefficients derived from laboratory test measurements (Equations (3) and (4)).
Reference Axisf (Hz)ρX,YrmsX,Y
S#1S#2S#3S#1S#2S#3
Z50.99600.99500.99510.99420.99830.9916
80.99800.99710.99760.99380.99710.9920
110.99890.99710.99870.99300.99600.9906
X50.97970.97950.97990.96520.97370.9789
80.96070.96090.96080.96150.97010.9755
110.95150.95100.95190.96310.97140.9714
Y50.98090.98090.98060.99550.99590.9974
80.96280.96210.96250.99180.99240.9937
110.95350.95330.95310.98880.98920.9905
Table 3. EMA vibration frequencies and damping ratios for the first six fundamental modes, as obtained from MEMS measurements and past experiments (TEST0, see [44]). Key: F = flexural; T = torsional; Δ = 100 × (fMEMSfTEST0)/fTEST0.
Vibration Modef (Hz)Δ (%)ξ (%)
Order/TypeMEMSTEST0 MEMSTEST0
11/F1.6781.6650.780.281.2 ± 0.5
21/T2.6592.669−0.371.910.6 ± 0.5
32/F3.3403.411−2.080.290.7 ± 0.2
42/T4.7774.7500.570.470.4 ± 0.0
53 / F5.3075.2610.870.390.7 ± 0.2
63 / T7.3537.3360.230.780.9 ± 0.2
Table 4. EMA (MEMS) vibration frequencies, and correlation with past FEA results [44]. Key: F = flexural; T = torsional; Δ = 100 × (fMEMSfFEA)/fFEA.
MEMSEMA (MEMS)-to-FEA Modal Correlation
Vibration ModeMAC (Equation (5))fFEAΔ
Order/TypefMEMS (Hz)(%)(Hz)(%)
11/F1.67899.7 Jsan 07 00030 i0011.6193.64
21/T2.65999.12.691−1.19
32/F3.34096.83.2383.15
42/T4.77784.44.7181.25
53/F5.30776.15.2960.21
63/T7.35382.97.372−0.26
Table 5. EMA (MEMS)-to-FEA modal correlation and vibration shapes (3D axonometric view).
Mode #EMA (MEMS, in Red)-to-FEA (Blue) Modal CorrelationFEA Modal Shape
1st
(1F)
Jsan 07 00030 i002 Jsan 07 00030 i003
2nd
(1T)
Jsan 07 00030 i004 Jsan 07 00030 i005
3rd
(2F)
Jsan 07 00030 i006 Jsan 07 00030 i007
4th
(2T)
Jsan 07 00030 i008 Jsan 07 00030 i009
5th
(3F)
Jsan 07 00030 i010 Jsan 07 00030 i011
6th
(3T)
Jsan 07 00030 i012 Jsan 07 00030 i013

