1. Introduction
Cognitive radio (CR) technology is a viable solution that addresses the problem of the spectrum scarcity [
1]. It enables secondary users to sense, dynamically adjust their transmission parameters, and access the idle frequency channels (spectrum holes) without causing any harmful interference to the primary users [
2]. Due to the unreliable nature of the wireless communication, cognitive radio networks can be subject to various cyber-attacks which can have a negative impact on their performance [
3,
4,
5]. Examples of these attacks include asynchronous sensing attacks [
3], primary user emulation (PUE) attacks [
5,
6], spectrum sensing data falsification (SSDF) attacks [
6,
7], and jamming attacks [
8,
9].
A PUE attack targets the CR physical and MAC layers and is considered as one of the most severe attacks in which a malicious user emulates the transmission characteristics of the primary user (PU) and mimics its behavior to mislead legitimate secondary users. Such an attack can create a harmful interference to the primary user and prevent other secondary users from using the idle spectrum frequency channels [
5,
6]. There are two types of primary user emulation attackers [
10]: selfish and malicious. The purpose of the selfish attacker is to use and selfishly exploit an idle frequency channel without sharing it with other legitimate secondary users. The malicious attacker, on the other hand, aims at causing a denial of service in cognitive radio networks and preventing secondary users from accessing the available frequency channels.
Several approaches have been proposed to cope with the PUE attacks [
11,
12,
13,
14,
15,
16,
17,
18,
19,
20,
21,
22,
23,
24]. For instance, the authors of Reference [
11] proposed an energy-based detection approach to detect the source of the signal and decide if it is emitted by a legitimate primary user or an attacker. In their approach, each secondary user measures the power level of the received signal and compares it to that from a legitimate PU. The authors of Reference [
12] proposed a belief propagation framework based on a Markov random field to detect the primary user emulation attacker. Each secondary user decides whether the signal is coming from a legitimate primary user or not using the energy detection technique then calculates the belief and exchanges it with other secondary users. If the average of the belief values is lower than a predefined threshold, then the signal is coming from a malicious user, otherwise, it is coming from a legitimate user. However, techniques based on energy detection are not efficient in distinguishing between noise and signal, and they suffer from a high probability of false alarm [
13].
Feature-based techniques, such as autocorrelation and matched filter [
14,
15], are also inefficient in distinguishing between the PU signals and those of the PUE attacker. For instance, the authors of Reference [
16] used the cyclostationary feature of the transmitter’s signal to detect the source of the incoming signal. However, this technique is not efficient in detecting malicious users which can mimic the primary user signal features. In Reference [
17], the authors proposed a radio-frequency fingerprinting detection technique. In this technique, the transmitter is identified based on some unique radiometric features extracted from its analog signals. In another paper [
18], the authors proposed a detection technique using the characteristics of wireless channels. As the statistical property of the wireless channel between the transmitter and the receiver is unique in a wireless environment, this feature is used as a radio fingerprint to detect the primary user emulation attacker. However, radio fingerprinting based approaches require additional hardware or software to implement. In addition, these techniques are inefficient in identifying the primary user signal effectively since the characteristic of the noise introduced by the hardware is random.
Other techniques have been proposed to estimate the position of the transmitter and compare the estimated position with the known position of the primary user. The authors of Reference [
19] proposed a time difference of arrival (TDoA) based approach to estimate the position of the transmitter. In this approach, the time elapsed between the transmission of the signal and the reception of the reply is used to estimate the location of the transmitter. Though TDoA can estimate more accurately the transmitter position than other techniques, it requires a tight synchronization between the transmitters and the receivers, which is challenging. In Reference [
20], the authors proposed an angle of arrival based approach for detecting the transmitter’s position. In this approach, the direction of the received signal is measured at different reference nodes, then by applying the triangulation technique, the transmitter location can be estimated. However, this technique is affected by the multipath phenomenon [
21]. The authors of Reference [
22] proposed a mitigation approach to distinguish the primary user signal from other signals via an energy-efficient localization technique and channel parameter variance. The authors of Reference [
23] proposed a model based on the trilateration, the received signal strength (RSS), and the particle swarm optimization to increase the detection accuracy of the primary user emulation attacker. All the previously mentioned techniques do not deal with uncertainty which affects the measurements. The authors of Reference [
24] proposed a Bayesian model and trilateration technique for detecting the primary user emulation attack position. Based on the received signal strength, the Bayesian decision theory is used to deal with the uncertainty related to the primary user environment and increase the detection accuracy of the primary user position.
The existing localization techniques assume that the primary user position is fixed and known. Thus, each secondary user derives the position of the transmitter based on the received power and then compares it to the known position of the legitimate PU in order to verify if the transmitter is the legitimate PU or an attacker. However, in wireless communication networks where the primary user is mobile, such as cognitive radio ad hoc networks, the existing techniques produce inaccurate results since the position of the primary user varies over time. Therefore, in this paper, we propose a localization approach to detect the primary user emulation attacks in the case of mobile primary users. The proposed approach is based on the Kalman filter framework for tracking the position of the primary user then the transmitter received power is used to derive the position of the transmitter before comparing it to the position estimated by Kalman filter.
The Kalman filter has been applied in several contexts including robotics vision, wireless sensor network, and tracking moving objects [
25,
26,
27,
28,
29,
30,
31,
32,
33,
34,
35]. For instance, in Reference [
25], the authors used the Kalman filter for robot mobile localization purpose. In Reference [
26], the Kalman filter was applied for face tracking; and in Reference [
27] the authors used the Kalman filter for tracking balls in the robotics vision field. Other applications of the Kalman filter have been proposed in the field of wireless sensor networks. For example, in Reference [
28], the authors proposed an approach based on the Kalman filter combined with the Maximum Likelihood Estimation for tracking nodes in wireless sensor networks. The authors of Reference [
29] proposed a routing protocol called SEARCH that predicts the destination in advance using the Kalman filter so that the route is extended and packets are reliably delivered to their destinations. In Reference [
30], the authors used the Kalman filter for tracking the Global Navigation Satellite System signal. In Reference [
31], the authors proposed an approach based on Kalman filtering combined with the particle swarm optimization algorithm for calculating the motion vectors of moving objects. To the best of our knowledge, this is the first application of the Kalman filter for tracking the PU position and detecting the PUE attacker in the cognitive radio context.
The remainder of this paper is organized as follows. In
Section 2, we describe the proposed localization approach based on the Kaman filter. In
Section 3, we first present the metrics used for evaluating the proposed approach’s performance, then we discuss some examples of results and compare the proposed approach with the RSS-based location technique. Finally, some conclusions are drawn in the last section.
2. Methodology
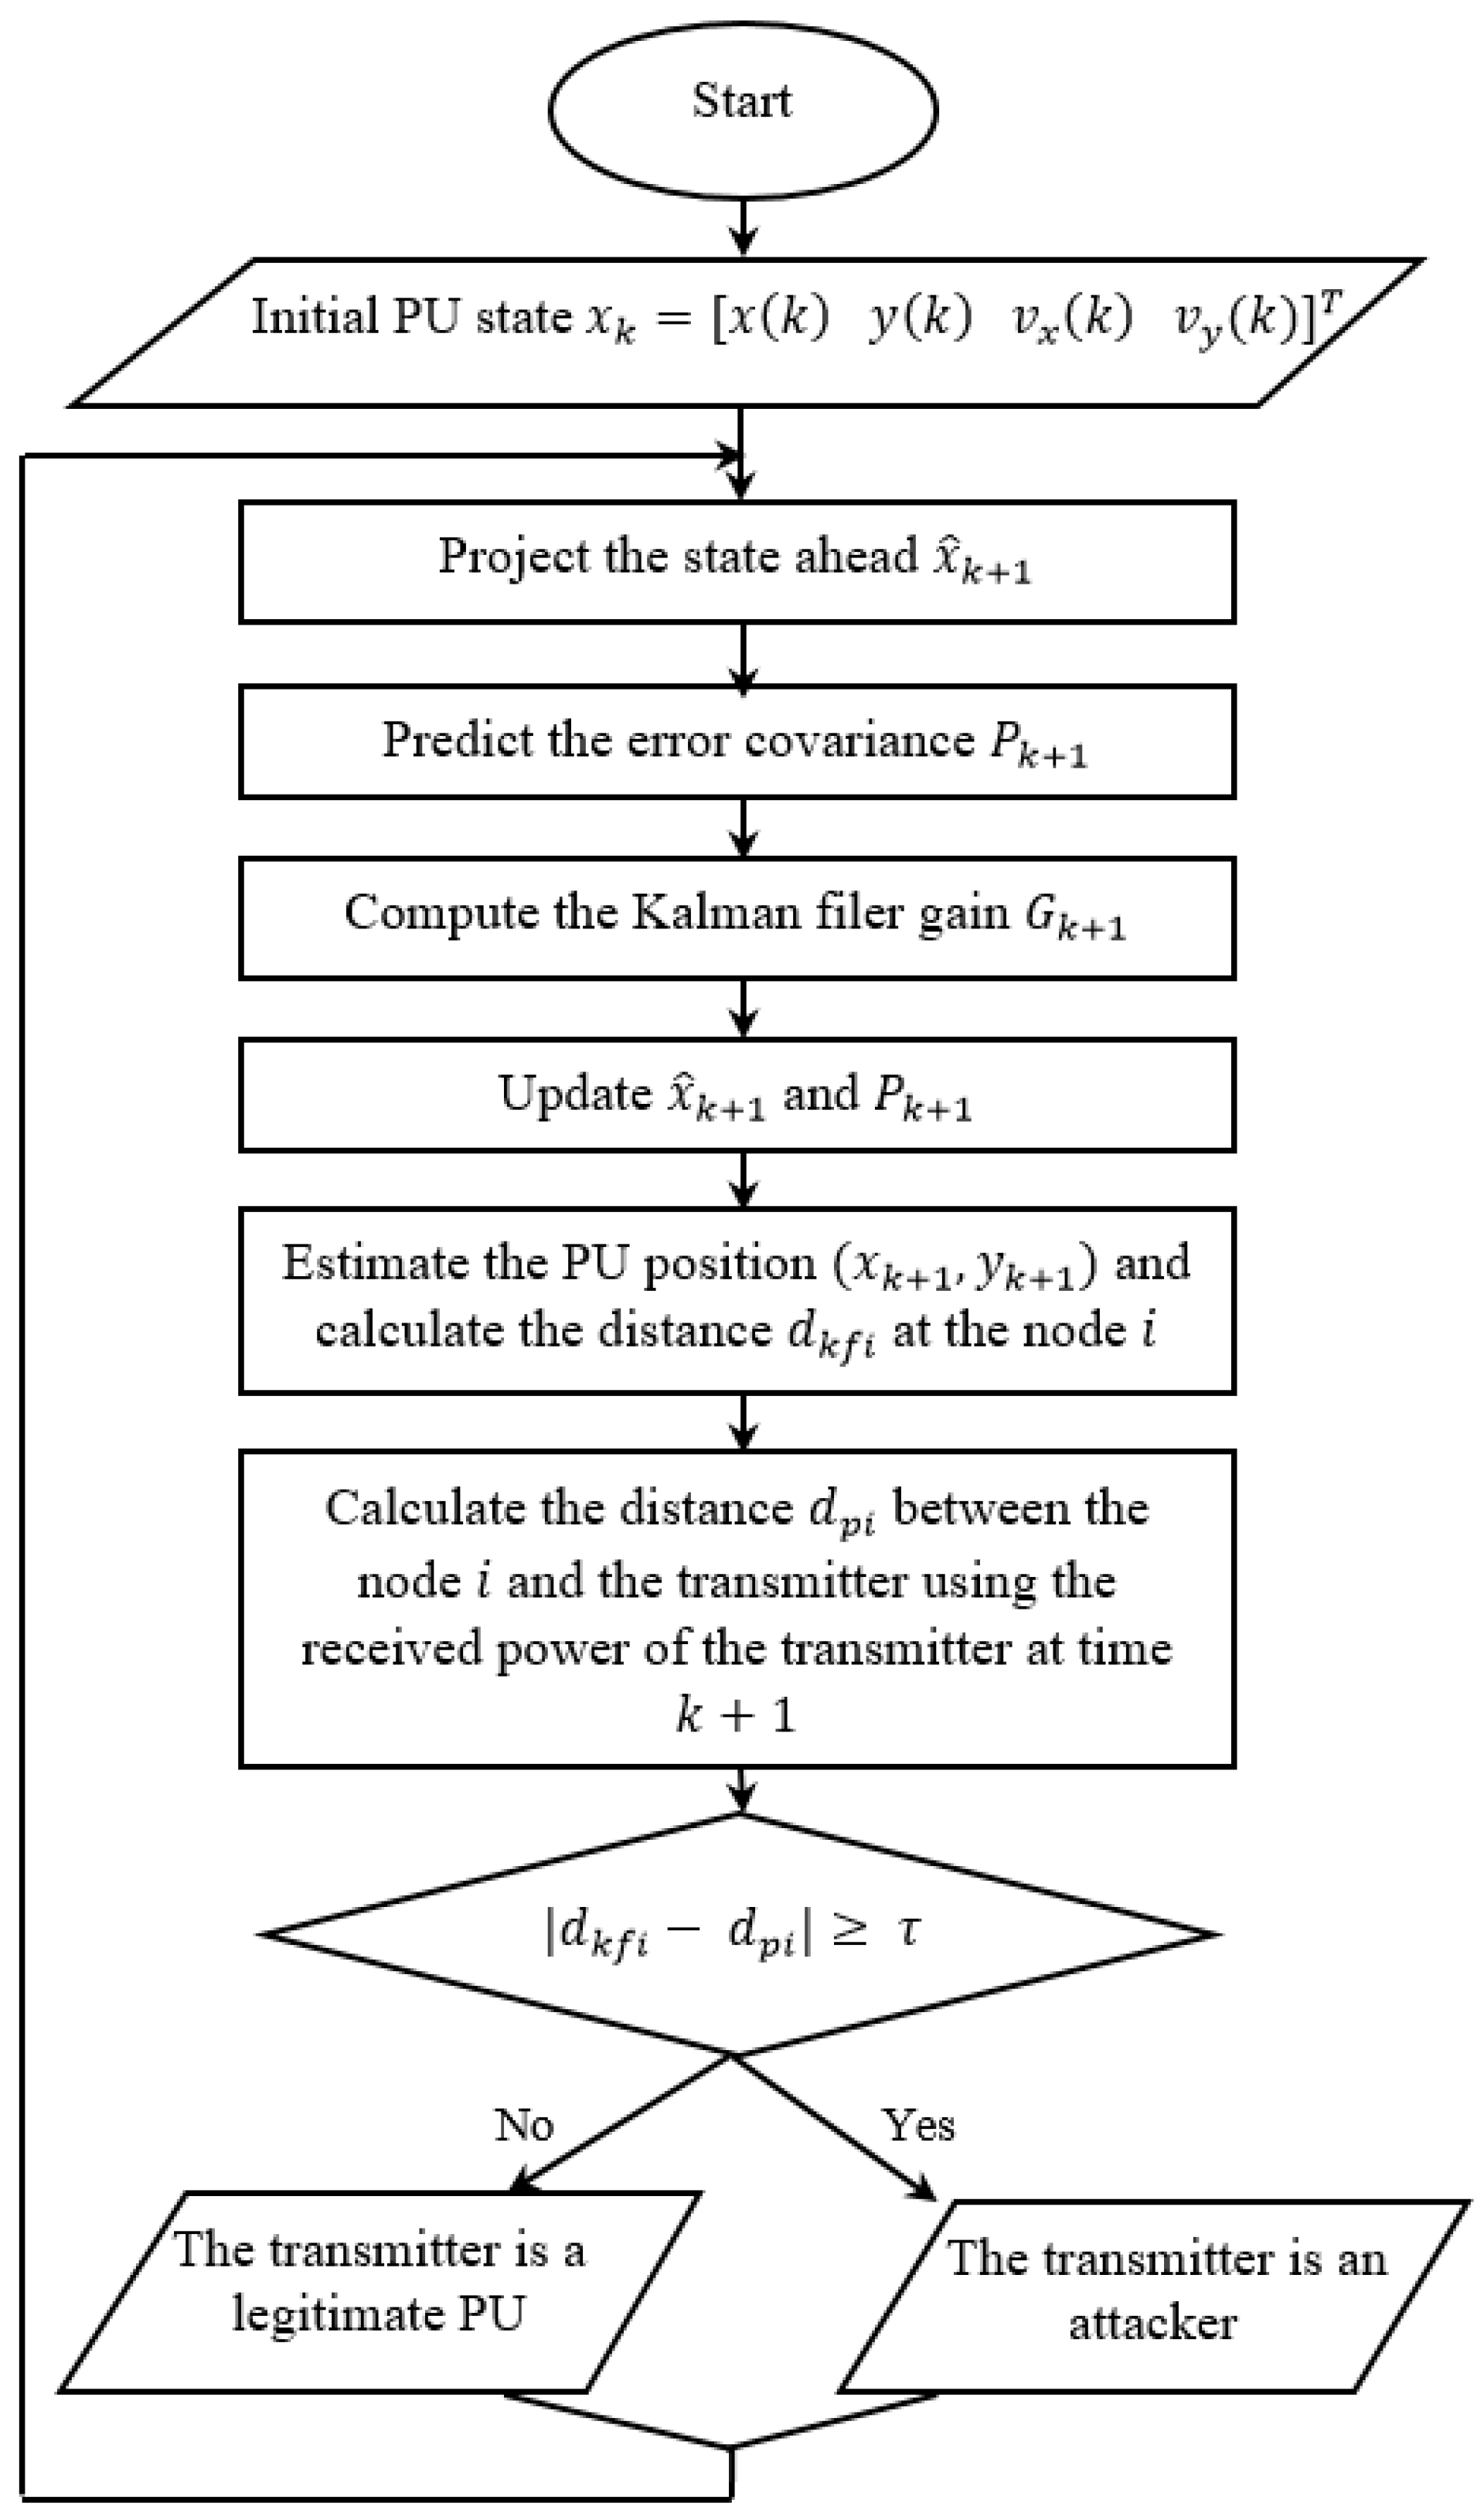
The proposed approach is based on the Kalman filter framework for tracking the primary user location and deciding if the incumbent signal is emitted by a legitimate primary user or from an attacker.
Figure 1 shows the flowchart of the proposed approach. In this approach, the primary user position is tracked using the Kalman filter [
28], then the distance,
between a node
and the legitimate primary user is estimated. Next, the received power of the transmitter is used to calculate the distance,
between the node
and that transmitter using the Free Space Path Loss Equation. If the difference between
and
is greater or equal to a predefined threshold
, then the transmitter is an attacker. Otherwise, it is a legitimate primary user.
In this work, we assume that the primary user is moving in a two-dimensional field and its state is described by its position and its velocity. In addition, we assume that the initial position of the primary user is known to the secondary users. The state of the primary user is represented as
where (
) are the coordinates of the primary user position at the time
and (
) are the velocities of the primary user in
and
-directions at time
, respectively. In addition, we assume that the movement of the primary user is locally linear within the sampling interval time. Thus, its motion can be modeled as
where
and
represent the transition matrix and the control matrix, respectively.
is the acceleration of the primary user and
is a white Gaussian noise with zero mean and covariance matrix
which is given by
where
and
are the covariances of
and
which correspond to the acceleration noise of the primary user along the X-axis and Y-axis, respectively.
The transition and the control matrix are given by
where
is the sampling interval time between two successive measurements at
and
. The measurement model
adopted is given by
where
is the measurement matrix and
is the measurement noise which is a white Gaussian noise with zero mean and covariance matrix
.
is given by
During the first process of Kalman filter, the state of the primary user
and its associated covariance error matrix
at time
are predicted using the following equations
where
is the primary user state at time
,
is the covariance error matrix at time
, and
is the transpose of transition matrix
at time
. During the update process of Kalman filter, the estimated state and its covariance error matrix at time
are updated and corrected using the Kalman filter gain
as follows
where
is the transpose matrix of the measurement matrix
,
is the updated state of the primary user state at
, and
is the updated covariance error matrix
. Once the coordinates of the primary user position (
) are estimated using the Kalman filter, the distance
between a fixed position of an anchor node (
) and the primary user can be obtained using the following equation
In order to verify if the incoming signal is emitted by a legitimate primary user or by an attacker, a distance
between the transmitter and a node
is required. This distance can be obtained from the received power signal of the transmitter using the Free Space Path Loss Equation [
24]:
where
is the received power,
is the transmitted power,
is the antenna gain of the receiver,
is the antenna gain of the transmitter,
is the wavelength, and
is the distance between an anchor node
and the transmitter. Equation (13) can be expressed in dB as
where
is the propagation path loss exponent and
is expressed as
The received signal strength at an anchor node
can be impacted by the noise, Equation (14) can be written as
where
is a white Gaussian noise that follows the normal distribution
. Thus, the distance
can be estimated as
By comparing the difference between the estimated distance and at an anchor node to a predefined threshold , the transmitter is considered as a primary user emulation attacker if the ≥ and as a legitimate primary user when the .
3. Experiments and Results
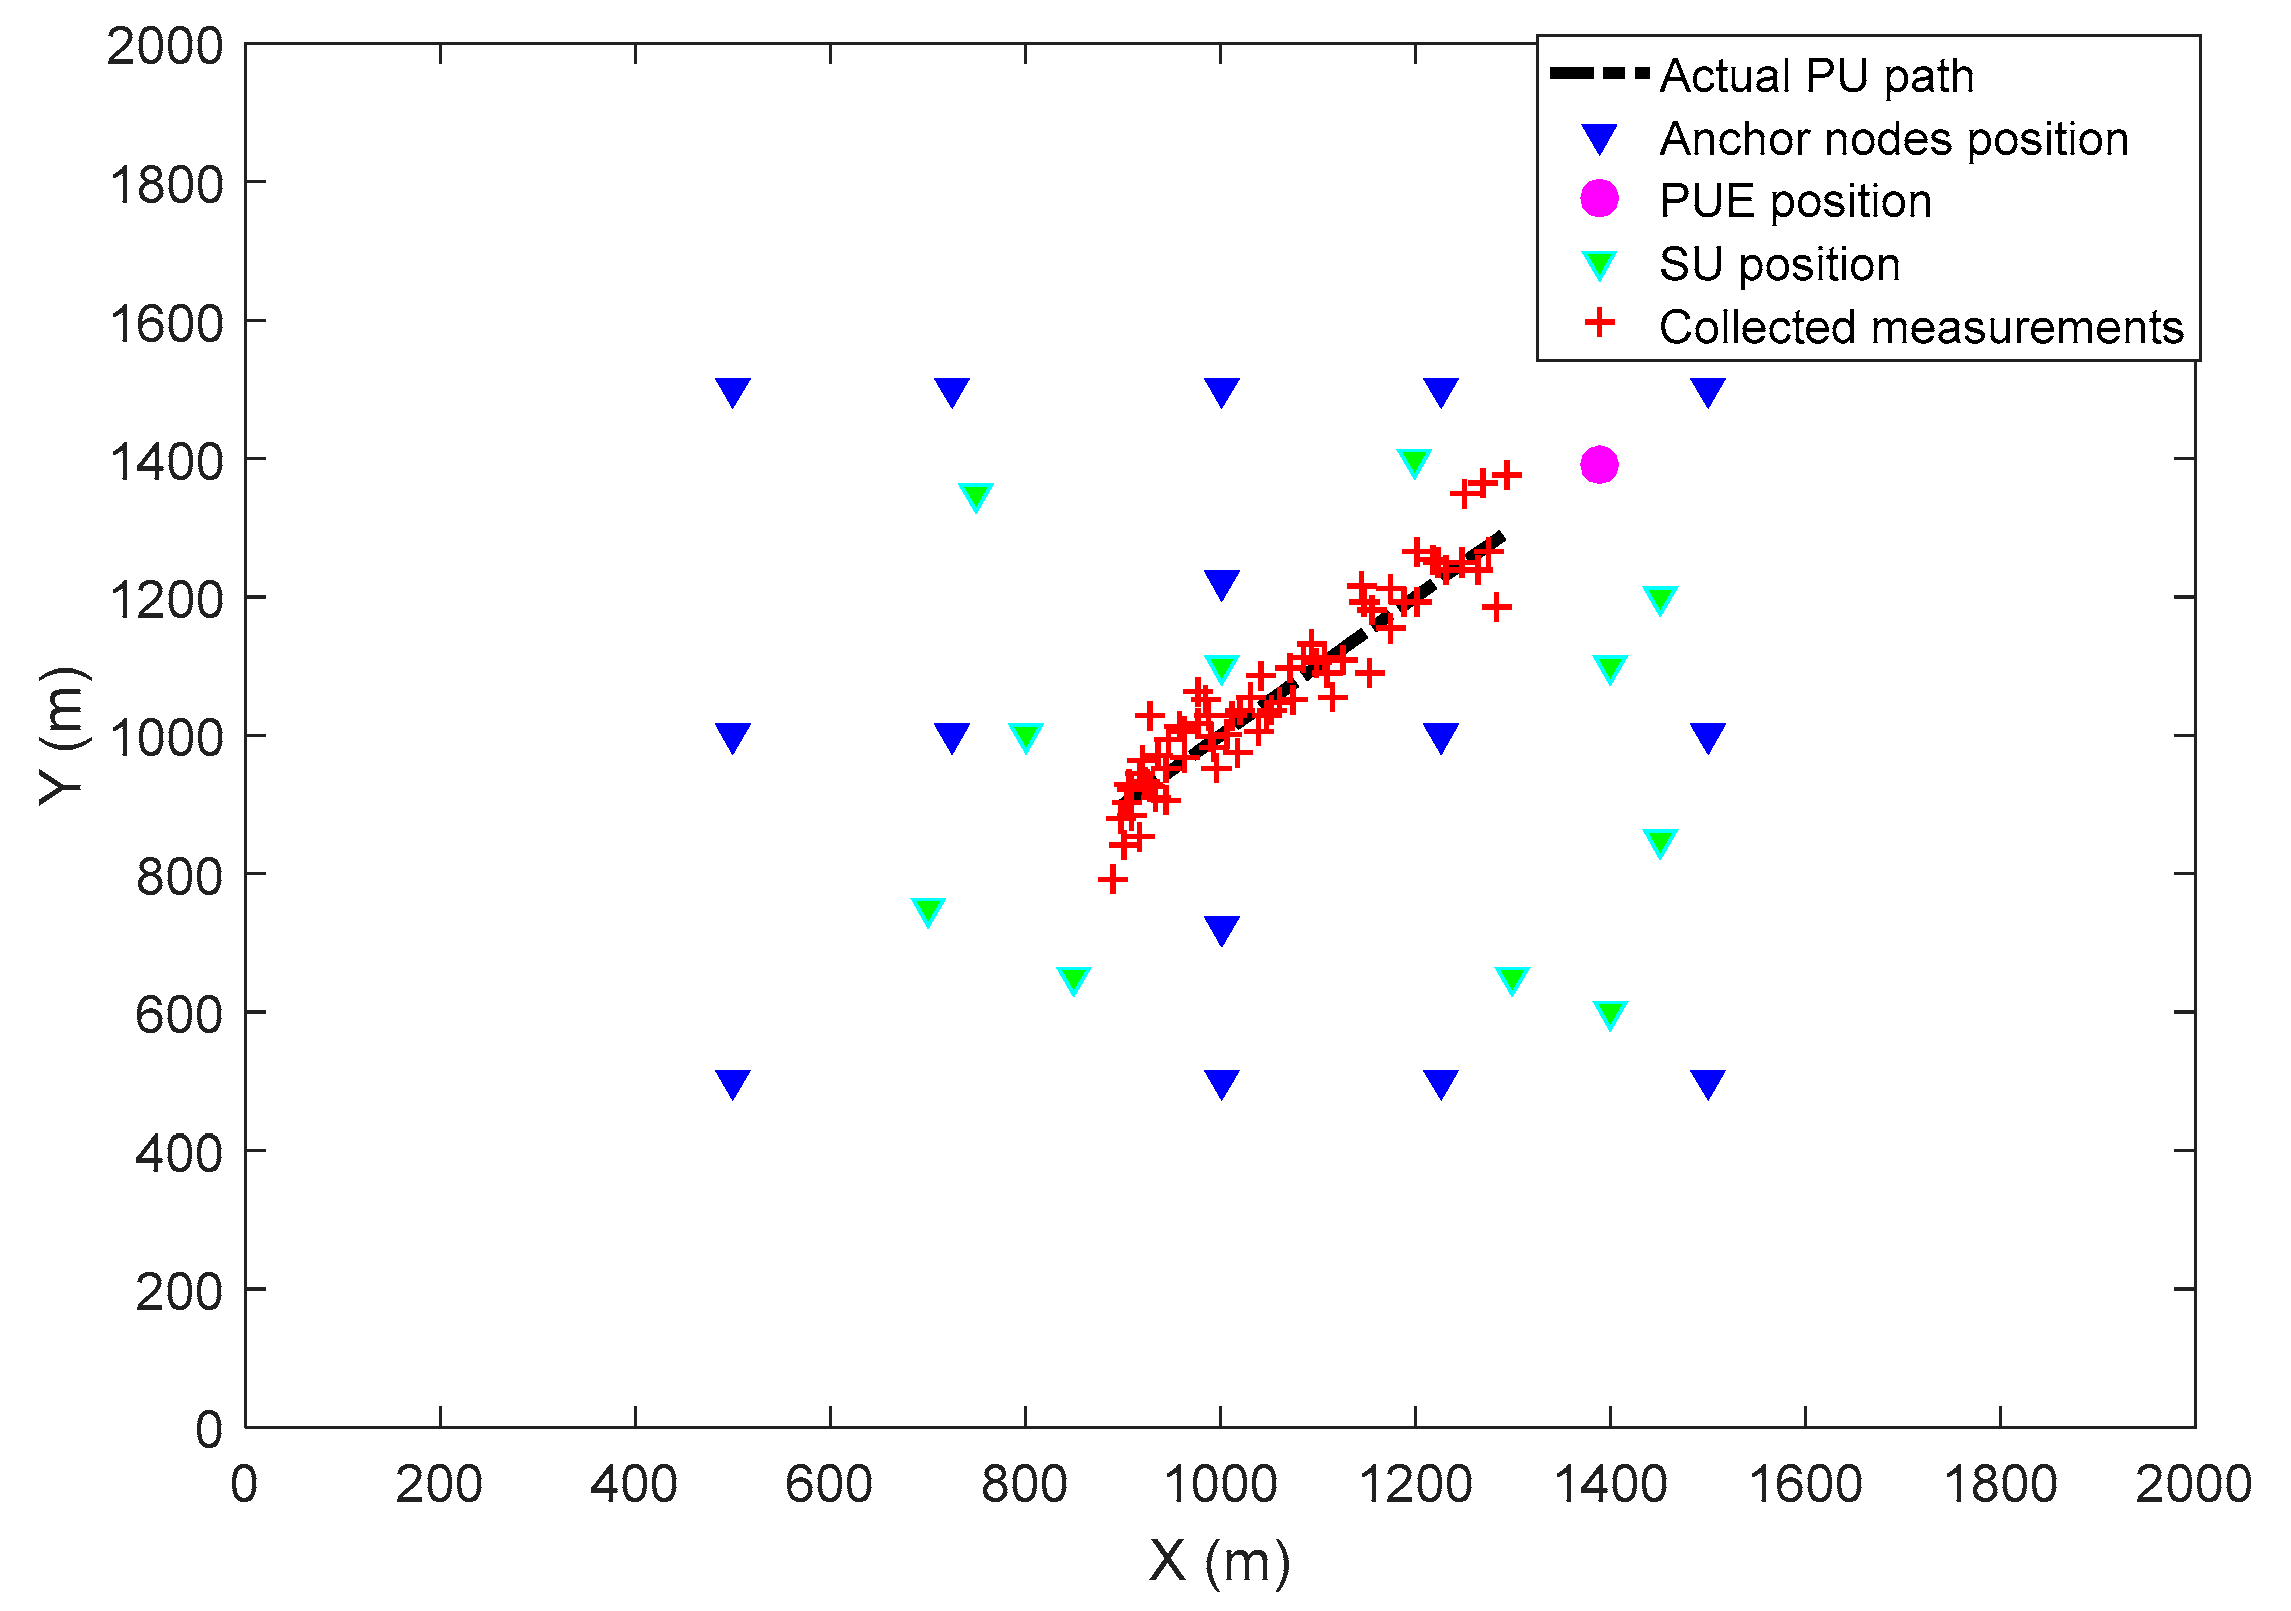
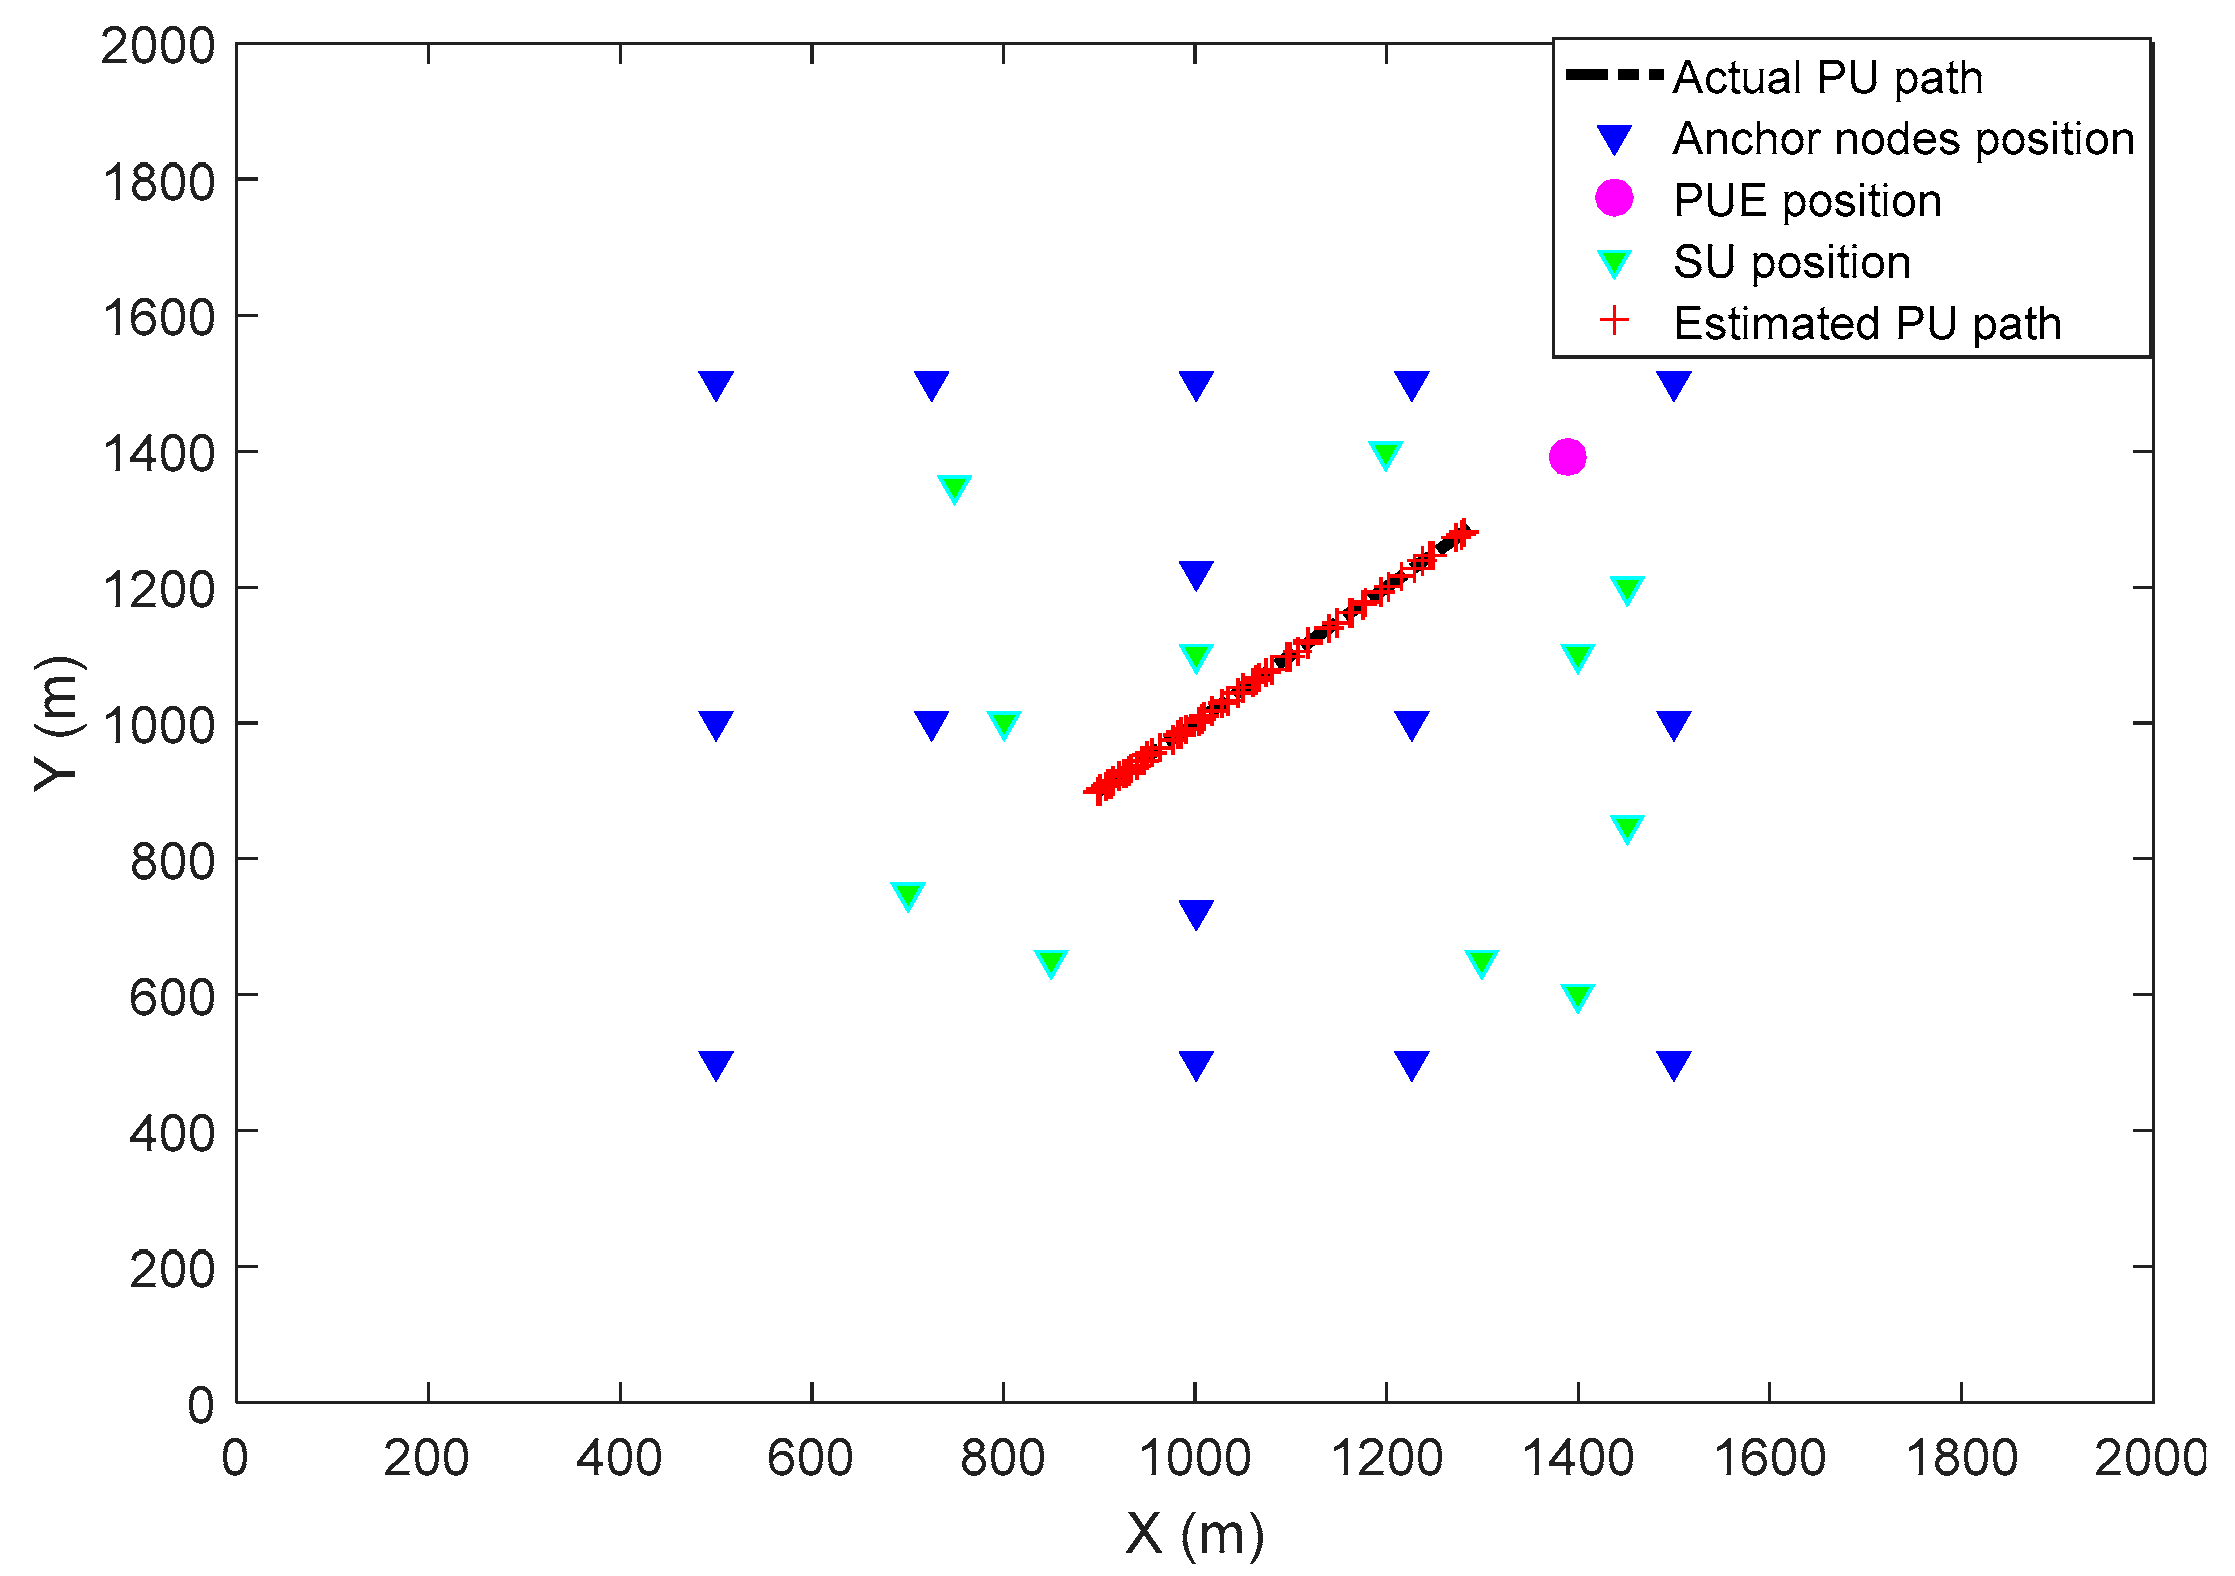
To evaluate the performance of the proposed approach, a simulation of a primary user emulation attack scenario in a virtual cognitive radio network was performed using Matlab. The experiments were carried out on an Intel Core(TM) i7-6700 CPU @ 3.40 GHz 3.41 GHz, 16 GB RAM with a windows 10 64-bit Operating system. In the simulated scenario, we assume that there is a legitimate primary user, a PUE attacker, several secondary users along with some anchor nodes. We assume that the initial position of the primary user is known to the secondary users. Each anchor node gathers the measurements related to the primary user positions and share the results with the secondary users to track the movement of the primary user. These anchor nodes are positioned at specific positions while the secondary users are randomly deployed to simulate a real-world network scenario.
Table 1 gives the simulation parameters used in this paper along with the positions of the anchor nodes, the initial position of the PU, and the position of the PUE attacker.
Due to a number of random variables used in the proposed approach, including the noise affecting the acceleration, the measurement, and the signal, the Monte Carlo technique was used to handle the uncertainty in the simulation. The proposed approach was extensively tested and evaluated using several metrics including the probability of detection, the probability of false alarm, the probability of miss detection, and the error function. The results of the proposed approach were compared to those of the RSS-based localization technique.
The probability of detection, corresponds to the number of times where the primary user emulation attacker signal is correctly classified as an attack divided by the total number of attacks. It is given by
The probability of false alarm, corresponds to the number of times where the legitimate primary user signal is wrongly classified as an attack divided by the total number of legitimate signals. It is expressed as
The probability of miss detection, corresponds to the number of times where an attack is incorrectly classified as a normal signal divided by the total number of attacks. It is given by
The error function calculates the error between the estimated and the actual trajectory of the primary user. It is given by
where
is the actual trajectory,
is the predicted trajectory, and
n is the number of collected measurements.
Examples of results are given in
Figure 2,
Figure 3,
Figure 4,
Figure 5,
Figure 6,
Figure 7,
Figure 8 and
Figure 9.
Figure 2 illustrates the error function versus the measurement noise. As it can be seen from this figure, this function remains almost constant when the measurement noise values are less than 0.02, and it increases exponentially after that value. For measurement noise values equal to 0.2 and 0.07, the error function is 0.1 and 0.11, respectively. When the measurement noise is greater than 0.3, the error function increases exponentially. For instance, when the measurement noise is equal to 7, the error function is equal to 10 and when this measurement noise increases to 8.5, its corresponding error function value rises to 15. These results suggest that measurements noise values that are less than 0.2 are the optimal values for the experiments since they reduce the error between the actual and the predicted trajectory leading to a better estimation of the primary user position. Thus, we selected 0.05 for conducting the remaining experiments.
Figure 3 and
Figure 4 show the scenario used for simulating the mobile primary user, the fixed PUE attacker, secondary users, and anchor nodes. In
Figure 3, the red symbols represent the measurements collected by the anchor nodes regarding the movement of the primary user. Due to the measurement noise, these collected measurements are not precise enough to accurately predict the primary user trajectory. From
Figure 4, it can be seen that after using the optimal measurement noise value selected previously, which is 0.05, and by applying the Kalman filtering process, the predicted trajectory is close to the actual one. These results suggest that the secondary users can use the collected measurements with the Kaman filter to accurately predict the position of a mobile primary user.
Figure 5 shows the probability of detection as a function of the distance,
between a mobile primary user and a primary user emulation attacker for different SNR values. As one can see, the probability of detection increases as the distance between the primary user and the attacker increases. For example, for an SNR value of −10 dB, the probability of detection is equal to 37% when the distance between the primary user and the attacker is 50 m, but this probability increases to 60% when the distance is equal to 100 m. In addition, this figure shows that the probability of detection increases with the increase of SNR values. For instance, for a distance of 50 m between the PU and the PUE attacker, the probability of detection is equal to 37%, 80%, 96%, 99.2%, and 99.7%, for SNR values corresponding to −10 dB, −5 dB, 0 dB, 5 dB, and 10 dB, respectively.
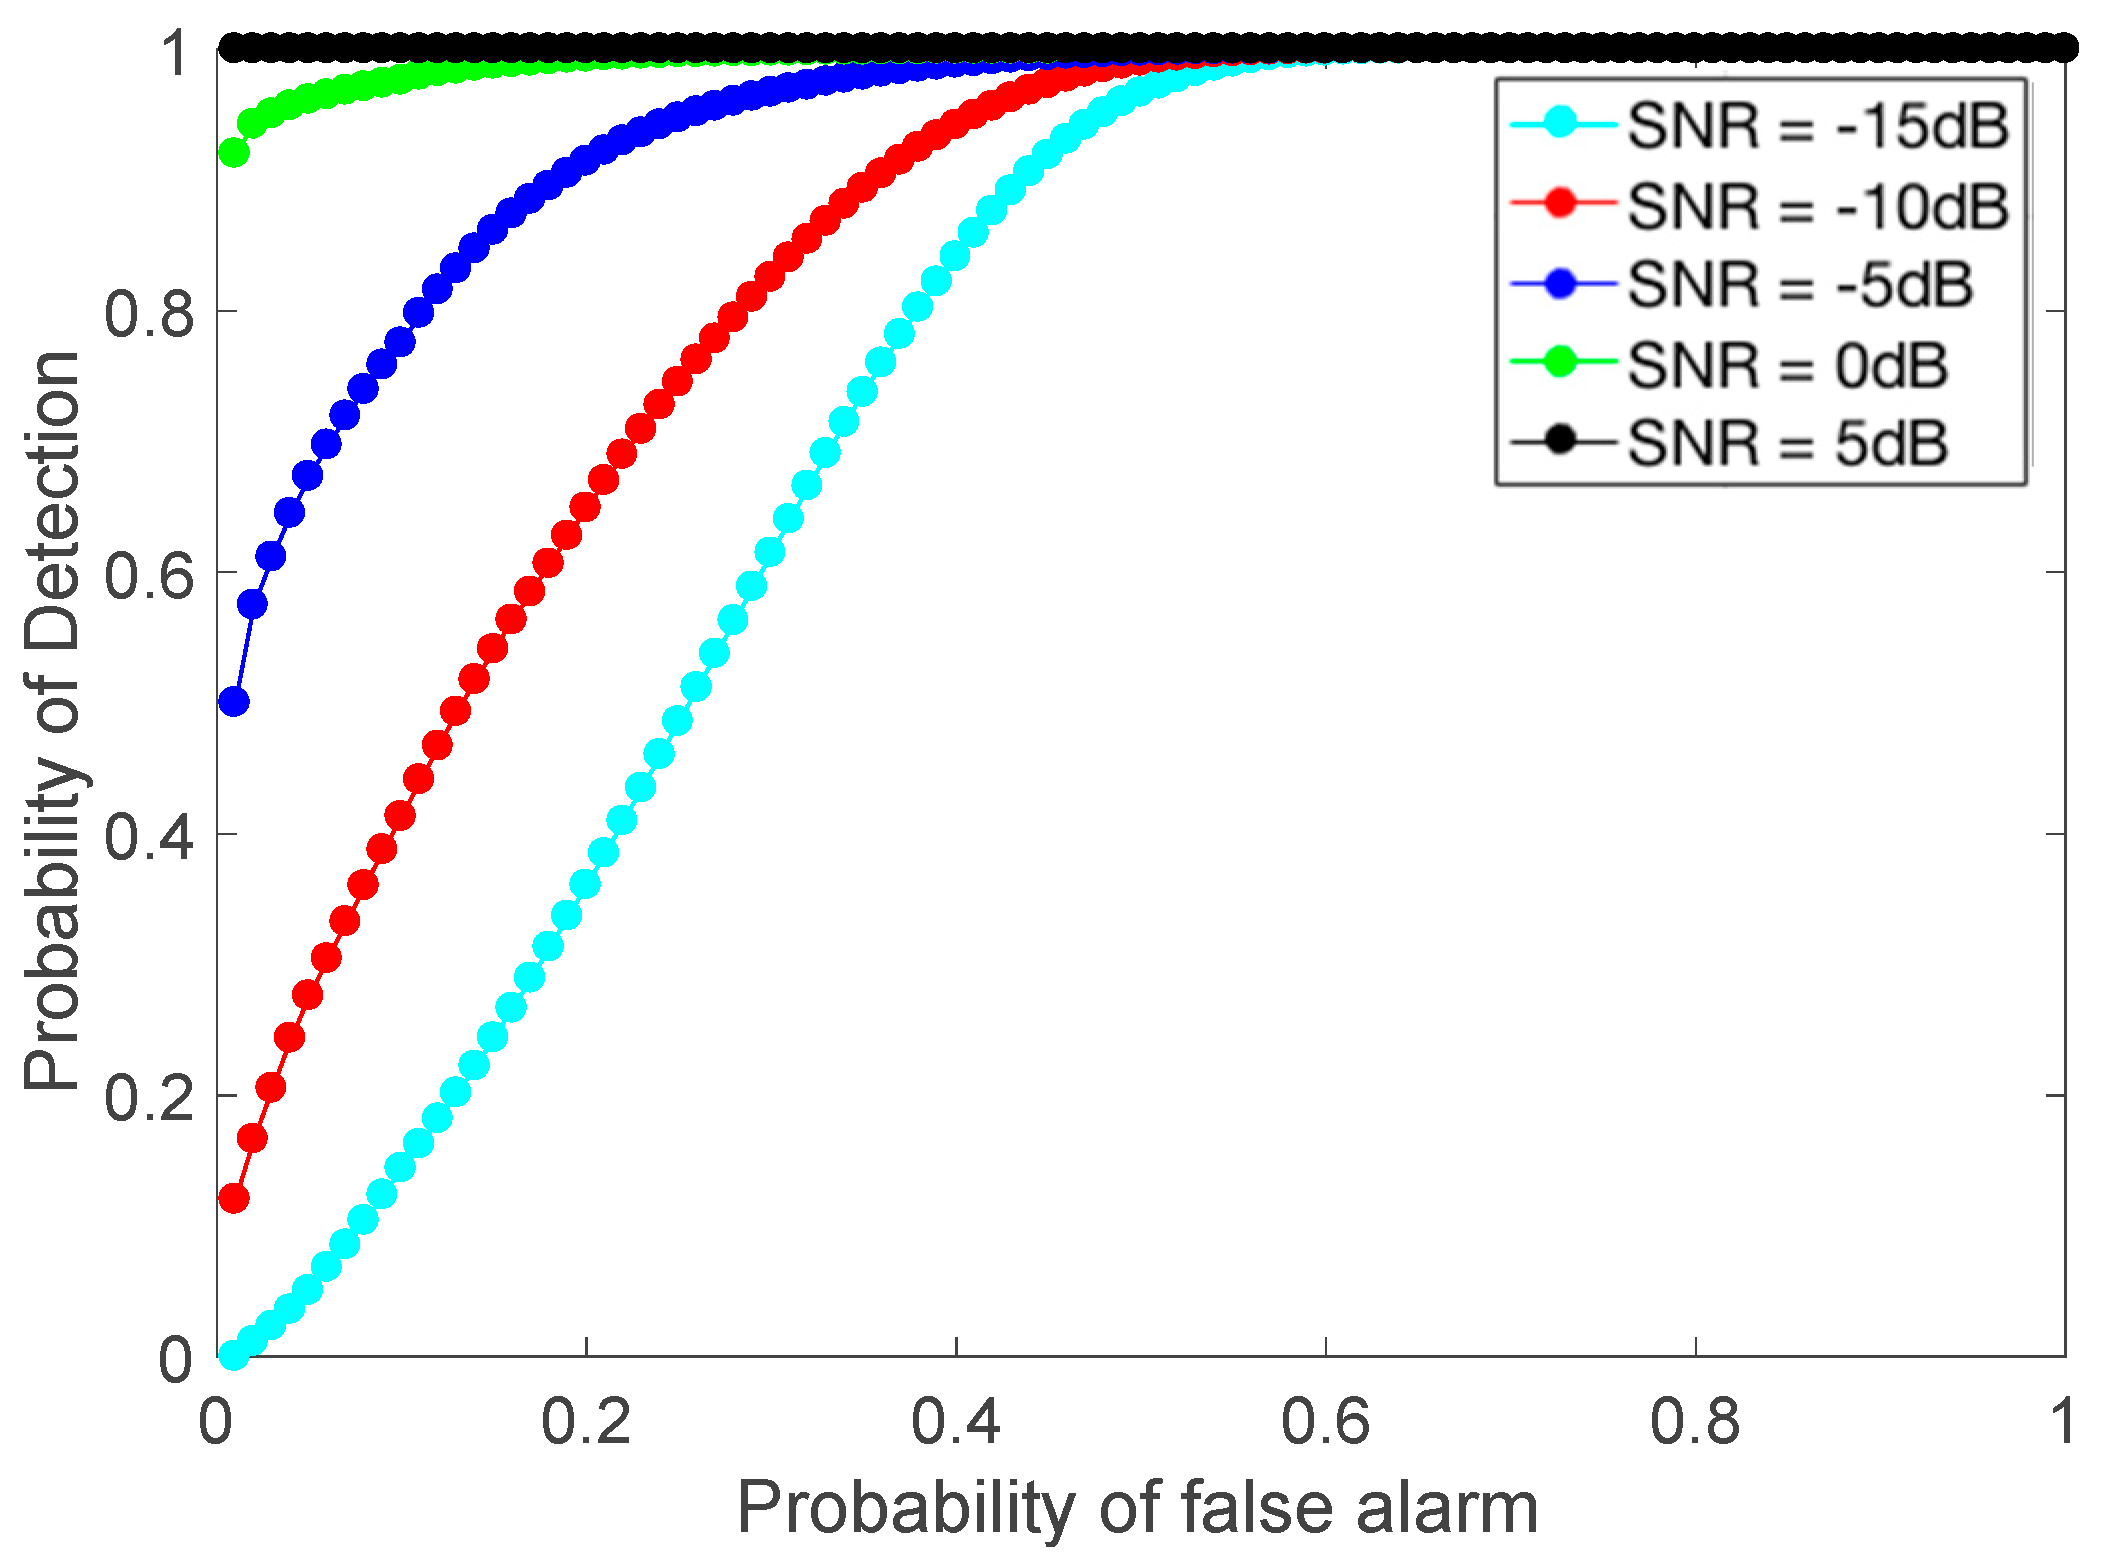
Figure 6 shows the probability of detection as a function of the probability of false alarm for a distance
= 30 m between the primary user and the primary user emulation attacker. As it can be observed, the probability of detection increases with the increase in the probability of false alarm. For example, for an SNR value of −15 dB and with a probability of false alarm of 10%, the probability of detection is 16%, but when the probability of false alarm increases to 30%, the probability of detection is equal to 61%. In addition, with the increase of the SNR value, the probability of detection increases. For instance, with a probability of false alarm of 2%, the probability of detection is equal to 39%, 63% 90%, 99%, and 100% for SNR values corresponding to −15 dB, −10 dB, −5 dB, 0 dB, and 5 dB, respectively.
Figure 7 shows the probability of miss detection as a function of the distance
between a mobile primary user and a primary user emulation attacker. As expected, the probability of miss detection decreases as the distance between the PU and the PUE increases. For example, for an SNR value of −10 dB, the probability of miss detection is equal to 65% when the distance between the primary user and the attacker is equal to 50 m, but this probability drops to 41% when the distance increases to 100 m. In addition, this figure shows that when the SNR value increases, the probability of miss detection decreases. For example, with a distance of 110 m between the primary user and the attacker, the probability of miss detection is equal to 37%, 10%, 5%, 1%, and 0% for SNR values of −10 dB, −5 dB, 0 dB, 5 dB, 10 dB, respectively.
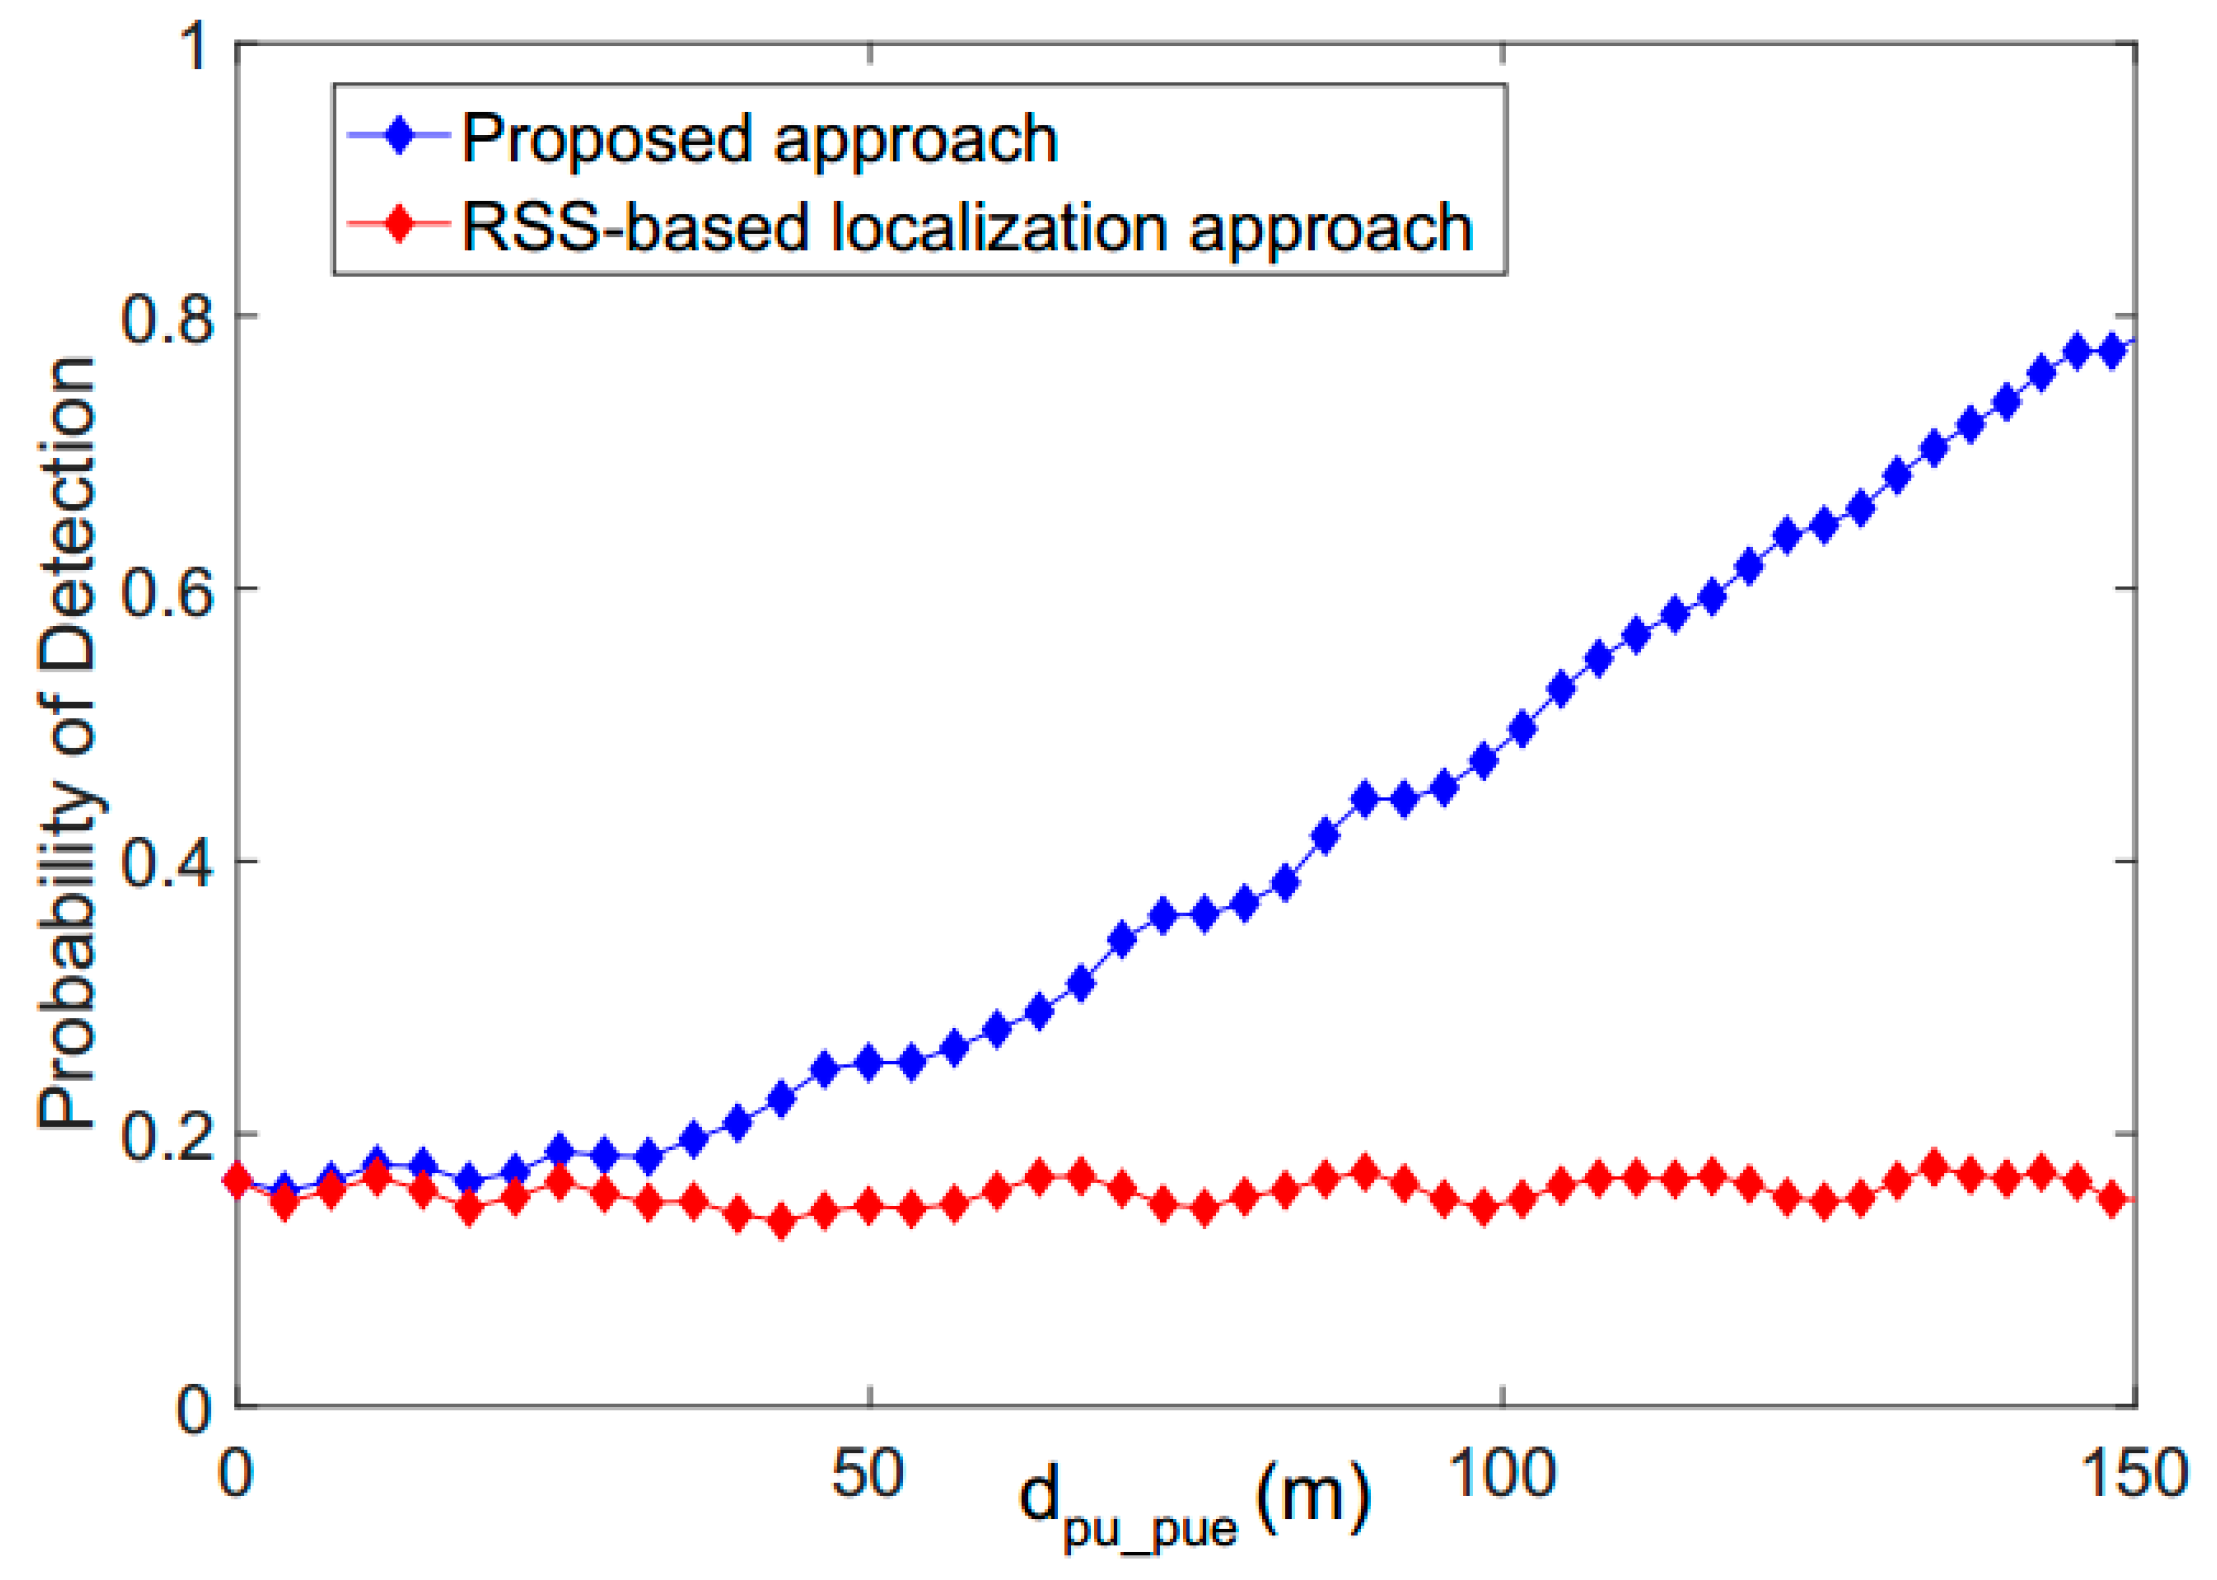
Figure 8 shows a comparison between the proposed approach and the RSS-based localization technique in terms of the probability of detection as a function of distance with an SNR value of −10 dB. The RSS-based localization technique is selected for comparison purpose since it has been proposed in several previous papers [
20,
23,
24]. This technique uses the transmitter received power to derive the position of the transmitter. The calculated position is combined with other techniques including Particle Swarm Optimization and the Maximum Likelihood estimation to optimize the detected location of the transmitter. This technique meets the Federal Communication Commission which states that no modification to the primary user system should be performed to accommodate the opportunistic use of the spectrum by secondary users. As shown in this figure, the probability of detection for the proposed approach, as well as the RSS-based localization approaches, is low when the attacker is in a close proximity to the legitimate primary user location. When the distance increases, the probability of detection of the proposed approach increases while it remains almost the same for the RSS-based localization technique. For instance, when the distance between the primary user emulation attacker and the primary user is equal to 50 m, the probabilities of detection of the proposed approach and the RSS-based localization technique are 24% and 16%, respectively. When the distance increases to 100 m, the probability of detection of the proposed approach increases to 49% while it remains equal to 16% for the RSS-based localization approach. This result suggests that it is challenging to detect the primary user emulation attacker when the attacker is in a close proximity to the legitimate primary user location. However, when the distance becomes larger, the proposed approach produces better results than the RSS-based approach because in this latter, the secondary users use the received signal strength to calculate the position of the transmitter then compare it to the fixed and known position of the legitimate primary user. Since the position of the primary user changes over time, this RSS-based approach produces inaccurate results in terms of the probability of detection.
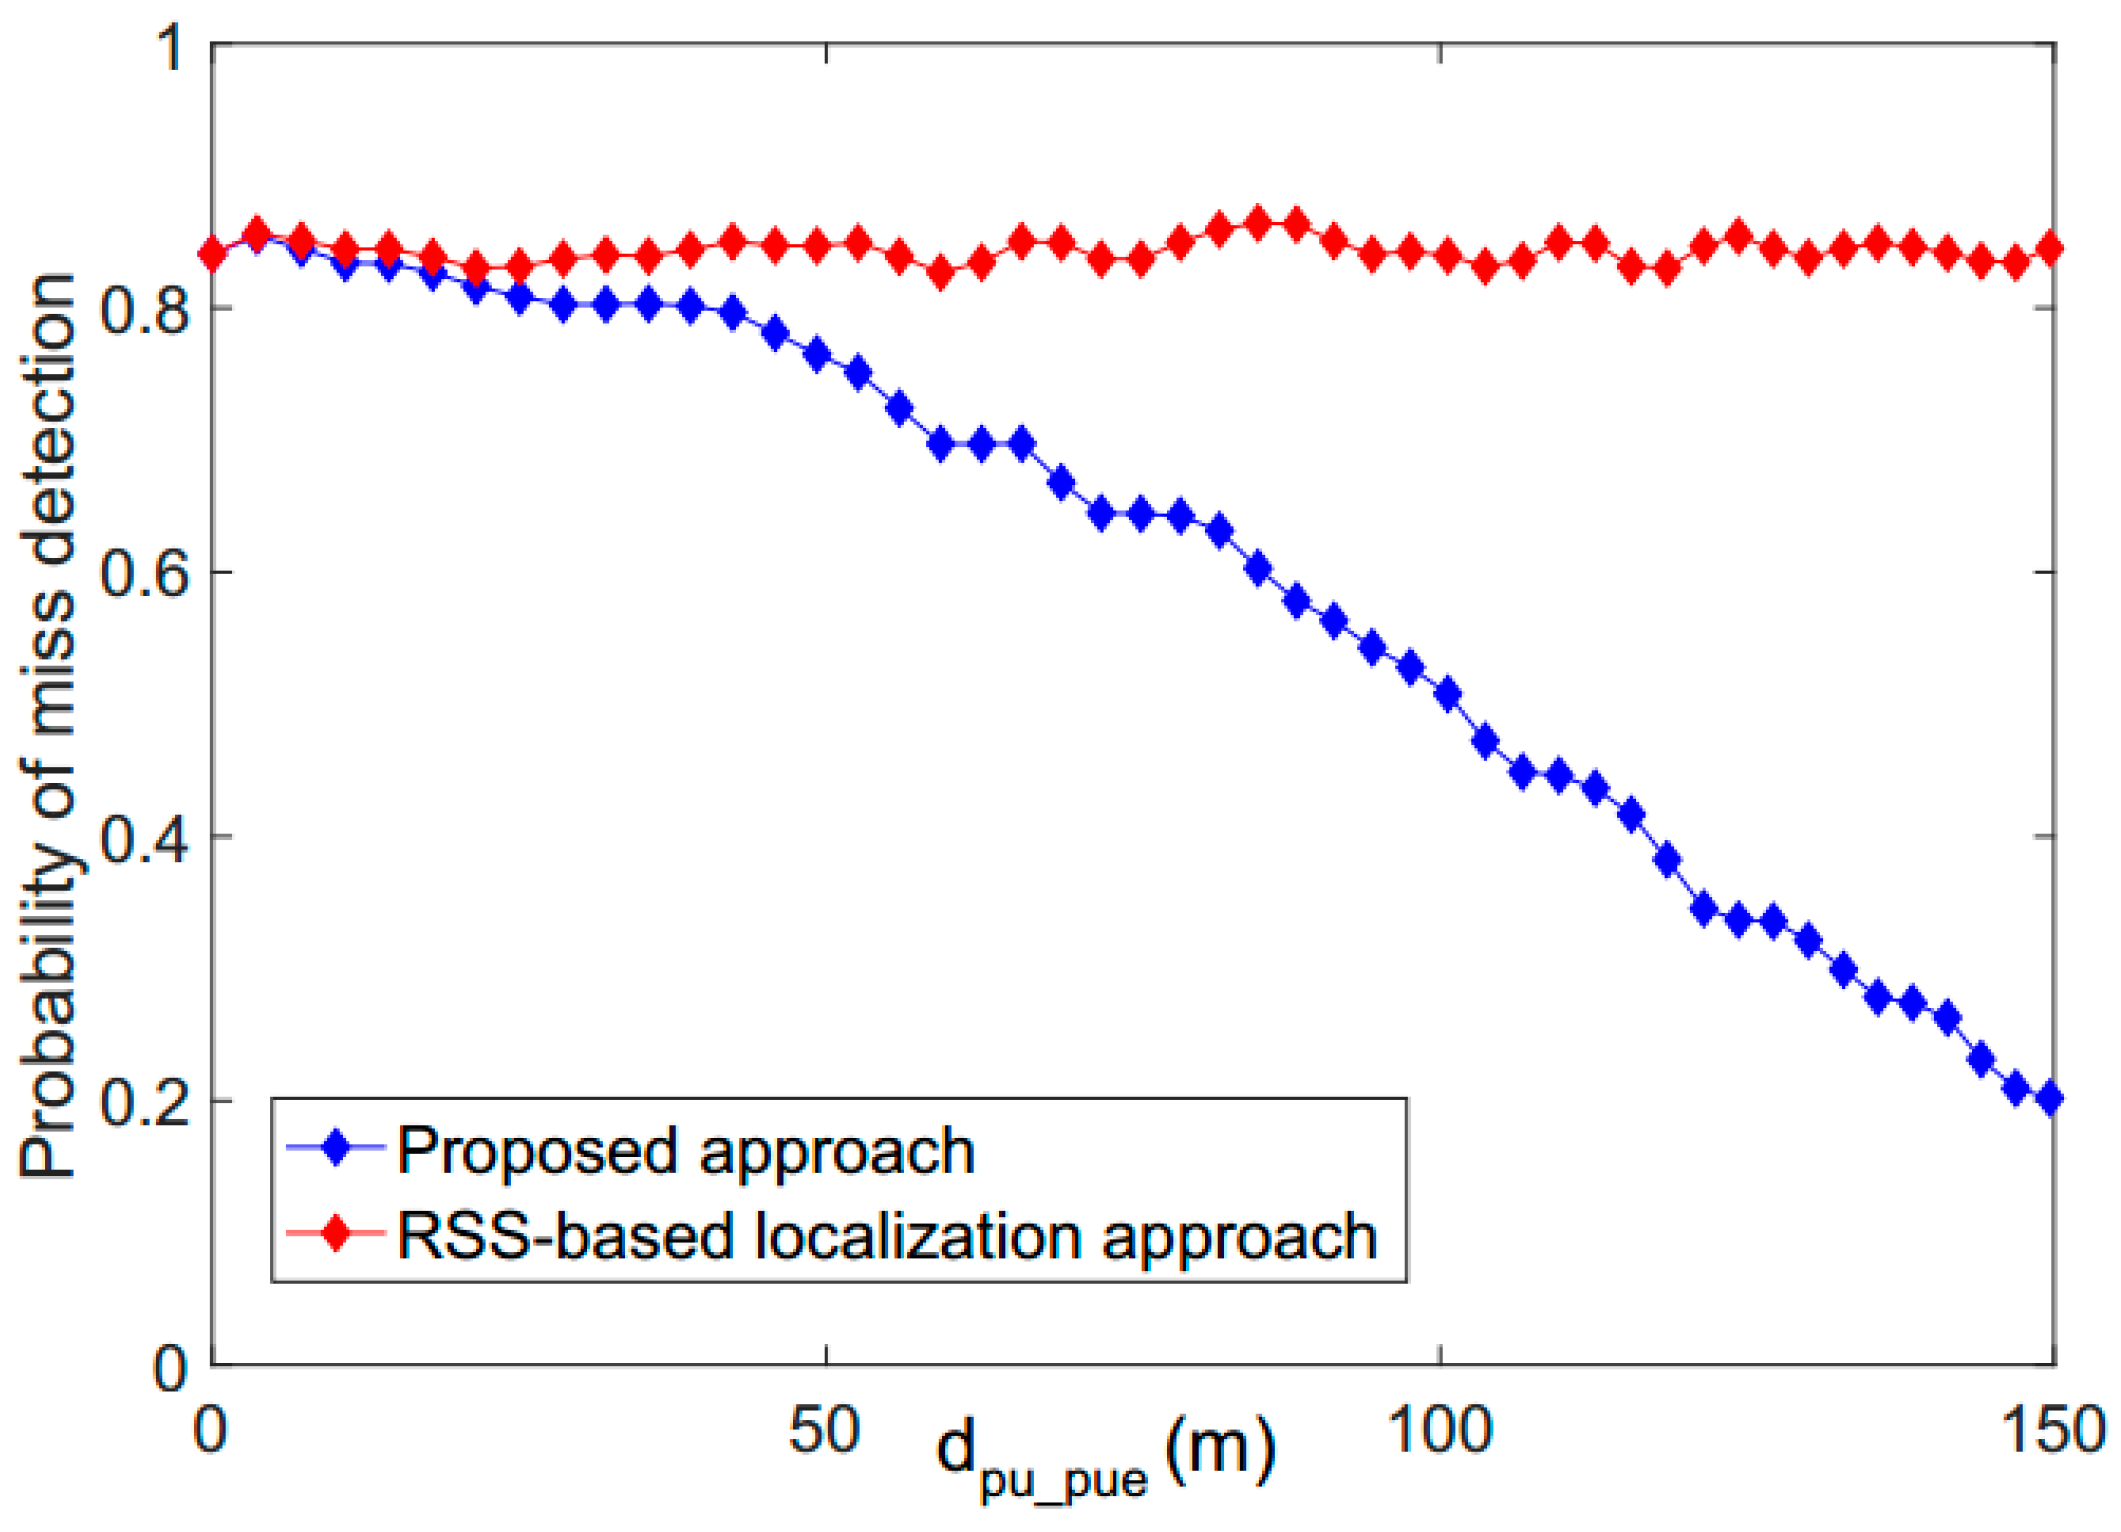
Figure 9 illustrates a comparison between the proposed technique and the RSS-based localization technique in terms of the probability of miss detection as a function of the distance with an SNR value equal to −10 dB. As one can see, the miss detection probabilities of the proposed approach and the RSS-based localization technique are high when the attacker is close to the primary user location. As expected, when the primary user starts moving and the distance becomes larger, the probability of miss detection of the proposed approach decreases while it remains the same for the RSS-based localization technique. For example, when the distance is 50 m, the probabilities of miss detection of the proposed approach and the RSS-based localization technique are 76% and 84%, respectively. When the distance increases to 150 m, the probability of miss detection of the proposed approach decreases to 19% while it remains equal to 84% for the RSS-based localization technique.


