Article

Analyzing the Relationship between Human Behavior and Indoor Air Quality

1
School of Electrical Engineering & Computer Science, Washington State University, Spokane Street, Pullman, WA 99163, USA
2
Department of Civil & Environmental Engineering, Washington State University, 2001 Grimes Way, Pullman, WA 99163, USA
3
School of Design & Construction, Washington State University, Spokane Street, Pullman, WA 99163, USA
*
Author to whom correspondence should be addressed.
J. Sens. Actuator Netw. 2017, 6(3), 13; https://doi.org/10.3390/jsan6030013
Submission received: 7 July 2017 / Revised: 29 July 2017 / Accepted: 31 July 2017 / Published: 2 August 2017
(This article belongs to the Special Issue Smart Homes: Current Status and Future Possibilities)

Abstract

:
In the coming decades, as we experience global population growth and global aging issues, there will be corresponding concerns about the quality of the air we experience inside and outside buildings. Because we can anticipate that there will be behavioral changes that accompany population growth and aging, we examine the relationship between home occupant behavior and indoor air quality. To do this, we collect both sensor-based behavior data and chemical indoor air quality measurements in smart home environments. We introduce a novel machine learning-based approach to quantify the correlation between smart home features and chemical measurements of air quality, and evaluate the approach using two smart homes. The findings may help us understand the types of behavior that measurably impact indoor air quality. This information could help us plan for the future by developing an automated building system that would be used as part of a smart city.

1. Introduction

With global population growth and global aging issues, there will be a corresponding concern about living environment changes that impact human health both inside and outside buildings. In this paper, we focus on indoor air quality (IAQ) and its relationship to human behavior. The National Human Activity Pattern Survey [1] reports that individuals spent an average of 87% of their time indoors, so understanding IAQ and its impacts are of critical importance. Indoor air quality tremendously affects human health, and is considered one of the top five environmental risks to public health [2]. According to the United States Environmental Protection Agency (EPA), indoor pollutant levels may be two to five times, and occasionally 100 times, higher than outdoor pollutant levels [2].
According to a report by the Institute of Medicine [3], three major factors are affecting indoor air pollution: the properties of pollutants, building characteristics, and human behavior. The behaviors of occupants in buildings, as one of the three top components, impact IAQ by affecting the production and persistence of pollutants [4]. Behaviors include routine activities such as cooking, which increase the levels of nitrogen dioxide and carbon monoxide and might lead to hazardous levels of these chemical components. Behaviors also include interactions with the physical environment such as opening or closing windows or doors, which impacts the air exchange rate, thus increasing or decreasing indoor pollution levels.
Many studies have investigated sources of IAQ and their effects on human health [5,6,7]. Researchers recently have started analyzing the relationship between IAQ components and specific IAQ-related human behaviors, such as opening windows [8]. Studies have shown that some human behaviors, such as tending the fire and cooking, increase the total suspended particulates and carbon monoxide (CO) emissions [9]. Based on self-reports, additional domestic behaviors have been included in the analysis, such as sleeping and taking showers. These have been related to CO, particulate matter 10 (PM10) and carbon dioxide (CO2) [10]. Still, other researchers have investigated factors that drive residents to open windows and doors, thus influencing air exchange rates as well as air quality [11]. So far, the relationship of human behavior patterns and IAQ has been studied via questionnaire surveys for activities of daily living (ADLs). However, human behaviors might change daily due to flexible schedules and external factors including weekdays/weekends, holidays, and weather events. Self-report information is notoriously susceptible to error and bias [12], which introduces potential inaccuracies for IAQ studies.
With the rapid advancement of technology to monitor activities in sensor-filled spaces, algorithms have recently been introduced and enhanced to automatically recognize these activities using machine learning techniques [13,14,15,16]. In our study, we combine smart home (SH) technologies with machine learning algorithms to achieve real-time tagging of sensor data with ADL activity labels. An earlier study that used smart environments to relate indoor behavior to IAQ changes had a similar goal [17]. However, the previous study only considered a single behavior parameter (total sensed movement in the environment) and a single IAQ parameter (carbon dioxide level). We expand on the earlier study to consider actual classes of activities that residents perform in the home, rather than just movement level. We also consider a large set of IAQ chemical variables based on the list of criteria air pollutants provided by EPA.
Since human behavior is one of the three major factors that have an influence on IAQ, which in turn has a dramatic impact on human health, it will be beneficial to automatically recognize ADLs using machine learning techniques by monitoring activities in sensor-filled spaces. We hypothesize that machine learning techniques can help us understand the relationship between in-home behavior and IAQ. The findings will help us recognize the types of behavior that significantly impact IAQ, and use this information to develop an automated system to anticipate, prevent and prepare for indoor pollution levels. Such a system could maintain healthier environments, and thus play a central role in the development of smart cities.
To investigate our hypothesis, we collected both sensor-based behavior data and chemical indoor air quality measurements in smart home environments for two houses. We accomplished the investigation by conducting two machine learning-driven analyses. First, we used machine learning algorithms to determine which IAQ variables were measurably impacted by SH features. Second, we identified the particular smart home-based attributes that had the greatest impact on the IAQ variables.

2. Indoor Air Quality

The quality of air indoors is affected by chemical pollutants from diverse sources. The most common indoor air pollutants are from three sources: outdoor pollutants’ sources, indoor combustion/cooking sources, and indoor material and chemical sources.
First, there are two primarily outdoor pollutants’ sources that get into the home: ozone (O3) and particulate matter (PM). The pollutant O3 is photochemically produced by chemical reactions between sunlight, and nitrogen oxides (NOx), and volatile organic compounds (VOCs). Many studies have been evaluating the amounts of O3 that have adverse effects on human health, such as airway hyperreactivity and lung inflammation [18]. In the case of inhalable PM, this category of pollutants includes solid particles and liquid droplets suspended in air, and may cause lung cancer, emphysema, and respiratory infections [19]. For example, in our data collection periods, the experiments were conducted during periods with destructive wildfires that caused heavy smoke and very high levels of PM. The high level of PM would have a great impact on the indoor air quality, the residents’ behaviors, and their health. In our study, we concentrated on the outdoor PM less than 2.5 micrometers (PM2.5).
Next, we considered pollutants from indoor combustion/cooking, and the corresponding effects. Combustion is the main cause of indoor PM, CO, NOx and VOCs [20,21]. These pollutants have tremendous health impacts on the residents, such as respiratory infections in young children, chronic lung diseases, and associated heart disease in adults [22]. To monitor indoor PM in our study, we measured the mass concentration of PM less than 2.5 micrometers, as well as the number of small particles (≥1 mm) and large particles (≥5 mm) [23]. VOCs refer to a group of organic chemicals, and each one has its own possible reason for causing distinct health problems. After hours or days of exposure to the high levels of VOCs from cooking/combustion, a resident may experience eye, nose, throat irritation, and worsening asthma symptoms [24]. Selected VOCs, including formaldehyde, acetaldehyde, acetonitrile, methanol, ethanol, acetone, benzene, toluene, xylenes, styrene, and monoterpenes, were measured continuously with a proton transfer reaction mass spectrometer (PTR-MS, Dylos Corporation, Riverside, CA, USA.) [25]. The PTR-MS drift tube was operated at 120 Td. The response of the instrument to different VOCs was calibrated using an external multicomponent compressed gas standard [26]. Due to sensor limitations, our instruments failed to record the values of CO and NOx during the experiment periods, so we limit our analysis to indoor PM and VOCs.
With regard to indoor material and chemical sources, we considered VOCs from carpet, furniture, building materials, solvents, cleaning supplies, and personal hygiene products [24]. The common VOCs from those sources will have adverse health impacts on residents, such as damage to the respiratory system, headaches, and skin irritations [27,28]. In our collection and analysis, we included all the above chemical variables in both indoor and outdoor environments, as well as data reported by a weather station.
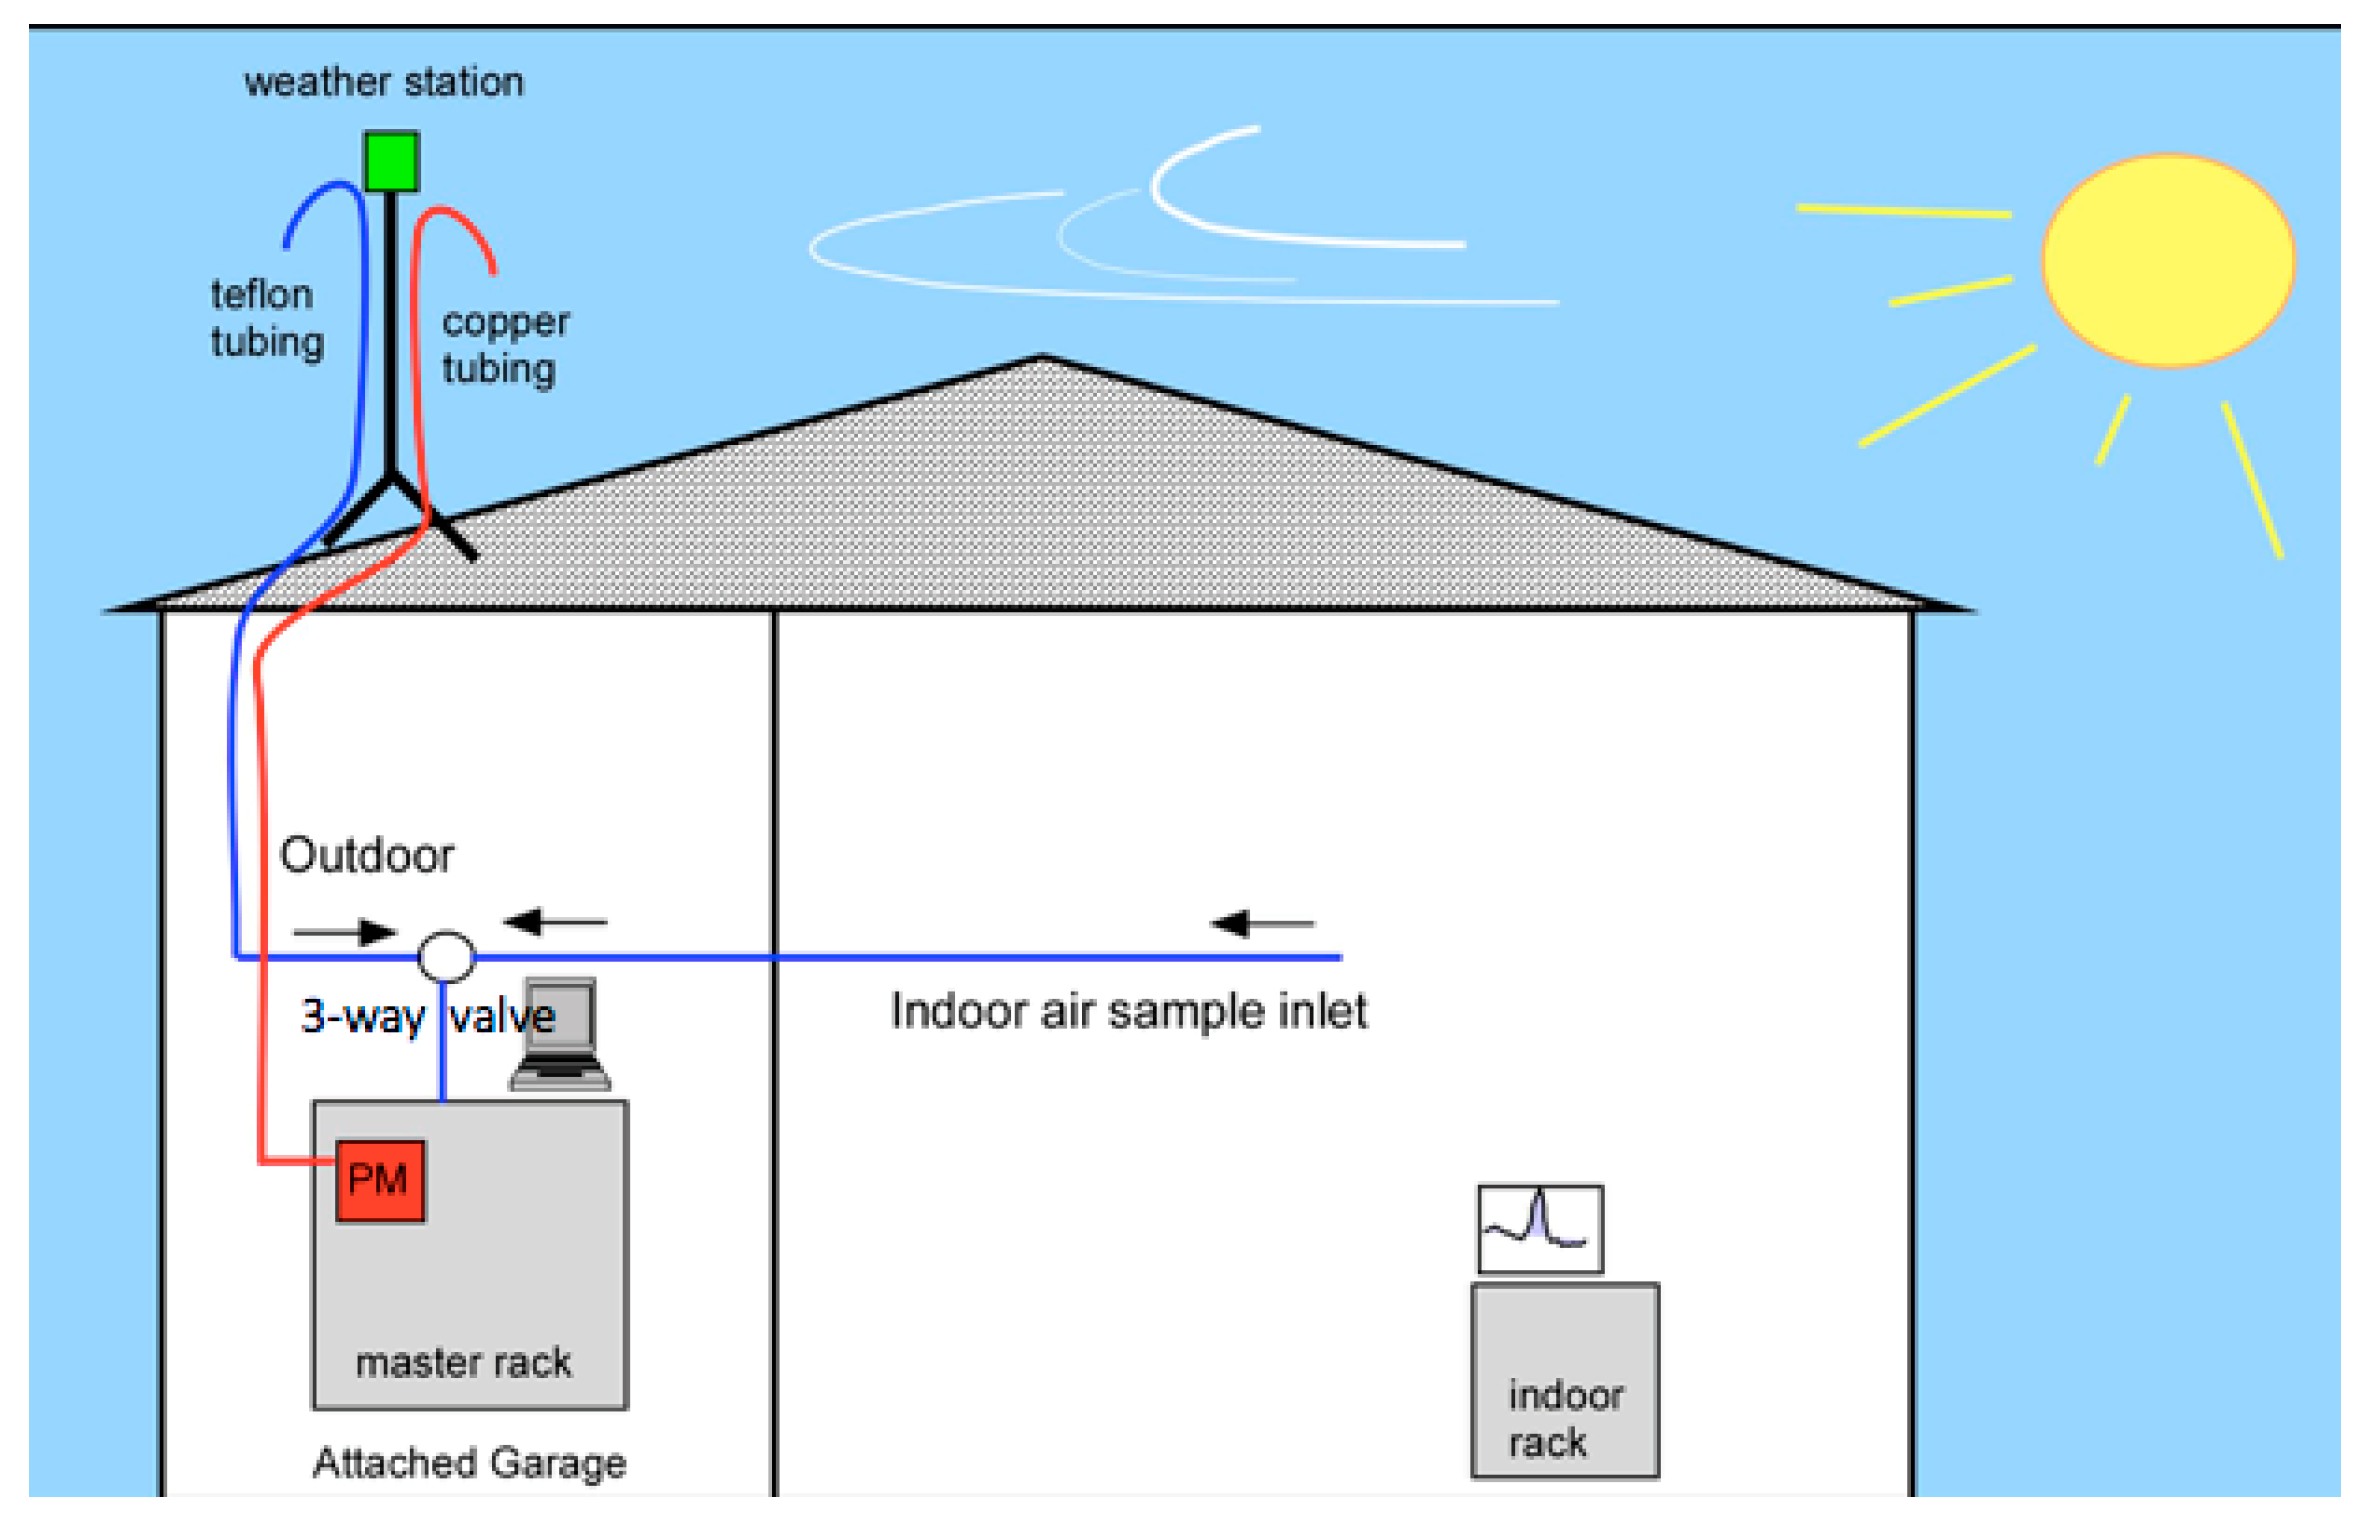
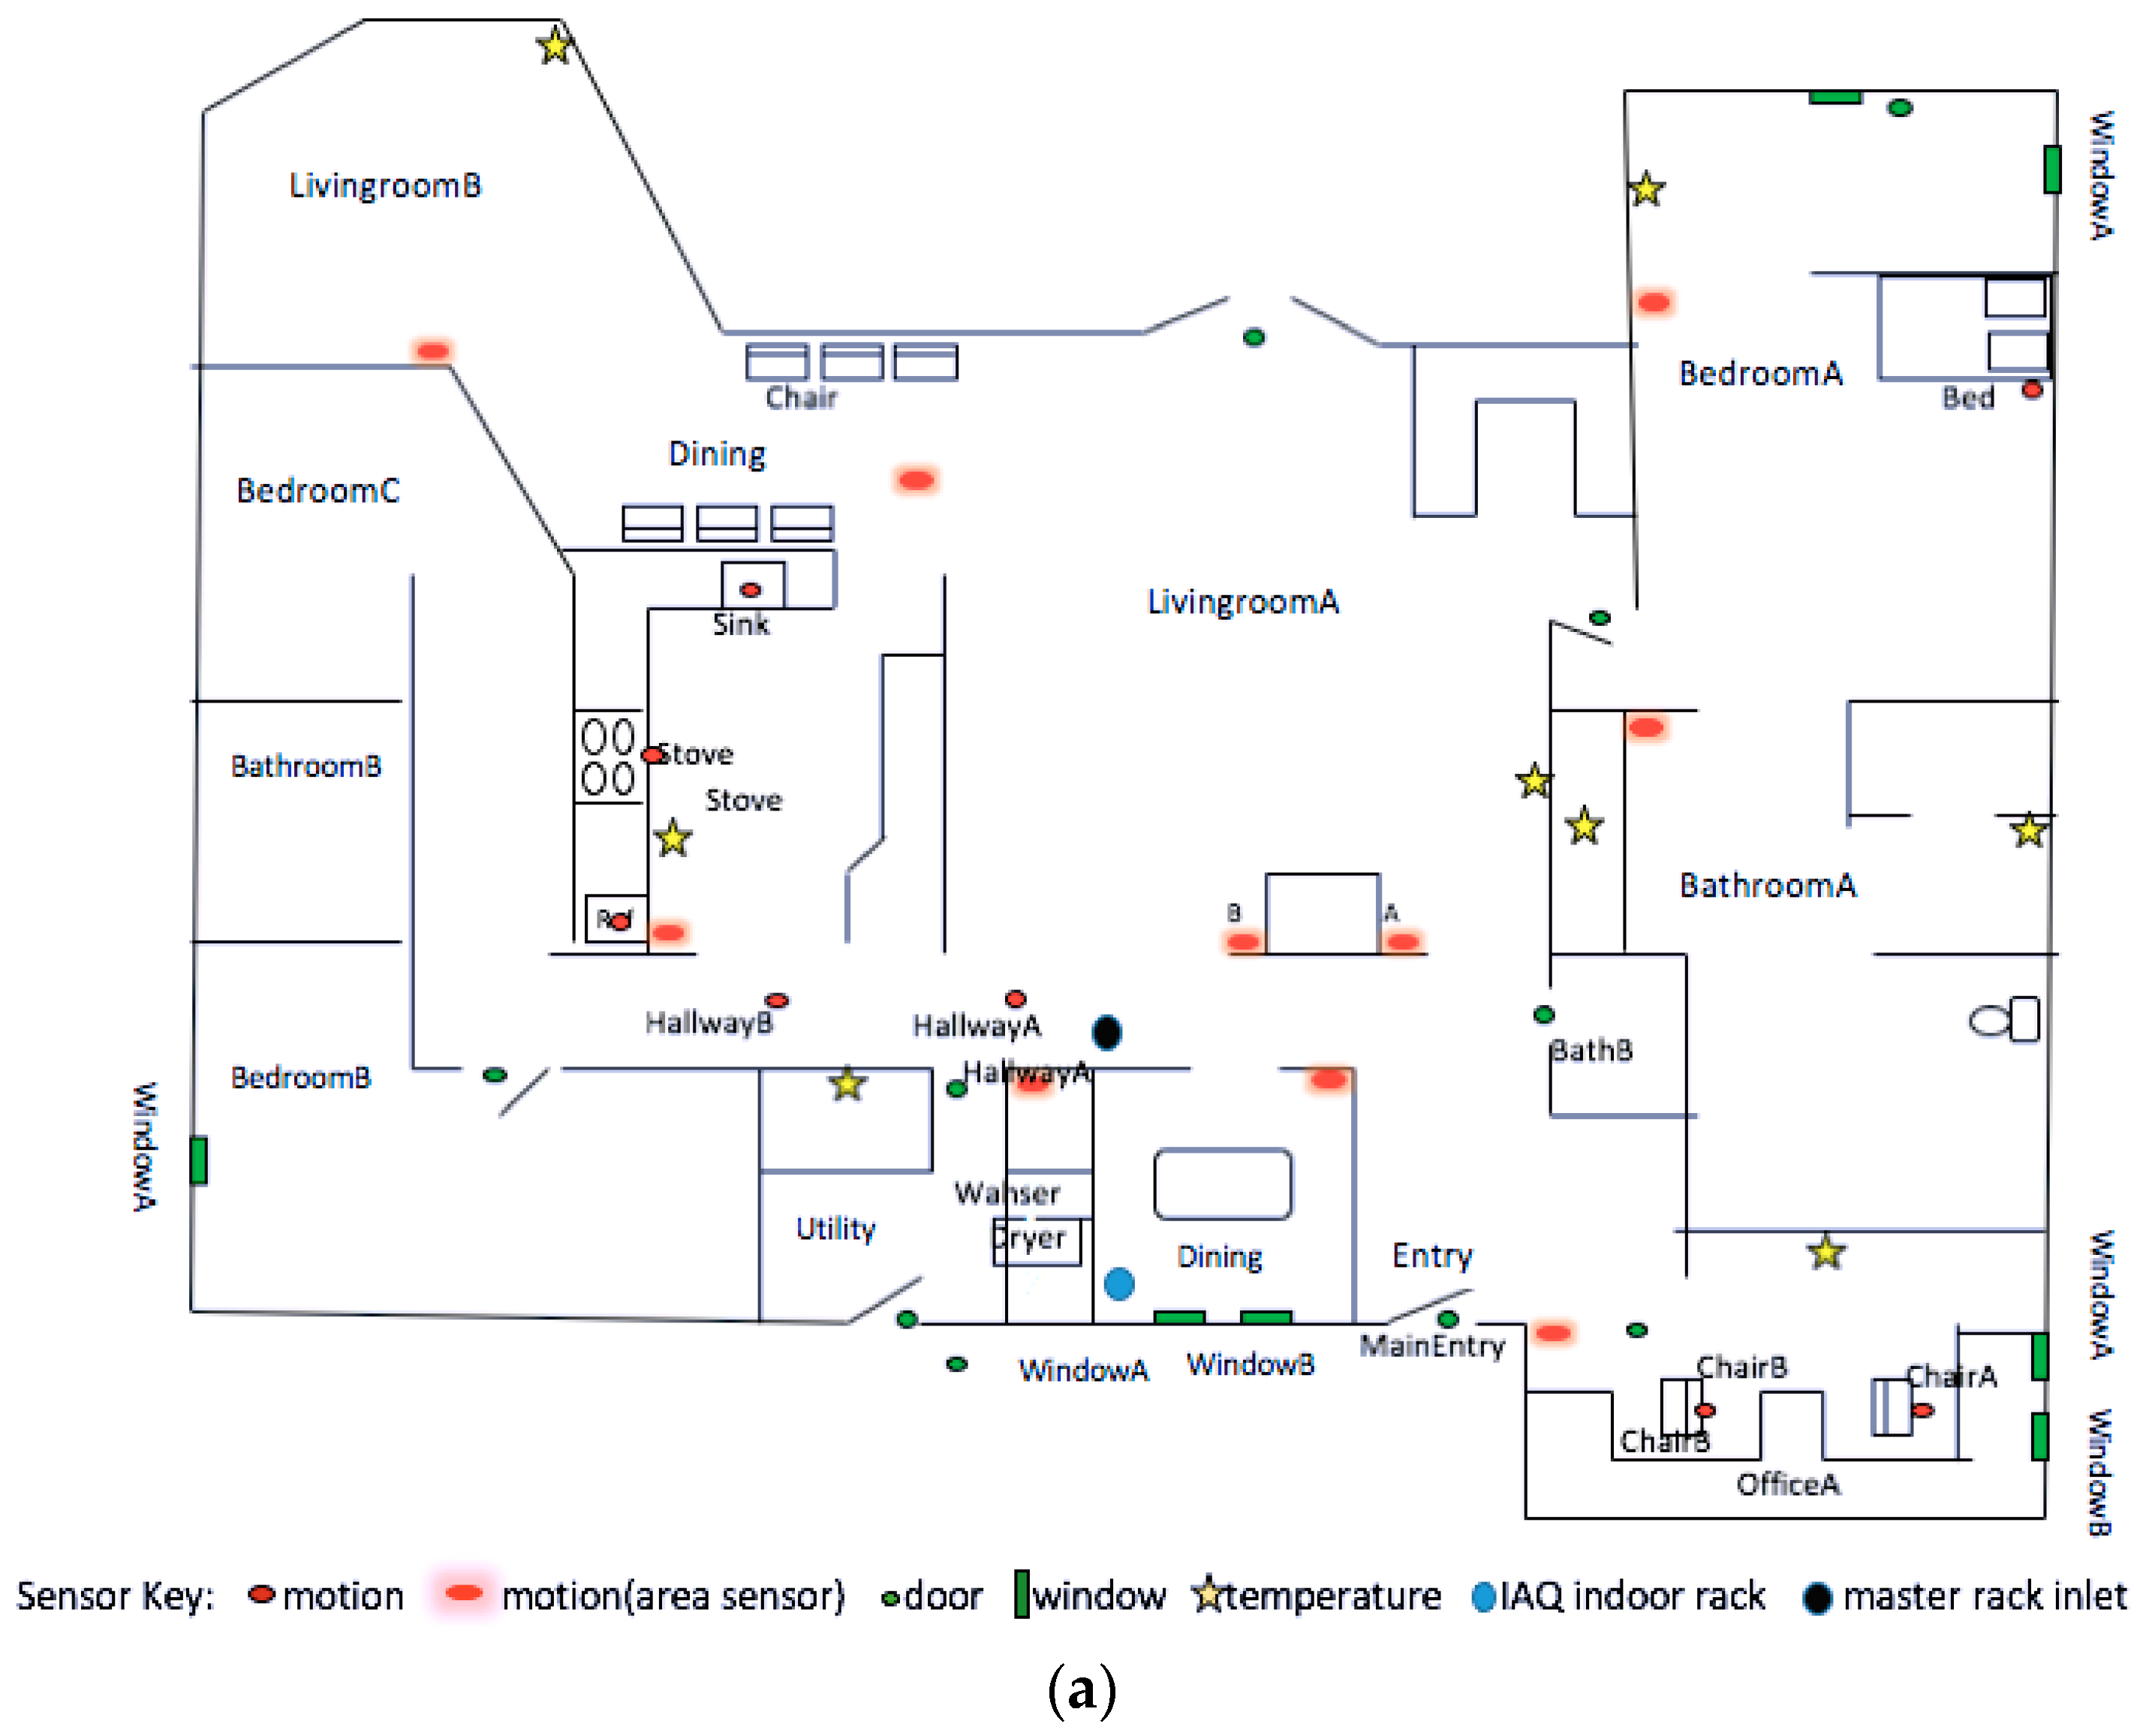
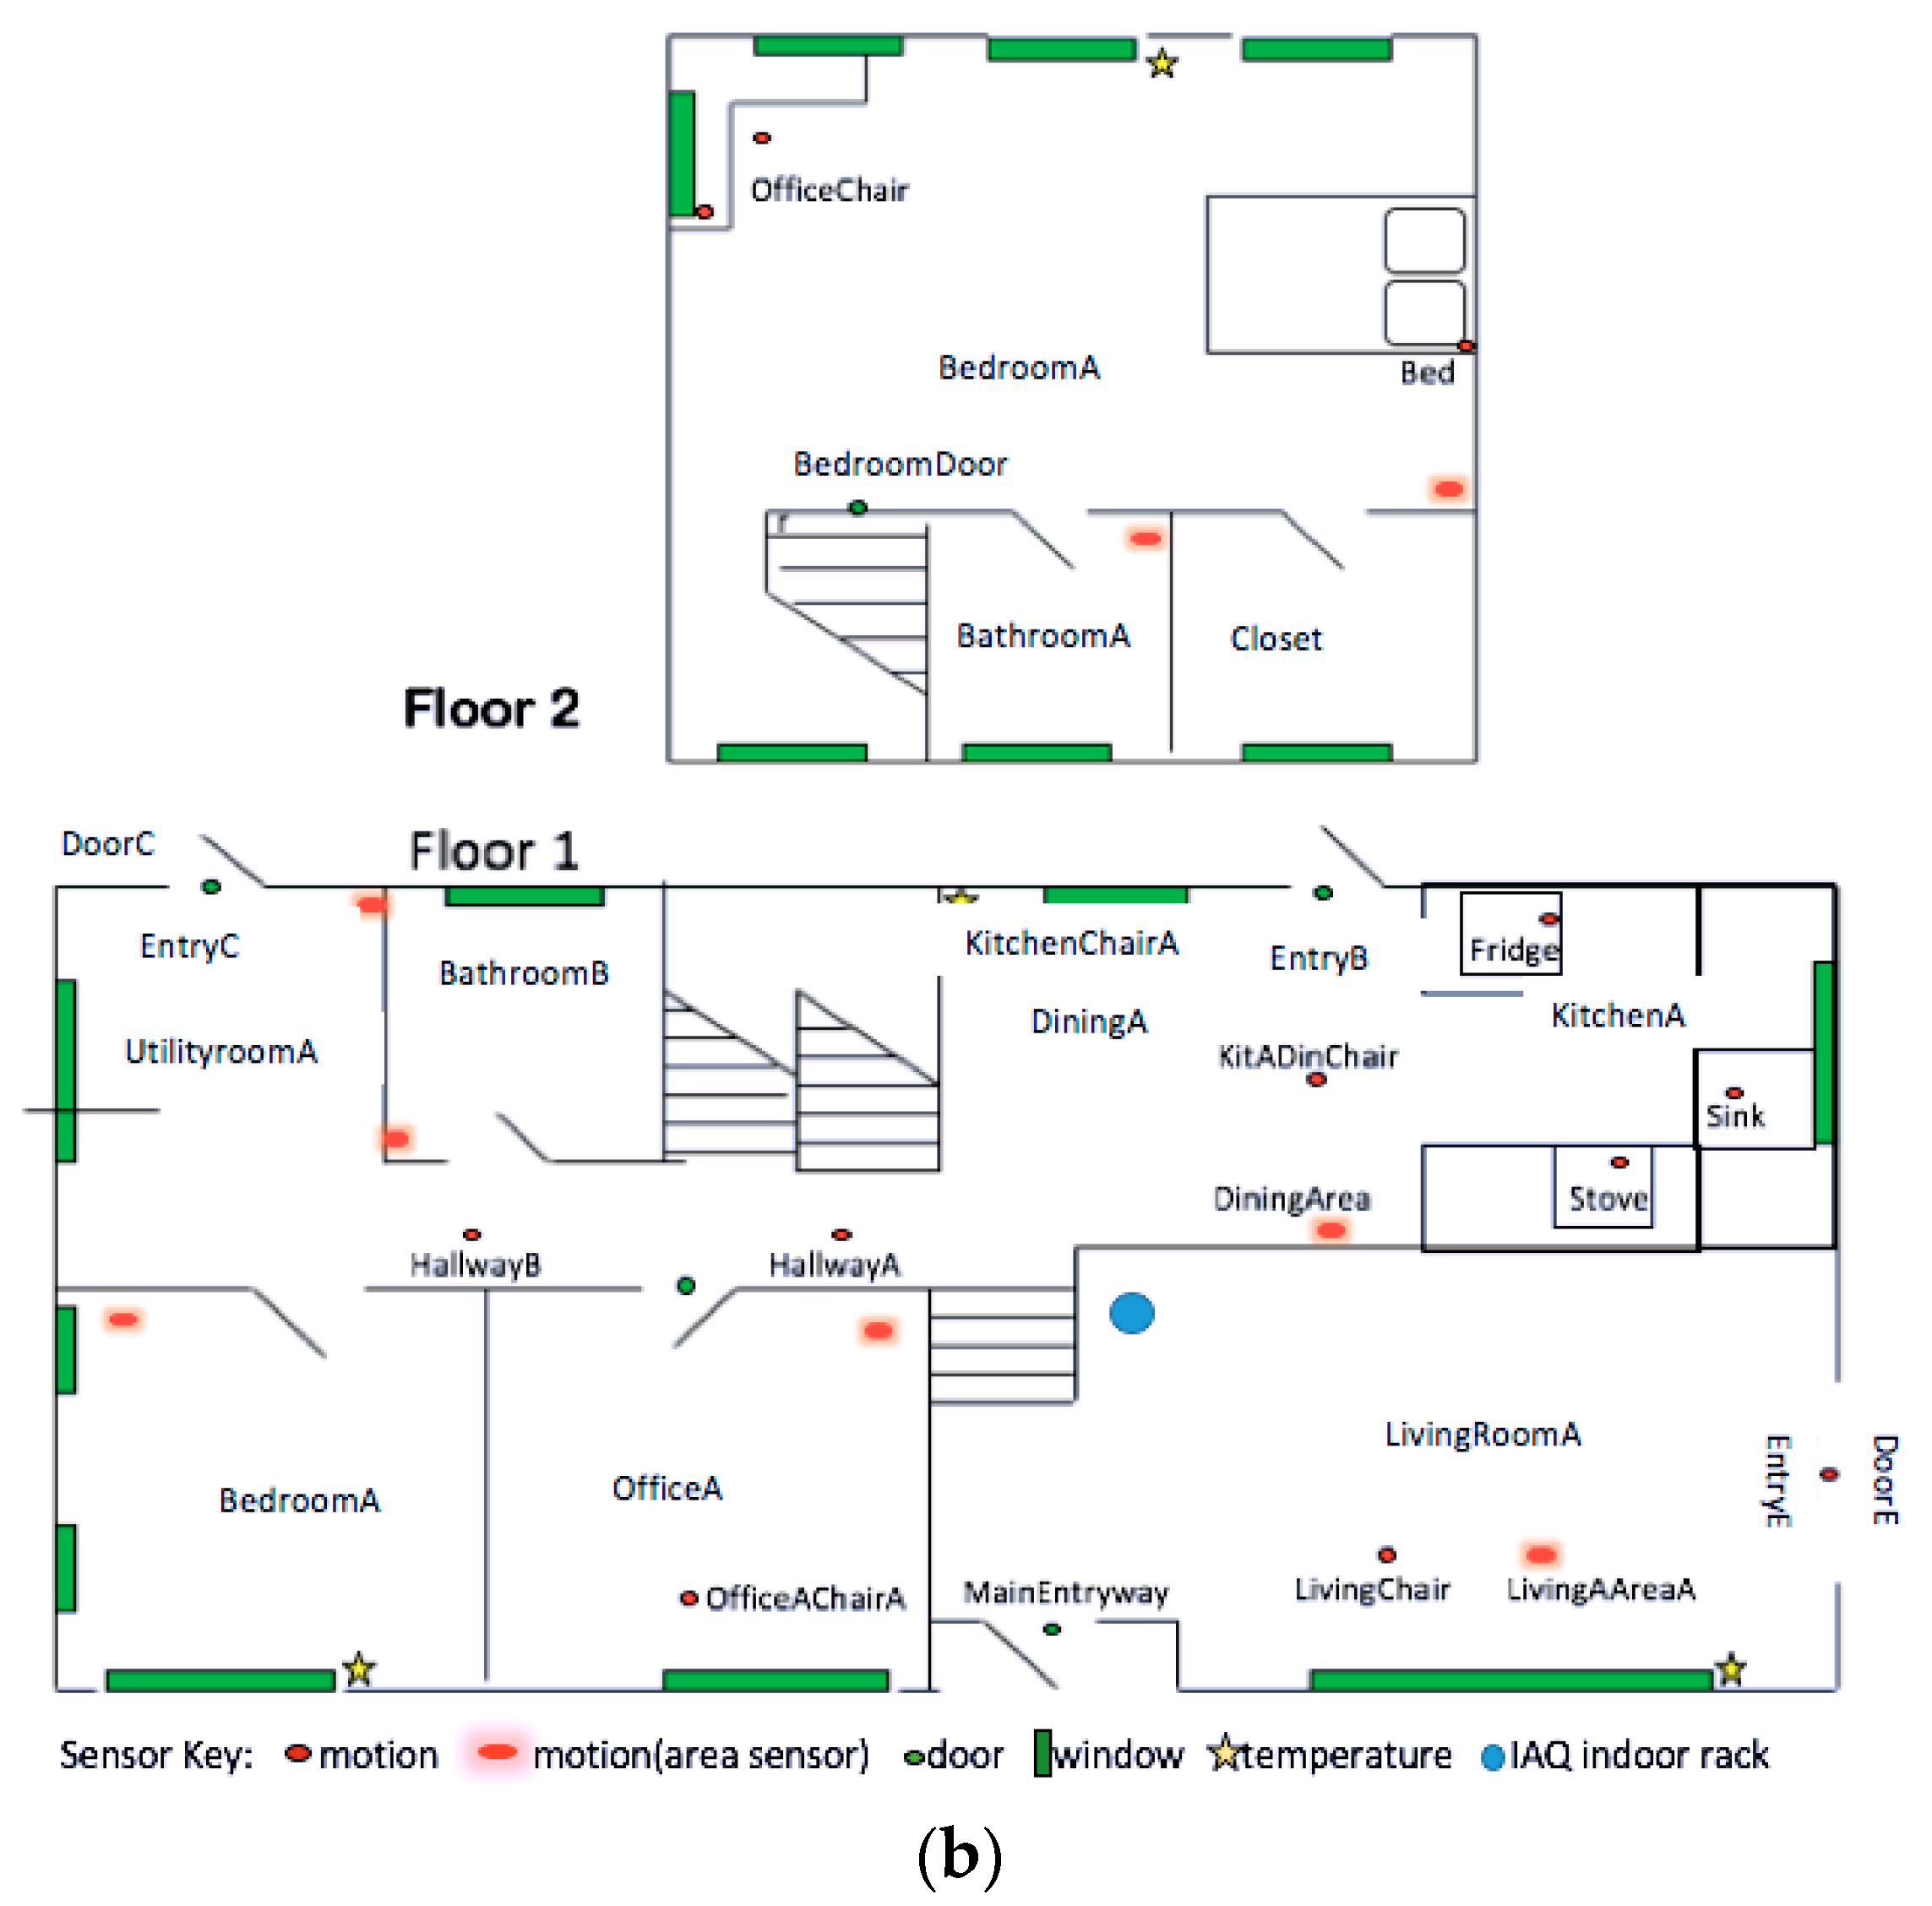
Our testbeds consisted of two houses outfitted with sensors to transform them into smart homes. Data were collected in the first smart home, referred to as IAQ1, for 27 days (620 h); the residents were a couple in their sixties. We also collected data in a second smart home, referred to as IAQ2, for six days (187 h); the residents were a family that includes a couple in their fifties and two children, one in their teens, and one in their twenties. This study was approved by the Washington State University Institutional Review Board. In each home, we monitored the chemical components of indoor air quality described in this section, using the instruments summarized in Table 1. The instruments were contained in two separate racks. An indoor rack was placed in the living room to measure selected pollutants, as shown in the Table 1. A larger rack, the master rack, was placed in the garage. The master rack instruments sampled both indoor and outdoor air, alternating sampling between indoors and outdoors every 30 minutes using a three-way valve. The master rack was placed in the garage and Teflon tubing ran from the rack to the top of the roof for outdoor air sampling. For IAQ1, indoor air was sampled from the return ducting of the furnace; the furnace fan was always on to ensure circulation through the ducts. For IAQ2, indoor air was sampled using a Teflon tube that ran from the rack through the house to a main hallway, as illustrated in Figure 1. A weather station was placed on the roof. A more detailed diagram for the locations of the indoor and master racks are illustrated in Figure 2.
We examined smart home-based behavior data and chemical variables at the time scale of a single hour. Because the chemical sensors collect higher frequency data, we computed and stored the median values of the indoor and outdoor chemical variables for the corresponding hour of data collection. Similarly, we captured and integrated weather station data for the corresponding hour. Furthermore, the indoor air quality data was collected from a single point within the home, rather than individual rooms in the home. The positioning of the chemical sensors with respect to individual rooms in the house may have had an impact on our results, which we will discuss separately.

3. Smart Home Houses

Our smart home testbeds for this study were located in the inland Pacific Northwest, and are maintained as part of the Center for Advanced Studies in Adaptive Systems (CASAS) smart home project. We performed our testing in two separate homes without automatic air exchange systems, each of which was a multiple-resident home. The physical layout and sensor placement for these two environments are shown in Figure 1. As shown in the figure, each smart house contained multiple bedrooms, bathrooms, offices and living areas. For convenience and consistency across all houses, we separated each type of room into two units: the main area of a particular category, and all secondary rooms of the same category aggregated together. For example, in the bedroom category, we collected features for the master bedroom and also collected features for the other bedrooms, which represented information aggregated from all of the other bedrooms in each house. Each of our smart homes had at least two bedrooms and bathrooms, so this approach provides fine-granularity feature specification, while also allowing generalization over multiple homes.
Each house was equipped with combination infrared motion/ambient light sensors and combination closure/temperature sensors that provided readings for the opening or closing of windows or doors, as well as the use of temperature-changing items such as showers and stoves. Based on conversations with IAQ experts and our previous studies [29], we identified four types of smart home features that are used to extract and correlate with chemical variables. These consist of the overall activity level (based on sensed movement), the duration of each automatically labeled activity, temperature, and the total area of the open doors and windows. Activity level is calculated as the number of motion sensor “ON” events in each room of the house. As with the chemical sensors, we captured this data for each hour during the continuous data collection period.
Because of the availability of activity recognition software, we could monitor activities that are performed in the home and capture the duration of each activity over the corresponding hour of data collection. We used machine learning techniques to tag the collected smart home sensor data (motion, door, light, temperature) with corresponding activity labels. Activity duration was then calculated as the time span of sensors’ events during the hour labeled with the activity. Our machine learning techniques achieved an average of 95% accuracy for activity labeling based on threefold cross-validation [30]. The set of activities that we monitored for this study includes sleep, bed to toilet transition, relax, leave home, cook, eat, personal hygiene, bathe, enter the home, take medicine, wash dishes, and work.
To determine the area of open windows and doors throughout the house, we noted the size of each door or window and computed the product of the window/door size and the amount of time it was open during the hour. Finally, we computed the mean ambient temperature value sensed over one hour for each temperature sensor location in the home.
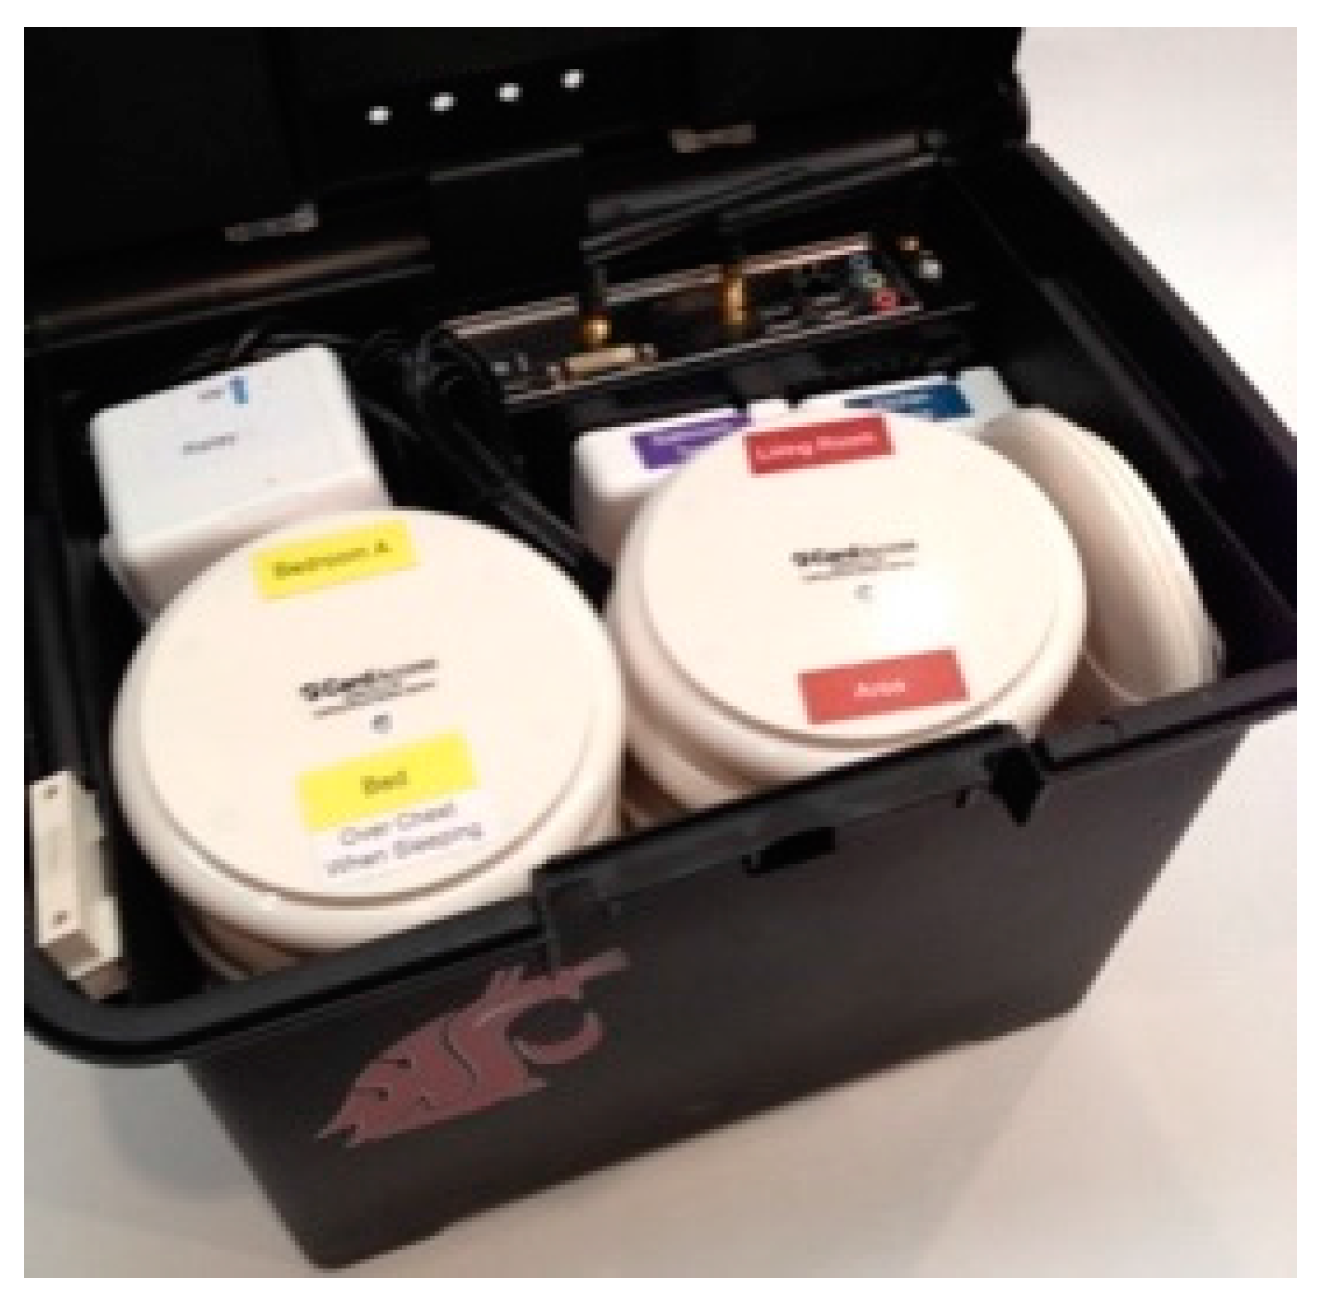
In this paper, we perform and investigate the experiments in the context of the CASAS smart home project. There are numerous challenges associated with creating a fully operational smart environment infrastructure, which have limited the number of available smart home houses. To assist with the process of making smart home technologies available in a variety of settings, CASAS initiated the “smart home in a box” (SHiB) project (shown in Figure 3) [31]. The SHiB architecture has three components: physical components, the middleware, and the software applications. The physical components include sensors and actuators that use a Zigbee “bridge” to communicate with the middleware, which is controlled by a publish/subscribe manager. The middleware is a process that adds the timestamp to sensor events and maintains sensor states. The middleware also uses a scribe bridge to store messages in a lasting archive, and an application bridge to share/exchange information with the applications. The SHiB architecture is easily maintained and expanded because of its lightweight bridge design (via application programming interfaces).
The SHiB sensor package includes infrared motion/ambient light sensors, magnetic doors/windows, and temperature sensors. They are attached using removable adhesive. All of these are ambient sensors that are only updated if there is a significant change in a state, for example, a door opening or closing. Narrow-area motion sensors are placed on the ceilings above some specific items in the house, including above the stove, entryway, and dining chairs. This is because narrow-area motion sensors can perceive motions that occur in a one-meter diameter area. As a complement of the narrow-area motion sensors, wide-area motion sensors are installed on the ceiling in large rooms such as the kitchen, living rooms, and bedrooms, and have a much wider coverage so as to recognize motions happening anywhere in the room. CardAccess magnetic contact sensors are used for external windows and doors, as well as for internal cabinets and doors in bathrooms and living rooms. CardAccess temperature sensors are placed in most of the rooms, including bathrooms and the kitchen, to both perceive key activities such as bathing and cooking, and to sense significant temperature changes at those points in each room.

4. Activity Recognition

Activity recognition (AR) refers to mapping a sequence of perceived events onto an element from a group of predefined activity labels. Activity recognition is a well-researched area, and there is a large amount of prior work that introduces machine learning approaches to model the activities using techniques such as hidden Markov models (HMMs) [32] and segmented hierarchical infinite hidden Markov models (siHMMs) [33]. Methods are chosen according to the realism of the smart environment and the sensor technologies that are used for collecting the data. Our CASAS activity recognition algorithm is based on a sliding window method to perceive activities in a streaming fashion. The sensors that we use are ambient sensors triggered by a significant change in a state [30].
The necessary recognition steps in CASAS are gathering and performing preliminary processing on sensor data to handle missing or noisy data, separating it into feasibly sized subsequences by either supervised event segmentation or supervised window sliding approaches, and then pulling out subsequence features. As an alternative to traditional supervised learning-based segmentation, we employed an unsupervised change point detection and piecewise representation of the segments as separate activities. External annotators provide ground truth for training data. They look at a floor plan and the sensor data to provide an estimate of the corresponding activities, which is then used to learn a mapping from the extracted features to activity labels.
The experiments in this paper used the CASAS activity recognition algorithm to tag real-time activities on streaming data, as described in the last paragraph. The CASAS recognition algorithm is a generalization of activity models over several smart homes with no constrained circumstances related to pre-segmented data, single residents, or uninterrupted activities. To do this, we mapped a succession of the n latest sensor events to a label that indicated the activity. For example, this sequence of sensor events was mapped to a Sleep activity label:
  • 2016-03-10 06:48:24.855293 BedroomABed ON  Sleep
  • 2016-03-10 06:48:29.727262 BedroomABed OFF  Sleep
  • 2016-03-10 06:48:30.479044 BedroomABed ON  Sleep
  • 2016-03-10 06:48:33.102565 BedroomABed OFF  Sleep

5. Data Analysis

5.1. Experimental Setup

Global population growth and global aging issues will have a corresponding effect on behavioral changes and the quality of the air we experience inside and outside buildings. Here, we examine the relationship between occupant behavior and indoor air quality using machine learning techniques via monitoring human activities in sensor-filled spaces. We conducted two types of analyses on this data. In the first analysis, we performed three experiments to determine which IAQ variables were measurably impacted by SH features. To accomplish this goal, we used machine learning techniques to predict the value of each IAQ variable from the complete set of SH features (we refer to this experiment as AllSH_OneIAQ). We also highlighted the IAQ features that are most significantly impacted by smart home behavior, as indicated by the ability to predict the values using smart home sensor features.
In the second analysis, we determined the specific SH features that had the greatest influence on the IAQ variables. We accomplished this analysis by performing experiments to select a set of SH attributes that had the most significant impact (GroupSH_InIAQ). We then performed another experiment to select the individual SH features that measurably affect each IAQ variable (IndivSH_InIAQ). The findings will help us understand the types of behavior that have tremendous impacts on indoor air quality, and we can use this information to make suggestions to homeowners based on maximizing air quality, or automate the control of buildings.

5.2. Analysis 1: AllSH_OneIAQ

Our first analysis determined the IAQ variables that were measurably impacted by captured smart home-based behavior features (AllSH_OneIAQ). To validate the overall performance of SH features and IAQ variables, we used regression to estimate the value of each dependent variable (each IAQ variable), given the independent variables (SH features). There are many techniques that have been developed for regression analysis. In our project, we performed experiments based on three algorithms: random forest (RF), linear regression (LR) and support vector regression (SVR).
Decision tree learning is one of the most popular regression learning techniques. It can naturally handle data of mixed types and missing values, which occur in all of our datasets. We choose one of the best-known learning methods: random forest learning algorithm. Using random forest, a large set of decision trees are created, each using a different set of randomly selected feature inputs. Compared with other tree learning algorithms, RF improves the prediction accuracy and the stability when the data is changed a little. However, decision trees only map the feature vector to discrete target variables, so we also considered methods that are designed to handle numeric class values.
One model that deals with numeric variables is linear regression, where a single linear formula represents the mapping from input to class values. We used the linear regression learning algorithm as our second learning method. Since our data has a large number of features, we also used a third method, the support vector regression. It is a nonlinear regression technique, which complements the linear regression method.
We evaluated the performance of all three of the above algorithms by reporting the corresponding correlation coefficients (r). In our study, we did not consider the sign of the correlation coefficient, just the absolute value. This is because we wanted to determine whether a relationship exists between the smart home features and the chemical variable features, rather than analyze the type of direction of a relationship between these two complex models. We reported correlation coefficients that are moderate or large (r ≥ 0.3). In addition, we evaluated the accuracy of our models based on 10-fold cross-validation by reporting the normalized root mean square error (NRMSE) as a performance measure.
In our project, we also report the statistical significance of the observed results. We set the null hypothesis as: there is no correlation between each dependent variable and the independent variables. The corresponding alternative hypothesis is set as: there is a correlation between each dependent variable and independent variables. We then choose the value of the first type error (probability of false rejection of a true null hypothesis) as 0.05, and the value of power (the probability of correctly rejecting a false null hypothesis) as 0.9. For these parameters, the sample size should be 113. Our sample sizes for IAQ1 and IAQ2 are 620 h and 187 h respectively, which are large enough to represent subjects where the probability of correctly rejecting a false null hypothesis is greater than 0.9.
To validate the hypothesis, we computed the correlations and NRMSE between the complete set of SH features and each predicted IAQ variable by performing the three regression learning algorithms (RF, LR, and SVR) on each house (IAQ1 and IAQ2), as well as on the aggregated dataset for both houses (denoted as IAQ1_2). The results are summarized in Table 2, Table 3 and Table 4. The full set of results is provided online (http://eecs.wsu.edu/~blin).
As shown in Table 2 and Table 3, the majority of the IAQ variables from both IAQ1 and IAQ2 exhibit a relationship with the SH features, because there are over 90% IAQ variables that are highly correlated with SH features, which results in an NRSME lower than 0.12 (using random forest). Further, based on the results shown in Table 4, we observed that the majority of IAQ variables from the aggregated dataset for both houses (IAQ1_2) are also highly predictable from SH features (98% of the IAQ variables are highly correlated with SH features, and result in an NRSME of 0.0798 using random forest). According to this, we conclude that there is a generalized relationship between IAQ variables and SH features. Additionally, we list the correlation coefficients for IAQ variables from the aggregated dataset (IAQ1_2) in Table 5.
In Table 5, we observe that there exists a relationship between human behavior and air quality inside and outside the homes. There are 16 indoor chemical variables (16 out of total 24 indoor chemical variables) that have higher correlation coefficients than those outside the house. Furthermore, there are five outdoor chemical variables (five out of 25 outdoor chemical variables) that have higher correlation coefficients than those inside the house. Thus, human behaviors have a greater impact on chemical variables measured indoors than those variables measured outdoors.
We are going to use three representative pollutants from both the indoor and outdoor categories to further interpret the results from Table 5. We chose PM2.5, formaldehyde, and methanol as the representatives for outdoor pollutants, VOCs released from indoor materials, and VOCs released from occupant activities.
For PM2.5, we observe that the correlation coefficient for the outdoor PM2.5 is 0.5121. This indicates that there is a correlation between outdoor PM2.5 and in-home human behaviors. Due to the wildfires, which caused heavy smoke with a large amount of outdoor PM2.5 during the experimental period, residents closed windows and doors more often than usual, and stayed at home longer than usual. In the case of the indoor PM2.5, the correlation coefficient is 0.4808, which shows that there exists a measurable relationship with human behavior, such as cooking and cleaning, and indoor PM2.5.
In Table 5, we observe that the correlation coefficient for the indoor formaldehyde is 0.9060. This large value indicates that there is a strong relationship between indoor formaldehyde and human behaviors. This is because indoor formaldehyde is mainly from indoor carpet, pressed wood products, and furniture. Indoor formaldehyde is also positively correlated with both indoor temperature and indoor humidity [27]. Human behaviors, such as cooking, bathing, washing dishes, and opening/closing windows or doors, make a significant contribution to the temperature and humidity changes inside the house. Thus, the relationship between human behaviors and humidity generate a positive correlation with indoor formaldehyde as well. In addition, the correlation coefficient for the outdoor formaldehyde is 0.5407. Outdoor formaldehyde is mainly produced from industrial wood manufacturing [28]. Hence, it is reasonable that the correlation coefficient is 36% lower than that for the indoor formaldehyde.
With regards to methanol, this chemical occurs either naturally in humans, animals, food, and plants, or industrially based on its use as a solvent, pesticide, and alternative fuel source [27]. The correlation coefficient for the indoor methanol is 0.9265, which is 37% higher than that for the outdoor methanol. This makes sense, because the indoor human behaviors, such as eating, drinking, breath, and solvent, would highly impact the indoor methanol.

5.3. Analysis 2: GroupSH_InIAQ and IndivSH_InIAQ

The above regression analysis quantifies the generalized relationship between IAQ variables and SH features. After regression analysis, we performed a second analysis to determine the specific SH features that have the greatest influence both as a group and individually on the IAQ variables selected from the first analysis. Although in earlier regression analysis we validated that a generalized relationship exists between smart home features and indoor air quality chemical variables based on the aggregated dataset from the two houses, there is a tremendous diversity of specific human behaviors in each house that will affect individual IAQ variables. Thus, in this analysis, we only consider each house and do not include the aggregated dataset. Specifically, we utilize learning algorithms for three experiments (shown in Table 6) to perform the automated selections of SH features for IAQ variables based on their ability to predict IAQ values. These three algorithms employ machine learning algorithms that only handle nominal class values. Because our data is numeric, we employ equal frequency binning to discretize the target variables by dividing the numeric range into a predetermined number (here, n = 4) of bins.
We note that the learning algorithms used for this analysis are different from those used for the first analysis and its corresponding experiments. The classifiers in the first analysis were regression algorithms. In contrast, we now need to employ classifiers that map the feature vector to discrete-valued class labels. We utilize algorithms that are popular for feature selection, namely RF, J48 (a decision tree learner) and information gain (InfoGain). Even though decision trees are typically used for classification (as done in Analysis 1 in Section 5.2), we also use them for feature selection in the current analysis, so as to determine which of the behavior-based attributes are most indicative of indoor air quality, and therefore exhibit the strongest relationship with indoor air quality parameters. InfoGain is used as a measure of information gain on the class that the attribute gives, so as to determine the relevance of that attribute and hence allow the elimination of attributes that are less relevant. The relevance of each attribute is evaluated by assigning a score, which is calculated as the difference in entropy with and without that attribute; afterwards, feature selection can be performed based on the scores. Entropy here measures the impurity of the sample that tells us the average number of bits needed to encode the information in the sample. Further, for classifiers RF and J48, we employ WrapperSubsetEval as an attribute evaluator, which uses a classifier to evaluate alternative attribute sets. The accuracy of the classifier for each attribute set is estimated by cross-validation.
We first perform two experiments to identify subset groups of SH features that together have the most noticeable impact on each chemical variable, and narrow down the size of the subset group to at most 15. To extend the second analysis further, we then perform a similar experiment to select individual SH features.
To be consistent with the first analysis (Section 5.2 Analysis 1: AllSH_OneIAQ), we summarize the behavior features that show the greatest impact on the same three representative chemical variables for each house (outdoor PM2.5, indoor formaldehyde, and indoor methanol). The feature selection summary is given in Table 7, Table 8, Table 9, Table 10, Table 11 and Table 12, which are separated by the particular chemical variable we are analyzing. Explanations for the feature names are provided in Table 13. The full set of results is provided online.
In Table 7, we observe that for the outdoor PM2.5 in IAQ1, features such as temperature in the bathroom, dining room, and kitchen are highly related with outdoor PM2.5 values. We also observe that the duration of both personal hygiene and bed-to-toilet transition are selected. This makes sense because the high-level outdoor PM2.5 during the wildfires caused residents to stay at home longer than usual, and therefore more activities to be detected in the house than usual, especially in the bathroom, dining room, and kitchen. Similar results are found for the selected features in IAQ2 (based on Table 8) for the same reasons. For IAQ2, the selected features are the temperatures in the main entryway, kitchen, master bedroom, master living room, and master office.
In Table 9, we observe that for indoor formaldehyde in IAQ1, the selected features are the temperatures in the master bedroom, kitchen, and stairs to the first floor, as well as the overall activity levels in the master bedroom, the secondary office, and the area of an open door in the master bedroom. This makes sense, because we know that carpet is the main source of indoor formaldehyde, and the places with carpets in IAQ1 are the bedrooms and the secondary office, which is also located inside the master bedroom. Further, temperature and humidity in rooms with carpets have positive impacts on indoor formaldehyde levels.
In Table 10, we notice that for indoor formaldehyde in IAQ2, the selected features are temperatures in the master bathroom, kitchen, and main entry, and the duration of washing dishes. The temperature in the master bathroom could be an indication of taking a shower or running hot/cold water. Those activities in the bathroom and the duration of washing dishes may have a great contribution to the indoor humidity. In addition, the temperature feature for the main entry door is selected in IAQ2, but not in IAQ1. This might be because of the humidity difference during the experimental periods for the two testbeds. According to the weather station reports, for IAQ2, the average outdoor water vapor was 10,443 parts per million (ppm) compared to 9827 ppm for IAQ1. That is, the average humidity during the IAQ2 experimental period was 616 ppm higher than that during the IAQ1 period. Then, for IAQ2, opening/closing the main entry door might allow the outdoor humidity to influence the indoor humidity.
In Table 11, we notice that in IAQ1, the SH features that impact indoor methanol are temperatures in the master bathroom, kitchen, living room, and utility room, and the overall activity level in the living room. This makes sense, because in the kitchen or living room, there are food, fruits, vegetables, and other foods that contain methanol [27]. Temperatures in these rooms and the overall activity levels in the living room may indicate food processing, eating, or drinking, especially with the overly ripe or near rotting fruits or vegetables, smoked food, diet foods, or drinks with aspartame. The temperature in the utility room may indicate that the resident had been doing laundry. The liquid laundry detergents used in this process contain methanol [28]. This also partly explains the selected SH features for indoor methanol in IAQ2, based on Table 12.
In Table 12, the selected features include temperatures in the kitchen, master bathroom, and secondary living room, the overall activity levels in the dining room, and the duration of cooking and sleeping. The duration of sleeping is selected in IAQ2 because human breath also makes a contribution to the indoor methanol. In IAQ2, there are two adults and one child, whereas in IAQ1 there are only two adults. The living habits of residents in these two testbeds are also different. This may be a reason that the duration of sleeping is selected in IAQ2 instead of in IAQ1.
After selecting subsets of SH features for each IAQ variable by RF and J48 experiments, we conducted the third experiment to find the individual SH feature that had the greatest influence on each IAQ variable. That was accomplished through utilizing attribute selection by ranking the SH attributes using their individual scores. Sample results of this analysis for the same three chemical variables are shown in Table 14, Table 15, Table 16, Table 17, Table 18 and Table 19. The full set of results is provided online.
In Table 14, we notice that the majority of selected features that are strongly related with outdoor PM2.5 are temperature variables; the top features are temperatures in the master bathroom, dining room, and kitchen. This is consistent with the results from Analysis 1, as shown in Table 7. In addition, this experiment allows us to observe that for IAQ1, the temperature in the master bathroom had the highest correlation with outdoor PM2.5. This makes sense, because heavy smoke from wildfires contains elevated levels of PM2.5. Thus, residents spend more time at home for less exposure to the outside environment.
In IAQ2, based on Table 15, we notice that the SH features that have the greatest impact are temperatures in the main entry, kitchen, master bedroom, and master bathroom. Moreover, the temperature in the main entry has the highest correlation with outdoor PM2.5. This makes sense, because the temperature in the main entry might indicate opening/closing of the main door. Due to the heavy outdoor smoke, residents might open/close the main door more quickly than usual to prevent the outdoor smoke from coming into the house.
In the case of indoor formaldehyde in IAQ1, based on Table 16, we observe that temperature in the kitchen has the highest correlation with formaldehyde. This is because the temperature in the kitchen was very similar to temperatures throughout the whole house (in general, the difference is less than 1 Celsius, except during the cooking time), and formaldehyde is positively related to the temperature. For IAQ2, based on Table 17, the temperature in the master bathroom had the highest correlation with indoor formaldehyde due to the positive correlation with humidity.
Considering indoor methanol in IAQ1, based on Table 18, we notice that the temperature in the utility room has the highest correlation with methanol. This is because methanol is a component of the liquid laundry detergents and temperature in the utility room may indicate the residents had been doing laundry. But for IAQ2, from Table 19, we notice that the temperature in the secondary living room had the highest correlation with indoor methanol. That is because food and drink in the secondary living room contained methanol. Additionally, residents whose breaths have a contribution to the methanol level may spend a great deal of time in the secondary living room. Those results in the third experiment are consistent with the results from the first two experiments.
6. Discussion

In this study, we noticed that the temperature features are more frequently selected than other specific activities. This might be because temperature is impacted by multiple activities, such as cooking and running hot water, rather than selecting one specific activity that would exclude other activities. In addition, the change in temperature caused by an activity may last longer than the activity itself, and so affect the IAQ even after the activity has ended. The fact that these results are consistent with previous studies helps to validate the methodology as a whole.
In the analyses, we assume that some human activities occur based on the top selected temperature features. Future studies of this type should include information from occupant interviews to help explain the observations and to validate the occurrence of these activities.
Further, the study is based on homes equipped with both multiple SH sensors in each room and air quality measurements in one location inside and outside the house. The use of a single location in each home to measure indoor air quality and represent the air quality throughout the entire house may have impacted our results. Thus, future studies can be improved by using IAQ measurements placed in each room to capture the air quality. In addition, although the locations of indoor air quality measurements in each home is based on the house architecture, the inconsistence with the locations of IAQ measurements (either in living room or dining room) could also have an impact on the results.

7. Conclusions

Our goal was to examine the relationship between in-home behavior and indoor air quality based on collected data from smart home sensors and chemical indoor air quality measurements. We fulfilled this goal by collecting data in two smart home testbeds. We analyzed both the impact of overall smart home behavior on indoor air quality, and the relationship between individual groups of smart home features and indoor air quality variables. We identified and adapted machine-learning classifiers that are appropriate for each analysis.
The results of our first analysis indicated that there is a strong relationship between in-home human behavior and air quality. By examining an aggregated dataset, we also observed that this predictive relationship could be generalized across multiple smart homes. In our second analysis, the specific SH attributes that are most indicative of indoor air quality were found for each testbed. Based on the findings, it would be a reasonable suggestion for the resident to consider airing the rooms frequently.
In future work, we will design methods of automating ventilation control to improve indoor air quality based on sensed activities and other smart home features. For example, we will provide viable suggestions as to how to improve indoor air quality (e.g., turning on ventilation systems only at certain times of the day). These types of analyses can help us recognize the types of behavior that significantly impact IAQ and use this information to anticipate, prevent and prepare for indoor pollution, maintain better healthy environments, and plan for our changing future by developing an automated system for maintaining good indoor air quality.

Supplementary Materials

The dataset is available online at www.mdpi.com/2224-2708/6/3/13/s1.

Acknowledgments

This research was supported by both the US Department of Energy grants RD—83575601 and by the US Environmental Protection Agency Science To Achieve Results grants RD—83575601. The views expressed in this paper are those of the authors and do not necessarily reflect the views or policies of the US Department of Energy nor the US Environmental Protection Agency.

Author Contributions

Beiyu Lin, Brian Lamb and Diane J. Cook conceived and designed the experiments; Beiyu Lin performed the experiments; Beiyu Lin and Yibo Huangfu analyzed the data; Nathan Lima, Bertram Jobson, Max Kirk, Patrick O’Keeffe, Shelley N. Pressley and Von Walden contributed reagents/materials/analysis tools; Beiyu Lin, Brian Lamb, Bertram Jobson and Diane Cook wrote the paper.

Conflicts of Interest

The authors declare no conflict of interest.

References

  1. Klepeis, N.E.; Nelson, W.C.; Ott, W.R.; Robinson, J.P.; Tsang, A.M.; Switzer, P.; Behar, J.V.; Hern, S.C.; Engelmann, W.H. The National Human Activity Pattern Survey (NHAPS): A resource for assessing exposure to environmental pollutants. J. Expo. Sci. Environ. Epidemiol. 2001, 11, 231–252. [Google Scholar] [CrossRef] [PubMed]
  2. U.S. Environmental Protection Agency (EPA) and U.S. Consumer Product Safety Commission. The Inside Story: A Guide to Indoor Air Quality; National Service Center for Environmental Publications (NSCEP), EPA Document # 402-K-93-007; National Service Center for Environmental Publications: Cincinnati, OH, USA, 1995.
  3. Institute of Medicine. Climate Change, the Indoor Environment, and Health; The National Academies Press: Washington, DC, USA, 2011. [Google Scholar] [CrossRef]
  4. Field, R.W. Climate Change and Indoor Air Quality; Report to the U.S. Office of Radiation and Indoor Air; Environmental Protection Agency: San Francisco, CA, USA, 2010.
  5. Tucker, W.G. Air Pollution, Indoor Air Pollution, and Control. In Kirk-Othmer. Encyclopedia Chemical Technology; John Wiley & Sons, Inc.: Hoboken, NJ, USA, 2003. [Google Scholar]
  6. Berglund, B.; Brunekreef, B.; Knöppe, H.; Lindvall, T.; Maroni, M.; Mølhave, L.; Skov, P. Effects of Indoor Air Pollution on Human Health. Int. J. Indoor Environ. Health 1992, 2, 2–25. [Google Scholar] [CrossRef]
  7. Francisco, P.W.; Jacobs, D.E.; Jacobs, L.; Jacobs, S.L.; Jacobs, J.; Rose, W.; Cali, S. Ventilation, Indoor Air Quality, and Health in Homes Undergoing Weatherization. Int. J. Indoor Environ. Health 2016, 2, 463–477. [Google Scholar] [CrossRef] [PubMed]
  8. Fabi, V.; Andersen, R.V.; Corgnati, S.; Olesen, B.W. Occupants’ window opening behaviour: A literature review of factors influencing occupant behaviour and models. Build. Environ. 2012, 58, 188–198. [Google Scholar] [CrossRef]
  9. Barnes, B.R. Behavioral Change, Indoor Air Pollution, and Child Respiratory Health in Developing Countries: A Review. Int. J. Environ. Res. Public Health 2014, 11, 4607–4618. [Google Scholar] [CrossRef] [PubMed]
  10. Chiang, C.M.; Chou, P.C.; Wang, W.A.; Chao, N.T. A study of the impacts of outdoor air and living behavior patterns on indoor air quality case studies of apartments in Taiwan. Indoor Air 1996, 96, 735–740. [Google Scholar]
  11. Andersen, R.V.; Toftum, J.; Andersen, K.K.; Olesen, B.W. Survey of occupant behaviour and control of indoor environment in Danish dwellings. Energy Build. 2009, 41, 11–16. [Google Scholar] [CrossRef]
  12. Matthews, C.E.; Steven, C.M.; George, S.M.; Sampson, J.; Bowles, H.R. Improving self-reports of active and sedentary behaviors in large epidemiologic studies. Exerc. Sport Sci. Rev. 2012, 40, 118. [Google Scholar] [CrossRef] [PubMed]
  13. Roy, N.; Misra, A.; Cook, D. Infrastructure-assisted smartphone-based ADL recognition in multi-inhabitant smart environments. In Proceedings of the 2013 IEEE International Conference on Pervasive Computing Communications (PerCom), San Diego, CA, USA, 18–22 March 2013; pp. 38–46. [Google Scholar] [CrossRef]
  14. Roy, N.; Misra, A.; Cook, D. Ambient and smartphone sensor assisted ADL recognition in multi-inhabitant smart environments. J. Ambient Intell. Humaniz. Comput. 2016, 7, 1–19. [Google Scholar] [CrossRef] [PubMed]
  15. Pires, I.M.; Garcia, N.M.; Pombo, N.; Flórez-Revuelta, F. From data acquisition to data fusion: A comprehensive review and a roadmap for the identification of activities of daily living using mobile devices. Sensors 2016, 16, 184. [Google Scholar] [CrossRef] [PubMed]
  16. Nasreen, S.; Azam, M.A.; Naeem, U.; Ghazanfar, M.A.; Khalid, A. Recognition Framework for Inferring Activities of Daily Living Based on Pattern Mining. Arab. J. Sci. Eng. 2016, 41, 3113–3126. [Google Scholar] [CrossRef]
  17. Deleawe, S.; Kusznir, J.; Lamb, B.; Cook, D.J. Predicting air quality in smart environments. J. Ambient Intell. Smart Environ. 2010, 2, 145–154. [Google Scholar] [PubMed]
  18. Uysal, N.; Schapira, R.M. Effects of ozone on lung function and lung diseases. Curr. Opin. Pulm. Med. 2003, 9, 144–150. [Google Scholar] [CrossRef] [PubMed]
  19. Occupational Safety and Health Administration. Substance technical guidelines for formalin: Occupational Safety and Health Standards, Toxic and Hazardous Substances, Formaldehyde; Occupational Safety and Health Administration: Washington, DC, USA, 2012.
  20. Hildemann, L.M.; Markowski, G.R.; Cass, G.R. Chemical composition of emissions from urban sources of fine organic aerosol. Environ. Sci. Technol. 1991, 25, 744–759. [Google Scholar] [CrossRef]
  21. Mugica, V.; Vega, E.; Chow, J.; Reyes, E.; Sanchez, G.; Arriaga, J.; Egami, R.; Watson, J. Speciated non-methane organic compounds emissions from food cooking in Mexico. Atmos. Environ. 2001, 35, 1729–1734. [Google Scholar] [CrossRef]
  22. Smith, K.R. Fuel combustion, air pollution exposure, and health: The situation in developing countries. Annu. Rev. Energy Environ. 1993, 18, 529–566. [Google Scholar] [CrossRef]
  23. User Manual for DC1100 Air Quality Monitor DYLOS Corporation, Page 5. Available online: https://www.sylvane.com/media/documents/products/dylos-dc-1100-laser-particle-counter-owner's-manual.pdf (accessed on 27 July 2017).
  24. Minnesota Department of Health, Volatile Organic Compounds in Your Home. Indoor Air Unit. 2016. Available online: http://www.health.state.mn.us/divs/eh/indoorair/voc/ (accessed on 3 October 2016).
  25. Hansel, A.; Jordan, A.; Holzinger, R.; Prazeller, P.; Vogel, W.; Lindinger, W. Proton transfer reaction mass spectrometry: On-line trace gas analysis at the ppb level. Int. J. Mass Spectrom. Ion Process. 1995, 149, 609–619. [Google Scholar] [CrossRef]
  26. Jobson, B.T.; McCoskey, J.K. Sample drying to improve HCHO measurements by PTR-MS instruments: Laboratory and field measurements. Atmos. Chem. Phys. 2010, 10, 1821–1835. [Google Scholar] [CrossRef]
  27. Odum, J.R.; Hoffmann, T.; Bowman, F.; Collins, D.; Flagan, R.C.; Seinfeld, J.H. Gas/particle partitioning, and secondary organic aerosol yields. Environ. Sci. Technol. 1996, 30, 2580–2585. [Google Scholar] [CrossRef]
  28. Reitzig, M.; Mohr, S.; Heinzow, B.; Knöppel, H. VOC emissions after building renovations: Traditional and less common indoor air contaminants, potential sources, and reported health complaints. Indoor Air 1998, 8, 91–102. [Google Scholar] [CrossRef]
  29. Dawadi, P.N.; Cook, D.J.; Schmitter-Edgecombe, M. Automated cognitive health assessment from smart home-based behavior data. IEEE J. Biomed. Health Inf. 2016, 20, 1188–1194. [Google Scholar] [CrossRef] [PubMed]
  30. Krishnan, N.C.; Cook, D.J. Activity recognition on streaming sensor data. Pervasive Mob. Comput. 2014, 10, 138–154. [Google Scholar] [CrossRef] [PubMed]
  31. Hu, Y.; Tilke, D.; Adams, T.; Crandall, A.S.; Cook, D.J.; Schmitter-Edgecombe, M. Smart home in a box: Usability study for a large scale self-installation of smart home technologies. J. Reliab. Intell. Environ. 2016, 2, 93–106. [Google Scholar] [CrossRef]
  32. Trabelsi, D.; Mohammed, S.; Chamroukhi, F.; Oukhellou, L.; Amirat, Y. An unsupervised approach for automatic activity recognition based on Hidden Markov model regression. IEEE Trans. Autom. Sci. Eng. 2013, 10, 829–835. [Google Scholar] [CrossRef]
  33. Saeedi, A.; Hoffman, M.; Johnson, M.; Adams, R. The segmented iHMM: A simple, efficient hierarchical infinite HMM. In Proceedings of the International Conference on Machine Learning, New York, NY, USA, 19–24 June 2016; pp. 2682–2691. [Google Scholar]
Figure 1. The floorplans and sensor layouts for the two smart homes. (a) The layout for IAQ1; (b) The layout for IAQ2.
Jsan 06 00013 g001aJsan 06 00013 g001b
Figure 2. Locations of indoor and master racks.
Jsan 06 00013 g002
Figure 3. The Center for Advanced Studies in Adaptive Systems (CASAS) Smart Home in a Box (SHiB).
Jsan 06 00013 g003
Table 1. Instruments for indoor air quality (IAQ) chemical data collection.
AnalyteInstrument(s)PrecisionAccuracy
Indoor Rack Instruments
CO2LGR Model 915-0011100 ppbv1%
LiCOR 840A<1 ppmv1%
H2O LGR Model 915-001135 ppmv1%
LiCOR 840A<0.01‰1.5%
CH4LGR Model 915-00110.6 ppbv1%
O32B Technology Model 2051 ppbv2%
PMTSI 8530 DustTrak for PM2.5 mass concentration0.01%10%
Dylos Corp DC1100 for PM number density
Master Rack Instruments
O3TECO 49 O32 ppbv2%
PMTSI 8530 DustTrak0.01%10%
CO2LiCOR 840A<1 ppmv1%
H2OLiCOR 840A<0.01‰1.5%
VOCsIonicon Analytik PTR-MS3–30%7%
COTeledyne 300U0.5%1%
NOXTeledyne 200U0.2 ppbv1%
Weather Station
Wind speedAIRMAR WX2000.1 m/s5%
Wind directionAIRMAR WX2000.1 deg5 deg
TempAIRMAR WX2000.1 °C1.1 °C
PressureAIRMAR WX2000.1 mbar1 mbar
Table 2. Overall smart home (SH) features used to predict the variables of the first smart home (IAQ1). We report the classifier that was used, and the number of IAQ variables that are predicted with at least a moderate effect (r ≥ 0.3).
MethodNumber of r ≥ 0.3Total NumberPercentageNRSME
Random Forest485194%0.0961
Linear Regression415180%0.2241
Support Vector Regression425182%0.1415
Table 3. Overall SH features used to predict the variables of the second smart home (IAQ2).
MethodNumber of r ≥ 0.3Total NumberPercentageNRSME
Random Forest505198%0.1118
Linear Regression395176%0.1314
Support Vector Regression305159%0.1816
Table 4. Overall SH features predicted for the aggregated dataset of variables for both houses (IAQ1_2).
MethodNumber of r ≥ 0.3Total NumberPercentageNRSME
Random Forest505198%0.0798
Linear Regression315160%0.2559
Support Vector Regression275153%0.2591
Table 5. Each IAQ variable predicted by random forest (RF) in the aggregated dataset IAQ1_2.
Higher Correlation Inside than OutsideHigher Correlation Outside than Inside
VariableCorrelationCorrelationVariableCorrelationCorrelation
InsideOutsideInsideOutside
C3-benzenes0.95540.3462α-pinene fragment0.67230.7495
C2-benzenes0.95370.5457C4-benzenes0.50200.5299
temperature0.94620.8830particulate matter0.48080.5121
methane0.9334NAacetaldehyde0.43130.5536
methanol0.92650.5550α-pinene0.32250.6151
formaldehyde0.90610.5407wind speedNA0.7596
methyl ethyl ketone0.89950.6076wind directionNA0.7577
methyl vinyl ketone0.89850.5954pressureNA0.7330
styrene0.89500.6155relative humidityNA0.8420
toluene0.88940.2180
acetone0.87790.5295
benzene0.86080.5598
carbon dioxide0.84650.8386
isoprene0.83380.5748
water vapor0.82760.6539
ozone0.81780.7971
acetonitrile0.77060.5988
small particle count0.4471NA
large particle count0.4253NA
Table 6. Three classification algorithms for the second type of analysis.
Experiment NumberAttribute EvaluatorClassifierSearch MethodLookup Cache Size
Experiment 1WrapperSubsetEvalRandom ForestBest First3
Experiment 2WrapperSubsetEvalJ48Best First3
Experiment 3InfoGainAttributeEval Ranking
Table 7. Selected SH attributes that as a group predict outdoor PM2.5 in IAQ1.
RFJ48
HLabelBed_Toilet_TransitionHLabelPersonalHygiene
HTMasterBathroomHTMasterBathroom
HTMasterBathroomWindowAHTDoorMasterLivingRoom
HTDoorFirstFloorToUpstairHTKitchen
HTKitchenHTMasterOfficeWindowA
HTKitchenWindowAWDMasterBedroomWindowA
HTMasterDingRoomWDDoorMasterLivingRoom
HTMasterLivingRoom
WDMasterBedroomWindowA
WDDoorUtility
WDDoor1stFloor
Table 8. Selected SH attributes that as a group predict outdoor PM2.5 in IAQ2.
RFJ48
ALevelMasterBathroomALevelMasterLivingRoom
HLabelEatHTKitchen
HTKitchenHTMainEntry
HTMainEntryHTMasterBedroom
HTMasterBathroomHTMasterLivingRoom
HTMasterBedroom
HTMasterLivingRoom
HTMasterOffice
HTUtility
Table 9. Selected SH attributes that as a group predict indoor formaldehyde in IAQ1.
RFJ48
ALevelLivingroomALevelDiningroom
ALevelOtherOfficeALevelKitchen
HLabelBed_Toilet_TransitionALevelMasterBedroom
HTBedroomAWindowBALevelMasterOffice
HTToTheFirstFloorDoorHTToTheFirstFloorDoor
HTKitchenHTKitchenA
HTKitchenAWindowA
WDMasterBedroomDoor
Table 10. Selected SH attributes that as a group predict indoor formaldehyde in IAQ2.
RFJ48
HLabelWashDishesHTMainEntry
HTKitchenWDMainDoor
HTMainEntry
HTMasterBathroom
HTMasterBedroom
HTOtherLivingRoom
WDMasterBedroomWindowB
WDOtherBedroomWindowA
WDDoorUtility
Table 11. Selected SH attributes that as a group predict indoor methanol in IAQ1.
RFJ48
ALevelLivingroomHTMasterBathroom
HTMasterBathroomHTUtilityDoor
HTKitchenHTKitchen
HTKitchenAWindowAHTMasterLiving
Table 12. Selected SH attributes that as a group predict indoor methanol in IAQ2.
RFJ48
HTKitchenALevelDiningRoom
HTMasterBathroomHLabelCook
HTMasterLivingRoomHLabelSleep
HTMasterOfficeHTKitchen
HTOtherLivingRoomHTMasterBathroom
WDMasterBedroomWindowAHTOtherLivingRoom
Table 13. Summary of SH feature name explanation, organized by prefix.
SH Features with PrefixFeature Names
HHourly Data
TTemperature features
ALevelActivity Level features
LabelLabeled Activity Durations
WDOpen/Closed area of window/door
Table 14. InfoGain method predictions for outdoor PM2.5 in IAQ1.
Information Gain ValueSH FeaturesInformation Gain ValueSH Features
0.3860HTMasterBathroom0.2690HTMasterBathroomWind
0.3675HTDoor1stFloor0.2568HTMasterBedroomWind
0.3624HTDiningroom0.2024HTMasterOfficeWindowA
0.3461HTKitchenA0.2008HTKitchenWindowA
0.3433HTMasterBedroom0.1694HTOtherBathroom
0.3394HTOtherBedroom0.1636HTDoorMasterBedroomToBalcony
0.3330HTDoorDiningRoom0.1239HTMasterBedroomWind
0.3202HTDoorUtility0.1145ALevelMasterBedroom
0.2993HTMasterLivingroom0.0945ALevelLivingroom
0.2990HTDoorMasterLivingroom0.0813ALevelMainEntry
0.2922HTMainDoor
Table 15. InfoGain method predictions for outdoor PM2.5 in IAQ2.
Information Gain ValueSH Features
0.4677HTMainEntry
0.2438HTKitchen
0.1699HTMasterBedroom
0.1501HTMasterBathroom
0.1188HTMasterOffice
0.0972HTUtility
Table 16. InfoGain method predictions for indoor formaldehyde in IAQ1.
Information Gain ValueSH FeaturesInformation Gain ValueSH Features
1.1547HTKitchen0.4995HTKitchenAWindowA
0.6945HTMainDoor0.8700HTMasterBedroom
1.1039HTToTheFirstFloorDoor0.4781HTMasterBathroomWindow
0.6512HTMasterLivingroomDoor0.8386HTDiningRoomDoor
1.0974HTDiningRoom0.4412HTMasterBedroomWindowA
0.5538HTMasterLiving0.8334HTUtilityDoor
1.0541HTMasterBathroom0.2731HTOfficeAWindowA
0.5153HTMasterBedroomDoor0.7271HTOtherBathroom
0.8964HTOtherBedroom0.2541HTMasterBedroomWindowB
Table 17. InfoGain method predictions for indoor formaldehyde in IAQ2.
Information Gain ValueSH Features
0.2950HTMasterBathroom
0.1850HTKitchen
0.1830HTMainEntry
0.1640HTOtherLivingRoom
0.1470HTUtility
0.1300HTMasterBedroom
0.1100HTMasterOffice
Table 18. InfoGain method predictions for indoor methanol in IAQ1.
Information Gain ValueSH FeaturesInformation Gain ValueSH Features
1.1617HTUtilityDoor0.8965HTOtherBedroom
1.1503HTMasterBathroom0.8561HTMasterBathroomWindow
1.1308HTMasterBedroom0.8515HTMainDoor
1.0434HTDiningRoomDoor0.7545HTKitchenWindowA
1.0160HTDiningRoom0.7399HTMasterBedroomWindowA
0.9976HTOtherBathroom0.7340HTMasterBedroomDoor
0.9832HTKitchenA0.7064HTMasterLiving
0.9663HTToTheFirstFloorDoor0.5024HTOfficeAWindowA
0.9361HTMasterLivingroomDoor0.4523HTMasterBedroomWindowB
Table 19. InfoGain method predictions for indoor methanol in IAQ2.
Information Gain ValueSH Features
0.2460HTOtherLivingRoom
0.2010HTMasterBathroom
0.1810HTMainEntry
0.1520HTMasterOffice
0.1060HTKitchen