Article

Tactule: A Multilayer-Bimorph Piezoelectric Tactile Display Module—System Architecture, Load-Dependent Frequency Response, and Receptor-Level Response Predictions


1
National Institute of Advanced Industrial Science and Technology (AIST), Kashiwa 277-0882, Japan
2
Research Center for Advanced Science and Technology (RCAST), The University of Tokyo, Tokyo 153-8904, Japan
3
Push-Pop Co., Ltd., Kumagaya 360-0816, Japan
4
Faculty of Health Science, Tsukuba University of Technology, Tsukuba 305-0005, Japan
5
Faculty of Industrial Technology, Tsukuba University of Technology, Tsukuba 305-0005, Japan
*
Author to whom correspondence should be addressed.
J. Sens. Actuator Netw. 2026, 15(4), 69; https://doi.org/10.3390/jsan15040069
Submission received: 12 May 2026 / Revised: 12 August 2026 / Accepted: 14 August 2026 / Published: 18 August 2026
(This article belongs to the Section Actuators, Sensors and Devices)

Abstract

We developed Tactule, a compact tactile display module that can be attached to host hardware ranging from PCs to game controllers, and characterized its frequency response under controlled, finger-pad-like loading. Tactule uses a 6 × 6 matrix of multilayer-bimorph piezoelectric pins (with the four corner pins removed; 32 channels at 2 mm pitch), together with an 8 × 8 variant, that delivers more than 60 μ m of free displacement at AC 5 V, a regime accessible from a standard USB power supply. We measured per-pin peak-to-peak rear-face displacement at 50–800 Hz across a graded series of five silicone loads (Shore A 10 to 90) and an unloaded reference, using sinusoidal and rectangular driving signals. The unloaded response peaks at 600 Hz; Shore A 10 loading shifts the peak to 750 Hz; and above 700 Hz, the Shore A 10 amplitude exceeds the unloaded amplitude. Coupling the measured waveforms to published models of the tactile periphery shows that the module drives the Pacinian channel with a wide margin throughout the band while reaching the non-Pacinian channels only at its low-frequency edge, providing engineering knowledge for designing receptor-specific stimulation patterns in assistive applications.

1. Introduction

Tactile sensation refers to the perception produced by physical contact between a person and the external world [1,2]. It is divided into cutaneous and deep sensations [3,4,5,6]; this paper focuses on the cutaneous component, hereafter referred to as tactile sensation. Cutaneous mechanoreceptors comprise four functionally distinct populations: Merkel disks (SA-I), Ruffini endings (SA-II), Meissner corpuscles (FA-I/RA-I), and Pacinian corpuscles (FA-II/RA-II). Together, they remain sensitive to vibrations from a few hertz to approximately 1 kHz, with Pacinian sensitivity peaking around 200–300 Hz [7,8,9]. Devices that present such artificial sensations to the skin are called tactile displays [10,11]. Visual and auditory displays are increasingly studied to reproduce realistic sensations  [12,13,14]. A particularly important class of applications concerns assistive technology. Tactile displays have long been investigated as a means of conveying large amounts of symbolic and graphical information to people with visual or hearing impairments [15,16,17,18], and various methods for special-needs education and rehabilitation have been proposed alongside them [19,20,21,22,23].
Because many people with visual impairments and deafblindness have difficulty using visual information, they rely on Braille and tactile graphics to access textual and graphical content, as well as on pin-array displays that can refresh diagrams in coordination with computers and mobile devices [24,25,26,27,28,29,30]. Various tactile aids have also been proposed as sensory substitution devices to provide richer interactive access to visual and auditory information, such as Optacon, which converts camera images into vibration patterns at the fingertip [24]; the TAJODA family, which adds tactile cues to a text-to-speech reading system [25,26]; and its wearable extension TAJODA II, which encodes signals from a small camera, microphone, and accelerometer as vibration patterns [27,28]. Despite this body of work, the mechanisms underlying tactile perception of textual and graphical information among visually impaired and deafblind users remain incompletely understood. Effective presentation methods for content beyond plain text and simple line diagrams, such as photographs, scientific figures, maps, and dynamic content from games and applications, also remain underdeveloped.
Two technical challenges are associated with this gap. The first concerns the spatial resolution. Single-point or small-cluster vibrators, such as eccentric rotating masses and linear resonant actuators commonly built into smartphones and game controllers, can modulate only one stimulation site over time. Consequently, the information they can deliver is limited to one-dimensional patterns of intensity, frequency, and rhythm [31,32], and they cannot directly render two-dimensional shapes, layouts, or topological information. Psychophysical studies have shown that the two-point spatial resolution at the fingertip lies in the range of 1–2 mm [33,34] and that high-resolution graphical information requires stimulator pitches of the same order [35]. Therefore, achieving this level of resolution while preserving control and timing makes a matrix (pin-array) configuration of independently driven stimulators essential  [36,37,38]. The second challenge concerns the drive voltage and integration cost. Many high-performance tactile displays still require tens to hundreds of volts and bulky high-voltage amplifiers [25,39,40,41], which increase cost, weight, and safety concerns and discourage integration with mass-market devices. In contrast, operating from a standard USB 5 V supply dramatically lowers the deployment barrier [29,42,43].
In this study, our long-term goal was to clarify the unique mechanisms for auditory and tactile texture perception in blind and deafblind users and, on that basis, to develop concrete presentation methods and design guidelines for assistive devices. To this end, we developed a tactile display module called Tactule that addresses the two challenges above through a single design choice: a matrix of multilayer-bimorph piezoelectric pins, in which many thin active layers are stacked mechanically in series and electrically in parallel to deliver more than 60  μ m of free displacement at AC 5 V, a regime accessible from a standard USB power supply [44,45,46]. Because the actuator’s unloaded behavior does not directly determine what the finger perceives, the finger pad presents a frequency-dependent mechanical impedance that can attenuate, shift, or even suppress small-actuator resonances [39,47,48]. We therefore also characterized the module’s frequency response under silicone loads of controlled hardness chosen to span the range of effective finger pad impedances reported in the literature. The module was designed as an attachable component rather than a standalone instrument so that the same hardware could serve as the front end of standalone texture-evaluation systems and as accessory hardware, such as game controllers. The contributions of this study are as follows: (i) the system architecture of Tactule, including its multilayer-bimorph pin matrix, FPGA-based driver, and 5 V USB-only operation, and (ii) a frequency-response characterization of the module under controlled silicone loads that simulate the impedance-loading effect of a human finger, providing the basic engineering knowledge needed to target specific tactile receptor populations and to inform the subsequent design of stimulation patterns for assistive applications.
The contributions of this study can be summarized in the following three points:
1.
Low-voltage hardware. Refreshable pin displays are dominated by piezoelectric bimorph reeds, which the literature places in the 100–300 V range and which commercial modules drive from 200 V circuitry integrated into each cell [49,50]. Our earlier prototype was no exception, requiring AC 56 V for 110  μ m of displacement [25]. The multilayer bimorph developed here delivers more than 60  μ m at AC 5 V, roughly a fortyfold reduction that eliminates the high-voltage stage altogether: as shown in Section 4.2, the 32- and 64-channel configuration keeps every channel within the 500 mA budget of a USB port across the 50–800 Hz band.
2.
Load-dependent characterization. Existing pin-matrix displays are quasi-static: a pin is set to a height and held there, and the figure of merit is a refresh rate of a few hertz [49,51,52]. Each Tactule pin instead serves as a controlled vibration source across 50–800 Hz. Because the two device classes are characterized in different terms, the frequency response of a pin matrix under realistic contact load is, to our knowledge, not available in the literature: datasheet figures are quoted without load, and the few loaded measurements that exist use a single contact condition. We report it across five silicone grades and two driving waveforms, and show that loading shifts the resonance rather than merely attenuating the output, to the point that a finger pad-like load yields larger displacements than free air above 700 Hz. Free-air characterization, the standard practice for these actuators, therefore misstates what the device can do in use.
3.
Receptor-level design knowledge. Coupling the measured waveforms with published forward models of the tactile periphery (Section 4.4) converts the mechanical measurements into predictions of which mechanoreceptor populations the device engages and shows that driving frequency governs not only the recruited population but also the spatial specificity of the evoked response. This yields a concrete and testable design rule for pin-matrix displays intended to render tactile graphics.
Based on the metrics shown later in Table 1, the module is distinguished by operating voltage and by the pin pitch achievable at that voltage rather than by displacement or channel count, on which several existing systems are comparable or superior. What is distinctive is therefore the combination of pitch, bandwidth, and supply voltage, which to our knowledge has not previously been reported together, rather than any single metric taken alone.

2. Related Work

Tactile display research has spanned several decades across multiple disciplines. To position the present work, we organize the prior literature into three thematic strands—actuation technologies, assistive applications for visually impaired users, and vibrotactile perception under realistic finger loading. We then summarize the gaps that motivated this study.

2.1. Tactile Display Actuator Technologies

Pin-array tactile displays have been implemented using a wide range of actuation principles, including displacement, force, bandwidth, drive voltage, footprint, and cost [10,11,18,37,50]. Conventional bimorph piezoelectric reeds remain the dominant technology in commercial refreshable braille displays, including products from HumanWare, Handy Tech, and Freedom Scientific [29,50,59], because they offer fast response, latching behavior, and long lifetimes. However, single-layer bimorphs typically require 50–200 V to achieve sufficient tip displacement [25,39,46], which forces designers to use bulky high-voltage amplifiers and limits portability. Recent academic prototypes have explored higher-density piezoelectric arrays with submillimeter pin pitch and refresh rates up to 50 Hz [43,60,61]; however, the high-voltage barrier persists.
To reduce drive voltage, multilayer (co-fired) bimorph and helimorph structures stack many thin active layers mechanically in series and electrically in parallel, achieving comparable tip displacement at a fraction of the voltage [44,45,46,62]. Commercial multilayer benders currently operate at approximately 60 V, and laboratory devices have demonstrated low-voltage co-fired bimorphs at 5–12 V [42,44]. These developments make USB-only operation realistic; however, few systems have published end-to-end matrix designs that operate within a 5 V USB power budget.
Alternative actuator families have also been investigated, each with characteristic limitations. Shape-memory alloys provide large strains but suffer from slow thermal cycling and high power dissipation [63,64]. Electroactive polymers and dielectric elastomers offer compact, soft form factors but typically require multi-kV drive voltages [40,41,65,66]. Pneumatic and microfluidic displays produce smooth, quasi-static deformation but require external compressors and exhibit limited bandwidth [29,67,68]. Electrotactile and electrovibration approaches [35,58,69] avoid mechanical pins entirely but couple strongly to skin moisture and contact area, making calibration difficult. Several photothermal and stimuli-responsive polymer displays have recently been developed [70,71], but they remain confined to research laboratories. Across this landscape, multilayer-bimorph piezoelectric pins remain among the most promising approaches for compact, fast, low-voltage, USB-powered matrix tactile displays.

2.2. Tactile Displays as Assistive Technology for Visual Impairment

Tactile interfaces for blind and low-vision users were pioneered by sensory-substitution devices, such as Optacon [24] and the Tactile Vision Substitution System [72], which map camera images onto pin or electrode arrays. These systems demonstrated that the skin can convey surprisingly rich visual information after training, but their pin counts and refresh rates were modest, and their costs were prohibitive. Subsequent work pursued three directions: (i) text-oriented refreshable Braille displays [29,50,59]; (ii) larger pin-array graphic displays for figures, maps, and STEM materials, such as BlindPAD [54,73], Graphiti and Graphiti Plus from Orbit Research [74], and the Dot Pad family from Dot Inc. (Seoul, Republic of Korea)  [51]; and (iii) hybrid systems that overlay audio descriptions on swell paper or touchscreen renderings [52,75,76,77]. Comparative evaluations have shown that interactive audio-tactile maps support cognitive map formation as effectively as embossed paper maps and are preferred by many users [78,79,80]. Updated tactile feedback on programmable pin arrays has also been shown to outperform static tactile maps in real-world wayfinding tasks [54,73].
The second strand of assistive work uses small vibrotactile arrays embedded in wearable form factors—wristbands, belts, shoes, or rings—primarily for navigation and obstacle warning, rather than for graphic rendering [37,81,82,83]. Although these devices have demonstrated improvements in mobility, they typically encode information as one- or two-bit alerts because their actuators, usually small ERMs or LRAs, cannot produce the spatial detail required for shape representation. Research on vibrotactile vocoders for deaf and hard-of-hearing users follows a similar pattern: Tacticon, Tactaid, and more recent compact wearables on the wrist [84,85,86,87,88] can transmit considerable phonemic information; however, they exploit the temporal rather than the spatial dimension of touch.
Third, tactile feedback has emerged as an accessibility channel in entertainment and gaming contexts. Microsoft has filed patents for a refreshable Braille game controller [89], and modern controllers, such as the PlayStation DualSense and Nintendo Switch HD Rumble, have introduced richer haptic primitives that have been used in both mainstream titles, such as The Last of Us [90], and academic prototypes, such as Foveated Haptic Gaze [91]. These efforts have further motivated the design of compact, attachable tactile modules that can be retrofitted onto existing controllers and accessory hardware.

2.3. Vibrotactile Perception, Mechanoreceptors, and Finger Loading

Designing a tactile display in isolation from human perception risks delivering signals that the skin cannot resolve. Four-channel theory associates the perception of vibrotactile stimuli with four mechanoreceptive populations [7,8,92]: SA-I (Merkel) for sustained pressure and edge contrast, SA-II (Ruffini) for skin stretch, FA-I/RA-I (Meissner) for low-frequency flutter (5–50 Hz), and FA-II/RA-II (Pacinian) for higher-frequency vibration (50–1000 Hz, with peak sensitivity of approximately 200–300 Hz) [9,93,94]. More recent work has refined this picture. Low-frequency pulsatile inputs to FA-II afferents can elicit flutter percepts [95], and remote vibration transmitted through tissues contributes to flutter discrimination [96]. Spatial acuity is governed mainly by the SA-I population, with grating orientation thresholds of approximately 1 mm at the fingertip [33,34].
However, the frequency response perceived by the user did not match the actuator’s unloaded response. The finger pad presents a frequency-dependent mechanical impedance dominated by the viscoelastic properties of the skin and underlying tissue [39,47,48,97]. Finger loading can attenuate displacement, shift the resonance frequency, or, in the worst case, completely halt small actuators whose blocking force is comparable to the contact force, a phenomenon explicitly documented for piezoelectric pins with resonance frequencies in the 400–500 Hz range [39]. Setting the actuator resonance well above the perceptual band of interest (e.g., near 1.2 kHz) preserves displacement at audio-band stimulation frequencies under finger contact [25,39]. However, this design choice must be verified empirically for each pin geometry, mounting condition, and user-applied force because predictions from one-dimensional spring–damper models break down at low force levels and high frequencies, where Pacinian sensitivity peaks [97,98].
These findings jointly define what a display must deliver to address both the spatial and vibratory dimensions of touch. Spatially, stimulators must be no more than about 2 mm apart; temporally, the device must cover at least the 50–400 Hz band with controllable amplitude at the skin. As the loading results above show, this is not the same as covering the band unloaded.

2.4. Limitations of Existing Work and the Need for the Present Study

Building on the two perceptual requirements derived in Section 2.3, assistive deployment adds a third, practical rather than perceptual requirement: the module should run from a USB 5 V supply without external high-voltage amplifiers if it is to be attached to ordinary host hardware. Table 1 assesses representative systems from the strands reviewed above against these three requirements [25,29,49,51,52,53,54,55,56,57,58].
The systems fall into two groups characterized by different metrics, and this distinction explains most of the empty cells. Pin-matrix displays intended for tactile graphics and Braille are quasi-static: a pin is set to a height and held there, so the relevant metrics are array size, pin pitch, and refresh rate. Frequency bandwidth is neither quoted nor meaningful. Vibrotactile displays instead modulate a stimulus continuously, so bandwidth and displacement amplitude are the operative figures, while refresh rate is not defined. Tactule sits between the two: it has the pin-matrix geometry of the first group and the operating regime of the second, which is why it is the only entry for which both sets of columns are populated.
When evaluated against the three requirements, the table reveals three gaps. First, no existing pin-matrix system combines a pitch of about 2 mm with per-pin amplitude and frequency control at a supply voltage compatible with USB. The voltage column separates the entries sharply: no pin-displacing system in the table operates below 50 V, and the piezoelectric ones cluster an order of magnitude above the USB rail. The electroadhesive arrays reach a finer pitch and comparable bandwidth, but they modulate lateral friction rather than displacing a pin, so they cannot render static relief [56,57]. Second, the bandwidth column is populated from datasheet or free-air measurements, whereas Section 2.3 showed that finger loading can attenuate displacement and shift the resonance. Very few studies report the frequency response of an assembled module under realistic contact load, and those that do use a single contact condition, so the numbers designers actually work from are known to overestimate what reaches the skin. Third, frequency-response data are rarely presented in a way that connects engineering measurements to the four-channel theory of vibrotactile perception, leaving designers without explicit guidance on which receptor populations a given module can recruit.
These gaps inform this study in two ways. The first is a compact tactile display module, rather than a standalone instrument, that uses multilayer-bimorph piezoelectric pins to achieve >60  μ m of displacement at AC 5 V and can be physically attached to a variety of host hardware (PCs, custom evaluation jigs, and game controllers). The second is a systematic frequency-response characterization of this module under silicone loads of controlled hardness, chosen to span the range of effective finger pad impedances reported in the literature. By explicitly reporting how load hardness shapes the module response in the 50–400 Hz band, we aim to provide the basic engineering knowledge needed to target specific mechanoreceptor populations and to inform the design of subsequent stimulation patterns for assistive applications.

3. Proposed System

3.1. System Overview

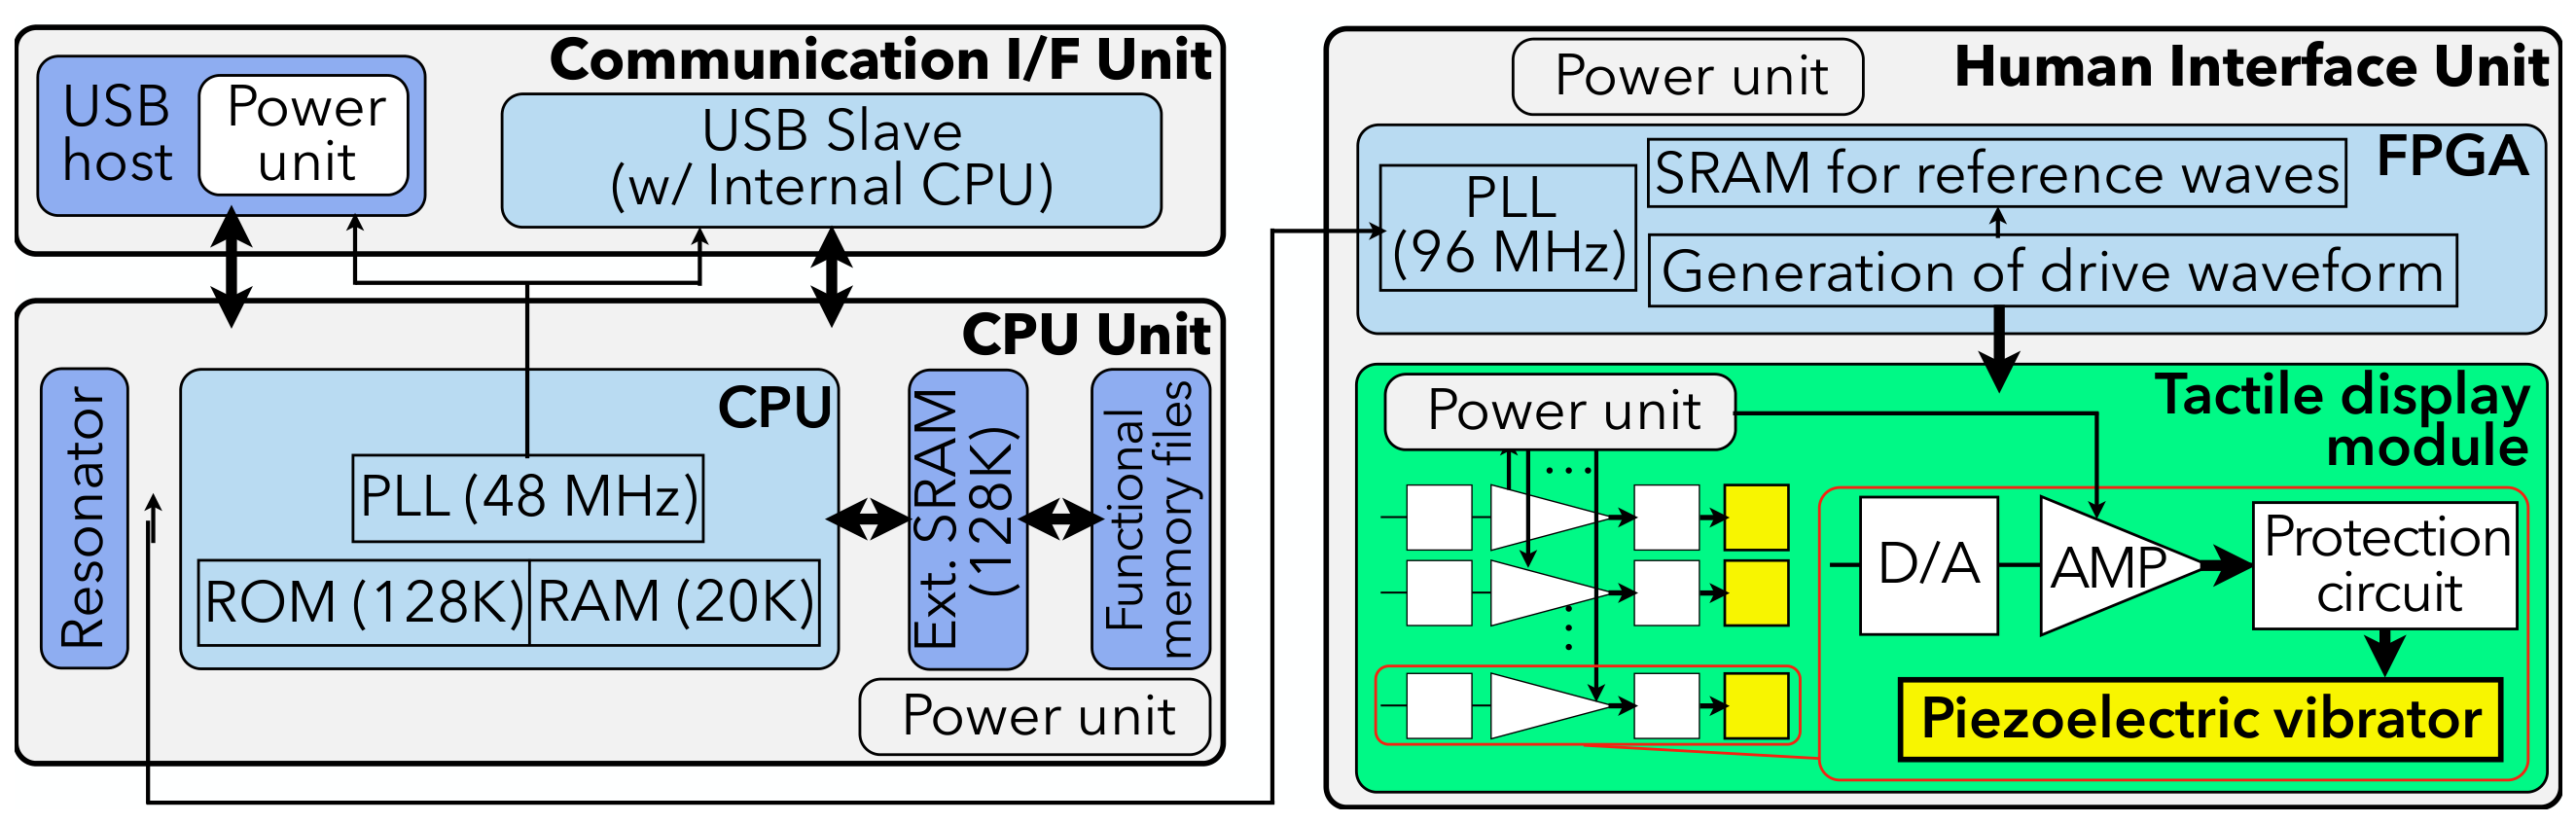
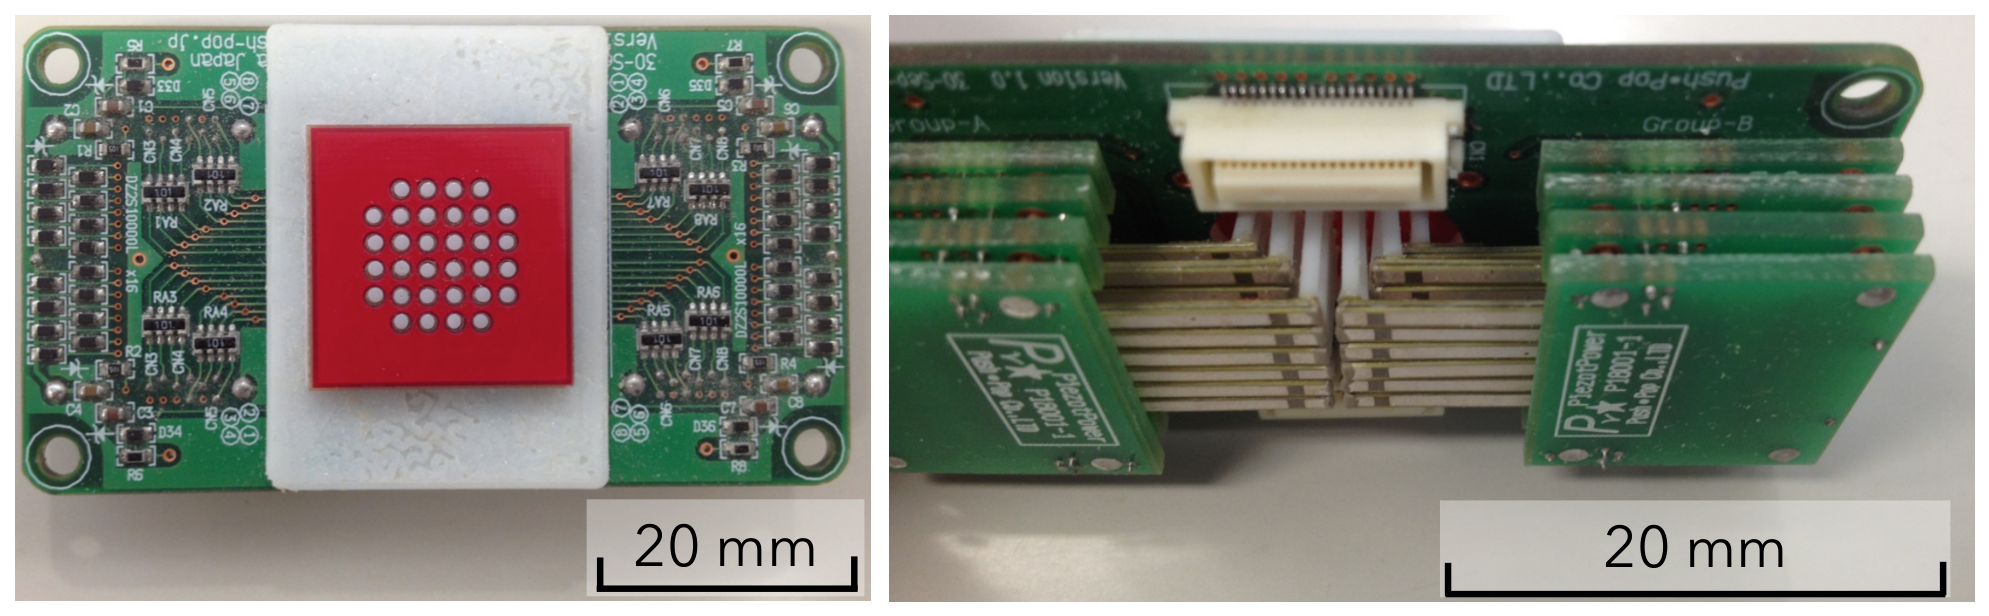
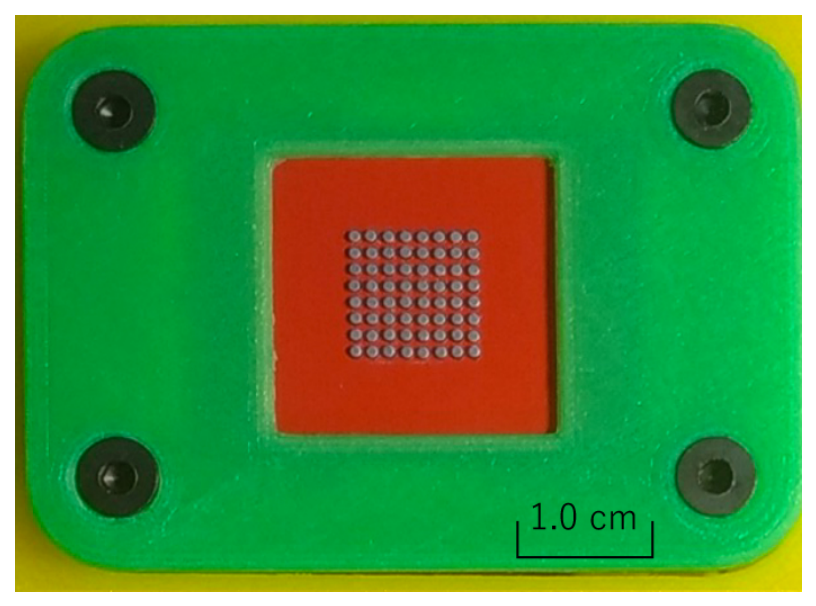
Figure 1 and Figure 2 show the tactile display module and the hardware block diagram, respectively. The tactile display consisted of a matrix of small vibrator rods (32 rods, as shown in Figure 1, and 64 rods in Figure 3). The pin matrix measured approximately 10 mm × 10 mm, similar in size to a fingertip. The vibrating pins were arranged in a matrix at intervals of 2 mm for 32 rods and 1 mm for 64 rods. To close the spaces between the pins, we designed multi-layered bimorph piezoelectric elements, as shown in Figure 1. In the 32-rod case, the pins were positioned in a 6 × 6 square, with the four corner pins removed. Similarly, the device with 64 rods has an 8 × 8 square. Each pin vibrates individually at a frequency of 50–800 Hz, with timing controlled by the central processing unit (CPU) internal software shown in Figure 2. The oscillation intensity was set for each pin using internal software and commands sent via serial communication from a personal computer. The intensity was controlled by a microcomputer and a field-programmable gate array (FPGA).

3.2. Pins on the Tactile Display Module

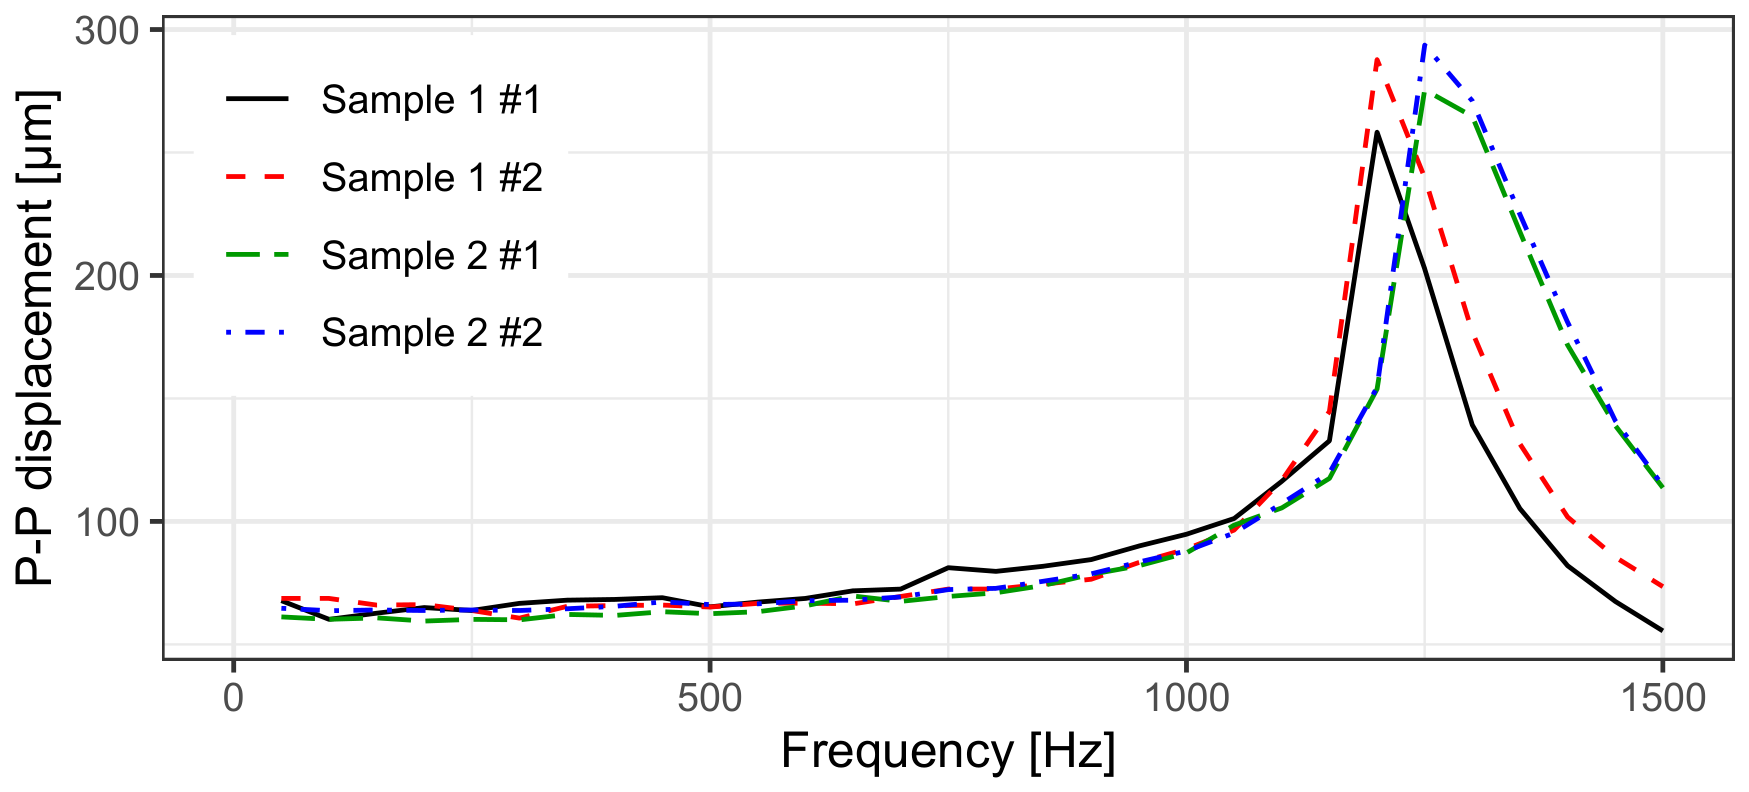
The pins were vibrated using the bimorph piezoelectric elements developed for this device. The arrangement of the pins and piezoelectric elements is shown on the right side of Figure 1. The piezoelectric elements used in our previous version of the experimental model required 56 V AC to produce an amplitude of 110  μ m [25]. Through trial and error with the engineers involved in this research, we developed a laminated bimorph piezoelectric element that vibrates with an amplitude of more than 60  μ m using only 5 V AC (Figure 4). The curves in Figure 4 were obtained from the bare laminated bimorph element, that is, before the actuating rod was mounted and without any external mechanical load, and they are shown here to document the element’s free performance. The response of the fully assembled pin, including the rod and the contact load, is the subject of Section 5.
The driving frequency range for each pin was set to 50–800 Hz to span the response bands of all four cutaneous mechanoreceptor populations relevant to vibrotactile perception. According to the four-channel theory of tactile perception [7,8,93], slowly adapting type I (SA-I, Merkel) units respond from DC up to approximately 50 Hz; slowly adapting type II (SA-II, Ruffini) units respond to skin stretch within a similarly low-frequency band; rapidly adapting type I (FA-I/RA-I, Meissner) units mediate flutter perception in the approximate range of 5–50 Hz; and rapidly adapting type II (FA-II/RA-II, Pacinian) units are most sensitive to vibrations from approximately 50 Hz to 1 kHz, with peak sensitivity around 200–300 Hz [9,94]. The 50–800 Hz band therefore covers the upper portion of the FA-I/Meissner range, the entire perceptually dominant region of the FA-II/Pacinian channel, and part of the slowly adapting channels through the lower edge of the band. This range allows each pin to selectively or jointly recruit any of the four populations, depending on the chosen driving waveform.
To reliably deliver this band under finger contact, we set the actuator’s resonance frequency to 1200 Hz, well above the perceptual band. Power is then transmitted effectively without pin vibration, and the signal weakens when a finger is applied. At resonance frequencies below 1200 Hz (e.g., 400–500 Hz), the pins’ vibrations would stop when a finger is placed on them [39]. Conversely, the pin amplitudes are insufficient when the resonance frequency is higher than approximately 1200 Hz [39]. On the actual device, the pins vibrated at a square-wave voltage of approximately 12 V.

4. Method

4.1. Measurement Procedure

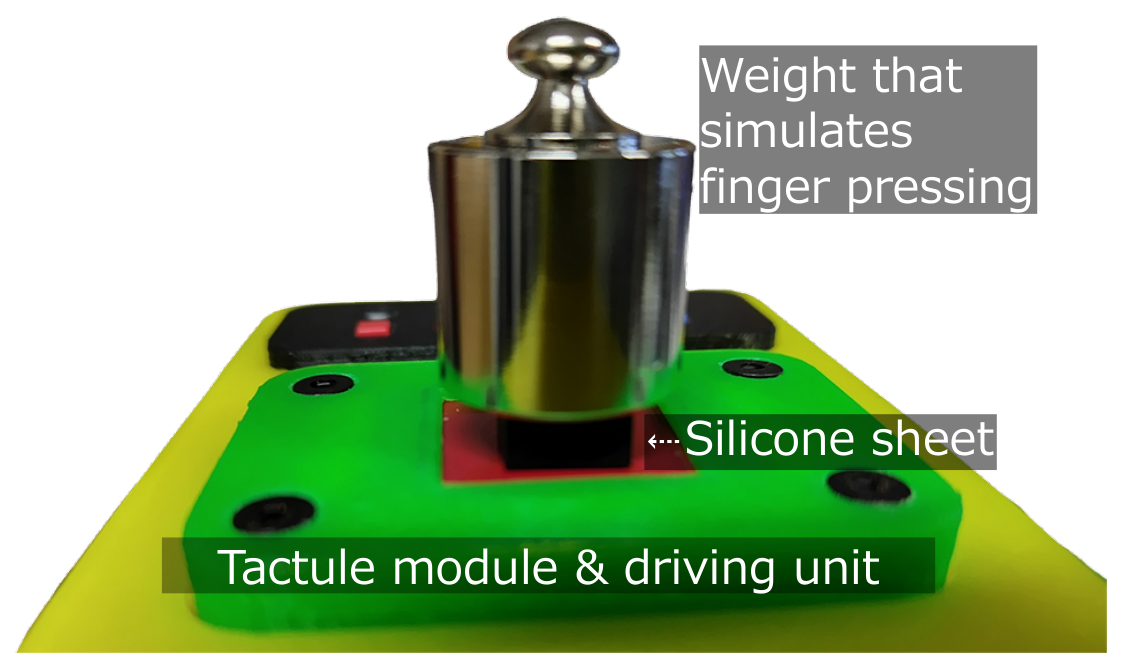
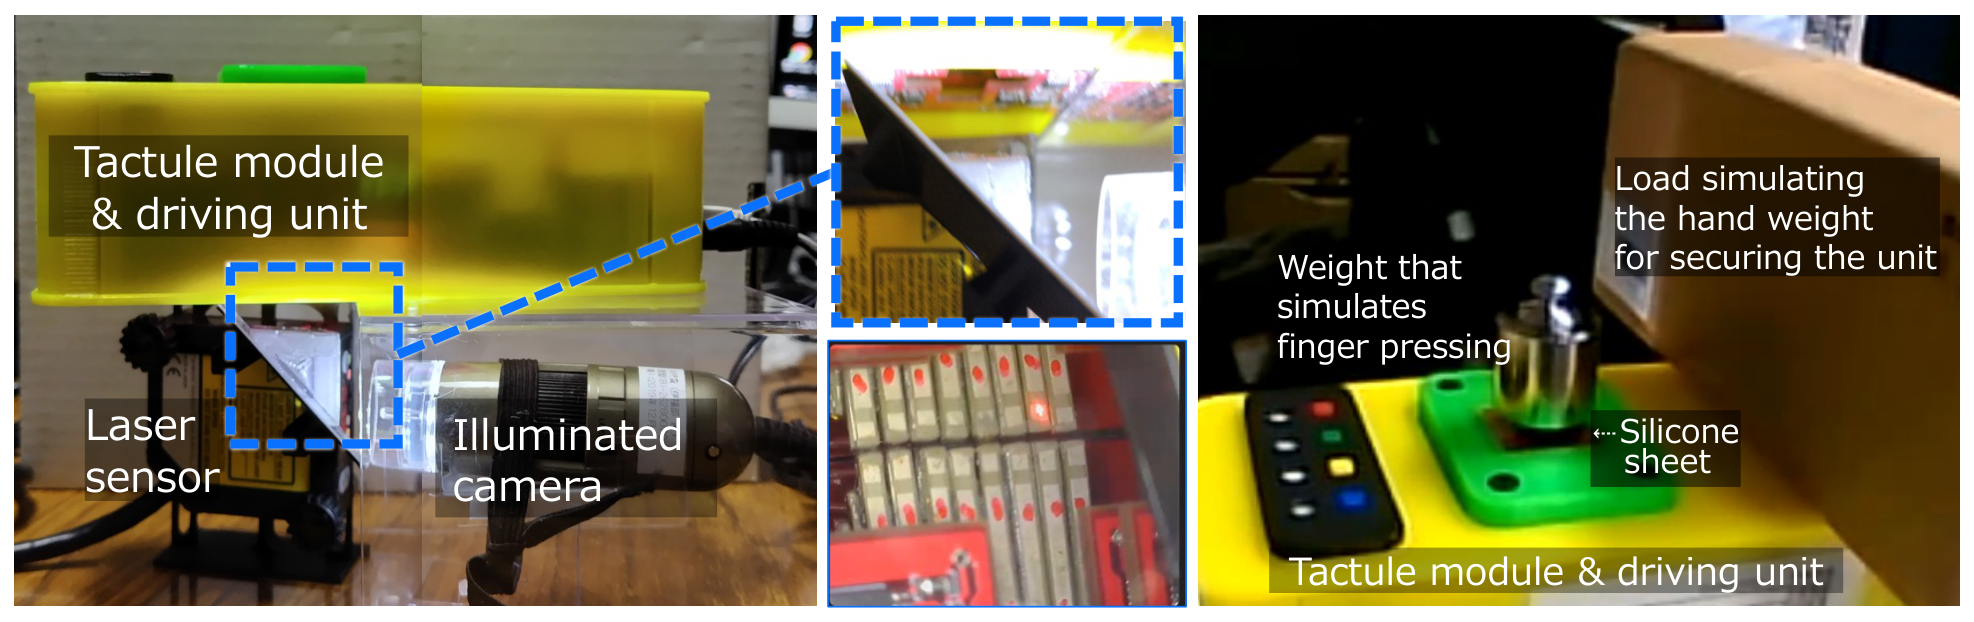
We measured the displacement of a single piezoelectric pin in the Tactule module under two load conditions: unloaded and loaded with silicone of various hardnesses. Figure 5 and Figure 6 illustrate the experimental setup for the pin. The purpose of this study was to characterize how the frequency response of a multilayer-bimorph piezoelectric vibrator is affected by an impedance load that approximates finger contact.

4.1.1. Hardware Setup

The piezoelectric pin was controlled via a MIDI controller (KORG nanoKONTROL2) connected to a Windows computer running custom Python scripts that issued per-pin amplitude and frequency commands, as described in Section 3. The pin’s front face was in contact with either the silicone load or the air in the unloaded condition. The displacement of the bimorph’s rear face was measured with a noncontact laser displacement sensor (Panasonic HL-G103-S-J; sampling frequency: 5 kHz).
The sensor output was streamed to the same PC via a LINEEYE SI-35USB serial interface and recorded using Panasonic HL-G1SMI software. By measuring the rear face, we captured the actuator’s instantaneous mechanical displacement, while the front face delivered the same displacement to the load [39,47].

4.1.2. Silicone Loads

Five flat silicone rubber sheets with nominal Shore A hardness values of 10, 30, 50, 70, and 90 were used, each measuring 20 × 20 mm and 5 mm thick, fully covering the active area of the pin matrix. Using the Gent indentation relation, generalized in the standardized durometry treatment of Mix and Giacomin [99], these hardness values correspond to Young’s moduli of approximately 0.4, 1.1, 2.5, 5.5, and 20.8 MPa, so the series spans a range of roughly fifty to one in contact stiffness. Together with the unloaded condition, the five grades trace the actuator’s response as a continuum of contact stiffness rather than at isolated points.
The two ends of the series play distinct roles. Shore A 10–30 represents the finger pad-like regime: multilayer artificial fingertips designed to reproduce human-like contact mechanics are typically reported in this range [100], and silicones near Shore A 10, such as Smooth-On DragonSkin 10, are routinely used as finger pad simulants in tactile-sensor research [101]. Shore A 70–90 represents a near-rigid upper bound on the impedance the actuator may encounter. Because subcutaneous tissue is among the softest tissues of the body [102], silicone of this hardness is not an anatomical analog of the finger pad; it instead approximates contact through a stiff intermediate part, such as an overlay plate, a glove, or a callused finger, and serves to establish where the actuator ceases to behave as it does under compliant loading. The intermediate grade, Shore A 50, falls between the two regimes. The series as a whole is consistent with the range of impedances predicted by the second-order mechanical impedance model of the human fingertip [47].
The two driving waveforms were not applied to every loading condition. Sinusoidal drive was measured under all six conditions, namely the unloaded condition and all five silicone grades. Rectangular drive was measured under the unloaded condition, Shore A 10, and Shore A 90, which sample the compliant end, the near-rigid end, and the absence of loading. The waveform comparison reported in Section 5 therefore rests on those three conditions, whereas the hardness series rests on sinusoidal drive throughout. When each silicone sheet was pressed against the pin matrix, a 50 g brass weight, corresponding to approximately 0.49 N of normal force, was placed on top. These weights were used to prevent the contact points from drifting during each measurement. The applied force corresponds to a light-touch contact condition. This standard low-force condition is commonly used in finger pad vibrotactile psychophysics studies [69,103] and lies well within the range in which the finger pad mechanical impedance is nearly linear [47].

4.1.3. Driving Signals and Measurement Protocol

For each loading condition, each pin was driven in sequence with an approximately 12 V square-wave voltage at 50, 100, 150, 750, and 800 Hz. This range extends beyond the 50–400 Hz perceptual band used during normal operation (Section 3.2) to characterize the actuator’s 1.2 kHz resonance behavior. Each frequency was applied for 2.0 s. This duration exceeds the approximately 1 s temporal summation window of vibrotactile perception [104,105], ensuring that the response reached a mechanically steady state. It also provided at least 100 cycles at the lowest test frequency (50 Hz × 2.0 s), allowing stable estimates of the peak-to-peak displacement and displacement spectrum.
All measurements were conducted at a temperature of 21.7 °C and a relative humidity of 25%. These conditions were selected to ensure the stability of both the piezoelectric driver and the Shore A hardness of the silicone specimens throughout the measurement session. This was selected because the durometer reading of silicone can be mildly affected by temperature changes, as described by the ASTM D2240 protocol [106].

4.2. Electrical Characteristics and Scalability

Direct measurement of the current drawn by an individual pin is impractical on the assembled module because each element is bonded to a shared drive bus and cannot be isolated without dismantling the array. We therefore estimate the electrical demand analytically from the actuator’s well-constrained electrical model: a multilayer-bimorph piezoelectric element presents an essentially capacitive load, and the measured capacitance of one pin is C = 500  nF.
For a sinusoidal drive of amplitude V at frequency f, the current amplitude drawn by a single pin is
I pin ( f ) = 2 π f C V ,
and the total current for n simultaneously driven pins is I total = n I pin . Two features of this relation govern the module’s electrical behavior. First, the demand is proportional to frequency, so the worst case is always at the top of the operating band rather than at the largest displacement. Second, the current is almost entirely reactive: a capacitive load returns its stored energy to the driver each half-cycle, so the apparent power in Equation (1) is not dissipated in the element. Real dissipation is limited to dielectric loss and the series resistance of the drive path. A protection resistor is included in each channel so that residual heating is small enough to neglect the temperature dependence of the piezoelectric response over a measurement session.
Table 2 lists the resulting per-pin current amplitude at three drive voltages: 5 V from a standard USB port, approximately 12 V used for the measurements reported in Section 5, and the 36 V maximum drive amplitude permitted by the driver, whose rail limit is 40 V (all voltages in this section are amplitudes, not peak-to-peak values). The 36 V case requires an external AC supply; the 5 V case does not.
The practical consequence is a frequency-dependent limit on how many pins can be driven simultaneously from a USB supply. For the 6 × 6 configuration with the four corner positions removed (32 channels), the total current reaches 402 mA at 800 Hz, so every channel can be driven simultaneously across the entire 50–800 Hz band within the 500 mA budget. For the 8 × 8 configuration (64 channels), all channels can be driven simultaneously up to approximately 500 Hz; above that frequency, the budget accommodates progressively fewer, falling to 39 channels at 800 Hz. This is not a restriction for the rendering patterns considered in Section 5.6, in which at most half the array is active at any instant. It is also a further argument for operating a graphics-rendering display below the loaded resonance rather than at it (Section 6.5). Where the full array must be driven at the top of the band, an external supply is required. At the 36 V maximum amplitude, the reactive demand of 64 channels reaches approximately 104 VA at 800 Hz.
These figures are estimates from the capacitive model rather than direct measurements, and they neglect the switching losses of the driver stage, which depend on the implementation of the output circuit. For the same reason, we do not quote a pattern refresh rate: the update interval is set by the FPGA driver and its firmware rather than by the actuator, and it cannot be measured on the assembled module without instrumenting the driver. Therefore, the corresponding entry in Table 1 is marked as not applicable. They should therefore be read as the order of magnitude of the electrical demand and as the basis for the scalability argument above, not as a characterization of a particular driver.

4.3. Analysis

For each combination of pin, loading condition (no load, Shore A 10, or Shore A 90), driving waveform (sinusoidal or rectangular), and driving frequency (50, 100, …, 800 Hz), we extracted consecutive peak-to-peak (p-p) displacement values from the recorded rear-face displacement traces and summarized them as the mean and standard deviation reported in Section 5. All processing was performed offline in R 4.5.1 [107] using the pracma package [108] for peak detection.

4.3.1. Pre-Processing

Each recorded trace consisted of approximately 3000 samples spanning the 2.0 s presentation window. The first 100 and last 50 samples were discarded to remove the actuator’s onset and offset transients. The remaining samples were linearly detrended to remove any DC offset and slow drift introduced by the laser displacement sensor. This detrending step was necessary to ensure stable peak detection when the rear-face signal’s baseline varied slowly over the 2 s recording period.

4.3.2. Peak-to-Peak Extraction

The local maxima and minima of the detrended trace were detected using the findpeaks routine from the pracma package with two adaptive constraints. The minimum sample separation between consecutive same-type extrema was set to 0.7 · f s / f d samples, where f s is the sampling rate and f d is the driving frequency. This constraint prevented spurious peaks within a single half-cycle while preserving the first and last genuine peaks of each cycle. The minimum prominence required for peak acceptance was set to 5% of the detrended signal range, thereby removing maxima generated by sensor noise without affecting the peaks driven by the actuator. The detected maxima and minima were then merged into a single chronological list and forced into a strictly alternating max–min sequence. When two same-type extrema occurred consecutively (e.g., two maxima with no minimum in between, as can happen near a flat plateau of a rectangular waveform), the one with the smaller absolute value was discarded. The same procedure was applied identically to the sinusoidal and rectangular traces, so that the p-p value reported for each half-cycle of either waveform was defined as the absolute difference between one maximum and the immediately preceding or following minimum.
For each trace, this procedure yielded a vector of consecutive p-p values, one per half-cycle of the driving signal; for the 2.0 s presentation window, this corresponded to approximately 200 values at 50 Hz and approximately 3200 values at 800 Hz. To remove the residual influence of any half-cycle affected by edge or boundary artefacts, the upper and lower 5% of the resulting p-p distribution were winsorized before the summary statistics were computed.
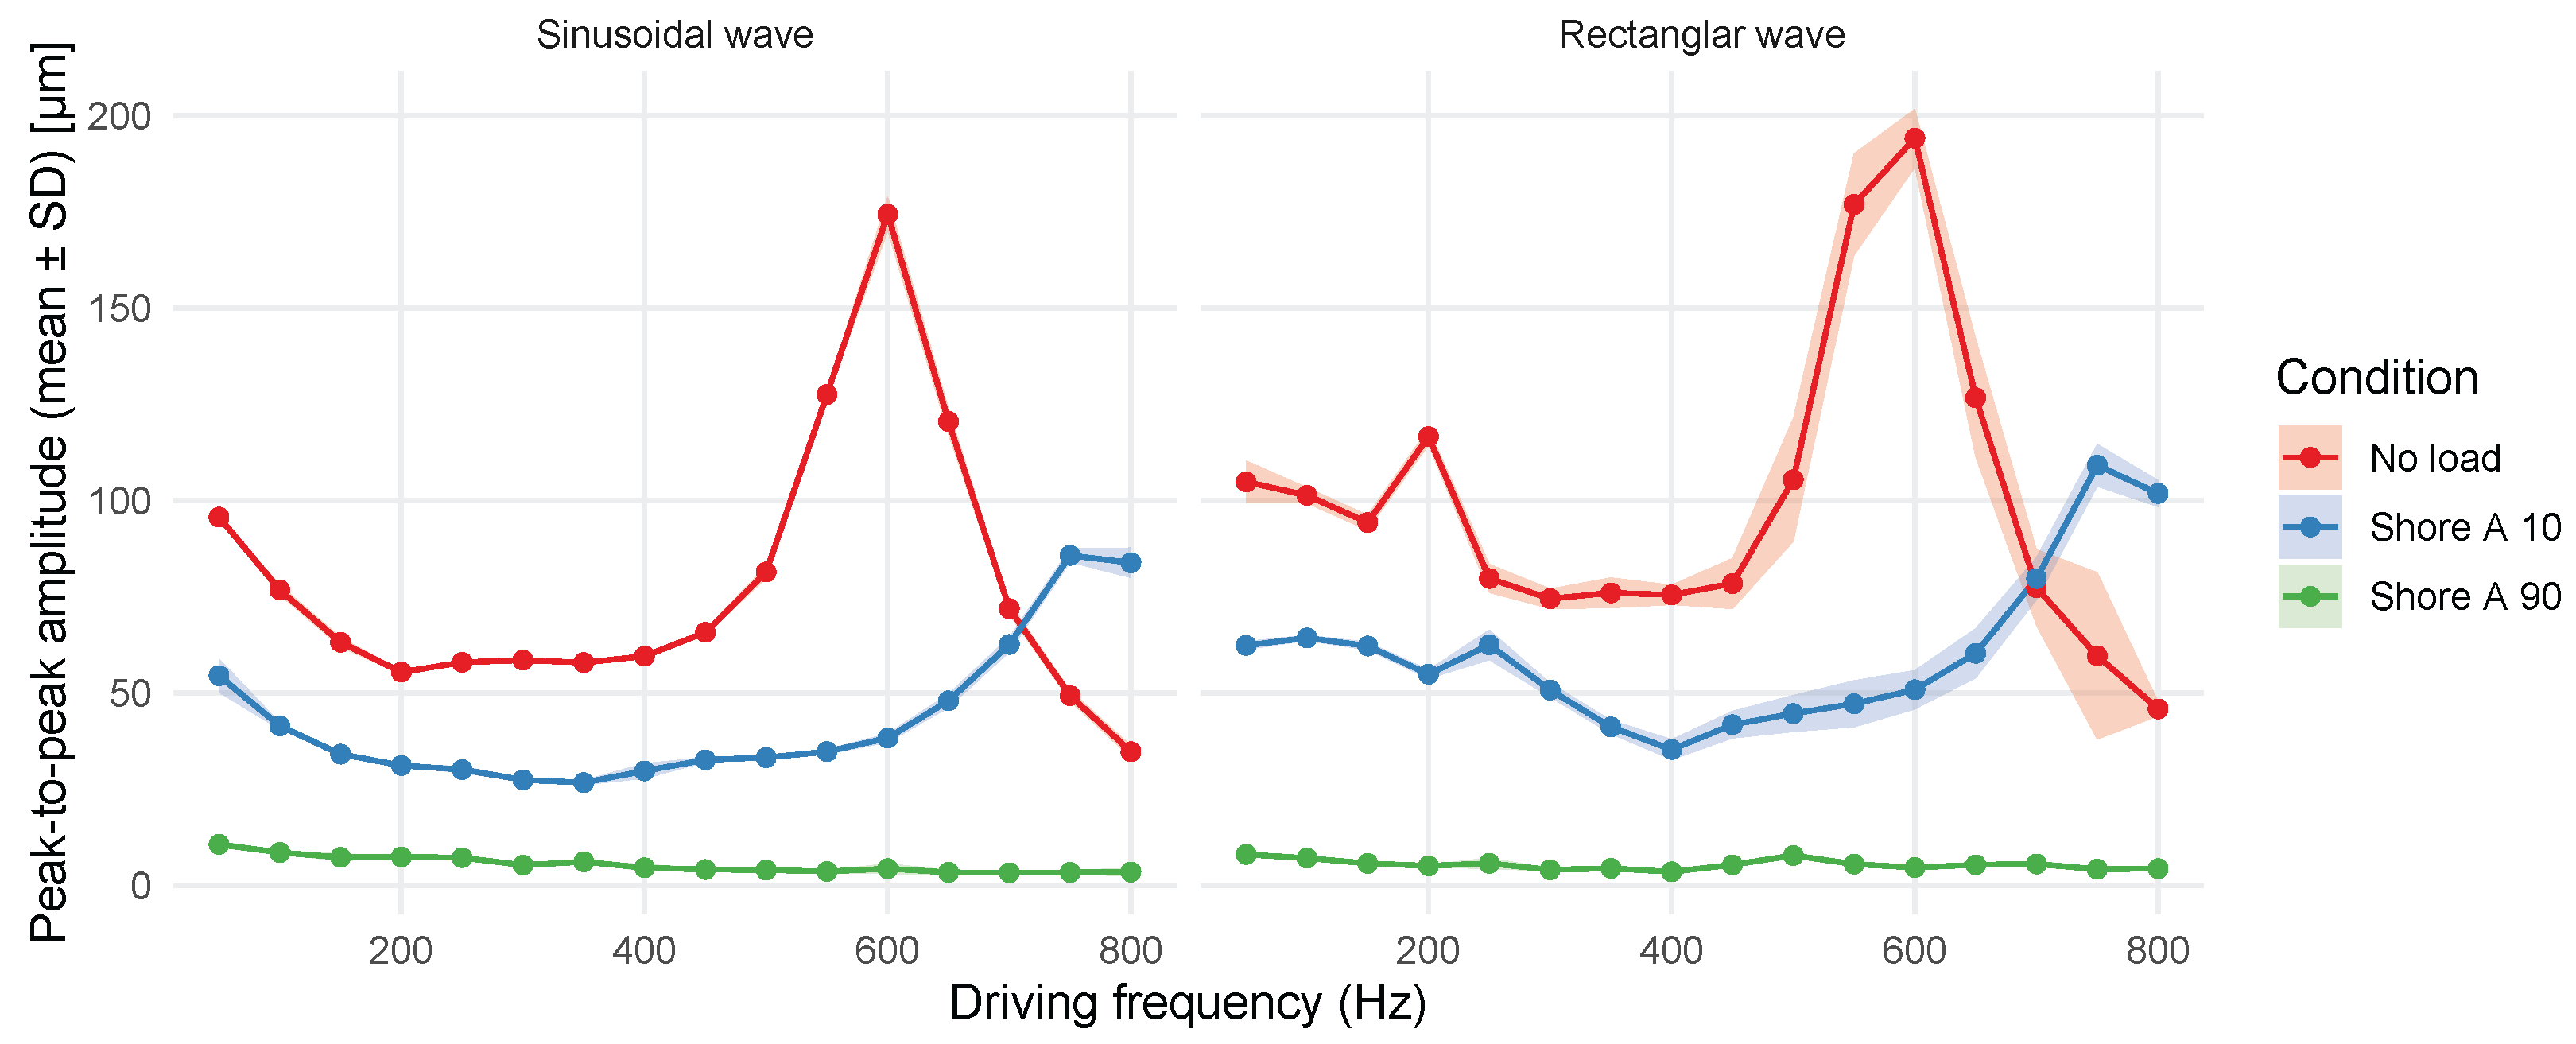
For each combination of pin, condition, waveform, and frequency, the mean and standard deviation (SD) of the winsorized p-p displacements were calculated. The within-trace SD therefore reflects the cycle-to-cycle variability of the rear-face displacement during the 2 s steady-state window. The mean and SD values reported for a representative pin (p35) are shown in Figure 7 as mean ± SD ribbons across the 16 driving frequencies, with conditions distinguished by color and waveforms by panel.

4.4. Simulation of Peripheral Afferent Responses

The measurements described above characterize the actuator’s mechanical output, but they do not, by themselves, identify which mechanoreceptor populations that output engages. Statements about receptor-specific stimulation therefore require either psychophysical measurement or an explicit forward model linking skin indentation to afferent activity. Because human validation was outside the scope of the present hardware characterization (Section 6.7.2), we adopted the second approach and passed the measured waveforms through two published models of the tactile periphery. Both models take skin indentation as input and were therefore driven directly by our recordings; neither contains free parameters fitted to our data, so the predictions below are forward predictions rather than fits.

4.4.1. Channel-Wise Detection-Threshold Margins

The first model is the classical four-channel account of vibrotactile sensation, in which detection across the 0.4–800 Hz range is mediated by the PC (Pacinian; FA-II/RA-II), NP-I (Meissner; FA-I/RA-I), NP-II (Ruffini; SA-II), and NP-III (Merkel; SA-I) channels, each with its own threshold–frequency characteristic [8,9,93].
We digitized the published threshold curves for the four channels and, for each combination of loading condition and driving frequency, compared the measured amplitude with each channel’s threshold. Because the published curves are expressed as peak displacement, the measured peak-to-peak values were halved before comparison. The margin above threshold was expressed in decibels as
M c ( f ) = 20 log 10 A peak ( f ) A th , c ( f ) ,
where A peak ( f ) is the measured peak amplitude at the driving frequency f and A th , c ( f ) is the detection threshold for channel c. A condition was counted as suprathreshold for channel c when M c ( f ) > 0 . The NP-III characteristic is published only below approximately 20–30 Hz and is therefore undefined across our 50–800 Hz measurement band; margins for that channel are reported as undefined rather than as zero, and no claim is made regarding NP-III engagement.

4.4.2. Spiking Model of the Peripheral Afferent Population

The threshold model predicts whether a stimulus is detectable but not how strongly the periphery responds once it is. For the latter, we used TouchSim [109], a simulation framework that converts a time-varying skin indentation profile into spike trains for populations of SA-I, FA-I/RA-I, and PC afferents and reproduces recorded afferent responses with millisecond precision. Firing rate in these populations has been shown to track judgements of perceived vibrotactile intensity [110], which makes it the natural intermediate variable between our mechanical measurements and the perceptual claims we wish to support.
Each measured trace was prepared for the model as follows. The DC offset of the laser reading was removed, and the trace was then shifted so that its minimum was zero, ensuring that the pin indents the skin between zero and the measured peak-to-peak excursion rather than withdrawing from contact during the negative half-cycle. This is the appropriate boundary condition for the loaded conditions, in which the pin remains in contact with the silicone under the 50 g preload throughout the cycle. Displacements were converted from micrometers to millimeters, and the pin was modeled as a circular contact of 0.5 mm radius placed at the center of the distal pad of the index finger on the hand surface model supplied with TouchSim.
Two afferent populations were used. For the per-condition firing rates reported in Section 5.5, we used the set of 17 single-fiber models distributed with TouchSim (4 SA-I, 9 FA-I/RA-I, and 4 PC (FA-II/RA-II)), which isolates the effect of the stimulus from that of receptor placement. For the spatial maps reported in Section 5.6, we used a physiologically dense population covering the distal pad of the index finger, comprising 956 fibers (283 SA-I, 571 FA-I/RA-I, and 102 PC) at innervation densities consistent with published estimates for glabrous skin [111,112]. Mean firing rate was computed as the spike count divided by the stimulus duration and averaged within each afferent class.

4.4.3. Simulated Multi-Pin Pattern Rendering

The measurements in Section 4.3 drive one pin at a time, whereas the module’s intended applications involve many pins acting together. We therefore simulated three representative multi-pin patterns on the 8 × 8 matrix: a static Braille cell rendered on a 2 × 3 block of pins at the array’s center; a vertical line swept horizontally across the array at 25 mm/s; and a spatial grating in which alternate columns were driven in phase. Each active pin replayed the waveform measured under Shore A 10 loading at the chosen driving frequency, so the simulated patterns inherit the real device’s amplitude and harmonic content rather than an idealized oscillation.
Simultaneous activation of neighboring pins attenuates each pin’s excursion, and we applied attenuation measured directly on the device rather than assuming independence: each active pin was scaled by the factor obtained from the co-activation measurements reported in Section 5, namely 0.92 when at most five pins were active and 1.05 for denser patterns (Section 5.3). Each pattern was simulated at a high driving frequency (250 Hz) and, for the Braille cell, additionally at a low driving frequency (50 Hz) to compare the receptor populations recruited in the two regimes.

4.4.4. Implementation

The simulation pipeline was implemented in Python 3.12 using TouchSim [109,113], NumPy [114], and SciPy [115]. Amplitude extraction for the simulation inputs used the magnitude of the spectral component at the driving frequency, isolating the fundamental and rejecting broadband sensor noise. Figures were produced in R 4.5.1 [107] using ggplot2 [116]. The analysis code and the derived tables underlying each figure are available from the authors upon request.

5. Results

Before conducting the main analysis, we characterized the module’s pin-to-pin variability. Because the piezoelectric stacks are layered, 16 of the 64 channels (PIN 24–39, the two central rows of the 8 × 8 array) were optically accessible to the laser sensor. All 16 were swept under no-load conditions from 50 to 800 Hz. At 400 Hz, the peak-to-peak amplitude across these 16 channels averaged 58.8 μ m (SD = 10.8 μ m; range 29.5–70.0 μ m; coefficient of variation ≈ 12.9%). The pin-to-pin variation primarily reflects unit-level differences in piezoelectric stack assembly and pin-mounting compliance, and shifts the absolute amplitude rather than the qualitative load- and frequency-dependent response shape. We therefore characterised one representative pin (p35, center of the pin matrix) in detail in the following sections, leaving full pin-by-pin amplitude calibration of the entire pin module for future work.
This section moves from the mechanical characterization of that pin to the perceptual predictions derived from it. We first compare the two driving waveforms, then trace the response across the silicone hardness series, then quantify coupling between adjacent pins, and finally use the measured waveforms to predict which mechanoreceptor populations the module engages.

5.1. Effect of Waveform

Figure 7 shows the mean and standard deviation of the peak-to-peak (p-p) displacement of one of the pins across the 16 driving frequencies (50–800 Hz in 50 Hz steps) under three loading conditions (no load, Shore A 10 silicone, and Shore A 90 silicone) and two driving waveforms (sinusoidal and rectangular). The means and SDs were computed from all consecutive p-p values extracted from the 2.0 s steady-state portion of each trace, corresponding to approximately 100–800 half-cycles per trace depending on the driving frequency.
The comparison in this subsection is drawn from the unloaded, Shore A 10, and Shore A 90 conditions, for which both sinusoidal and rectangular drives were recorded (Figure 7); the hardness series of Section 4.4.2 was measured under sinusoidal drive only. The rectangular-waveform results therefore apply to these three shared conditions and do not extend to the full hardness series.
For every combination of frequency and loading, the rectangular waveform produced higher p-p amplitudes than the sinusoidal waveform. At the no-load peak frequency of 600 Hz, the rectangular response (194.1 μ m) exceeded the sinusoidal response (179.0 μ m) by 8%. Under Shore A 10 loading at 750 Hz, the difference was larger, with rectangular driving producing a 25% greater amplitude (109.2 vs. 87.2 μ m). The rectangular waveform also showed proportionally greater trace-to-trace variability. Across the 50–800 Hz band, the within-trace coefficient of variation (CV = SD/mean) was typically 2–3% for sinusoidal driving and 4–7% for rectangular driving. Under sinusoidal driving, the CV remained below 5% of the mean across all conditions, indicating stable steady-state operation.
Critically, the two waveforms reached their maximum response at the same frequency across all tested loading conditions. The peak frequency is therefore determined by the mechanical properties of the loaded system rather than by the spectral content of the driving signal, and the effects of waveform and loading can be treated as separable within the sampled range. Accordingly, the remaining analyses use the sinusoidal drive, for which the complete hardness series is available.

5.2. Effect of Load Stiffness Across the Hardness Series

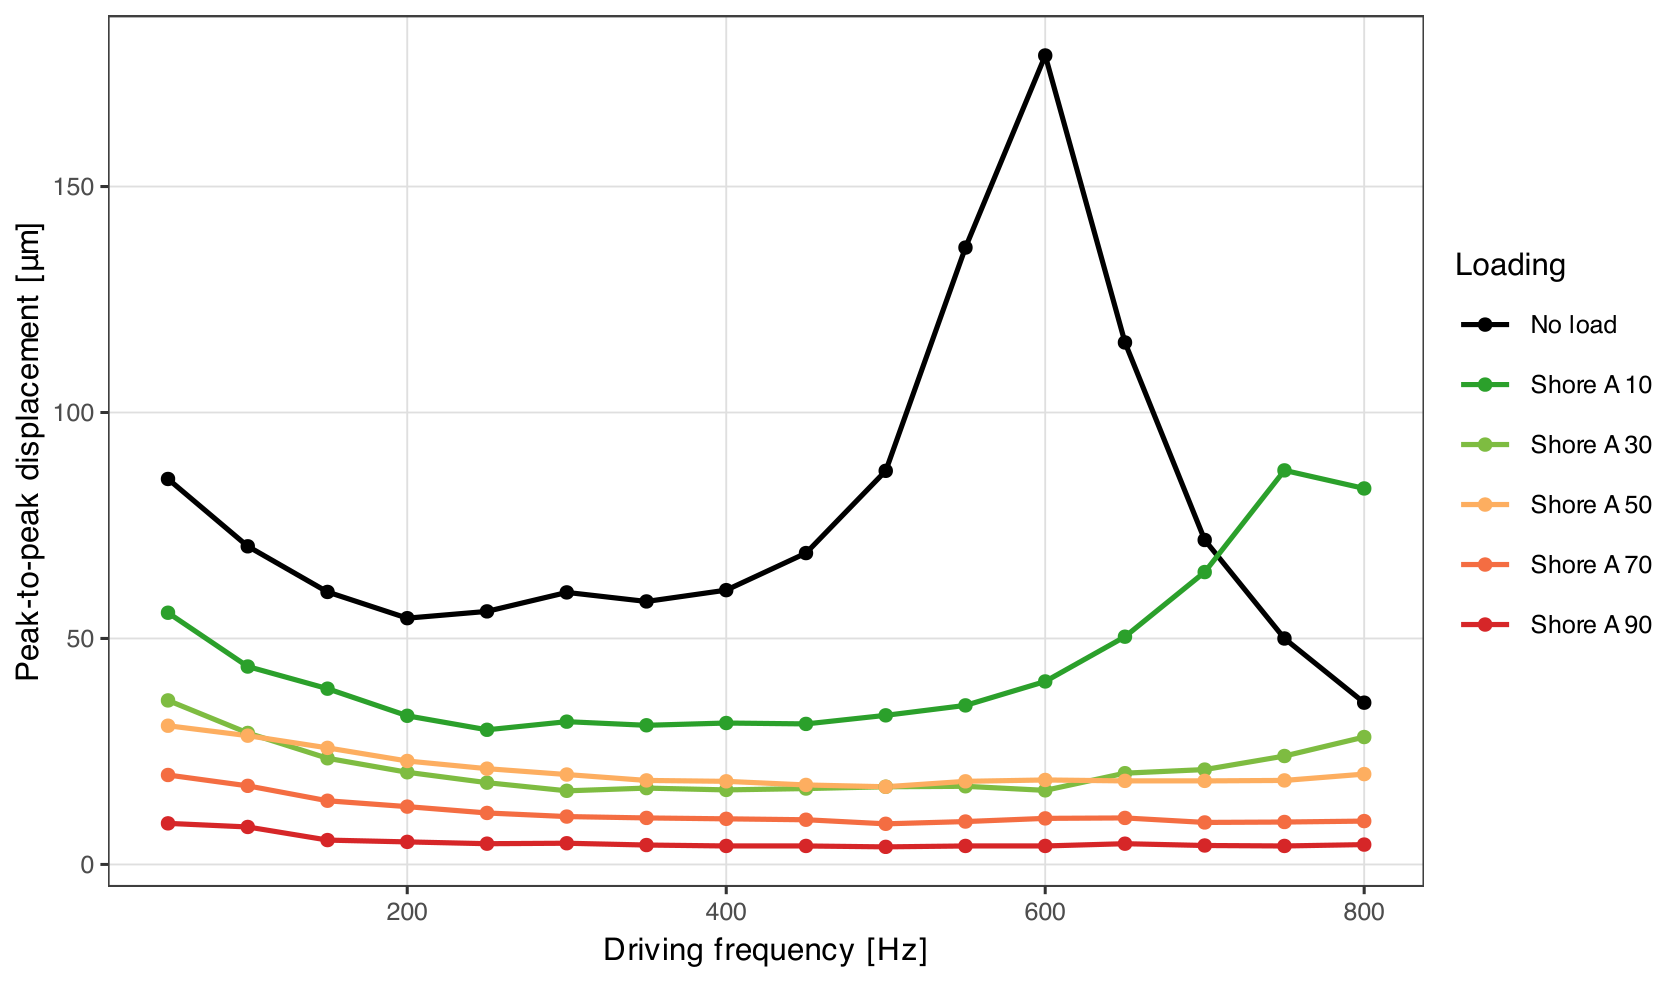
Figure 8 shows the sinusoidal response of the reference pin across the five silicone grades, along with the unloaded reference. Averaged over the 50–800 Hz band, the peak-to-peak displacement decreases monotonically with hardness, from 78.1 μ m unloaded to 45.0, 21.1, 20.8, 11.5, and 4.9 μ m for Shore A 10, 30, 50, 70, and 90, respectively, corresponding to 58, 27, 27, 15, and 6% of the unloaded mean. The same ordering, with no load > Shore A 10 > Shore A 30 ≈ Shore A 50 > Shore A 70 > Shore A 90, holds at and below 700 Hz indicating that increasing the mechanical impedance at the front face systematically attenuates the rear-face displacement measured by the laser sensor. Two exceptions are examined in turn: the inversion above 700 Hz and the near-equality of Shore A 30 and Shore A 50.
The magnitude of that attenuation is frequency-dependent and reverses at the top of the band. Under Shore A 10, the response retains 65% of the unloaded amplitude at 50 Hz but only 23% at the unloaded peak of 600 Hz. Above 700 Hz, the relationship inverts: at 750 Hz, the Shore A 10 amplitude exceeds the unloaded amplitude by a factor of 1.74, and at 800 Hz by a factor of 2.32. The crossover lies between 700 and 750 Hz. The stiffer grades show the same qualitative recovery at the top of the band but never exceed free air, reaching 79, 56, 27, and 12% of the unloaded amplitude at 800 Hz for Shore A 30, 50, 70, and 90. Under Shore A 90, the response remains between 2 and 12% of the unloaded amplitude across the entire band.
The location of the response peak shifts systematically with load. The unloaded pin falls from 85.3 μ m at 50 Hz to a broad minimum of 54.5 μ m near 200 Hz, then rises to a pronounced maximum of 179.0 μ m at 600 Hz before falling again. Under Shore A 10, the broad minimum shifts to 250–450 Hz, and the maximum shifts to 750 Hz (87.2 μ m). From Shore A 30 upward, no interior maximum appears within the band: these grades reach their largest amplitude at the bottom of the sweep, at 50 Hz. The behavior at the top of the band can be summarized by the ratio of the amplitude at 800 Hz to that at 400 Hz. Under Shore A 10, this ratio is well above unity (2.66), so the response is still climbing steeply toward a peak within the measured band. It remains above unity under Shore A 30 (1.71), placing that peak near the upper edge of the band. From Shore A 50 upward, it falls to approximately unity and stays there (1.09, 0.95, and 1.07 for Shore A 50, 70, and 90); as Figure 8 shows, the response of these grades above 400 Hz is essentially flat, with no resolvable peak in that range.
The series therefore divides into two regimes, with a transition between Shore A 30 and Shore A 50. Below the transition, a peak lies within or near the measured band; above it, the response over most of the band is small and nearly independent of frequency. Since the finger pad-like grades lie in the first regime and the near-rigid grades in the second, the behavior relevant to skin contact is that of Shore A 10–30, and the Shore A 70–90 measurements serve to locate the boundary rather than to model a finger. The mechanical origin of this transition and its relation to the amplification above 700 Hz are discussed in Section 6.2.
Two qualifications to the monotonic trend should be noted. The band-averaged amplitudes of Shore A 30 and Shore A 50 differ by only 0.3 μ m (21.1 versus 20.8 μ m), and at individual frequencies their ordering can reverse: at 400 Hz, the Shore A 50 amplitude (18.4 μ m) exceeds that of Shore A 30 (16.5 μ m). Shore A hardness is an indentation measure that maps only approximately to effective dynamic contact stiffness, so adjacent grades need not be strictly ordered by nominal hardness under dynamic loading.

5.3. Co-Activation of Neighboring Pins

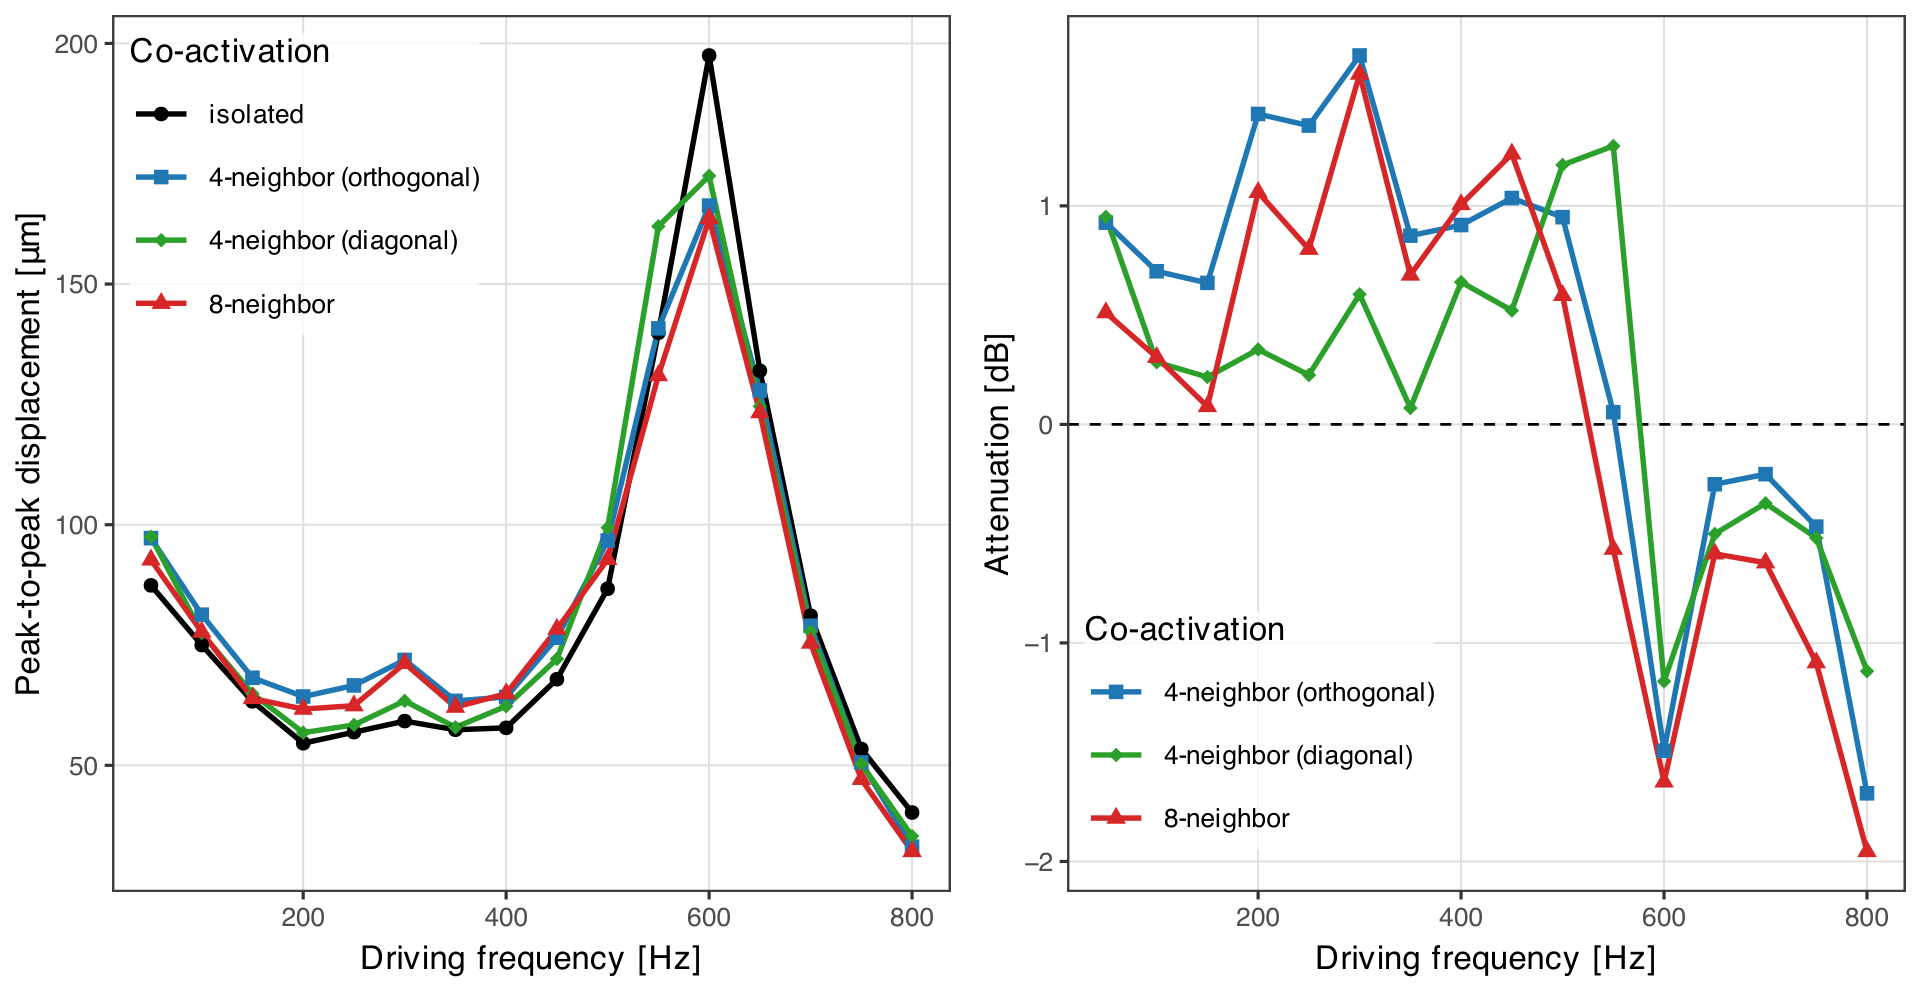
Because the intended applications drive many pins at once, we measured how the excursion of the reference pin changes when its neighbors are driven with the same signal. Four conditions were compared under no load: the pin driven in isolation; the pin together with its four orthogonal neighbors at a center-to-center distance of 2.00 mm; the pin together with its four diagonal neighbors at 2.83 mm; and the pin together with all eight surrounding pins. The isolated reference was recorded in the same session as the three co-activation conditions. The two four-neighbor patterns co-drive the same number of pins but differ in geometry and distance, so comparing them separates any dependence on the number of active pins from dependence on their positions.
Averaged over the 16 driving frequencies, the amplitude of the reference pin was 1.053 ± 0.115 times its isolated value with the four orthogonal neighbors active, 1.023 ± 0.086 with the four diagonal neighbors, and 1.017 ± 0.120 with all eight, that is, + 0.40 , + 0.17 , and + 0.09 dB. None of the three conditions departs from the isolated reference by a resolvable amount: the 95% confidence interval on the mean ratio is [ 0.997 , 1.110 ] , [ 0.981 , 1.064 ] , and [ 0.958 , 1.076 ] respectively, and every interval includes unity, although the orthogonal condition only just does so. The per-frequency scatter, of the order of 1 dB, is larger than any of the mean effects, and the ratios straddle unity across the band in all three conditions (Figure 9). All three point estimates lie slightly above unity, by 1.7 to 5.3%, but the ordering does not follow the number of active pins and no interval separates from the reference; Section 6.6 suggests why a small positive offset is expected here even in the absence of any change in output.
The two contrasts that the diagonal condition makes possible are correspondingly small, and both change sign across the band. At equal pin count, the diagonal pattern differs from the orthogonal one by − 0.24 dB on average, with frequency-by-frequency values ranging from − 1.14 to + 1.22 dB, so geometry produces no effect separable from the scatter. The measured eight-neighbor change differs from the sum of the two four-neighbor changes by − 0.48 dB on average, with a range of − 1.90 to + 1.03 dB, which is consistent with the two contributions superposing and with all three being zero.
The scatter is not, however, structureless. In all three conditions, the ratio is positive below approximately 550 Hz and negative at 600 Hz and above, so each condition crosses unity once, near the 600 Hz peak of the isolated pin. Interpolating the crossing yields 552 Hz for the orthogonal set, 576 Hz for the diagonal set, and 525 Hz with all eight neighbors active. The diagonal condition is the last to cross, and at 550 Hz, one frequency step below the peak, it is still + 1.27 dB, while the orthogonal set has fallen to + 0.06 dB and the eight-neighbor set is already negative. The ordering of the crossings is thus determined by the proximity and number of the co-driven pins rather than by chance.
The practical conclusion is that co-activation of adjacent pins has no effect on per-pin excursion that this measurement can resolve, and that any effect present is bounded at roughly 1 dB, or about 12% in amplitude, at the scale of a 3 × 3 block. Pins may therefore be treated as effectively independent when composing multi-pin patterns on an array of this pitch, which is the assumption underlying the simulations in Section 5.6. We return in Section 6.6 to what this bound permits and what it does not.

5.4. Channel-Wise Threshold Margins

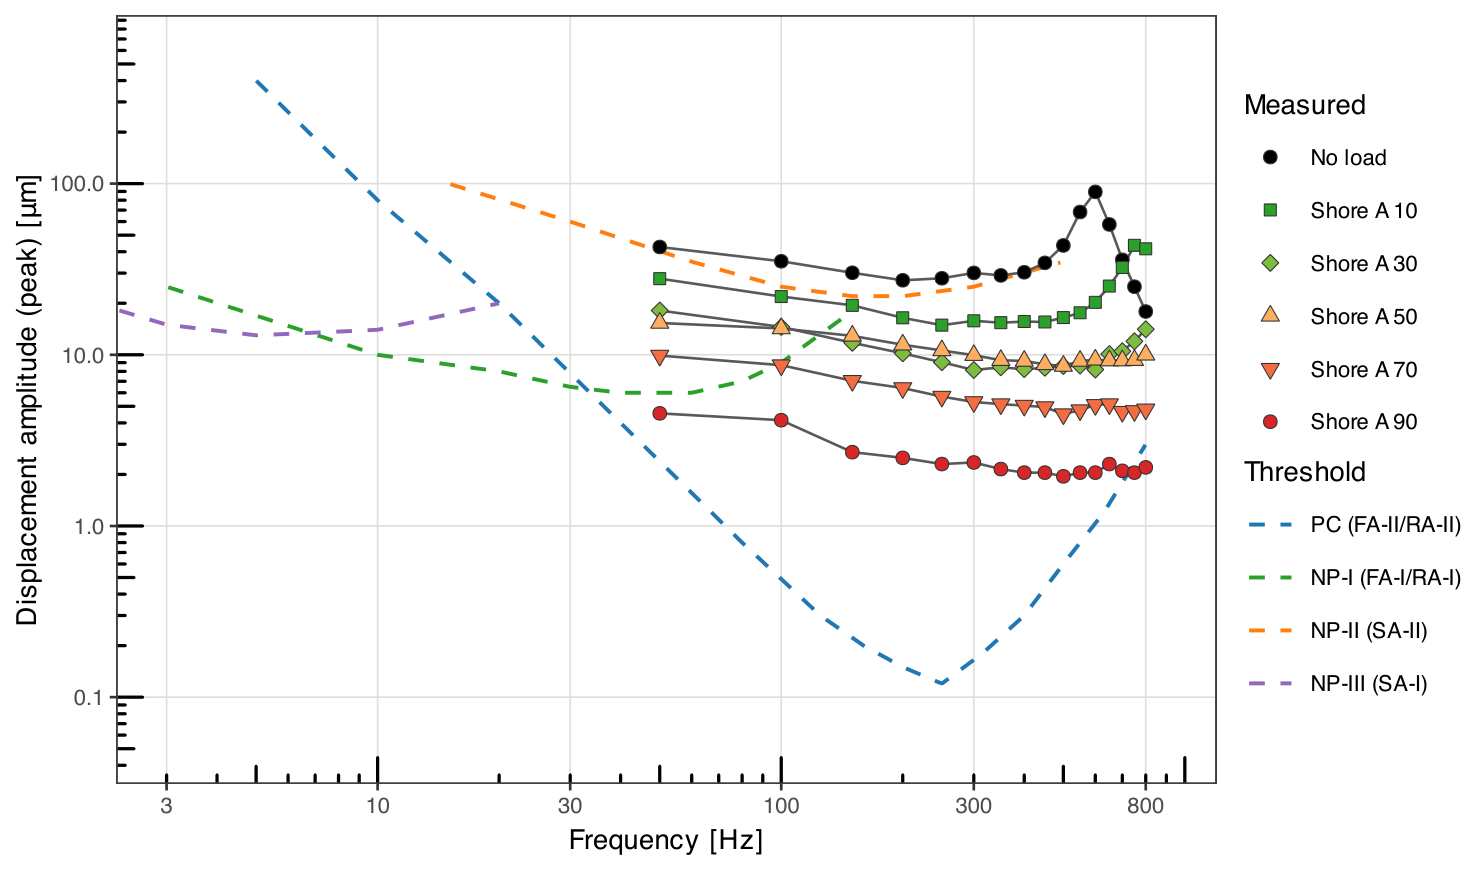
Before comparing the measured amplitudes with detection thresholds, it is useful to note the absolute output available in the perceptually relevant band, as shown in Figure 8. Within 50–400 Hz, which spans the principal sensitivity ranges of the FA-I/RA-I (Meissner, ∼5–50 Hz) and FA-II/RA-II (Pacinian, peak ∼200–300 Hz) channels [8,93], the unloaded actuator delivered 54.5–85.3 μ m p-p under sinusoidal driving. Under Shore A 10 loading, which approximates the compliance of soft finger pad tissue [100], this was reduced to 29.8–55.7 μ m, retaining roughly half to two-thirds of the unloaded amplitude; under the much stiffer Shore A 90 load, it fell to 4.1–9.1 μ m, five- to eightfold smaller than under Shore A 10 and illustrating the upper limit of impedance that the present pin geometry can drive effectively. All of these values remain well above the absolute detection threshold reported for the FA-II/RA-II channel, which is below 1 μ m near 250 Hz [8], so the module continued to deliver suprathreshold stimulation under finger-like loading throughout the perceptually relevant band.
Figure 10 compares the measured amplitudes with the detection thresholds of the four psychophysical channels. Across all combinations of loading condition and driving frequency, the PC (Pacinian) channel (FA-II/RA-II) was suprathreshold in 97.9% of conditions, with margins up to + 47.4 dB. The exceptions were confined to the stiffest loading condition at the extremes of the frequency band. By contrast, the NP-I (FA-I/RA-I) and NP-II (SA-II) channels were suprathreshold in only 11.5% and 10.4% of conditions, respectively, with maximum margins of + 17.0 dB and + 3.0 dB. In both cases, suprathreshold conditions were confined to the lowest driving frequencies under light or absent loading. The NP-III (SA-I) characteristic is not defined above approximately 30 Hz and therefore yields no margin anywhere in the measured band.
This tendency is a direct consequence of the shape of the threshold curves rather than any deficiency of the actuator. The PC channel is by far the most sensitive channel above approximately 40 Hz, with a threshold minimum below 1 μ m near 250 Hz, whereas the NP-I (FA-I/RA-I) and NP-II (SA-II) thresholds remain of the order of 10 μ m and 20 μ m, respectively, over the same range [8]. Within the 50–800 Hz band examined here, the module is therefore best described as a device that drives the PC channel with a large margin while touching the non-PC channels only at the low-frequency boundary of its operating range.

5.5. Predicted Afferent Firing Under the Measured Drive

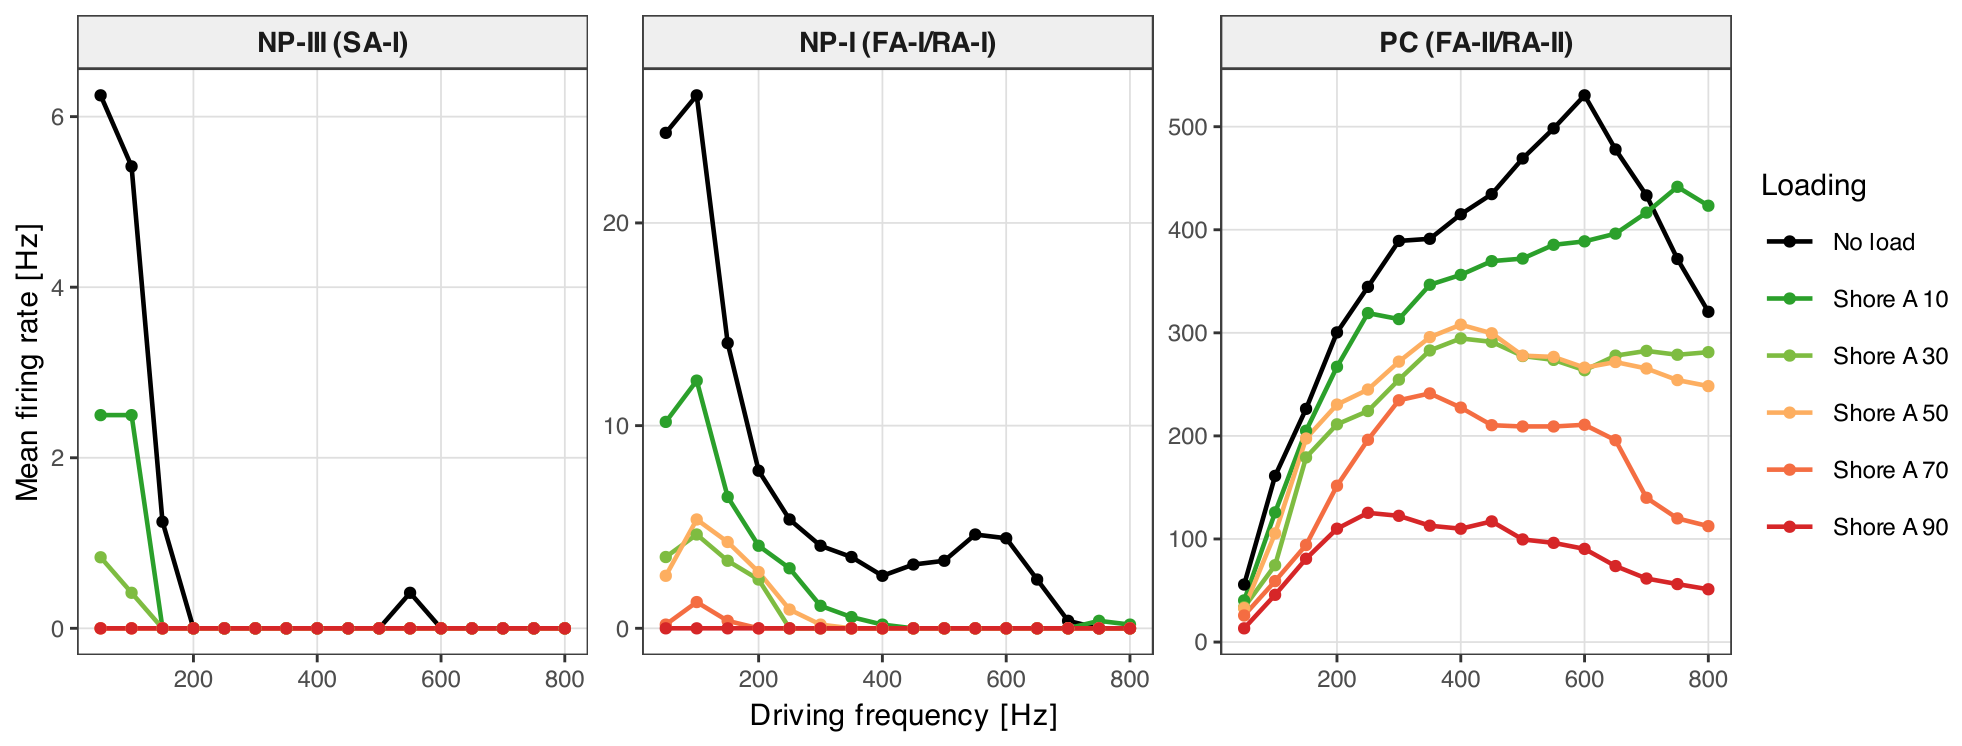
Figure 11 shows the mean firing rate predicted by TouchSim for each afferent class as a function of driving frequency and loading condition. TouchSim models the SA-I (Merkel; NP-III channel), FA-I/RA-I (Meissner; NP-I), and PC (Pacinian; FA-II/RA-II) populations, and does not include an SA-II (Ruffini; NP-II) model. Therefore, the NP-II channel is addressed only in the threshold analysis above. The predictions reproduce the qualitative structure of that analysis and add a graded intensity measure.
PC afferents responded vigorously across all conditions. Under no load, the predicted PC rate rose from 55.8 Hz at 50 Hz to a maximum of 530.0 Hz at 600 Hz, tracking the mechanical peak reported in Section 4.4.2. Under Shore A 10 loading, the range was 40.0–440.8 Hz, with the maximum shifted to 750 Hz, consistent with the upward shift of the loaded peak. Increasing the load stiffness compressed the response but did not extinguish it: the predicted PC rate spanned 33.3–294.2 Hz under Shore A 30, 32.5–308.3 Hz under Shore A 50, 25.8–240.8 Hz under Shore A 70, and 14.6–125.0 Hz under Shore A 90. Even in the near-rigid Shore A 90 condition, in which the rear-face displacement falls to a few micrometers, the model predicts sustained PC firing throughout the band.
FA-I/RA-I afferents responded only at the low-frequency end and weakly. The predicted FA-I/RA-I rate reached 26.3 Hz at 100 Hz under no load and 12.6 Hz under Shore A 10, but fell to zero above approximately 350 Hz in every condition and never exceeded 5.4 Hz under loads of Shore A 30 or stiffer. SA-I afferents were essentially silent, reaching 6.7 Hz at 50 Hz under no load and remaining at or near zero elsewhere. Two features of the stimulus account for this. First, the low-frequency shoulder of the mechanical response produces the largest excursions precisely where FA-I/RA-I sensitivity is highest. Second, the sustained sinusoidal drive used here contains no slow indentation ramp, which is the stimulus feature to which SA-I afferents are most responsive [7].
The ordering of predicted firing across loading conditions mirrors the ordering of the measured displacements, confirming that the receptor-level prediction provides information about which population is engaged rather than merely restating the mechanical measurement in different units.

5.6. Simulated Rendering of Multi-Pin Patterns

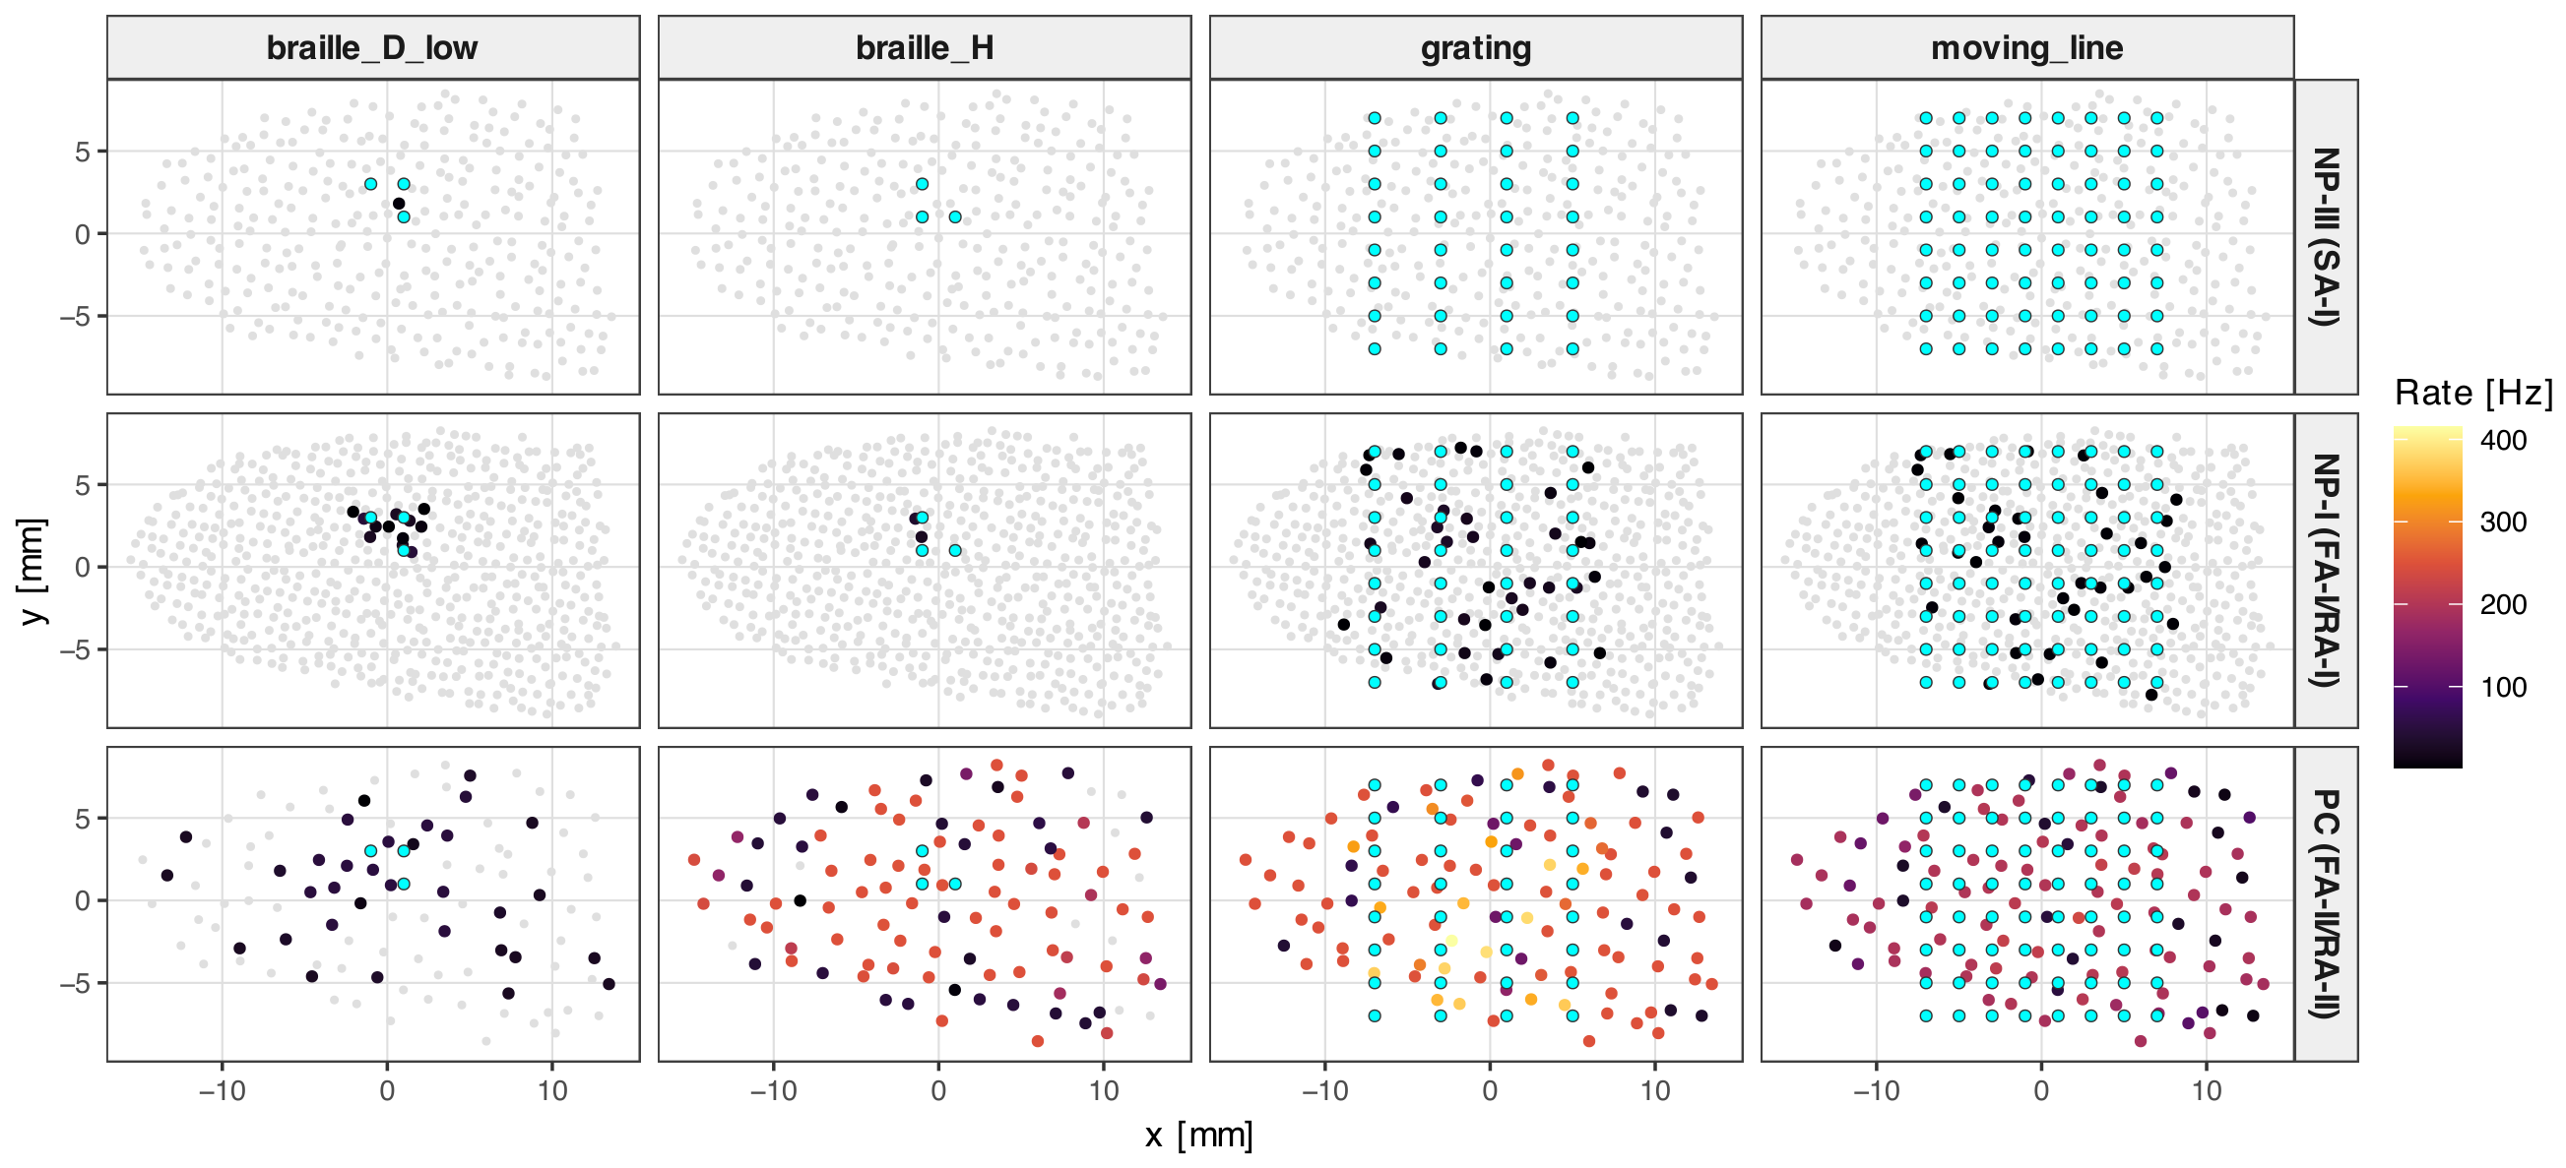
Figure 12 shows the predicted spatial distribution of afferent firing across the three multi-pin patterns. The static Braille cell driven at 250 Hz with a measured amplitude of 28 μ m peak-to-peak evoked 8471 spikes across the 956-fiber population during the 0.60 s presentation, with activity confined almost entirely to the PC population. Because PC receptive fields are large and the population integrates vibration transmitted through the tissue, the resulting activity was spatially diffuse: fibers well outside the footprint of the three active pins fired at rates comparable to those directly beneath them.
Driving the same Braille cell at 50 Hz produced a markedly different pattern. The total spike count fell to 712, but the remaining activity included FA-I fibers whose responses were confined to the immediate neighborhood of the driven pins. The moving line and the spatial grating, both driven at 250 Hz, evoked 9401 and 14,714 spikes, respectively; in neither case did the PC firing-rate map preserve the spatial structure of the driving pattern, whereas the sparse FA-I/RA-I activity did follow the driven pins.
Taken together, the three patterns indicate that driving frequency serves as a control not only over which receptor population is recruited but also over the spatial specificity of the resulting neural image. Rendering that relies on spatial pattern recognition is predicted to benefit from lower driving frequencies, despite the smaller neural response, whereas rendering that relies on salience or temporal structure is predicted to benefit from driving near the loaded peak.

6. Discussion

The measurements presented in Section 5 reveal three robust patterns. First, pin displacement amplitude decreases monotonically with load stiffness across the five silicone grades, with two documented exceptions: the near-equality of Shore A 30 and Shore A 50, and an inversion above 700 Hz, where the compliant load outperforms free air. Second, the response peak shifts upward with load, from 600 Hz unloaded to 750 Hz under Shore A 10, and disappears from within the measured band altogether from Shore A 30 upward. Third, rectangular driving yields an amplitude advantage of 8–25% over sinusoidal driving, accompanied by greater trace-to-trace variability. We discuss these patterns below, then turn to what the simulation of peripheral afferent responses (Section 4.4) adds to their interpretation, before considering their implications for the design of vibrotactile stimulation patterns and the limitations of the present study.

6.1. Coupled-System Mechanics Interpretation of the Peak Frequency Shift

The upward shift of the response peak with increasing silicone hardness can be understood using the standard lumped-element model of a piezoelectric bender driving an external load. The intrinsic resonance of the unloaded bimorph element is set by its effective mass and stiffness, ω 0 = k piezo / m piezo , with a design value of 1.2 kHz as reported in Section 3.2 [25,39,44]. Adding a silicone layer in front of the pin couples the bender to an external stiffness k L and mass m L , which depend on the silicone’s elastic modulus, contact area, and layer thickness; for a thin elastic layer of Young’s modulus E L pressed against a rigid pin, k L ∝ E L A / h , where A and h are the contact area and silicone thickness, respectively. The hardness series spans Young’s moduli of approximately 0.4, 1.1, 2.5, 5.5, and 20.8 MPa for Shore A 10 to 90, obtained from the Gent indentation relation generalized in the standardized Mix–Giacomin durometry treatment [99]. Thus, the added contact stiffness varies by roughly fifty to one across the series, whereas the added mass is comparable throughout because the specimens share thickness and density. The resulting loaded resonance,
ω loaded ≈ ( k piezo + k L ) / ( m piezo + m L ) ,
is therefore shifted progressively upward as the dominant effect of k L outweighs the modest increase in effective mass.
This stiffness-dominated shift directly accounts for the compliant end of the series: the rear-face response peaks at 600 Hz unloaded and at 750 Hz under Shore A 10, and under Shore A 30 the peak has moved to the upper edge of the measured band. From Shore A 50 upward, however, the interpretation is less direct. Equation (3) predicts a peak displaced beyond 800 Hz, and if that were the whole story, the response would still rise toward the top of the band. It does not: from Shore A 50, the response above 400 Hz is flat to within the resolution of the measurement. This flatness is the signature of a damping-controlled rather than a stiffness-controlled regime, and it is plausible that the stiffer silicones add dissipation as well as stiffness, broadening the resonance until it is no longer resolvable. The present data cannot distinguish a displaced resonance from a suppressed one and should note both possibilities rather than committing to either.
The low-frequency maximum observed at Shore A 30 and above could be not a load effect. The unloaded response also decreases from 85.3 μ m at 50 Hz to 54.5 μ m near 200 Hz, so a rise below approximately 150 Hz should be a property of the pin rather than of the silicone. What stiff loading does is remove the resonant peak that dominates the unloaded curve, leaving this intrinsic low-frequency shoulder as the largest amplitude in the sweep.
This observation also provides empirical support for the original design choice to place the unloaded resonance well above the perceptually relevant frequency band. If the unloaded resonance were lower, for example, in the 400–500 Hz range, loading by soft silicone or a finger pad would shift the loaded resonance below the 50–400 Hz vibrotactile band, reducing the actuator’s ability to drive Pacinian-mediated sensations [8,9,39].

6.2. Practical Consequences: Amplification Under Finger-like Loading

A counterintuitive feature of our results is that, above approximately 700 Hz, the Shore A 10 condition produced larger displacements than the unloaded condition. Under sinusoidal driving, the Shore A 10 amplitude exceeded the unloaded amplitude by factors of 1.74 at 750 Hz and 2.32 at 800 Hz, with the crossover occurring between 700 and 750 Hz. Rectangular driving showed the same crossover at the same frequencies. This amplification could reflect the loaded system’s resonance peak moving into this frequency range, whereas the no-load peak had already decayed beyond it.
The hardness series indicates that this behavior may be confined to the compliant end. Shore A 30 recovers toward the top of the band but reaches only 79% of the unloaded amplitude at 800 Hz, whereas the stiffer grades reach 56, 27, and 12%. The transition between the two regimes occurs between Shore A 30 and Shore A 50, so whether a given contact benefits from this amplification depends on where its impedance lies relative to that boundary. The mechanical impedance of the human finger pad, dominated by viscoelastic skin and underlying tissue, lies in the compliant rather than the stiff regime [47,48,97,100,102]. Therefore, under realistic finger contact, we expect the actuator to behave qualitatively like the Shore A 10 condition, exhibiting moderate broadband attenuation within the 50–400 Hz perceptual band and amplification above approximately 700 Hz.
An immediate practical consequence is that no-load characterization alone, the standard practice for piezoelectric actuators, systematically underestimates the device’s high-frequency drive capability under realistic operating conditions and could lead to overdriving when the device is subsequently tested with human users. Conversely, calibrating drive amplitudes using finger-loaded measurements rather than free-air measurements is essential to achieve uniform suprathreshold output across frequencies.

6.3. Mismatch with the Pacinian Peak and Design Implications

A second design-relevant observation is that the loaded response peaks at 750 Hz, well above the PC (Pacinian) channel’s peak sensitivity at 200–300 Hz [8,9,93]. In that most sensitive band, the Shore A 10 condition delivers 29.8–32.9 μ m peak-to-peak under sinusoidal driving, approximately one-third of the loaded peak amplitude. These levels remain far above the PC detection threshold, which is below 1 μ m near 250 Hz [8], but they are not optimal for producing large suprathreshold contrast at the most sensitive frequencies. Intensity coding through amplitude modulation therefore could have a lower dynamic range within the Pacinian-optimal band than at the loaded resonance peak.
Two design implications as follows: First, within its 50–800 Hz operating band, the module could be well suited to Pacinian-mediated stimulation, rather than to multichannel stimulation across all four psychophysical channels. As Section 5.4 shows, the PC channel is exceeded by a wide margin under every loading condition, including Shore A 90, whereas the NP-I and NP-II channels are reached only at the low-frequency boundary, and the NP-III threshold is rarely exceeded within the band. Engaging the non-Pacinian channels requires operating below 50 Hz rather than increasing available displacement, as discussed in Section 6.5. Second, if the goal is to maximize the suprathreshold dynamic range for Pacinian-mediated stimulation, future versions could lower the unloaded resonance from 1.2 kHz to approximately 600–800 Hz, shifting the loaded peak into the Pacinian-optimal 200–400 Hz band. Such a redesign would, however, reduce the available headroom under harder loading conditions, such as calloused fingers, contact through clothing, or thin gloves. It would also diminish the actuator’s ability to reproduce rapid transients whose spectral energy extends above the perceptual band but nonetheless contributes to perceived sharpness [31,105]. The present design therefore prioritizes operational robustness across loading conditions over sensitivity matching for a single receptor population.

6.4. Waveform: Amplitude–Variability Trade-Off

As shown in Figure 7, rectangular driving produced systematically larger amplitudes than sinusoidal driving but also exhibited two- to threefold greater trace-to-trace variability (CV approximately 4–7% versus 2–3%). The amplitude advantage is consistent with the broader Fourier spectrum of a square wave, which contains the fundamental frequency and all odd harmonics with amplitudes proportional to 4 / π , 4 / 3 π , 4 / 5 π , …. These additional harmonics excite mechanical modes beyond the fundamental frequency and increase the peak excursion of the rear face. The larger variability is consistent with the same harmonic content interacting with run-to-run fluctuations in the contact area, pre-load, and the high-frequency tail of the actuator’s frequency response, which are most pronounced near the sharp voltage transitions.
The implication for downstream applications is that the waveform choice should match application requirements. Sinusoidal driving is preferred for experimental and assistive applications that require precise repeatability, psychophysical threshold measurement, codebook-based information transfer, or pattern rendering for tactile graphics [15,35,105]. By contrast, for applications prioritizing raw salience or onset detectability over precision, such as alerting, gaming feedback, and attentional cues [89,91], rectangular driving can provide an additional 8–25% displacement gain at minimal additional hardware cost, at the expense of a few percent increase in run-to-run variability.

6.5. From Mechanical Output to Receptor-Level Prediction

Linking the measured waveforms to published models of the tactile periphery can enhance the insights derived from mechanical characterization. It could also correct an assumption that a purely mechanical interpretation of the data might have suggested.
A displacement amplitude that exceeds the lowest of the four channel thresholds is often described as suprathreshold without further qualification. Applied to the present data, that reasoning would suggest broad engagement of the mechanoreceptor populations, because the measured amplitudes exceed the PC channel threshold by up to 47 dB. However, the channel-wise analysis in Section 5.4 shows that this inference does not always hold: exceeding the lowest threshold means exceeding the PC channel threshold specifically, and over the 50–800 Hz band the NP-I and NP-II channels are reached only at the low-frequency boundary. Therefore, within its operating band, our module can stimulate the Pacinian channel solely.
This limitation is due to the operating band rather than the actuator. The NP-I and NP-II channels are most sensitive below approximately 50 Hz [8,93], that is, below the lower edge of the designed band. SA-I afferents respond primarily to sustained indentation and slow ramps rather than to steady vibration [7]. Engaging those populations requires extending the drive to lower frequencies and using non-sinusoidal envelopes, both of which the hardware supports, rather than increasing available displacement. For applications that depend on Pacinian-mediated sensation, which includes most vibrotactile alerting, texture, and event feedback, the present design has a large and comfortable margin: it retains predicted PC firing above 100 Hz even under Shore A 90 loading, when the rear-face displacement has fallen to a few micrometers.
The receptor-level view also sharpens the design implication drawn in Section 6.3. Mechanically, the loaded peak at 750 Hz sits well above the Pacinian sensitivity peak at 200–300 Hz, and the mechanical data alone suggest that this mismatch wastes available output. The predicted firing rates show that the cost is smaller than the displacement ratio implies, because the PC rate saturates well below the mechanical maximum: under Shore A 10 loading, the predicted rate at 250 Hz is already 72% of the rate at the loaded peak, even though the displacement is only about one-third of the peak value. This compressive rate–intensity behavior is characteristic of the PC population [110], and it means that a redesign lowering the unloaded resonance would buy less perceptual dynamic range than a purely mechanical argument would predict, while incurring the robustness costs already noted.
Finally, the multi-pin simulations in Section 5.6 could identify a trade-off that single-pin characterization cannot reveal. Driving near the loaded peak could maximize the neural response but produces a spatially diffuse PC image in which the geometry of the driven pattern is largely lost, because vibration at these frequencies propagates well through the tissue and PC receptive fields are correspondingly large [117,118]. Driving at 50 Hz produces a far weaker response that nevertheless retains the spatial layout of the driven pins in the FA-I/RA-I population. For a pin-matrix display intended to render tactile graphics or Braille, where spatial pattern is the information-bearing dimension, this argues for operating below the peak rather than at it and suggests that the 2 mm array pitch is better matched to low-frequency than to high-frequency rendering. We regard this as the most actionable outcome of the simulation and as a hypothesis that the psychophysical work described below should test first.

6.6. Coupling Between Adjacent Pins and Its Bound

Multi-pin rendering generally assumes that driving one pin does not change what its neighbors do. Section 5.3 also finds no remarkable violation the experiment can resolve: driving the eight surrounding pins changes per-pin excursion by less than about 1 dB, roughly 12% in amplitude, at a 2 mm pitch. This bound lies within the range over which the pins themselves vary (Section 5), so manufacturing variation rather than coupling dominates the amplitude error of a rendered pattern.
Neither the supply sag across capacitive elements (Section 4.2) nor the reaction against the shared mount is expected to be significant. Neither the diagonal contrast ( − 0.24 dB) nor the superposition residual ( − 0.48 dB) provides discrimination, as both are negligible. The only notable feature is that all ratios cross unity near the 600 Hz peak, indicating a displaced peak rather than a change in amplitude. The estimated downward shifts are 48 ± 16 , 24 ± 10 , and 75 ± 22 Hz for the orthogonal, diagonal, and eight-neighbor conditions. The near ring shifts approximately twice as much as the far ring, and the two roughly sum (75 versus 72 Hz), consistent with each neighbor adding effective mass or compliance to the mount. Since the sign reverses across the peak, this also explains why the ratios average to zero. The method recovers about half of a known synthetic shift, indicating these are lower bounds.
A bound on device-level coupling cannot be a bound on the independence of stimuli reaching the receptors. Vibration applied at one point travels at least the length of the finger, decaying least near 250 Hz, where Pacinian sensitivity peaks [117], and complex waveforms survive several centimeters [119,120]; tactor arrays require spacings of tens of millimeters before the locus of stimulation can be encoded reliably [121]. Our 2 mm pitch is more than an order of magnitude finer, and Section 5.6 shows the consequence: at 250 Hz, the predicted PC image retains little of the driven geometry. Mechanical independence at the actuator is therefore necessary but not sufficient. It remains useful: the device adds no coupling beyond what the skin imposes, so any loss of spatial specificity belongs to tissue transmission and is addressed by lowering the driving frequency (Section 6.5).
The bound applies only to the 3 × 3 block tested and to a single session per condition. Driving the neighbors in antiphase would separate the two mechanisms with a firmware change alone, and a sweep in 5–10 Hz steps across the peak would directly measure the shifts.

6.7. Limitations

6.7.1. Measurement of Tactile Display Module

The present study has several limitations. First, the silicone loads tested here were flat, uniform layers, whereas the human finger pad is a three-dimensional, layered, viscoelastic structure with anisotropic stiffness [47,97,102]. Although the five-grade series brackets the effective static stiffness of finger pad tissue and locates the boundary between the compliant and stiff regimes, no grade reproduces the frequency-dependent dispersion of the real finger pad impedance, which exhibits a transition from predominantly elastic behavior below approximately 100 Hz to increasingly viscous behavior above 200 Hz [47,48].
Second, the rear-face displacement reported here is a useful proxy for the actuator’s mechanical output but is not identical to the front-face displacement delivered to the skin. Under heavy loading, some rear-face motion is converted into elastic deformation within the silicone rather than into bulk displacement of the silicone surface. Future work should therefore complement these rear-face measurements with direct measurements of the front-face surface displacement, for example, by laser Doppler vibrometry on the silicone surface, as in [117,119].
Third, the detailed characterization was performed on a single representative pin (p35), and the pin-to-pin variability reported in Section 5 covers only the 16 optically accessible channels rather than the full 64-channel matrix; the interaction between pin-to-pin variability and the loading conditions is left to future work.
Fourth, our analysis used only the steady-state portion of each trace; transient onset and offset dynamics, which are perceptually salient [31,105], were not analyzed.
Finally, we did not perform human psychophysical validation; the forward models used in its place, and their limitations, are discussed in Section 6.7.2. Individual differences in finger pad mechanics may in addition shift the actual loaded resonance by several tens of hertz [47,102].

6.7.2. Simulation of Tactile Perception

The models used here were fitted by their original authors to neurophysiological recordings and contain no parameters tuned to our data, which is a strength but also limits what they establish. First, a forward model of the periphery is not a substitute for psychophysics: TouchSim predicts afferent spike trains, and the four-channel model predicts detectability, but neither predicts what a person will report, since perceived intensity, discriminability, comfort, and pattern identification depend on central processing that the models do not represent.
Second, the models take skin indentation as input, whereas we supplied rear-face displacement, so the predicted rates under the stiffer loads are upper bounds (Section 6.7.1). TouchSim also represents the skin as a homogeneous elastic medium and models neither the interposed silicone nor the preload, so it captures how the measured waveform acts on the periphery but not how the interface shapes that waveform. Continuum models of skin mechanics [117,118] and finite-element treatments of Pacinian transduction [94] would relax this assumption.
Third, the digitized four-channel thresholds approximate published curves measured under contactor and surround conditions that differ from ours, and individual variation is substantial. The margins in Section 5.4 are therefore orders of magnitude rather than calibrated values; the separation between the Pacinian and non-Pacinian channels, spanning tens of decibels, is far more robust than any individual margin.
Psychophysical validation under direct fingertip contact is therefore the natural next step, and the simulations identify the comparison it should begin with: spatial pattern identification at a low driving frequency against the same pattern rendered at the loaded peak.

7. Conclusions

We developed Tactule, a compact tactile display module that combines a 6 × 6 matrix of multilayer-bimorph piezoelectric pins (with the four corner pins removed, yielding 32 channels at 2 mm pitch) with an FPGA-based driver operating from a standard USB 5 V supply. An additional 8 × 8 variant providing 64 channels at 1 mm pitch was also developed. We characterized the device’s rear-face frequency response using a single representative pin across the 50–800 Hz range, under sinusoidal drive for five silicone grades from Shore A 10 to Shore A 90, together with an unloaded reference, and under both sinusoidal and rectangular drive for the unloaded, Shore A 10, and Shore A 90 conditions. The main findings are as follows:
  • The multilayer-bimorph pin delivers more than 60 μ m of free displacement at AC 5 V and produces output that is suprathreshold for the Pacinian channel by a wide margin throughout the 50–800 Hz band, even under stiff-contact (Shore A 90) loading. Coupling the measured waveforms to published models of the tactile periphery shows that within this band, the non-Pacinian channels are reached only at the low-frequency boundary, so engaging them requires extending the drive below 50 Hz rather than increasing displacement.
  • Rectangular driving produced 8–25% larger peak-to-peak amplitudes than sinusoidal driving at the same fundamental frequency, but it also showed two- to threefold greater cycle-to-cycle variability (CV approximately 4–7% vs. 2–3%). Waveform selection should therefore be matched to whether amplitude salience or trial-to-trial repeatability is the primary requirement of a given application.
  • The rear-face response peak shifts upward with increasing load impedance, from 600 Hz unloaded to 750 Hz under Shore A 10; at Shore A 30, no interior peak remains within the measured band. Additionally, from Shore A 50 onward, the response above 400 Hz remains essentially flat. The series divides into two regimes, with a transition between Shore A 30 and Shore A 50. The behavior relevant to skin contact is that of the compliant grades. Above approximately 700 Hz, the Shore A 10 condition yields larger amplitudes than the no-load condition. No-load characterization systematically underestimates the device’s high-frequency drive capacity under realistic finger contact. Therefore, finger-loaded calibration is necessary to achieve consistent suprathreshold output.
  • Among the 16 optically accessible channels, the 400 Hz amplitude showed a coefficient of variation of approximately 13%, which is minor compared to variations due to loading conditions and driving frequency. This supports using a single pin for detailed analysis, although full pin-by-pin calibration remains necessary.
  • Driving the eight neighbors of a pin changed its excursion by less than approximately 1 dB. This indicates that pins can be considered effectively independent when constructing multi-pin patterns at this pitch. The spatial limitation results from skin transmission, not hardware.
  • Simulated multi-pin rendering indicates that the driving frequency determines both which receptor population is activated and the spatial detail of the neural image. Operating near the peak response maximizes the response but produces a diffuse Pacinian image, while driving at 50 Hz maintains the pattern’s geometry in the rapidly adapting population. Therefore, tactile graphics displays should be operated below the peak response.
Future research should include direct front-face displacement measurements of silicone, such as laser Doppler vibrometry, and human psychophysical validation with fingertip contact. The simulations described here identify spatial pattern recognition at a low driving frequency, compared with the same pattern at the loaded peak, and should serve as a starting point for further studies. The analysis should also examine onset and offset transients, which influence perceived sharpness. A logical extension is closed-loop driving, which compensates in real time for load-induced shifts in the response peak, enabling consistent perceptual stimulation across different users and contact conditions.

Author Contributions

Conceptualization, T.M., K.-i.Y., A.K. and T.I.; methodology, T.M., K.-i.Y., K.Y. and M.S.; validation, T.M.; formal analysis, T.M. and K.-i.Y.; investigation, T.M., K.-i.Y., M.M., N.O. and T.I.; resources, K.-i.Y., A.K. and T.I.; data curation, T.M.; writing—original draft, T.M. and K.-i.Y.; writing—review and editing, A.K., M.M., N.O., K.-i.Y., M.S. and T.I.; visualization, T.M. and K.-i.Y.; supervision, M.S. and T.I.; project administration, T.M., M.S. and T.I.; funding acquisition, T.M., M.M., M.S. and T.I. All authors have read and agreed to the published version of the manuscript.

Funding

This research was funded by JSPS KAKENHI grant numbers JP20H04561, JP23K16919, JP23K25693, and JP24K22314, and JST FOREST grant number JPMJFR234Y.

Data Availability Statement

The data in this article are available from the corresponding author upon reasonable request.

Conflicts of Interest

T.M., K.Yabu, M.M., N.O., K.Yasu, M.S, and T.I. declare no conflicts of interest. A.K. is the president of Push-Pop Co., Ltd.

References

  1. Gibson, J.J. Observations on active touch. Psychol. Rev. 1962, 69, 477. [Google Scholar] [CrossRef] [Scilit] [PubMed]
  2. Dargahi, J.; Najarian, S. Human tactile perception as a standard for artificial tactile sensing—A review. Int. J. Med. Robot. Comput. Assist. Surg. 2004, 1, 23–35. [Google Scholar] [CrossRef] [Scilit] [PubMed]
  3. Matthews, P. Receptors in muscles and joints. In The Peripheral Nervous System; Springer: Berlin/Heidelberg, Germany, 1974; pp. 421–453. [Google Scholar]
  4. Iggo, A. Cutaneous receptors. In The Peripheral Nervous System; Springer: Berlin/Heidelberg, Germany, 1974; pp. 347–404. [Google Scholar]
  5. McGlone, F.; Reilly, D. The cutaneous sensory system. Neurosci. Biobehav. Rev. 2010, 34, 148–159. [Google Scholar] [CrossRef] [Scilit] [PubMed]
  6. Abraira, V.E.; Ginty, D.D. The sensory neurons of touch. Neuron 2013, 79, 618–639. [Google Scholar] [CrossRef] [Scilit] [PubMed]
  7. Johnson, K.O. The roles and functions of cutaneous mechanoreceptors. Curr. Opin. Neurobiol. 2001, 11, 455–461. [Google Scholar] [CrossRef] [Scilit] [PubMed]
  8. Bolanowski, S.J., Jr.; Gescheider, G.A.; Verrillo, R.T.; Checkosky, C.M. Four channels mediate the mechanical aspects of touch. J. Acoust. Soc. Am. 1988, 84, 1680–1694. [Google Scholar] [CrossRef] [Scilit] [PubMed]
  9. Verrillo, R.T. Vibration sensation in humans. Music. Percept. 1992, 9, 281–302. [Google Scholar] [CrossRef] [Scilit]
  10. Chouvardas, V.G.; Miliou, A.N.; Hatalis, M.K. Tactile displays: Overview and recent advances. Displays 2008, 29, 185–194. [Google Scholar] [CrossRef] [Scilit]
  11. Jones, L.A.; Sarter, N.B. Tactile displays: Guidance for their design and application. Hum. Factors 2008, 50, 90–111. [Google Scholar] [CrossRef] [Scilit] [PubMed]
  12. Visell, Y. Tactile sensory substitution: Models for enaction in HCI. Interact. Comput. 2009, 21, 38–53. [Google Scholar] [CrossRef] [Scilit]
  13. Shimonomura, K. Tactile image sensors employing camera: A review. Sensors 2019, 19, 3933. [Google Scholar] [CrossRef] [Scilit] [PubMed]
  14. Culbertson, H.; Schorr, S.B.; Okamura, A.M. Haptics: The present and future of artificial touch sensation. Annu. Rev. Control. Robot. Auton. Syst. 2018, 1, 385–409. [Google Scholar] [CrossRef] [Scilit]
  15. Vidal-Verdú, F.; Hafez, M. Graphical tactile displays for visually-impaired people. IEEE Trans. Neural Syst. Rehabil. Eng. 2007, 15, 119–130. [Google Scholar] [CrossRef] [Scilit] [PubMed]
  16. Ifukube, T. Sound-Based Assistive Technology; Springer: Cham, Switzerland, 2017. [Google Scholar]
  17. Miura, T.; Yabu, K.i. Narrative review of assistive technologies and sensory substitution in people with visual and hearing impairment. Psychologia 2023, 65, 70–99. [Google Scholar] [CrossRef] [Scilit]
  18. Yang, W.; Huang, J.; Wang, R.; Zhang, W.; Liu, H.; Xiao, J. A survey on tactile displays for visually impaired people. IEEE Trans. Haptics 2021, 14, 712–721. [Google Scholar] [CrossRef] [Scilit] [PubMed]
  19. Ponchillia, P.E.; Ponchillia, S.K.V. Foundations of Rehabilitation Teaching with Persons Who Are Blind or Visually Impaired; American Foundation for the Blind: Arlington, VA, USA, 1996. [Google Scholar]
  20. Hakobyan, L.; Lumsden, J.; O’Sullivan, D.; Bartlett, H. Mobile assistive technologies for the visually impaired. Surv. Ophthalmol. 2013, 58, 513–528. [Google Scholar] [CrossRef] [Scilit] [PubMed]
  21. Hersh, M.A.; Johnson, M.A. Assistive Technology for Visually Impaired and Blind People; Springer: London, UK, 2008. [Google Scholar]
  22. Bhagotra, S.; Sharma, A.K.; Raina, B. Psycho-social adjustments and rehabilitation of the blind. Soc. Med. 2008, 10, 48–52. [Google Scholar]
  23. Tuttle, D.W.; Tuttle, N.R. Self-Esteem and Adjusting with Blindness: The Process of Responding to Life’s Demands; Charles C Thomas Publisher: Springfield, IL, USA, 2004. [Google Scholar]
  24. Goldish, L.H.; Taylor, H.E. The optacon: A valuable device for blind persons. J. Vis. Impair. Blind. 1974, 68, 49–56. [Google Scholar] [CrossRef] [Scilit]
  25. Wada, C.; Shoji, H.; Ifukube, T. Development and evaluation of a tactile display for a tactile vocoder. Technol. Disabil. 1999, 11, 151–159. [Google Scholar] [CrossRef] [Scilit]
  26. Asakawa, C.; Takagi, H.; Ino, S.; Ifukube, T. TAJODA: Proposed tactile and jog dial interface for the blind. IEICE TRANS. Inf. Syst. 2004, 87, 1405–1414. [Google Scholar]
  27. Yabu, K.i.; Sakajiri, M.; Onishi, J.; Ifukube, T. Evaluation pattern editing tool for visually impaired students: Developing application software for wearable haptic tactile interface. NTUT Educ. Disabil. 2016, 14, 7–12. [Google Scholar]
  28. Yabu, K.; Sakajiri, M. Development of a wearable haptic tactile interface as an aid for the hearing and/or visually impaired. NTUT Educ. Disabil. 2015, 13, 5–12. [Google Scholar]
  29. Russomanno, A.; O’Modhrain, S.; Gillespie, R.B.; Rodger, M.W.M. Refreshing refreshable braille displays. IEEE Trans. Haptics 2015, 8, 287–297. [Google Scholar] [CrossRef] [Scilit] [PubMed]
  30. Rowell, J.; Ungar, S. The World of Touch: An International Survey of Tactile Maps; The British Journal of Visual Impairment: London, UK, 2003. [Google Scholar]
  31. Choi, S.; Kuchenbecker, K.J. Vibrotactile display: Perception, technology, and applications. Proc. IEEE 2013, 101, 2093–2104. [Google Scholar] [CrossRef] [Scilit]
  32. Seo, J.; Choi, S. Perceptual analysis of vibrotactile flows on a mobile device. IEEE Trans. Haptics 2013, 6, 522–527. [Google Scholar] [CrossRef] [Scilit] [PubMed]
  33. Johnson, K.O.; Phillips, J.R. Tactile spatial resolution. I. Two-point discrimination, gap detection, grating resolution, and letter recognition. J. Neurophysiol. 1981, 46, 1177–1192. [Google Scholar] [CrossRef] [Scilit] [PubMed]
  34. Van Boven, R.W.; Johnson, K.O. The limit of tactile spatial resolution in humans: Grating orientation discrimination at the lip, tongue, and finger. Neurology 1994, 44, 2361–2366. [Google Scholar] [CrossRef] [Scilit] [PubMed]
  35. Kaczmarek, K.A.; Webster, J.G.; Bach-y Rita, P.; Tompkins, W.J. Electrotactile and vibrotactile displays for sensory substitution systems. IEEE Trans. Biomed. Eng. 1991, 38, 1–16. [Google Scholar] [CrossRef] [Scilit] [PubMed]
  36. Benali-Khoudja, M.; Hafez, M.; Alexère, J.M.; Kheddar, A. Tactile interfaces: A state-of-the-art survey. In Proceedings of the International Symposium on Robotics (ISR 2003), Chicago, IL, USA, 2–5 June 2003; pp. 721–726. [Google Scholar]
  37. Velázquez, R. Wearable assistive devices for the blind. Wearable Auton. Biomed. Devices Syst. Smart Environ. 2010, 75, 331–349. [Google Scholar] [CrossRef] [Scilit]
  38. Leithinger, D.; Ishii, H. Relief: A scalable actuated shape display. In Proceedings of the Proceedings of TEI ’10, Cambridge, MA, USA, 24–27 January 2010; pp. 221–222. [Google Scholar] [CrossRef] [Scilit]
  39. Homma, T.; Ino, S.; Izumi, T.; Kuroki, H.; Ifukube, T. Measurement of mechanical characteristics of a fingerpad surface in the design of a tactile display. J. Robot. Mechatron. 2003, 15, 153–163. [Google Scholar] [CrossRef] [Scilit]
  40. Matysek, M.; Lotz, P.; Winterstein, T.; Schlaak, H.F. Dielectric elastomer actuators for tactile displays. In Proceedings of the Third Joint EuroHaptics Conference and Symposium on Haptic Interfaces for Virtual Environment and Teleoperator Systems, Salt Lake City, UH, USA, 18–20 March 2009; pp. 290–295. [Google Scholar] [CrossRef] [Scilit]
  41. Biggs, J.; Hitchcock, R.N. Refreshable braille displays using EAP actuators. Smart Mater. Struct. 2010, 19, 035010. [Google Scholar] [CrossRef] [Scilit]
  42. Abad, A.C.; Swarup, D.; Reid, D.; Ranasinghe, A. 4×4 fingertip tactile matrix actuator with edge detection scanning ROI simulator. In Proceedings of the 2020 IEEE Sensors Conference, Rotterdam, The Netherlands, 25–28 October 2020; pp. 1–4. [Google Scholar] [CrossRef] [Scilit]
  43. Choi, H.R.; Lee, S.W.; Jung, K.M.; Koo, J.C.; Lee, S.I.; Choi, H.G.; Jeon, J.W.; Nam, J.D. Tactile display as a braille display for the visually disabled. In Proceedings of the 2004 IEEE/RSJ International Conference on Intelligent Robots and Systems (IROS), Sendai, Japan, 28 September–2 October 2004; Volume 2, pp. 1985–1990. [Google Scholar] [CrossRef] [Scilit]
  44. Lee, C.P.; Tsai, M.C.; Fuh, Y.K. Tiny piezoelectric multi-layered actuators with application in a compact camera module—Design, fabrication, assembling and testing issues. Micromachines 2022, 13, 2126. [Google Scholar] [CrossRef] [Scilit] [PubMed]
  45. Uchino, K. Advanced Piezoelectric Materials: Science and Technology; Woodhead Publishing: Cambridge, UK, 2010. [Google Scholar] [CrossRef] [Scilit]
  46. Choi, M.; Park, J.; Lee, J. Design of piezoelectric actuator for braille module by finite element method. J. Nanosci. Nanotechnol. 2019, 19, 1308–1314. [Google Scholar] [CrossRef] [Scilit] [PubMed]
  47. Wiertlewski, M.; Hayward, V. Mechanical behavior of the fingertip in the range of frequencies and displacements relevant to touch. J. Biomech. 2012, 45, 1869–1874. [Google Scholar] [CrossRef] [Scilit] [PubMed]
  48. Israr, A.; Choi, S.; Tan, H.Z. Mechanical impedance of the hand holding a spherical tool at threshold and suprathreshold stimulation levels. In Proceedings of the World Haptics Conference, Tsukuba, Japan, 22–24 March 2007; pp. 347–352. [Google Scholar] [CrossRef] [Scilit]
  49. Runyan, N.H.; Blazie, D.K. Seeking the ‘holy Braille’ display: Might electromechanically active polymers be the solution? Expert Rev. Med. Devices 2011, 8, 529–531. [Google Scholar] [CrossRef] [Scilit] [PubMed]
  50. Etezad, M.; Joshi, R.; Cibrian, F.L. Advancements in refreshable Braille display technology: A comprehensive survey. Displays 2025, 90, 103133. [Google Scholar] [CrossRef] [Scilit]
  51. Dot Inc. Dot Pad: The First Tactile Graphics Display for the Visually Impaired. 2023. Available online: https://www.dotincorp.com/en/product (accessed on 4 May 2026).
  52. Fusiello, L.; Alcubierre, P.; Mascetti, S. Developing dynamic audio navigation UIs to pinpoint elements in tactile graphics. Multimodal Technol. Interact. 2022, 6, 113. [Google Scholar] [CrossRef] [Scilit]
  53. Kim, G.; Lim, C.; Park, G. I-Scratch: Independent Slide Creation With Auditory Comment and Haptic Interface for the Blind and Visually Impaired. In Proceedings of the 2025 CHI Conference on Human Factors in Computing Systems, Yokohama, Japan, 26 April–1 May 2025; ACM: New York, NY, USA; 2025, p. 1161. [Google Scholar] [CrossRef] [Scilit]
  54. Brayda, L.; Leo, F.; Baccelliere, C.; Ferrari, E.; Vigini, C. Updated tactile feedback with a pin array matrix helps blind people to reduce self-location errors. Micromachines 2018, 9, 351. [Google Scholar] [CrossRef] [Scilit] [PubMed]
  55. Bhatnagar, T.; Higgins, A.; Marquardt, N.; Miodownik, M.; Holloway, C. Analysis of product architectures of pin array technologies for tactile displays. Proc. Acm Hum.-Comput. Interact. 2023, 7, 135–155. [Google Scholar] [CrossRef] [Scilit]
  56. Tan, S.; Klatzky, R.L.; Peshkin, M.A.; Colgate, J.E. PixeLite: A thin and wearable high bandwidth electroadhesive haptic array. IEEE Trans. Haptics 2023, 16, 498–504. [Google Scholar] [CrossRef] [Scilit] [PubMed]
  57. Tan, S.; Peshkin, M.A.; Klatzky, R.L.; Colgate, J.E. Toward human-resolution haptics: A high-bandwidth, high-density, wearable tactile display. Sci. Adv. 2025, 11, eadz5937. [Google Scholar] [CrossRef] [Scilit] [PubMed]
  58. Bau, O.; Poupyrev, I.; Israr, A.; Harrison, C. TeslaTouch: Electrovibration for touch surfaces. In Proceedings of the UIST ’10, New York, NY, USA, 3–6 October 2010; pp. 283–292. [Google Scholar] [CrossRef] [Scilit]
  59. Leonardis, D.; Loconsole, C.; Frisoli, A. A survey on innovative refreshable braille display technologies. Adv. Hum. Factors Wearable Technol. 2017, 587, 488–498. [Google Scholar] [CrossRef] [Scilit]
  60. Motto Ros, P.; Dante, V.; Mesin, L.; Petetti, E.; Del Giudice, P.; Pasero, E. A new dynamic tactile display for reconfigurable braille: Implementation and tests. Front. Neuroeng. 2014, 7, 6. [Google Scholar] [CrossRef] [Scilit] [PubMed]
  61. Tian, X.C.; Wang, H.; Wang, Z.C.; Hou, J.; Lin, J.Y.; Liu, J.L.; Li, S.F.; Yang, Z.G. Piezoelectric drive hydraulic amplification flexible braille contact device design and experiment. AIP Adv. 2022, 12, 035147. [Google Scholar] [CrossRef] [Scilit]
  62. Liu, X.; Wang, T.; Liu, J.; Sun, Y.; Wang, H.; Tian, X. Design and experimental study of piezoelectric driven flexible braille contacts. AIP Adv. 2022, 12, 125206. [Google Scholar] [CrossRef] [Scilit]
  63. Taylor, P.M.; Moser, A.; Creed, A. A sixty-four element tactile display using shape memory alloy wires. Displays 1998, 18, 163–168. [Google Scholar] [CrossRef] [Scilit]
  64. Velázquez, R.; Pissaloux, E.; Hafez, M.; Szewczyk, J. A low-cost highly-portable tactile display based on shape memory alloy micro-actuators. In Proceedings of the IEEE Symposium on Virtual Environments, Human-Computer Interfaces and Measurement Systems (VECIMS), Giardini Naxos, Italy, 18–20 July 2005; pp. 1–6. [Google Scholar] [CrossRef] [Scilit]
  65. Frediani, G.; Mazzei, D.; De Rossi, D.E.; Carpi, F. Wearable wireless tactile display for virtual interactions with soft bodies. Front. Bioeng. Biotechnol. 2014, 2, 31. [Google Scholar] [CrossRef] [Scilit] [PubMed]
  66. Bar-Cohen, Y.; Anderson, I.A. Electroactive polymer (EAP) actuators—Background review. Mech. Soft Mater. 2019, 1, 5. [Google Scholar] [CrossRef] [Scilit]
  67. Wu, X.; Kim, S.H.; Zhu, H.; Ji, C.H.; Allen, M.G. A refreshable braille cell based on pneumatic microbubble actuators. J. Microelectromech. Syst. 2012, 21, 908–916. [Google Scholar] [CrossRef] [Scilit]
  68. Xie, Z.; Kim, J.; Peng, Z.; Qiu, Y.; Pei, Q. A 2D refreshable braille display based on a stiffness variable polymer and pneumatic actuation. Proc. SPIE 2021, 11587, 115870O. [Google Scholar] [CrossRef] [Scilit] [PubMed]
  69. Vardar, Y.; Güçlü, B.; Basdogan, C. Effect of waveform on tactile perception by electrovibration displayed on touch screens. IEEE Trans. Haptics 2017, 10, 488–499. [Google Scholar] [CrossRef] [Scilit] [PubMed]
  70. Hwang, I.; Mun, S.; Youn, J.H.; Kim, H.J.; Park, S.K.; Choi, M.; Kang, T.J.; Pei, Q.; Yun, S. Height-renderable morphable tactile display enabled by programmable modulation of local stiffness in photothermally active polymer. Nat. Commun. 2024, 15, 2541. [Google Scholar] [CrossRef] [Scilit] [PubMed]
  71. Linnander, M.; Goetz, D.; Reardon, G.; Kumar, V.; Hawkes, E.; Visell, Y. Tactile displays driven by projected light. Sci. Robot. 2025, 10, eadv1383. [Google Scholar] [CrossRef] [Scilit] [PubMed]
  72. Bach-y Rita, P.; Kercel, S.W. Sensory substitution and the human–machine interface. Trends Cogn. Sci. 2003, 7, 541–546. [Google Scholar] [CrossRef] [Scilit] [PubMed]
  73. Leo, F.; Cocchi, E.; Brayda, L. The effect of programmable tactile displays on spatial learning skills in children and adolescents of different visual disability. IEEE Trans. Neural Syst. Rehabil. Eng. 2017, 25, 861–872. [Google Scholar] [CrossRef] [Scilit] [PubMed]
  74. Rastogi, R.; Pawluk, D.T.V.; Ketchum, J.M. Graphical tactile information access for visually impaired and blind users. In Proceedings of the 20th International ACM SIGACCESS Conference on Computers and Accessibility, Galway, Ireland, 22–24 October 2018; pp. 435–437. [Google Scholar] [CrossRef] [Scilit]
  75. Brock, A.; Jouffrais, C. Interactive audio-tactile maps for visually impaired people. ACM SIGACCESS Access. Comput. 2015, 113, 3–12. [Google Scholar] [CrossRef] [Scilit]
  76. Gorlewicz, J.L.; Tennison, J.L.; Uesbeck, P.M.; Richard, M.E.; Palani, H.P.; Stefik, A.; Smith, D.W.; Giudice, N.A. Design guidelines and recommendations for multimodal, touchscreen-based graphics. ACM Trans. Access. Comput. 2020, 13, 1–30. [Google Scholar] [CrossRef] [Scilit]
  77. Tran, C.M.; Bach, N.G.; Tan, P.X.; Kamioka, E.; Kanamaru, M. Enabling self-practice of digital audio-tactile maps for visually impaired people by large language models. Electronics 2024, 13, 2395. [Google Scholar] [CrossRef] [Scilit]
  78. Brock, A.M.; Truillet, P.; Oriola, B.; Picard, D.; Jouffrais, C. Interactivity improves usability of geographic maps for visually impaired people. Hum.-Comput. Interact. 2015, 30, 156–194. [Google Scholar] [CrossRef] [Scilit]
  79. Giudice, N.A.; Guenther, B.A.; Kaplan, T.M.; Anderson, S.M.; Knuesel, R.J.; Cioffi, J.F. Use of an indoor navigation system by sighted and blind travelers: Performance similarities across visual status and age. ACM Trans. Access. Comput. 2020, 13, 1–27. [Google Scholar] [CrossRef] [Scilit]
  80. Papadopoulos, K.; Barouti, M.; Koustriava, E. Differences in spatial knowledge of individuals with blindness when using audiotactile maps, using tactile maps, and walking. Except. Child. 2018, 84, 330–343. [Google Scholar] [CrossRef] [Scilit]
  81. Tachiquin, R.; Velázquez, R.; Del-Valle-Soto, C.; Gutiérrez, C.A.; Carrasco, M.; De Fazio, R.; Trujillo-León, A.; Visconti, P.; Vidal-Verdú, F. Wearable urban mobility assistive device for visually impaired pedestrians using a smartphone and a tactile-foot interface. Sensors 2021, 21, 5274. [Google Scholar] [CrossRef] [Scilit] [PubMed]
  82. Hudson, E. Maptic: Tactile Navigation for the Visually Impaired; Royal College of Art: London, UK, 2018. [Google Scholar]
  83. Casanova, E.; Guffanti, D.; Hidalgo, L. Technological advancements in human navigation for the visually impaired: A systematic review. Sensors 2025, 25, 2213. [Google Scholar] [CrossRef] [Scilit] [PubMed]
  84. Brooks, P.L.; Frost, B.J. Evaluation of a tactile vocoder for word recognition. J. Acoust. Soc. Am. 1983, 74, 34–39. [Google Scholar] [CrossRef] [Scilit] [PubMed]
  85. Bernstein, L.E.; Demorest, M.E.; Coulter, D.C.; O’Connell, M.P. Lipreading sentences with vibrotactile vocoders: Performance of normal-hearing and hearing-impaired subjects. J. Acoust. Soc. Am. 1991, 90, 2971–2984. [Google Scholar] [CrossRef] [Scilit] [PubMed]
  86. Sakajiri, M.; Nakamura, K.; Fukushima, S.; Miyoshi, S.; Ifukube, T. Effect of voice pitch control training using a two-dimensional tactile feedback display system. In Proceedings of the 2012 IEEE International Conference on Systems, Man, and Cybernetics (SMC), Seoul, Republic of Korea, 14–17 October 2012; IEEE: Piscataway, NJ, USA, 2012; pp. 2943–2947. [Google Scholar]
  87. Fletcher, M.D.; Akis, E.; Verschuur, C.A.; Perry, S.W. Improved tactile speech perception using audio-to-tactile sensory substitution with formant frequency focusing. Sci. Rep. 2024, 14, 4889. [Google Scholar] [CrossRef] [Scilit] [PubMed]
  88. Fletcher, M.D.; Verschuur, C.A.; Akis, E. Spectral peak picking improves tactile speech perception. Sci. Rep. 2025, 15, 28930. [Google Scholar] [CrossRef] [Scilit] [PubMed]
  89. Tran, J.J.; Porter, J.R., III. Haptic Braille Output for a Game Controller. U.S. Patent 10,322,336 B2, 18 June 2019. [Google Scholar]
  90. McAllister, G. The Last of Us Part I: Full List of Accessibility Features. PlayStation.Blog. 26 August 2022. Available online: https://blog.playstation.com/2022/08/26/the-last-of-us-part-i-full-list-of-accessibility-features/ (accessed on 12 August 2026).
  91. Nair, V.; Ku, S.Y.; Wang, G.; Olwal, A.; Azenkot, S. Foveated haptic gaze: Conveying narrowed visual attention via haptic feedback. In Proceedings of the 22nd International ACM SIGACCESS Conference on Computers and Accessibility, Athens, Greece, 26–28 October 2020. [Google Scholar] [CrossRef] [Scilit]
  92. Kandel, E.R.; Koester, J.D.; Mack, S.H.; Siegelbaum, S.A. Principles of Neural Science, 6th ed.; McGraw-Hill: New York, NY, USA, 2021. [Google Scholar]
  93. Gescheider, G.A.; Bolanowski, S.J.; Verrillo, R.T. Some characteristics of tactile channels. Behav. Brain Res. 2004, 148, 35–40. [Google Scholar] [CrossRef] [Scilit] [PubMed]
  94. Quindlen-Hotek, J.C.; Bloom, E.T.; Johnston, O.K.; Barocas, V.H. An inter-species computational analysis of vibrotactile sensitivity in Pacinian and Herbst corpuscles. R. Soc. Open Sci. 2020, 7, 191439. [Google Scholar] [CrossRef] [Scilit] [PubMed]
  95. Birznieks, I.; McIntyre, S.; Nilsson, H.M.; Nagi, S.S.; Macefield, V.G.; Mahns, D.A.; Vickery, R.M. Tactile sensory channels over-ruled by frequency decoding system that utilizes spike pattern regardless of receptor type. eLife 2019, 8, e46510. [Google Scholar] [CrossRef] [Scilit] [PubMed]
  96. Nagi, S.S.; McIntyre, S.; Ng, K.K.W.; Mahns, D.A.; Birznieks, I.; Vickery, R.M. Contribution of remote Pacinian corpuscles to flutter-range frequency discrimination in humans. Sci. Rep. 2024, 14, 27943. [Google Scholar] [CrossRef] [Scilit] [PubMed]
  97. Wang, Q.; Hayward, V. In vivo biomechanics of the fingerpad skin under local tangential traction. J. Biomech. 2007, 40, 851–860. [Google Scholar] [CrossRef] [Scilit] [PubMed]
  98. Israr, A.; Tan, H.Z.; Reed, C.M. Frequency and amplitude discrimination along the kinesthetic-cutaneous continuum in the presence of masking stimuli. J. Acoust. Soc. Am. 2006, 120, 2789–2800. [Google Scholar] [CrossRef] [Scilit] [PubMed]
  99. Mix, A.W.; Giacomin, A.J. Standardized polymer durometry. J. Test. Eval. 2011, 39, 696–705. [Google Scholar] [CrossRef] [Scilit]
  100. Cabibihan, J.J.; Pattofatto, S.; Jomaa, M.; Benallal, A.; Carrozza, M.C. Towards humanlike social touch for sociable robotics and prosthetics: Comparisons on the compliance, conformance and hysteresis of synthetic and human fingertip skins. Int. J. Soc. Robot. 2009, 1, 29–40. [Google Scholar] [CrossRef] [Scilit]
  101. Ward-Cherrier, B.; Pestell, N.; Cramphorn, L.; Winstone, B.; Giannaccini, M.E.; Rossiter, J.; Lepora, N.F. The TacTip family: Soft optical tactile sensors with 3D-printed biomimetic morphologies. Soft Robot. 2018, 5, 216–227. [Google Scholar] [CrossRef] [Scilit] [PubMed]
  102. Liang, X.; Boppart, S.A. Biomechanical properties of in vivo human skin from dynamic optical coherence elastography. IEEE Trans. Biomed. Eng. 2010, 57, 953–959. [Google Scholar] [CrossRef] [Scilit] [PubMed]
  103. Papetti, S.; Järveläinen, H.; Giordano, B.L.; Schiesser, S.; Fröhlich, M. Vibrotactile sensitivity in active touch: Effect of pressing force. IEEE Trans. Haptics 2017, 10, 113–122. [Google Scholar] [CrossRef] [PubMed]
  104. Verrillo, R.T. Temporal summation in vibrotactile sensitivity. J. Acoust. Soc. Am. 1965, 37, 843–846. [Google Scholar] [CrossRef] [Scilit] [PubMed]
  105. Bensmaia, S.J.; Hollins, M. The vibrations of texture. Somatosens. Mot. Res. 2003, 20, 33–43. [Google Scholar] [CrossRef] [Scilit] [PubMed]
  106. ASTM D2240-15(2021); Standard Test Method for Rubber Property—Durometer Hardness. ASTM International: West Conshohocken, PA, USA, 2021. [CrossRef] [Scilit]
  107. R Core Team. R: A Language and Environment for Statistical Computing; R Foundation for Statistical Computing: Vienna, Austria, 2024. [Google Scholar]
  108. Borchers, H.W. pracma: Practical Numerical Math Functions, R package version 2.4.4. 2023. Available online: https://rdrr.io/cran/pracma/ (accessed on 5 June 2026).
  109. Saal, H.P.; Delhaye, B.P.; Rayhaun, B.C.; Bensmaia, S.J. Simulating tactile signals from the whole hand with millisecond precision. Proc. Natl. Acad. Sci. USA 2017, 114, E5693–E5702. [Google Scholar] [CrossRef] [Scilit] [PubMed]
  110. Muniak, M.A.; Ray, S.; Hsiao, S.S.; Dammann, J.F.; Bensmaia, S.J. The neural coding of stimulus intensity: Linking the population response of mechanoreceptive afferents with psychophysical behavior. J. Neurosci. 2007, 27, 11687–11699. [Google Scholar] [CrossRef] [Scilit] [PubMed]
  111. Johansson, R.S.; Vallbo, A.B. Tactile sensibility in the human hand: Relative and absolute densities of four types of mechanoreceptive units in glabrous skin. J. Physiol. 1979, 286, 283–300. [Google Scholar] [CrossRef] [Scilit] [PubMed]
  112. Corniani, G.; Saal, H.P. Tactile innervation densities across the whole body. J. Neurophysiol. 2020, 124, 1229–1240. [Google Scholar] [CrossRef] [Scilit] [PubMed]
  113. Saal, H.P. TouchSim: A Python Implementation of the TouchSim Model to Simulate Peripheral Tactile Responses. GitHub Repository. 2017. Available online: https://github.com/hsaal/touchsim (accessed on 26 July 2026).
  114. Harris, C.R.; Millman, K.J.; van der Walt, S.J.; Gommers, R.; Virtanen, P.; Cournapeau, D.; Wieser, E.; Taylor, J.; Berg, S.; Smith, N.J.; et al. Array programming with NumPy. Nature 2020, 585, 357–362. [Google Scholar] [CrossRef] [Scilit] [PubMed]
  115. Virtanen, P.; Gommers, R.; Oliphant, T.E.; Haberland, M.; Reddy, T.; Cournapeau, D.; Burovski, E.; Peterson, P.; Weckesser, W.; Bright, J.; et al. SciPy 1.0: Fundamental algorithms for scientific computing in Python. Nat. Methods 2020, 17, 261–272. [Google Scholar] [CrossRef] [Scilit] [PubMed]
  116. Wickham, H. ggplot2: Elegant Graphics for Data Analysis; Springer: New York, NY, USA, 2016. [Google Scholar] [CrossRef] [Scilit]
  117. Manfredi, L.R.; Baker, A.T.; Elias, D.O.; Dammann, J.F., III; Zielinski, M.C.; Polashock, V.S.; Bensmaia, S.J. The effect of surface wave propagation on neural responses to vibration in primate glabrous skin. PLoS ONE 2012, 7, e31203. [Google Scholar] [CrossRef] [Scilit] [PubMed]
  118. Sripati, A.P.; Bensmaia, S.J.; Johnson, K.O. A continuum mechanical model of mechanoreceptive afferent responses to indented spatial patterns. J. Neurophysiol. 2006, 95, 3852–3864. [Google Scholar] [CrossRef] [Scilit] [PubMed]
  119. Shao, Y.; Hayward, V.; Visell, Y. Spatial patterns of cutaneous vibration during whole-hand haptic interactions. Proc. Natl. Acad. Sci. USA 2016, 113, 4188–4193. [Google Scholar] [CrossRef] [Scilit] [PubMed]
  120. Sofia, K.O.; Jones, L. Mechanical and psychophysical studies of surface wave propagation during vibrotactile stimulation. IEEE Trans. Haptics 2013, 6, 320–329. [Google Scholar] [CrossRef] [Scilit] [PubMed]
  121. Jones, L.A.; Held, D.; Hunter, I. Surface waves and spatial localization in vibrotactile displays. In Proceedings of the 2010 IEEE Haptics Symposium, 25–26 March 2010; IEEE: Waltham, MA, USA, 2010; pp. 91–94. [Google Scholar]
Figure 1. (Left) Top and (Right) side views of the Tactule with 32 rods.
Jsan 15 00069 g001
Figure 2. Hardware block diagram to drive the Tactule.
Jsan 15 00069 g002
Figure 3. Top view of the Tactule with 64 rods.
Jsan 15 00069 g003
Figure 4. Peak-to-peak displacement of a single multilayer-bimorph piezoelectric element as a function of driving frequency, measured on the bare element with no actuating rod attached and no external load, for three amplitudes of the applied square-wave voltage. These curves therefore characterize the element itself rather than the assembled pin: the rod, its guide, and any contact load are added only in the measurements reported in Section 5. The resonance observed here therefore differs from the loaded response reported there.
Jsan 15 00069 g004
Figure 5. Experimental setup of the piezoelectric pins with a silicone sheet simulating a fingertip and a 50 g brass weight simulating the downward force exerted by a finger on the pins being measured.
Jsan 15 00069 g005
Figure 6. Measurement setup for the piezoelectric pins. (Left) Overall view. Pin displacement was measured on the rear face of the bimorph using a noncontact laser displacement sensor. A camera was positioned alongside the sensor to verify which pin the laser spot was on. (Center) Alignment. The upper photograph shows the mirror that redirects the camera’s view toward the pin surface, allowing the operator to see the laser spot without obstructing the sensor. The lower photograph shows the camera image obtained through this arrangement, with the laser spot visible on the target pin. (Right) Loading configuration. A silicone sheet placed on the pin matrix simulates the mechanical impedance of a fingertip, and a brass weight on top of the sheet applies a constant preload while holding the sheet in place.
Jsan 15 00069 g006
Figure 7. Peak-to-peak amplitude [ μ m] at each driving frequency [Hz] for sinusoidal and rectangular waveforms. The semi-transparent regions indicate the standard deviation range.
Jsan 15 00069 g007
Figure 8. Peak-to-peak rear-face displacement of the reference pin under sinusoidal drive for the unloaded condition and for five silicone grades from Shore A 10 to Shore A 90, each under a 50 g preload.
Jsan 15 00069 g008
Figure 9. (Left): amplitude of the reference pin under the isolated and three co-activation conditions. (Right): amplitude of the reference pin under the three co-activation conditions relative to the isolated case. The dashed line marks the isolated reference. All three conditions scatter about that line by roughly 1 dB, and none departs from it by a resolvable amount.
Jsan 15 00069 g009
Figure 10. Measured peak displacement of the reference pin under each loading condition was plotted against the detection thresholds of the four psychophysical channels [8,93]. Both axes are logarithmic. The measured amplitudes lie well above the PC channel threshold throughout the band, approach the NP-I threshold only at the low-frequency end, and remain below the NP-II threshold except at the lowest frequencies under light loading.
Jsan 15 00069 g010
Figure 11. Mean firing rate of SA-I, FA-I/RA-I, and PC (FA-II/RA-II) afferent models driven by the measured rear-face waveforms, as a function of driving frequency and loading condition. Note the differing vertical scales across panels.
Jsan 15 00069 g011
Figure 12. Predicted firing-rate maps on the distal pad of the index finger for simulated multi-pin patterns. Rows correspond to afferent classes, and columns to patterns. Cyan markers indicate the driven pins. High-frequency drive recruits the PC population diffusely, whereas low-frequency drive produces weaker but spatially localized FA-I activity.
Jsan 15 00069 g012
Table 1. Comparison of the proposed module with representative tactile displays. Em dashes denote metrics not reported in the source; “n/a” denotes metrics that are not defined for that class of device, such as frequency bandwidth for a quasi-static pin array or refresh rate for a continuously modulated vibrotactile display. Values marked ≈ are approximate: those for Dot Pad and Graphiti are reported in the cited analyses rather than by the manufacturer, and the value for VoxeLite is inferred from the stated areal density.
SystemActuatorPitchCh.VoltageDispl.BandwidthPowerPortability
Type [mm] [V] [Hz]
TactuleMultilayer2.032/645 (USB)>60  μ m50–8000.40 A atUSB-powered
(this work)piezo bimorph /36 maxfree 5 V, 32 chmodule
Wada et al.Piezo bimorph3.01656110  μ m50–400—Bench
[25] prototype
CommercialPiezo bimorph2.58/cell2000.5 mmn/a—Portable
braille cell [49]reed static line
Dot Pad [51,53]Electromagnetic≈2.62400—Bistablen/a—1.2 kg
ball rotor static tablet
Graphiti [54,55]Tactuator≈2.52400—Multi-leveln/aHolds state295 × 269 mm
(electromech.) (graphics) (—) unpoweredtablet
Tactonom [52]Electromechanical≈2.57000+—Bistablen/a—Desktop
Russomanno et al.Pneumatic2.4up to—Bistablen/aHolds stateBench
[29]latching 7200 static unpoweredprototype
PixeLite [56]Electroadhesive2.516—Lateral≤500—1.00 g
force wearable
VoxeLite [57]Electroadhesive≈1.0110/cm2—Lateral≤800—0.19 g
force wearable
TeslaTouch [58]Electrovibrationn/an/a80–120Friction≤500—Touch
(surface)(surface) modulation surface
Table 2. Estimated per-pin current amplitude I pin = 2 π f C V for C = 500  nF, and the number of pins that can be driven simultaneously within the 500 mA budget of a USB port at V = 5  V.
Frequency I pin [mA]Pins Within
[Hz] 5 V 12 V 36 V 500 mA at 5 V
500.791.885.65636
2003.147.5422.62159
4006.2815.0845.2479
6009.4222.6267.8653
80012.5730.1690.4839
Disclaimer/Publisher’s Note: The statements, opinions and data contained in all publications are solely those of the individual author(s) and contributor(s) and not of MDPI and/or the editor(s). MDPI and/or the editor(s) disclaim responsibility for any injury to people or property resulting from any ideas, methods, instructions or products referred to in the content.