Abstract
Wireless connectivity plays a pivotal role in enabling real-time telemetry, sensor feedback, and autonomous navigation within Industry 4.0 environments. This paper presents a ROS 2-based mobile robotic platform designed to perform real-time network diagnostics across both private 5G and Wi-Fi technologies in a live smart manufacturing testbed. The system integrates high-frequency telemetry acquisition with spatial localization, multi-protocol connection analysis, and detailed performance monitoring. Metrics such as latency, packet loss, bandwidth, and IIoT (Industrial Internet of Things) data stream health are continuously logged and analysed. Telemetry is captured during motion and synchronously stored in an InfluxDB time-series database, enabling live visualization through Grafana dashboards. A key feature of the platform is its dual-path transmission architecture, which provides communication redundancy and allows side-by-side evaluation of network behaviour under identical physical conditions. Experimental trials demonstrate the platform’s ability to detect roaming events, characterize packet loss, and reveal latency differences between Wi-Fi and 5G networks. Results show that Wi-Fi suffered from roaming-induced instability and packet loss, whereas 5G maintained stable and uninterrupted connectivity throughout the test area. This work introduces a modular, extensible framework for mobile network evaluation in industrial settings and provides practical insights for infrastructure tuning, protocol selection, and wireless fault detection.
1. Introduction
As Industry 4.0 continues to transform manufacturing environments, the adoption of mobile robotic systems and distributed IIoT architectures has led to an increased reliance on robust wireless communication. Real-time telemetry, low-latency control, and high-throughput data transmission are now critical for enabling smart automation, predictive maintenance, and adaptive production workflows [1]. These systems support real-time telemetry, sensor data transmission, and remote diagnostics, functions that depend heavily on reliable wireless communication [2,3], particularly in dynamic factory settings where signal conditions and interference patterns vary over time and space [4].
Traditional network performance evaluations often consider fixed endpoints or simulations [5]; this fails to capture the transient connectivity challenges encountered by mobile platforms. In practice, mobile robots must maintain seamless communication while traversing a variable wireless landscape, which can be susceptible to interference and travelling in zones of variable connection qualities [6,7]. Roaming events, signal degradation, and communication protocol-induced disruptions can severely impact data integrity, control responsiveness, and the reliability of IIoT telemetry streams [4,8,9].
These connectivity limitations are largely influenced by the underlying network protocol and handover mechanism [10]. While both Wi-Fi and 5G provide high-speed wireless connectivity, their underlying handover and timing mechanisms differ fundamentally, particularly in mobile scenarios. In this testbed, the Wi-Fi network operates without fast-roaming enhancements such as IEEE 802.11r [11], which are designed to expedite the transition between access points when signal strength degrades. As a result, the mobile platform must perform a full reassociation and authentication handshake each time it connects to a new access point, introducing temporary link interruptions, latency spikes, and potential packet loss [12]. In contrast, the private 5G network in this testbed is deployed on a Nokia Radio Access Network (RAN). This private 5G network operates as a Single Frequency Network (SFN) [13], in which all radio transmitters broadcast synchronously on the same carrier frequency. This configuration allows user equipment to move seamlessly within the coverage area without roaming between transmitters. The RAN centrally manages scheduling requests and uplink grants, maintaining continuous session integrity as the robot moves. Consequently, the 5G connection remains stable and uninterrupted throughout the test area, while Wi-Fi experiences latency variations and brief disconnects due to its decentralized roaming mechanism.
To systematically investigate and quantify these contrasting behaviours, this paper presents a mobile robotic platform designed as an autonomous network diagnostics and performance evaluation tool. The system is built on Robot Operating System 2 (ROS 2) [14] and operates using a Jetson Orin Nano [15] in conjunction with a Raspberry Pi 5 [16], enabling high-frequency telemetry acquisition and real-time, spatially mapped network performance monitoring across both Wi-Fi and 5G interfaces. The platform supports multiprotocol analysis, capturing ICMP, TCP, and UDP traffic to characterize a broad spectrum of network behaviours relevant to industrial communication workloads.
A defining feature of the platform is its ability to transmit telemetry simultaneously over Wi-Fi and 5G, routing all diagnostic data to a unified InfluxDB time-series database [17]. This dual-path architecture enables communication redundancy, improves fault tolerance, and facilitates direct interoperability analysis between the two technologies under identical mobility and environmental conditions. As such, the robot enables side-by-side evaluation of both network types while functioning as a resilient data acquisition node within industrial networks where various communication protocols are available.
Visualization and analysis are achieved using Grafana [18,19] dashboards, allowing real-time monitoring and post-run investigation of latency, signal strength, throughput, and data loss which is mapped against the robot’s navigation route. This approach empowers engineers to correlate network performance anomalies with physical location, mobility behaviour, or protocol transitions, thereby supporting targeted infrastructure tuning and operational decision-making.
2. Related Work
Wireless communication in industrial settings has been studied extensively, particularly with the emergence of private 5G networks and the need for low-latency links in time-sensitive industrial control applications. Studies have shown that 5G outperforms Wi-Fi in terms of coverage, reliability, and channel separation [20,21,22]. However, many of these evaluations are performed in stationary or semi-controlled environment, where the effects of mobility, particularly in roaming scenarios, are not fully addressed.
Recent research has also investigated different mobile network measurement methodologies, encompassing ground-based driving tests, aerial measurements using unmanned aerial vehicles (UAVs), and distributed multi-user setups in industrial environments. Each of these approaches offers distinct advantages and limitations in understanding the real-world behaviour of wireless networks under mobility. For example, Clancy et al. [23] conducted an extensive drive-test campaign to assess 4G and early 5G NR performance across suburban, urban, and highway routes, analysing both active and passive metrics in real network conditions. Their findings highlighted that while early 5G deployments show improved throughput and latency compared to LTE, coverage gaps and handover between cell sites still limit the feasibility of ultra-reliable and low-latency communication for vehicular and industrial applications.
Complementing ground-based studies, Zulkifley et al. [24] employed UAV-mounted LTE equipment to investigate wireless connectivity at varying altitudes. Their results revealed that as flight height increased, the received signal reference power (RSRP) and quality (RSRQ) degraded significantly by approximately 20 dB and 10 dB, respectively. This lead to increased latency and reduced throughput. This degradation was attributed to factors such as sidelobe coverage, interference, and limited vertical handover optimization. While this study demonstrates the potential of UAVs as flexible mobile measurement platforms, it also underscores the challenges of maintaining reliable connectivity in aerial and dynamic environments.
In contrast to drive-based and aerial measurements, distributed or “multi-person perception” methods have been employed to capture spatially resolved network data in live industrial environments. Arendt et al. [6] deployed a distributed test system integrating multiple stationary field devices and a mobile unit mounted on an automated guided vehicle (AGV) to simultaneously measure latency, reliability, and Quality of Service (QoS) across private 5G and Wi-Fi 6 networks in a production hall. Their results demonstrated that private 5G offered higher reliability and lower round-trip times compared to Wi-Fi 6, particularly under heavy load, but also identified environment-specific limitations in coverage and interference. Such distributed setups capture both the static and dynamic aspects of industrial communication, enabling performance evaluation under realistic traffic and interference conditions.
While these measurement approaches have improved understanding of network behaviour under mobility, most focus only on link-level metrics such as latency, reliability, and coverage. Few studies examine how network performance affects robotic or IIoT systems, where communication quality directly impacts control and operation [21,25,26]. This creates a gap between mobile network measurements and system-level telemetry useful for adaptive decision-making in industrial robotics. According to the 3GPP TS 22.104 [27] “service performance requirements”, mobile robots operating in industrial environments demand end-to-end reliability levels of at least 99.9% to ensure safe and deterministic behaviour. Most prior works still analyse Wi-Fi or 5G separately, emphasizing signal or latency performance [28]. However, the combined use and comparison of both networks on a live robotic platform with unified data visualization tools like Grafana and InfluxDB for network diagnostics remains largely unexplored area [29,30].
Roda-Sanchez et al. [29] proposed a framework for a Network Digital Twin (NDT) driven by robotic telemetry over 5G, enabling near real-time optimization and control of mobile robot behaviour in dynamic environments. This research generally focused on path planning, mapping, and task execution using tools like ROS. While this work successfully demonstrates the potential of data-driven digital replicas for network adaptation, it focuses primarily on 5G and does not explore simultaneous dual-network operation or real-time reporting of data to a central database for immediate decision making and results inspection from a single pane of glass like Grafana. It is also very important to have a backup communication channel for communication with a robot which this system does in the form of 5G or Wi-Fi.
In the Wi-Fi domain, Pandey and Parasuraman [31] conducted a comprehensive empirical study on bi-directional network performance on mobile robots, examining how placement and channel frequency influence metrics like throughput and latency. Their framework, although insightful, is limited to Wi-Fi and lacks integration with real-time dashboards or a scalable telemetry database infrastructure for long-term analysis and industrial deployment.
Many IoT telemetry streams appear to use TCP rather than UDP as a communication medium. Many of the ROS papers [29] mention the use of TCP for control packets, however from studying Bekele et al. [32] it does mention that dynamic networks are known to increase UDP packet loss this is an important factor in the IIoT data stream in this paper in terms of reliability.
Meira et al. [33] presents a framework that utilizes InfluxDB and Grafana for monitoring IIoT communication within an industrial environment. While this implementation was not deployed on a live factory floor this paper presents a set of validation tests that helped assess the implementation and operation of proposed infrastructure and application. In contrast the robotic platform described in this paper was actively deployed in a live factory floor environment, enabling real-time, spatially correlated data acquisition. Meira et al. [33]’s work serves as a valuable reference for the feasibility of using InfluxDB and Grafana in industrial contexts and highlights the role of private 5G in supporting IIoT communication.
Recent empirical studies have begun to explore collaborative and heterogeneous networking between 5G and Wi-Fi in industrial environments. Fré et al. [34] examined real factory deployments and found that 5G Standalone (SA) consistently achieved higher resiliency and lower latency compared to Wi-Fi 6, maintaining 99.9% success rates for sub-100 ms latency targets in large data payload manufacturing use cases. Arendt et al. [21] demonstrated that private 5G outperforms Wi-Fi under heavy load, but also that coordinated multi-access approaches could leverage both networks for improved reliability. Segura et al. [12] further expanded on this concept by experimentally evaluating 5G, Wi-Fi 6, and multi-connectivity in an indoor industrial scenario, showing that packet-duplication-based multi-connectivity between 5G and Wi-Fi can reduce latency tails and enhance reliability across mobile and stationary use cases. These findings emphasize that future IIoT deployments are likely to depend on hybrid network architectures, where 5G and Wi-Fi collaborate to meet diverse latency, reliability, and scalability demands. This forward-looking perspective supports the need for frameworks capable of dynamic network selection, load balancing, and redundancy across heterogeneous interfaces to achieve consistent Quality of Service in industrial robotics.
In contrast to these prior efforts, the platform introduced in this paper combines real-time data collection over both Wi-Fi and 5G, simultaneous metric monitoring of connection quality and bandwidth, time-synchronized visualization in Grafana, Simultaneous localization and mapping (SLAM) enabled robotic mobility, and unified logging to InfluxDB for both live and post-run diagnostics. This dual-path telemetry architecture enables side-by-side performance comparison, visualization of packet-loss events, and robust fault tolerance through redundant communication. By integrating lessons from recent heterogeneous network studies, the presented framework provides a practical approach to realizing collaborative 5G/Wi-Fi operation for IIoT applications, bridging the gap between experimental multi-connectivity research and deployable industrial solutions.
3. Methodology
This section presents the design and deployment of a mobile robotic framework for real-time network performance monitoring. The system combines autonomous and supervised navigation with continuous measurement of Wi-Fi and 5G links, while synchronizing robot pose and power status to enable spatially contextualized analysis of wireless performance. All experiments were conducted in an operational electronics manufacturing environment with active machinery, metal structures, and personnel movement, introducing realistic interference and channel variation that can cause transient changes in network conditions. Rather than eliminating these factors, the framework is explicitly designed to capture their impact in situ, providing insight into the behaviour of heterogeneous wireless connectivity under real industrial conditions.
3.1. Robot Platform and Hardware Integration
The mobile robotic network monitoring platform is built on a Mecabot Pro made by Roboworks [35]. This platform integrates autonomous navigation, multi-modal sensing, and dedicated network performance measurement within a single system. The overall hardware architecture, including compute units, sensors, communication interfaces, and power distribution is shown in Figure 1, with the physical integration of the components illustrated in Figure 2.
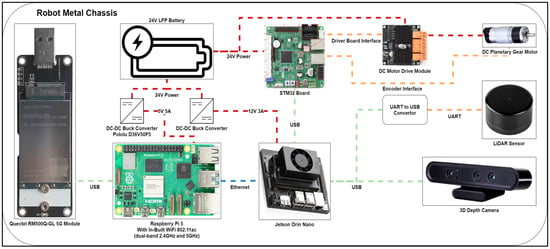
Figure 1.
Overall System Architecture of the Mobile Robotic Network Monitoring Platform.
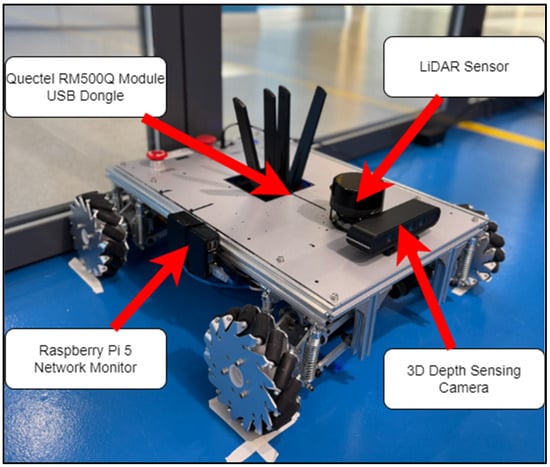
Figure 2.
Physical Integration of Network Monitoring and Robotic Sensing Hardware.
The platform is centred around two co-located compute nodes, the NVIDIA Jetson Orin Nano and the Raspberry Pi 5. The Jetson Orin Nano, running Ubuntu 22.04 with ROS 2 Humble and Python version 3.10, is responsible for perception and control. It interfaces with the LS LiDAR M10P (30 m range), Orbbec Astra 3D depth camera, and an STM32F103RC microcontroller for motor control, inertial sensing, and power management. This configuration supports omnidirectional motion via mecanum wheels, SLAM-based localization, and obstacle avoidance, while providing standard interfaces (Ethernet, CAN, serial, USB, HDMI) for extensibility.
The Raspberry Pi 5 is integrated as a dedicated edge node for network diagnostics and telemetry handling. Running Ubuntu 23.10 with a 2.4 GHz quad-core CPU, 8 GB DDR4 RAM, and NVMe SSD storage, it maintains a Gigabit Ethernet link to the Jetson Orin Nano for low-latency exchange of telemetry data. This Ethernet connection allows Wi-Fi and 5G NR performance metrics (via the onboard Wi-Fi and Quectel RM500Q-GL modem [36]) to be directly correlated with robot position and mission context, enabling location-aware assessment of wireless performance.
Both compute units share the Mecabot Pro’s 24 V, 6100 mAh Lithium Iron Phosphate (LFP) battery. A dedicated Pololu D36V50F5 DC-DC buck converter provides a regulated 5 V/5 A supply for the Raspberry Pi 5 [37]. Firmware and configuration settings (usb_max_current_enable = 1 in/boot/firmware/config.txt and PSU_MAX_CURRENT = 5000 in the EEPROM) are applied when the system is not powered by an official Raspberry Pi PSU to avoid limiting the maximum USB port current, ensuring that high-draw devices such as the 5G modem operate correctly and reliably.
This integrated hardware configuration establishes the foundation for the three-layer framework used in the remainder of this section. The Jetson Orin Nano implements the Perception and Control Layer, the Raspberry Pi 5 is responsible for the Edge Data Acquisition and Network Diagnostics Layer, and the on-premise infrastructure provides the Data Management and Visualization Layer.
3.2. System Overview and Data Flow Architecture
Figure 3 illustrates the logical data flow of the proposed three-layer framework, from perception and control on the Jetson Orin Nano through Edge Data Acquisition and Network Diagnostics Layer deployed on the Raspberry Pi 5, and a Data Management and Visualization Layer hosted on an on-premise server running InfluxDB and Grafana. This hierarchical design provides clear functional separation while maintaining synchronized telemetry across all components.
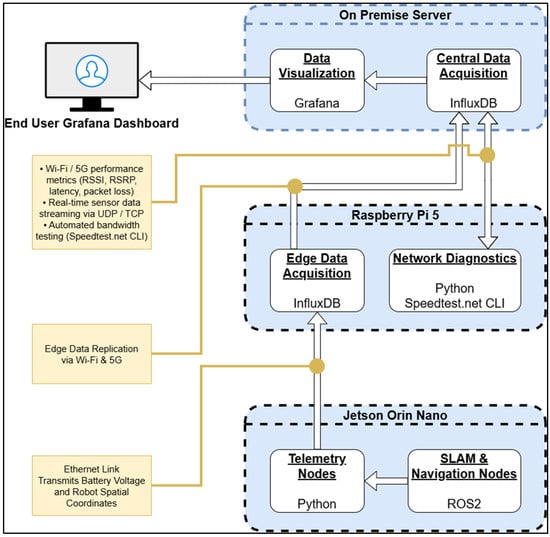
Figure 3.
Overview of the robotic network monitoring framework illustrating data flow from sensor capture and SLAM (Jetson Orin Nano) through edge diagnostics (Raspberry Pi 5) to centralized storage and visualization (InfluxDB and Grafana).
At the lower tier, the Perception and Control Layer manages robotic autonomy and environmental perception. Using the ROS 2 framework, the Jetson executes SLAM and navigation routines, processes sensor data from LiDAR, camera, and IMU modules. These ROS 2 nodes built on Python transmits telemetry which includes the robot position, and battery level via a dedicated Ethernet link to the Raspberry Pi 5. This connection provides a low-latency, high-reliability data path for internal communication.
The Edge Data Acquisition and Network Diagnostics Layer acts as an intermediary node, aggregating telemetry from the Jetson while continuously monitoring wireless performance of the Wi-Fi and 5G interfaces. Lightweight Python scripts periodically collect network and connection metrics, including signal strength (RSSI, RSRP), bit rate, frequency, and channel width for Wi-Fi, as well as cell ID, frequency, and signal quality for 5G. Neighbouring Wi-Fi network data are also recorded to assess local interference and overlapping coverage. Active performance indicators such as Internet Control Message Protocol (ICMP) and TCP latency, together with periodic bandwidth tests using the Speedtest.net CLI, are logged alongside passive metrics. Additionally, a synthetic sensor stream is generated at 5 Hz and transmitted via both UDP and TCP to evaluate potential data-loss events during robot mobility. Telemetry originating from the Jetson Orin Nano is stored locally on the Raspberry Pi InfluxDB instance. All network diagnostics and performance data generated on the Raspberry Pi are transmitted in real time to the central InfluxDB server via redundant Wi-Fi and 5G links. This layer also hosts an NTP server to maintain a unified time reference for all payloads originating from both the Raspberry Pi and Jetson Orin Nano, ensuring accurate timestamp correlation between robotic telemetry and network measurements.
At the upper tier, the Data Management and Visualization Layer consolidate telemetry and diagnostic data received from the Raspberry Pi into a centralized InfluxDB database, providing a unified repository for analysis and archival. The Raspberry Pi forwards network diagnostics in real time over Wi-Fi and 5G, while telemetry from the Jetson Orin Nano is replicated using the InfluxDB native Edge Data Replication function. Grafana dashboards visualize both network and robotic performance metrics in real time, presenting synchronized views of network metrics, network performance and spatial robot positioning. This unified platform enables live monitoring and post-deployment evaluation through a single interface, facilitating detection of network degradation or operational anomalies.
3.3. Perception and Control Layer (Jetson Orin Nano)
The Perception and Control Layer, implemented on the Jetson Orin Nano, is responsible for real-time robot control, localization, and battery voltage monitoring, providing the operational context used to spatially correlate network performance.
The robot’s real-time position is derived by continuously querying transformations between key coordinate frames, primarily from map to base link. The map frame provides a reference point in the world, while the base link frame corresponds to the robot’s main body frame. Using a tf2_ros.Buffer and tf2_ros.TransformListener, the robot retrieves its current translation and rotation data. From the retrieved transform, the X and Y coordi-nates (translation) within the world are extracted, while the orientation (rotation) can be converted from quaternions into Euler angles to determine the robot’s heading (yaw).
At runtime, the Jetson initializes core subsystems for sensor acquisition, transform publication, and motion control, and can operate in both manual and autonomous modes. In manual mode, a teleoperation node allows an operator to directly command the robot for controlled tests or targeted inspection. In autonomous mode, SLAM and navigation nodes consume LiDAR and depth camera data to build and update the environment map while computing collision-free paths, enabling repeatable coverage and exploration without human input.
To provide time-synchronized telemetry for network analysis, a custom ROS 2 node continuously samples the robot’s pose from the tf2 tree and publishes timestamped coordinates at a typical rate of 4 Hz (250 ms). These data are logged locally on the Jetson as a backup and simultaneously forwarded to the Raspberry Pi, where they are ingested into InfluxDB for real-time visualization and post-run analysis. In parallel a second node subscribes to the/PowerVoltage topic to track battery voltage and uses the same dual-path strategy of local logging and forwarding to the Raspberry Pi. This power monitoring capability supports energy-aware operation and enables safe intervention, such as returning to a charging location when voltage falls below a defined threshold.
Through this architecture, the Perception and Control Layer delivers reliable, high-resolution pose and power telemetry tightly coupled with the robot’s motion and environment, forming the spatial reference against which Wi-Fi and 5G network performance is evaluated in subsequent layers.
3.4. Edge Data Acquisition and Network Diagnostics Layer (Raspberry Pi 5)
The Edge Data Acquisition and Network Diagnostics Layer is implemented on the Raspberry Pi 5 and functions as the intermediary between the mobile robot and the on-premise data centre, as depicted in the data flow diagram in Figure 3. While the Jetson Orin Nano is dedicated to perception and control, the Raspberry Pi 5 is responsible for:
- Executing interface-specific routing over Wi-Fi and 5G NR;
- Monitoring wireless link status and surrounding RF conditions;
- Measuring end-to-end network performance;
- Evaluating multipath transmission strategies;
- Replicating spatial and system health telemetry to the central InfluxDB instance.
All services on the Raspberry Pi 5 are implemented as lightweight Python processes that continuously poll local interfaces and tools. Their outputs are parsed into structured JSON payloads with the appropriate metadata added relating to communication protocol used and measurement type, this is then written to InfluxDB. This design produces a unified, time-aligned dataset for fair comparison of Wi-Fi and 5G while remaining logically decoupled from the robot’s control stack.
A distinctive aspect of this platform is the use of parallel measurements over Wi-Fi and 5G for most experiments (excluding bandwidth tests), enabling direct comparison of both technologies under identical spatial and timing conditions. Operating both links concurrently on a single mobile node introduces challenges not present when testing each interface separately. To address this, the system employs interface-specific routing, dual IP addressing, strict tagging of all measurements, and time-synchronized telemetry, ensuring that traffic and events are unambiguously associated with the correct access technology. This avoids routing ambiguity and cross-contamination of results, mitigates bias arising from differing infrastructure densities (e.g., more Wi-Fi access points or additional 5G radio heads in separate setups), and provides a robust basis for side-by-side evaluation of heterogeneous connectivity in a live industrial environment. Moreover, concurrent operation of Wi-Fi and 5G aligns with emerging multi-connectivity strategies, where parallel use of heterogeneous links is explicitly employed to increase reliability and availability [12]. The presented platform therefore not only enables fair comparative assessment, but also serves as a realistic testbed for evaluating how Wi-Fi and 5G behave together in prospective multi-connectivity deployments.
3.4.1. Interface Configuration and Routing
To ensure that both Wi-Fi and 5G interfaces could reliably access the on-premise database, the database was positioned on a VLAN with firewall rules permitting traffic from both the isolated Wi-Fi and the 5G VLAN’s. The layout of this network is illustrated in Figure 4. To facilitate controlled and fair comparisons of network performance, including ICMP and TCP latency, throughput, and upload behaviour, a single server endpoint was used. This was achieved by assigning two static IP addresses to the on-premises server: 10.222.9.10 (for 5G access) and 10.222.9.11 (for Wi-Fi access). All server services, including InfluxDB, were configured to bind and listen on both IP addresses, ensuring consistent availability irrespective of the network path.
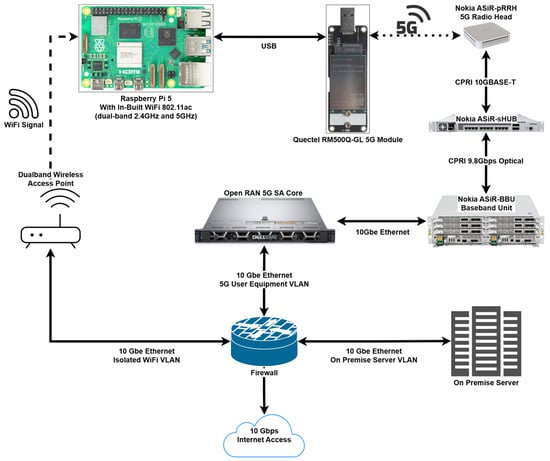
Figure 4.
Dual Wi-Fi and 5G Communication Architecture for Robotic Monitoring.
On the Raspberry Pi 5, static routes and hostname mappings were configured to direct traffic for each server address via the corresponding network interface. This approach ensures reproducible routing behaviour and supports precise, interface-aware performance benchmarking.
3.4.2. Network Connection Metrics Monitoring
To comprehensively characterize the wireless communication environment encountered by the mobile robotic platform, real-time connection metrics were captured for both the 5G NR and Wi-Fi links. Additionally, environmental scans of neighbouring Wi-Fi networks were conducted to assess local RF conditions, such as signal overlap and potential interference sources. Continuous monitoring of active link performance and surrounding Wi-Fi activity is critical for diagnosing communication issues, correlating network conditions to robotic behaviour, and informing optimization strategies. Table 1 outlines the key statistics gathered for each measurement campaign, and the subsequent subsections describe the methodology used for systematic acquisition and logging of these wireless connection metrics.

Table 1.
Connection Metrics Gathered per measurement campaign.
Wi-Fi
Wi-Fi connection metrics were acquired from the onboard wireless interface (wlan0) of the Raspberry Pi 5. Diagnostic data collection relied on the native Linux utilities iwconfig and iw, which provide detailed, real-time statistics on the wireless link state. These commands were invoked by a lightweight Python script implementing a recurring polling interval of approximately 350 milliseconds. System-level commands were executed using Python’s os library, while output parsing was performed using standard Unix text-processing tools (grep, sed, awk) to isolate the parameters summarised in Table 1. The resulting metrics were structured into JSON payloads and written to the on-premises InfluxDB time-series database using the InfluxDB client library. As iw requires elevated privileges, the acquisition script was executed with superuser permissions. Payloads were transmitted over both Wi-Fi and 5G interfaces to ensure resilience against individual link failures.
Wi-Fi Neighbouring Networks
In addition to monitoring the primary Wi-Fi link, the system periodically performs environmental scans to detect neighbouring access points and characterize the surrounding RF environment. Scans are executed on the Raspberry Pi 5 using the onboard wlan0 interface and the native iw utility, with the output parsed via the jc JSON parser to produce structured records. This provides insight into signal overlap, interference sources, and network density across the 2.4 GHz and 5 GHz bands. The acquisition pipeline follows the same pattern as the Wi-Fi link metrics, a lightweight Python script (using the os and InfluxDB client libraries) runs with superuser privileges, extracts the parameters summarised in Table 1, and encodes them as JSON arrays for insertion into the on-premises InfluxDB instance. Payloads are transmitted over both Wi-Fi and 5G interfaces to maintain redundancy and continuity of reporting. The scan-and-upload cycle operates at an interval of approximately 200 milliseconds, primarily constrained by the execution time of the iw dev wlan0 scan command on the Raspberry Pi 5.
5G NR
The network connection metrics for the 5G NR interface were obtained from the Quectel RM500Q-GL modem through the use of AT commands over a USB serial interface. When connected to a host system, the Quectel modem presents a USB serial device, facilitating diagnostic communication. The implementation of AT command queries was based on specifications outlined in the RG50xQ&RM5xxQ Series AT Commands Manual [38], with particular emphasis placed on the maximum command response times to define an appropriate polling interval of 350 milliseconds for reliable data acquisition. A lightweight Python script was developed to systematically acquire and store network performance metrics. Serial communication with the modem was managed using the pySerial library, while structured data ingestion into an on-premise InfluxDB time-series database was enabled using the InfluxDB client library. The AT + QENG = “servingcell” command was employed to retrieve real-time 5G NR connection statistics, with the parameters summarized in Table 1. Data were transmitted over both the 5G and Wi-Fi interfaces, ensuring continuity of measurement even in the event of a connection failure on either network.
3.4.3. Active Network Performance Monitoring
Accurate and continuous measurement of network performance is critical in mobile robotic systems that depend on stable connectivity for telemetry, control, and data streaming. Latency and bandwidth are two of the most important indicators of communication quality, influencing both responsiveness and reliability. By collecting inter-face-specific metrics over both 5G and Wi-Fi, the system enables quantitative assessment of real-time link performance under varying conditions.
Latency to Data Centre using ICMP
Latency performance metrics were obtained using ICMP to assess the responsiveness of the network paths between the Raspberry Pi 5 and the on-premises data centre. Measurements were collected continuously by two functionally identical Python scripts using the pythonping library, with interface-specific routing enforced via the static routes and hostnames (5G_route, WiFi_route) configured as described in Section 3.4.1.
Each script was bound to a single interface and issued ICMP echo requests with a 56-byte payload and a 2 s timeout at intervals of approximately 0.5 s. The resulting metrics for both 5G and Wi-Fi were parsed into JSON payloads and written to the on-premises InfluxDB time-series database. Data delivery was supported over both interfaces to preserve continuity and redundancy.
Latency to Data Centre using TCP
TCP-based latency measurements were implemented to complement the ICMP tests and provide an application-relevant view of end-to-end performance. This method evaluates the time required to complete a TCP handshake with the on-premises data centre server, offering a directly comparable RTT while more closely reflecting typical industrial communication patterns.
Two Python scripts were used, each bound to a specific interface via the static routing and hostname configuration described in Section 3.4.1, with one targeting 5G route and the other WiFi route. Both scripts connected to the same server that hosts the InfluxDB instance, ensuring that latency characteristics for 5G and Wi-Fi were measured under identical conditions.
For each measurement, timestamps were recorded immediately before and after initiating a TCP connection using Python’s socket library. The elapsed time between these events was taken as the TCP latency. Measurements were performed at intervals of approximately 0.5 s. As TCP implicitly retries failed connection attempts, this method does not provide explicit packet loss estimates, instead, sporadically elevated connection times may indicate transient loss or congestion but cannot be uniquely attributed.
The resulting TCP latency metrics were formatted as JSON payloads and written to the on-premises InfluxDB time-series database. Data delivery over both interfaces ensured continuity and redundancy.
Bandwidth Monitoring
To further characterize end-to-end network performance, the system incorporates pe-riodic bandwidth and jitter measurements using the Speedtest.net Command Line Inter-face (CLI) for Linux [39]. This approach provides an application-level view of network ca-pacity and stability, complementing the ICMP and TCP-based latency metrics previously described.
Two Python scripts were developed, each identical in structure but bound to either the WiFi or 5G network interface. Each script invokes the Speedtest CLI with a 60 s interval between tests to avoid triggering rate-limiting mechanisms. Both the 5G and WiFi tests are conducted at separate times and do not overlap to eliminate CPU and I/O saturation on the Raspberry Pi. All measurements are conducted against one single Speedtest.net server provider to ensure consistency across test runs and eliminate variability due to changes in server location or load.
Each test captures the following information: latency measurements taken prior to the bandwidth tests, including mean latency, jitter, and the minimum and maximum observed latency values. The download and upload assessments provide measurements of throughput (in bytes per second), total data volume transferred, and test duration. Additionally, each test records latency distribution characteristics during data transfer, including the interquartile mean, jitter, and the maximum and minimum latency values.
The results for each network interface were parsed, structured into JSON-formatted objects, and transmitted to the on-premises InfluxDB time-series database. To enhance resilience and maintain continuity, database uploads were performed concurrently over both the Wi-Fi and 5G interfaces.
3.4.4. Real-Time Sensors Streaming over Multipath Networks
To evaluate the performance of real-time telemetry over both 5G and Wi-Fi using different transport protocols, a multipath communication experiment was implemented in which identical sensor data streams are transmitted concurrently across four paths: TCP over Wi-Fi, TCP over 5G, UDP over Wi-Fi, and UDP over 5G. This setup emulates an IIoT telemetry pipeline representative of mobile robot operation and traffic management scenarios.
Dynamic system metrics from the Raspberry Pi 5, CPU temperature and fan PWM duty cycle were streamed at 5 Hz, corresponding to a 200 ms transfer interval and a payload size of approximately 40 bytes per message. This operating point was chosen to align with 3GPP TS 22.104 [27], within the technical standard Table A.2.2.3-1. This table has four uses cases, the sensor stream used here refers specifically to use case 3. This is used for periodic communication for standard mobile robot operation and traffic management, which specifies a message size on the order of 40 bytes and a target transfer interval in the range of 40–500 ms with reliability of 99.9%. The selected 200 ms interval and payload size therefore sit squarely within the standardized bounds and provide a representative workload for evaluating the behaviour of the underlying network and protocol stack.
Each packet written to InfluxDB is tagged with its network interface (Wi-Fi or 5G) and transport protocol (TCP or UDP), ensuring that concurrent streams remain distinguishable even when timestamps overlap. This tagging preserves dataset integrity and enables precise attribution of observed effects to specific communication paths.
Visualization and analysis are performed using Grafana dashboards, offering real-time and historical views of all four streams. Under degraded network conditions, TCP-based streams benefit from retransmission mechanisms and typically appear continuous. In contrast, UDP lacking such guarantees is more susceptible to packet loss, particularly when transmitted in unstable network conditions, which manifests as visible gaps in the Grafana visualizations, offering a clear, empirical contrast in protocol resilience while the robotic platform is in motion. This standards-informed experiment provides a clear empirical comparison of protocol robustness and interface performance for periodic mobile robot telemetry consistent with 3GPP requirements.
3.4.5. Concurrent Data Ingestion to InfluxDB
To enable simultaneous, low-latency data transmission across all protocol-interface combinations without introducing execution bottlenecks, the system utilizes parallel sub-processes in Python. Each subprocess spawned via the subprocess.Popen() method, is dedicated to managing data delivery over a specific transport protocol (TCP or UDP) and network interface (Wi-Fi or 5G), ensuring fully non-blocking and concurrent operation. Monitoring metrics are encapsulated within structured JSON payloads, each stamped with a unified UTC timestamp which ensures synchronization and consistency across all transmission routes.
This subprocess communication strategy is employed consistently throughout the system wherever data is routed simultaneously over both 5G and Wi-Fi, as described in the preceding sections. A critical aspect of ensuring compatibility with the InfluxDB in-gestion model is the use of coordinated timestamping and consistent tag-field structures. Specifically, each payload includes metadata tags identifying the network interface and transport protocol used. This differentiation is essential for preserving the integrity of parallel data streams.
3.5. Data Management and Visualization Layer (On-Premise Server & End User Dashboard)
The Data Management and Visualization Layer is hosted on an on-premise server that provides a centralized, time-synchronized view of all robotic and network telemetry. This layer runs the primary InfluxDB instance for long-term storage and analysis, and Grafana for dashboard-based visualization accessed via the end user dashboard.
All metrics generated by the Perception and Control Layer and the Edge Data Acquisition and Network Diagnostics Layer ultimately converge at this server. Network diagnostics (5G NR and Wi-Fi link metrics, neighbouring network scans, ICMP/TCP latency, bandwidth tests, and multipath telemetry results) are sent directly from the Raspberry Pi 5 to the central InfluxDB instance. Robot spatial and battery voltage data are stored on the Raspberry Pi’s local InfluxDB instance and replicated upstream using InfluxDB’s edge replication, ensuring continuity during transient uplink outages and preserving a complete global dataset.
Grafana, deployed alongside InfluxDB, serves as the primary interface for both live and historical analysis. Dedicated dashboards present synchronized views of key indicators including battery voltage, IIoT sensor streams, link quality metrics for Wi-Fi and 5G, ICMP and TCP latency, throughput, packet loss, and protocol/interface-specific performance. Side-by-side panels enable direct comparison between Wi-Fi and 5G and between TCP and UDP, supporting rapid identification of anomalies, transmission gaps, or degradation under dynamic conditions.
An additional dashboard overlays real-time X–Y coordinate data onto a 2D map of the facility. Signal strength, latency, and throughput values are sampled at corresponding positions and rendered as colour-coded markers. Users can inspect individual points and retrieve synchronized telemetry within a narrow time window, enabling granular, spatially contextualized assessment of wireless performance along the robot’s trajectory.
4. Results
The following results are presented to validate the effectiveness of the robotic platform’s integrated network monitoring architecture. These findings demonstrate how telemetry and network performance data were systematically collected, stored within the InfluxDB time-series database, and visualized through Grafana dashboards. The visualisation highlights key operational metrics and underscores the platform’s ability to deliver comprehensive, real-time insight into both network and robotic subsystems.
4.1. Background
The experimental deployment took place within a smart manufacturing testbed, shown in Figure 5 below. This facility serves as a state-of-the-art Industry 4.0 environment, incorporating advanced automation technologies and smart manufacturing infrastructure. The testbed is equipped with two primary wireless communication systems: a dedicated private 5G network and enterprise-grade dual-band Wi-Fi access points, ensuring robust and continuous wireless connectivity across the entire operational area.
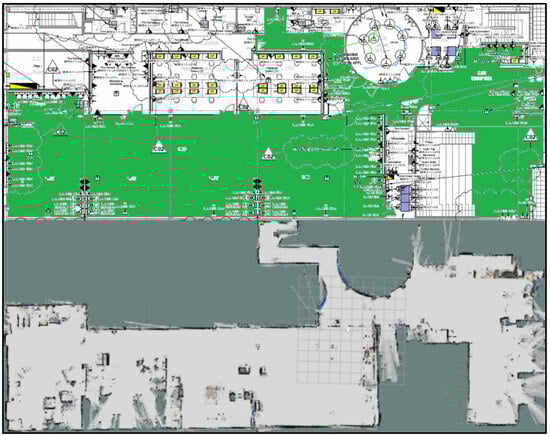
Figure 5.
Robotic platform operational area within the smart manufacturing testbed. The top panel shows the floor plan with the explored area marked in green; the bottom panel shows the SLAM-generated map from the robot’s sensors.
Figure 5 also illustrates how the robotic platform perceives its operating environment. The map is generated using data from the onboard LiDAR and 3D depth camera, and this is visualized in Rviz which is a 3D visualization tool for ROS 2. Obstacles and walls are represented as blank space in the 2D map, while in 3D view, the structure and colour of the walls are also rendered, providing a clearer spatial understanding of the environment for the remote operator.
4.2. Experimental Timeline & Platform Stability
The data acquisition process was conducted six times over the course of a single day. For analysis, each run is treated independently based on the robot’s active operational time, rather than aggregating results into a single summary dataset. During the initial four runs, the experiment stalled approximately 15 min into operation when the Raspberry Pi 5 became unresponsive. This behaviour was traced to insufficient power delivery under peak load conditions during bandwidth tests, which stressed the 5G, Wi-Fi, and CPU subsystems. The issue was resolved via the EEPROM and firmware modifications described in Section 3.1, ensuring stable 5 V/5 A supply to the Raspberry Pi 5.
Following this correction, the platform successfully completed subsequent runs of at least 42 min under sustained high-load conditions without failure. In these runs, data collection was stopped not due to system instability but because the robot had fully traversed and characterized the intended measurement area, and importantly the battery level had degraded, so the robot initiated a return to base operation. Only these post-fix runs are reported in the results, as they were obtained using the finalized, stable system configuration and provide a representative view of the platform’s intended operational behaviour. The discarded runs reflect a misconfigured hardware state rather than the performance of the evaluated networks.
Of the final two runs, only one included active bandwidth testing. This was done to examine the impact of bandwidth-intensive probing on network performance, particularly latency. During the bandwidth-enabled run, buffer bloat effects were observed, leading to elevated latency, whereas the non-bandwidth run provided a baseline under typical monitoring load. As outlined in Section 3.4.3, bandwidth tests were executed intermittently to avoid external rate limiting and to allow observation of latency behaviour both during and between high-load intervals.
4.3. Grafana Dashboards
The Grafana dashboards presented in this paper support three primary modes of data visualization, which are discussed in the sections that follow. These dashboards highlight not only how live and historical data are represented, but also how spatial information is correlated with network diagnostic metrics.
Given the importance of accurate temporal alignment when interpreting telemetry, it is essential to demonstrate how time ranges and refresh intervals are configured. Figure 6 illustrates the Grafana interface for selecting the date, time range, and automatic refresh settings for live data monitoring.
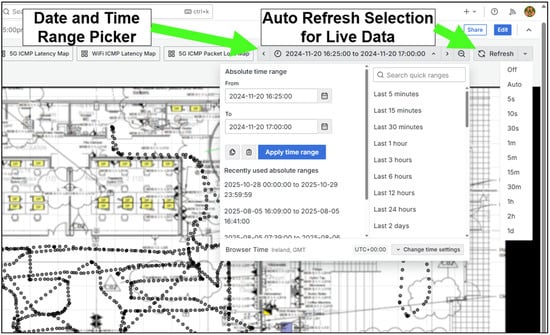
Figure 6.
Grafana dashboard interface for selecting date, time and data refresh interval.
4.3.1. XY Coordinate Map—Relating Position to Network Statistics
The first visualization type is the XY coordinate map, which serves as the primary interface for spatially navigating telemetry data. This chart allows users to observe all recorded data points either in real time or during post-analysis. The default view displays the robot’s X-Y position and battery voltage.
Clicking on a data point within the chart reveals detailed metadata, including precise coordinates, timestamp, and battery voltage at that specific location. Additionally, users can retrieve a “Data Snapshot”, which displays correlated diagnostic metrics, such as latency, signal quality, and bandwidth, for a ±5 s window surrounding the selected timestamp. This feature enables precise position-based investigation of network conditions. Mapped data is also available in a sortable table, allowing users to rank values by metric (e.g., battery voltage or position) and efficiently identify key anomalies or critical events. Figure 7 below demonstrates these interactive features.
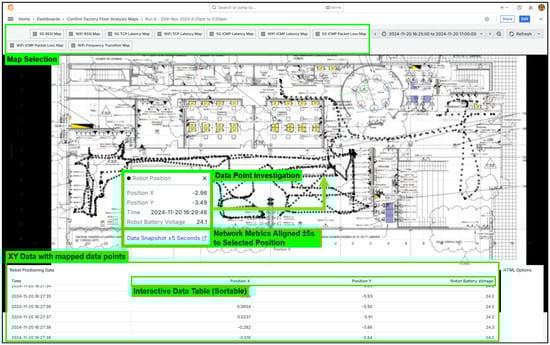
Figure 7.
Grafana dashboard XY chart interface features.
For targeted analysis, operators can narrow the scope of displayed data to a specific region of the factory floor by adjusting the date and time range using Grafana’s built-in time range selector. This feature, shown earlier in Figure 7, enables users to isolate shorter time windows corresponding to defined robot trajectories or events of interest, improving diagnostic focus and reducing visual clutter in high-density data sessions.
Beyond the default battery voltage overlay, users can select alternative metrics from the map selection interface located at the top of the dashboard. These include RSSI (with RSRP used for 5G), TCP latency, ICMP latency, ICMP packet loss, and bandwidth monitoring. In addition, Wi-Fi includes a dedicated frequency transition map that identifies locations where the robot switched access points.
A key feature of these maps is the spatially scaled, color-coded representation of metric intensity, allowing users to visually assess performance variations along the robot’s trajectory. For instance, low-latency or strong-signal areas appear in green, with the gradient shifting toward red as the robot moves into regions with higher latency or weaker signal strength. Figure 8 illustrates this behaviour using the 5G RSRP overlay. Depending on the selected dataset, additional metric, such as SINR, frequency, and channel width, may also be displayed, enabling more comprehensive network diagnostics.
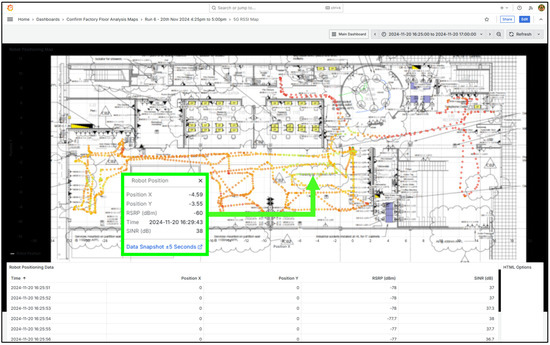
Figure 8.
Grafana dashboard XY chart showing 5G RSRP values with colour-coded mapping.
4.3.2. Multiple Panel Data Snapshot Analysis—Live and Post Run Diagnostics
As described in Section 4.3.1, the XY chart includes a feature known as Data Snapshot, which enables users to inspect all relevant telemetry collected within a ±5 s window surrounding a selected data point. This functionality is particularly useful for understanding how various metrics transition over time, especially in response to anomalies detected on the XY chart. A clear use case of this feature is demonstrated with the Wi-Fi Frequency Transition Map, where all XY positions are visualized but only those involving a change in the connected Wi-Fi access point are highlighted in red. This allows for immediate identification of roaming events. Figure 9 illustrates a data snapshot corresponding to one such Wi-Fi transition event.
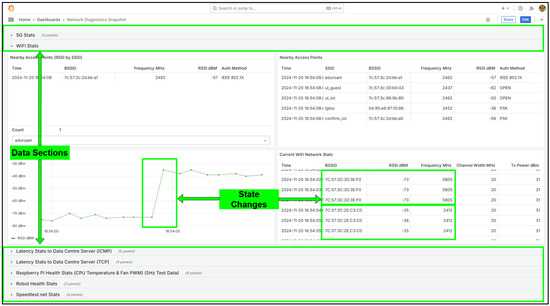
Figure 9.
Grafana dashboard for analysing data snapshots example use case.
This multi-panel dashboard supports both real-time and post-mission analysis, making it a valuable tool for diagnosing system behaviour and identifying the underlying causes of changes observed in the XY chart. The other panels on this dashboard include data for 5G signal metrics, latency, packet loss, bandwidth usage, IIoT stream health, and robot battery voltage, this enables comprehensive correlation between network performance and robotic system status, this is described in more detail in the next section.
4.3.3. Multiple Panel Analysis—Post Run Data Analysis
The final visualization mode supports comprehensive post-run analysis. This dashboard includes the full timeline of the robot’s deployment session. Operators can review continuous telemetry across all metrics or zoom into specific time intervals by selecting regions directly on any graph. This dashboard compiles all major data sources described in the Section 3 and is summarized in Table 2 below. Metrics include detailed 5G and Wi-Fi connection statistics, ICMP and TCP latency performance, Raspberry Pi IIoT stream health, robot battery voltage, and bandwidth testing results.
Table 2.
Grafana Post Run Dashboard Output and Descriptions.
This dashboard allows operators to evaluate how network performance evolves throughout the robot’s operational period, this is particularly important when dealing with roaming behaviour and transitions between wireless infrastructure such as 5G and Wi-Fi. By combining system-level health data with network-level telemetry, this analysis offers a holistic view of platform performance.
4.4. Grafana Dashboard Analysis Scenarios
This section presents three representative use cases demonstrating how the Grafana dashboards can be applied to analyse network connectivity and performance anomalies. While many other use cases exist, the examples highlighted here showcase the practical utility and diagnostic capabilities of the system.
4.4.1. Latency Comparison—5G vs. Wi-Fi
The first scenario involves comparing ICMP latency performance across 5G and Wi-Fi communication channels using Grafana’s XY chart visualization. These charts allow latency to be spatially interpreted, with colour gradients representing latency intensity. Figure 10 presents the latency colour scale used in the dashboard. Although displaying this scale is optional, individual data point values can also be inspected by clicking directly on the data points on the chart.

Figure 10.
Latency colour scale for Grafana XY chart visualizations.
Figure 11 shows the XY chart for 5G ICMP latency performance during Run 6. Despite the wide coverage area, latency values are generally low, with most measurements falling between 10–20 ms. A few samples fall below 10 ms, and only a limited number exceed 30 ms, indicating high consistency in latency across the robot’s trajectory.
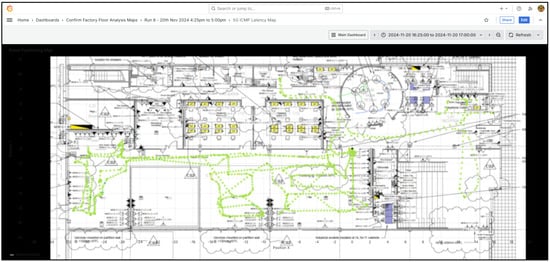
Figure 11.
Grafana 5G ICMP Latency XY Map for Run 6.
In comparison, Figure 12 displays the XY chart for Wi-Fi ICMP latency. While a significant number of data points show excellent performance in the 1–5 ms range, there are considerably more outliers with elevated latency, as well as clear indicators of packet loss. This suggests that while Wi-Fi may achieve lower average latency, its performance is less stable, particularly in mobile contexts, compared to the more consistent behaviour of 5G across large operational areas.
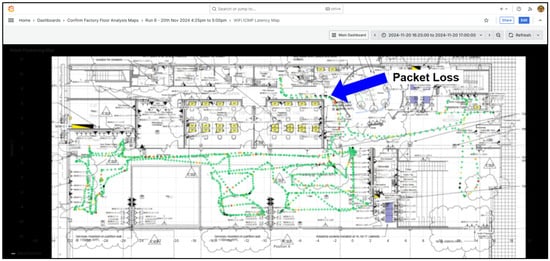
Figure 12.
Grafana Wi-Fi ICMP latency XY chart for Run 6, highlighting packet loss events.
To further investigate the packet loss area identified in Figure 13, the Data Snapshot feature was used to examine conditions at the specific area on the map. As shown in Figure 13, the event corresponds to a Wi-Fi roaming transition, during which the Raspberry Pi switched to a different access point. This is identified by the change in BSSID and Frequency on the current Wi-Fi network. At the time of handover, the signal strength was notably weak, which likely contributed to the observed packet loss.
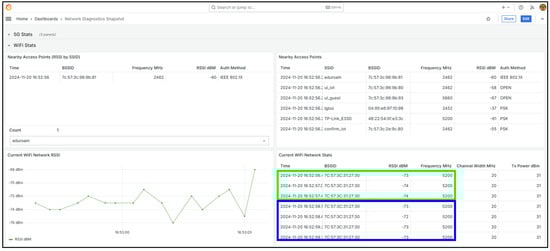
Figure 13.
Grafana Data Snapshot of a packet loss region showing a Wi-Fi access point transition event.
For a comprehensive protocol comparison, the post-run latency statistics can be used to assess long-term trends. Figure 14 summarizes the full-session ICMP latency metrics. While 5G shows a higher average latency (15.8 ms) compared to Wi-Fi (7.36 ms), its standard deviation is significantly lower (6.03 ms vs. 17.8 ms), this indicates more predictable performance. Additionally, no packet loss was observed on 5G, while Wi-Fi experienced 13 dropped ICMP packets. This difference is particularly important in use cases where UDP is used for critical sensor streams, as lost packets are not retransmitted, which potentially leads to gaps in telemetry.
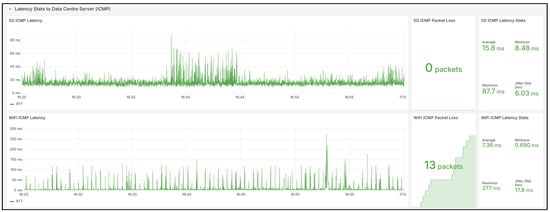
Figure 14.
Grafana Post Run Analysis on ICMP Latency for Run 6.
Although this scenario compares 5G and Wi-Fi, the methodology can be extended to evaluate any future wireless communication protocols that support ICMP or TCP traffic. The Grafana dashboard structure is flexible and can accommodate evolving connectivity technologies with minimal modification.
4.4.2. Bandwidth Comparison and Associated Latency Effects
The second scenario involves evaluating bandwidth availability across both Wi-Fi and 5G networks within the factory environment, a series of throughput measurements were conducted. These tests used the Speedtest.net platform, which connects to external WAN-based servers. This configuration ensured consistent testing conditions across both communication technologies, with the only difference being the last-hop medium, either Wi-Fi or 5G.
The dataset used for this analysis corresponds to Run 5, which covers a slightly smaller area of the facility compared to Run 6. The test area is shown in Figure 15, using the Wi-Fi RSSI map for context. Notably, no Wi-Fi roaming events were observed during this run, providing a stable environment for performance comparison. The highlighted data point in Figure 15 indicates a strong Wi-Fi signal, with an RSSI of −44.5 dBm. At this point, the Raspberry Pi 5 was connected to the 5 GHz Wi-Fi network operating on 5200 MHz with a 20 MHz channel width.
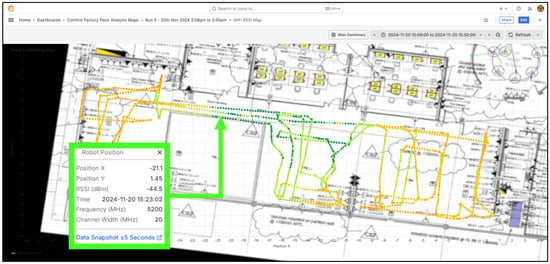
Figure 15.
Grafana Wi-Fi RSSI XY Map for Run 5, showing test area and signal strength.
The bandwidth test results are presented in Figure 16. While upload speeds were similar between Wi-Fi and 5G, ranging from approximately 60 to 70 Mbps, the download performance of 5G was significantly superior. The 5G link achieved download speeds approaching 500 Mbps, representing a substantial improvement over Wi-Fi. Pre-test latency statistics for 5G were also more consistent, exhibiting stable average, minimum, maximum, and standard deviation values across multiple trials.
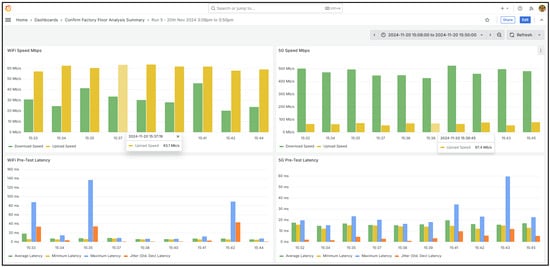
Figure 16.
Grafana Bandwidth Statistics for Run 5 Wi-Fi and 5G.
To assess the impact of bandwidth testing on communication latency, Figure 17 presents TCP latency measurements from the mobile platform to the data centre during the bandwidth tests. While 5G exhibited a higher average latency (32.3 ms) compared to Wi-Fi (18.4 ms), it maintained a lower maximum latency (1120 ms vs. 1370 ms) and a significantly lower standard deviation (48.9 ms vs. 66.0 ms). These results suggest that while both networks are affected by buffer bloat during high-bandwidth usage, 5G offers more consistent and predictable performance. Peaks in latency graphs clearly correlate with the periods when bandwidth tests were active, confirming that test activity introduces transient network load.
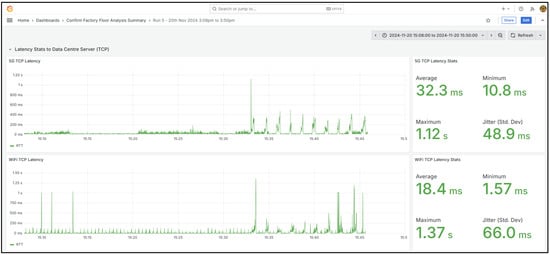
Figure 17.
Grafana Post Run Analysis on TCP Latency for Run 6.
The considerable download speed advantage of 5G can be partially attributed to its wider channel bandwidth of 60 MHz compared to the 20 MHz channel used by Wi-Fi in this scenario. However, it is important to emphasize that 5G achieved more than a threefold increase in download throughput over Wi-Fi, highlighting its potential for high-data-rate applications in mobile robotic systems.
4.4.3. IIoT Stream Health Comparison
This third scenario demonstrates the Grafana dashboard’s capability to detect and analyse communication degradation in IIoT telemetry streams. Specifically, it focuses on the continuity of a high-frequency (5 Hz) data stream consisting of CPU temperature and fan PWM speed readings from the Raspberry Pi. These metrics are transmitted to the database over four distinct network paths: TCP over 5G, TCP over Wi-Fi, UDP over 5G, and UDP over Wi-Fi.
The dataset for this analysis is derived from Run 6, during which the robot traverses a large portion of the facility which increase the likelihood of handovers between Wi-Fi access points and 5G radio heads. Figure 18 illustrates the data continuity analysis. Clear interruptions in the expected green signal trace are visible for Wi-Fi, this indicates packet loss events. In total, 20 sensor readings were lost, and the visible disruption windows marked in green on the data table on the dashboard.
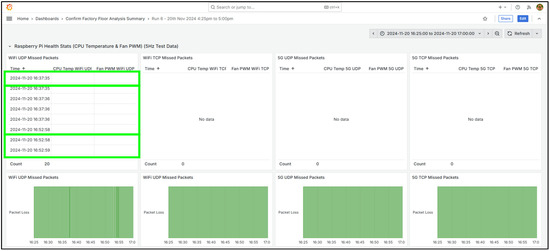
Figure 18.
Grafana Sensor Data Continuity Analysis for Run 6.
By correlating the loss timestamps with the XY positional chart and using the Data Snapshot feature, it was possible to identify the specific network events causing these communication drops. Table 3 summarizes the four identified periods of packet loss, along with the inferred causes and locations visualized through the dashboard.
Table 3.
Grafana Sensor Data Root Cause Analysis.
This result is particularly significant. The dashboard successfully illustrated three out of four loss events as direct outcomes of Wi-Fi roaming, with the fourth linked to a possible fallback to a more interference-prone 2.4 GHz band. The ability to visually pinpoint the timing, location, and cause of packet loss highlights the practical value of the system, not only for real-time monitoring but also for informed network protocol selection in mobile industrial environments.
In contrast, no packet loss is observed on the private 5G paths (TCP or UDP) for the same 5 Hz stream along the same trajectory. In the evaluated deployment, the 5G network operates as a SFN with seamless mobility support, avoiding the AP-style handover gaps that impact the Wi-Fi UDP stream. This side by side observation illustrates how mobility and roaming behaviour directly affect datagram-based IIoT traffic on Wi-Fi, while the 5G link remains stable under the same conditions.
From an application perspective, these results underline that best effort UDP over Wi-Fi is vulnerable to brief but significant gaps during roaming, which may be unacceptable for safety-critical control or strict real-time signalling unless complemented by redundancy in the form of multi-connectivity. This is particularly relevant in the context of 3GPP TS 22.104 [27] service performance requirements, where mobile robotic and motion control applications typically target end-to-end reliabilities on the order of 99.9% or higher; even short roaming-induced outages can violate such constraints.
The integrated dashboard is essential here, by unifying transport continuity, link metrics, and spatial context, it enables rapid root cause analysis of packet loss events and supports informed selection and configuration of wireless technologies for mobile industrial IIoT deployments.
5. Conclusions
This study demonstrates the feasibility and effectiveness of equipping a mobile robotic platform with integrated hardware and software components for real-time network diagnostics in industrial environments. The proposed system supports simultaneous data collection over both Wi-Fi and private 5G networks, enabling comprehensive performance evaluation under realistic operational conditions. By embedding network telemetry capabilities directly into a SLAM-enabled ROS 2-based platform, the robot facilitates real-time diagnostics, dual-interface redundancy, and seamless communication switching. This architecture provides a more resilient communication platform for large environments, while also supporting interoperable operation across multiple communication protocols commonly deployed in smart factory settings.
The architecture supports spatially resolved, high-frequency telemetry logging with all data persistently stored in a time-aligned InfluxDB database and visualized through Grafana dashboards. This approach allows both live and retrospective analysis of key network parameters such as latency, signal strength, packet loss, bandwidth, and network roaming events.
Deployment within a live smart manufacturing testbed validated the system’s robustness and diagnostic utility. Results from multiple test runs revealed clear distinctions in performance across wireless interfaces, it was seen that Wi-Fi demonstrated lower average latency but exhibited packet loss during roaming transitions, while private 5G maintained uninterrupted communication with no observed loss events, highlighting its suitability for mission-critical IIoT applications.
The system’s various graph visualizations and time-correlated data snapshots provides engineers with actionable insights by linking observed network anomalies to robot position and mobility behaviour. This capability is particularly valuable for optimizing wireless infrastructure, evaluating protocol performance, and diagnosing real-time telemetry issues in mobile industrial robotics.
Overall, this work provides a scalable, modular, and extensible framework for data driven wireless diagnostics in mobile platforms. It supports both operational monitoring and research applications, laying the groundwork for future integration of adaptive communication strategies, network-aware navigation, and autonomous recovery mechanisms in Industry 4.0 environments.
Author Contributions
Conceptualization, W.O., S.M. and E.O.; methodology, W.O.; software, W.O. and M.P.; formal analysis, W.O.; data curation, M.P.; writing—original draft preparation, W.O. and E.O.; writing—review and editing, A.D., M.P. and S.M.; visualization, A.D.; project administration, W.O.; funding acquisition, E.O. All authors have read and agreed to the published version of the manuscript.
Funding
This research was funded by Science Foundation Ireland.
Data Availability Statement
The data presented in this study are available on request from the corresponding author.
Acknowledgments
The authors would like to thank the staff of the Electronic and Computer Engineering Department at the University of Limerick for their assistance. The authors would also like to acknowledge resources made available by Science Foundation Ireland through the grant award (16/RC/3918) to the Confirm Centre for Smart Manufacturing.
Conflicts of Interest
The authors declare no conflicts of interest.
References
- Aijaz, A. Private 5G: The future of industrial wireless. IEEE Ind. Electron. Mag. 2020, 14, 136–145. [Google Scholar] [CrossRef]
- Kabir, H.; Tham, M.-L.; Chang, Y.C. Internet of robotic things for mobile robots: Concepts, technologies, challenges, applications, and future directions. Digit. Commun. Netw. 2023, 9, 1265–1290. [Google Scholar] [CrossRef]
- Rischke, J.; Sossalla, P.; Itting, S.; Fitzek, F.H.; Reisslein, M. 5G campus networks: A first measurement study. IEEE Access 2021, 9, 121786–121803. [Google Scholar] [CrossRef]
- O’Brien, W.; Penica, M.; Hayes, M.; O’Connell, E. Capacity Analysis: The potential of the wireless factory of the future. In Proceedings of the 2023 34th Irish Signals and Systems Conference (ISSC), Dublin, Ireland, 13–14 June 2023; pp. 1–5. [Google Scholar]
- Mezzavilla, M.; Zhang, M.; Polese, M.; Ford, R.; Dutta, S.; Rangan, S.; Zorzi, M. End-to-end simulation of 5G mmWave networks. IEEE Commun. Surv. Tutor. 2018, 20, 2237–2263. [Google Scholar] [CrossRef]
- Arendt, C.; Böcker, S.; Schippers, H.; Ploch, T.; Kuhn, M.; Venjakob, V.; Hunger, S.; Wietfeld, C. Towards Future Industrial Connectivity: Evaluation of Private 5G and Wi-Fi Networks in Professional Industrial Environments. In Proceedings of the 2025 IEEE 21st International Conference on Factory Communication Systems (WFCS), Rostock, Germany, 10–13 June 2025. [Google Scholar]
- Kehl, P.; Ansari, J.; Jafari, M.H.; Becker, P.; Sachs, J.; König, N.; Göppert, A.; Schmitt, R.H. Prototype of 5G integrated with TSN for edge-controlled mobile robotics. Electronics 2022, 11, 1666. [Google Scholar] [CrossRef]
- Paasch, C.; Detal, G.; Duchene, F.; Raiciu, C.; Bonaventure, O. Exploring mobile/WiFi handover with multipath TCP. In Proceedings of the 2012 ACM SIGCOMM Workshop on Cellular Networks: Operations, Challenges, and Future Design, Helsinki, Finland, 13 August 2012; pp. 31–36. [Google Scholar]
- Prados-Garzon, J.; Ameigeiras, P.; Ordonez-Lucena, J.; Muñoz, P.; Adamuz-Hinojosa, O.; Camps-Mur, D. 5G non-public networks: Standardization, architectures and challenges. IEEE Access 2021, 9, 153893–153908. [Google Scholar] [CrossRef]
- Mogensen, R.S.; Damsgaard, S.B.; Rodriguez, I.; Berardinelli, G.; Fink, A.E.; Kolding, T.E.; Pocovi, G. A novel QoS-aware multi-connectivity scheme for wireless IIoT. IEEE Access 2022, 10, 104123–104134. [Google Scholar] [CrossRef]
- 802.11r-2008; IEEE Standard for Information Technology—Local and Metropolitan Area Networks–Specific Requirements—Part 11: Wireless LAN Medium Access Control (MAC) and Physical Layer (PHY) Specifications Amendment 2: Fast Basic Service Set (BSS) Transition. IEEE: Washington, DC, USA, 2008; pp. 1–126, (Amendment to IEEE Std 802.11-2007 as amended by IEEE Std 802.11k-2008). [CrossRef]
- Segura, D.; Damsgaard, S.B.; Kabaci, A.; Mogensen, P.; Khatib, E.J.; Barco, R. An empirical study of 5G, wi-Fi 6 and multi-connectivity scalability in an indoor industrial scenario. IEEE Access 2024, 12, 74406–74416. [Google Scholar] [CrossRef]
- O’Brien, W.; Dooley, A.; Penica, M.; Moore, D.; O’Connell, E. Performance Benchmarking of Private 5G Networks. Comput. Netw. 2025, 272, 111693. [Google Scholar] [CrossRef]
- Open Robotics. ROS—Robot Operating System. Available online: https://www.ros.org/ (accessed on 23 May 2025).
- NVIDIA Corporation. Jetson Orin Nano Super Developer Kit. Available online: https://www.nvidia.com/en-us/autonomous-machines/embedded-systems/jetson-orin/nano-super-developer-kit/ (accessed on 23 May 2025).
- Raspberry Pi. Raspberry Pi 5. Available online: https://www.raspberrypi.com/products/raspberry-pi-5/ (accessed on 23 May 2025).
- InfluxData Inc. InfluxDB Time Series Data Platform. Available online: https://www.influxdata.com/ (accessed on 23 May 2025).
- Grafana Labs. Grafana. Available online: https://grafana.com/ (accessed on 23 May 2025).
- Leppänen, T. Data Visualization and Monitoring with Grafana and Prometheus. Bachelor’s Thesis, Turku University of Applied Sciences, Turku, Finland, 2021. [Google Scholar]
- O’Brien, W.; Dooley, A.; Penica, M.; Moore, D.; O’Connell, E. Evaluating Communication Performance in Private 5G Smart Factory Deployments. In Proceedings of the 2025 36th Irish Signals and Systems Conference (ISSC), County Donegal, Ireland, 9–10 June 2025; pp. 1–8. [Google Scholar]
- Arendt, C.; Fricke, S.; Böcker, S.; Wietfeld, C. Distributed performance evaluation of 5G and Wi-Fi for private industrial networks. In Proceedings of the 2024 IEEE 35th International Symposium on Personal, Indoor and Mobile Radio Communications (PIMRC), Valencia, Spain, 2–5 September 2024; pp. 1–7. [Google Scholar]
- O’Brien, W.; Hayes, M.; Penica, M.; McCann, J.; Moore, D.; O’Connell, E. Evaluation of private 5G in smart automation applications. In Proceedings of the 2022 IEEE 8th World Forum on Internet of Things (WF-IoT), Yokohama, Japan, 26 October–11 November 2022; pp. 1–2. [Google Scholar]
- Clancy, J.; Mullins, D.; Deegan, B.; Horgan, J.; Ward, E.; Denny, P.; Eising, C.; Jones, E.; Glavin, M. Feasibility study of V2X communications in initial 5G NR deployments. IEEE Access 2023, 11, 75269–75284. [Google Scholar] [CrossRef]
- Zulkifley, M.A.; Behjati, M.; Nordin, R.; Zakaria, M.S. Mobile network performance and technical feasibility of LTE-powered unmanned aerial vehicle. Sensors 2021, 21, 2848. [Google Scholar] [CrossRef]
- Sossalla, P.; Rischke, J.; Baier, F.; Itting, S.; Nguyen, G.T.; Fitzek, F.H. Private 5G solutions for mobile industrial robots: A feasibility study. In Proceedings of the 2022 IEEE Symposium on Computers and Communications (ISCC), Rhodes Island, Greece, 30 June–3 July 2022; pp. 1–6. [Google Scholar]
- Maldonado, R.; Karstensen, A.; Pocovi, G.; Esswie, A.A.; Rosa, C.; Alanen, O.; Kasslin, M.; Kolding, T. Comparing Wi-Fi 6 and 5G downlink performance for industrial IoT. IEEE Access 2021, 9, 86928–86937. [Google Scholar] [CrossRef]
- ETSI TS 22 104; Service Requirements for Cyber-Physical Control Applications in Vertical Domains. ETSI: Nice, France, 2024.
- Wei, Y.R.; Sathiyamoorthi, J.; Rahman, M.; Janik, P. Mobile robots design for industrial applications in private 5g networks: Essential factors to consider. In Proceedings of the 2023 53rd European Microwave Conference (EuMC), Berlin, Germany, 19–21 September 2023; pp. 504–507. [Google Scholar]
- Roda-Sanchez, L.; Zanzi, L.; Li, X.; Garí, G.; Costa-Pérez, X. Network Digital Twin for 5G-Enabled Mobile Robots. In Proceedings of the 2025 IEEE Wireless Communications and Networking Conference (WCNC), Milan, Italy, 24–27 March 2025; pp. 1–6. [Google Scholar]
- de Oliveira Pereira, J.M. A Framework for 5G Network Data Analytics Function with Emphasis on Anomaly Detection. Master’s Thesis, Universidade Federal de Minas Gerais, Belo Horizonte, Brazil, 2024. [Google Scholar]
- Pandey, P.; Parasuraman, R. Empirical analysis of bi-directional wi-fi network performance on mobile robots in indoor environments. In Proceedings of the 2022 IEEE 95th Vehicular Technology Conference: (VTC2022-Spring), Helsinki, Finland, 19–22 June 2022; pp. 1–7. [Google Scholar]
- Bekele, B.E.; Tokarz, K.; Gebeyehu, N.Y.; Pochopień, B.; Mrozek, D. Performance Evaluation of UDP-Based Data Transmission with Acknowledgment for Various Network Topologies in IoT Environments. Electronics 2024, 13, 3697. [Google Scholar] [CrossRef]
- Meira, J.; Matos, G.; Perdigão, A.; Cação, J.; Resende, C.; Moreira, W.; Antunes, M.; Quevedo, J.; Moutinho, R.; Oliveira, J. Industrial Internet of things over 5G: A practical implementation. Sensors 2023, 23, 5199. [Google Scholar] [CrossRef] [PubMed]
- Fré, G.; Erman, B.; Di Martino, C. Data shower in electronics manufacturing: Measuring Wi-Fi 4, Wi-Fi 6, and 5G SA behavior in production assembly lines. In Proceedings of the 2023 53rd Annual IEEE/IFIP International Conference on Dependable Systems and Networks-Supplemental Volume (DSN-S), Porto, Portugal, 27–30 June 2023; pp. 14–20. [Google Scholar]
- Roboworks. Mecabot Pro. Available online: https://www.roboworks.net/store/p/mecabotpro (accessed on 23 May 2025).
- Quectel. 5G RM50xQ Series. Available online: https://www.quectel.com/product/5g-rm50xq-series (accessed on 3 June 2022).
- Pololu Corporation. 5V, 5.5A Step-Down Voltage Regulator D36V50F5. Available online: https://www.pololu.com/product/4091 (accessed on 8 September 2025).
- Quectel Wireless Solutions Co., Ltd. RG50xQ&RM5xxQ Series AT Commands Manual. Available online: https://forums.quectel.com/uploads/short-url/avUSxfJeKqWJzAie8wEZCshlXjm.pdf (accessed on 23 May 2025).
- Ookla LLC. Speedtest CLI: Internet Speed Test for the Command Line. Available online: https://www.speedtest.net/apps/cli (accessed on 23 May 2025).
- Aziz, T.; Abd Razak, M.R.; Ghani, N.E.A. The performance of different IEEE802. 11 security protocol standard on 2.4 GHz and 5GHz WLAN networks. In Proceedings of the 2017 International Conference on Engineering Technology and Technopreneurship (ICE2T), Kuala Lumpur, Malaysia, 18–20 September 2017; pp. 1–7. [Google Scholar]


Disclaimer/Publisher’s Note: The statements, opinions and data contained in all publications are solely those of the individual author(s) and contributor(s) and not of MDPI and/or the editor(s). MDPI and/or the editor(s) disclaim responsibility for any injury to people or property resulting from any ideas, methods, instructions or products referred to in the content. |
© 2025 by the authors. Licensee MDPI, Basel, Switzerland. This article is an open access article distributed under the terms and conditions of the Creative Commons Attribution (CC BY) license (https://creativecommons.org/licenses/by/4.0/).