Article

Environmental Factors in Structural Health Monitoring—Analysis and Removal of Effects from Resonance Frequencies

Faculty of Civil and Mechanical Engineering, Riga Technical University, Kipsalas Street 6A, LV-1048 Riga, Latvia
*
Author to whom correspondence should be addressed.
J. Sens. Actuator Netw. 2025, 14(2), 33; https://doi.org/10.3390/jsan14020033
Submission received: 24 February 2025 / Revised: 11 March 2025 / Accepted: 18 March 2025 / Published: 20 March 2025
(This article belongs to the Special Issue Fault Diagnosis in the Internet of Things Applications)

Abstract

:
Strategically important objects, such as dams, tunnels, bridges, and others, require long-term structural health monitoring programs in order to preserve their structural integrity with minimal downtime, financial expenses, and increased safety for civilians. The current study focuses on developing a damage detection methodology that is applicable to the long-term monitoring of such structures. It is based on the identification of resonant frequencies from operational modal analysis, removing the effect of environmental factors on the resonant frequencies through support vector regression with optimized hyperparameters and, finally, classifying the global structural state as either healthy or damaged, utilizing the Mahalanobis distance. The novelty lies in two additional steps that supplement this procedure, namely, the nonlinear estimation of the relative effects of various environmental factors, such as temperature, humidity, and ambient loads on the resonant frequencies, and the selection of the most informative resonant frequency features using a non-parametric neighborhood component analysis algorithm. This methodology is validated on a wooden two-story truss structure with different artificial structural modifications that simulate damage in a non-destructive manner. It is found that, firstly, out of all environmental factors, temperature has a dominating decreasing effect on resonance frequencies, followed by humidity, wind speed, and precipitation. Secondly, the selection of only a handful of the most informative resonance frequency features not only reduces the feature space, but also increases the classification performance, albeit with a trade-off between false alarms and missed damage detection. The proposed approach effectively minimizes false alarms and ensures consistent damage detection under varying environmental conditions, offering tangible benefits for long-term SHM applications.

1. Introduction

In structural damage detection based on operational modal analysis (OMA), damage-sensitive features (DSFs) are traditionally chosen to be modal parameters—resonant frequencies f , damping ratios ξ , and operational deflection shapes (ODSs) Φ. Although the inclusion of ODSs offers the benefits of damage localization, especially using various transformation schemes, among which continuous wavelet transform and mode shape curvature are the most popular, their identification procedure requires output from a relatively large number of sensors for a sufficient resolution. Therefore, for economic reasons, ODSs are not considered in many SHM campaigns that are conducted on large civil objects. Compared to resonant frequencies, damping ratio values exhibit a relatively large scatter due to uncertainty [1]. Damping ratios are, therefore, not commonly considered for long-term SHM purposes. On the other hand, the scientific literature has an abundance of sources on vibration-based damage detection, where resonant frequencies such as DSFs are used for global structural damage detection [2,3].
Apart from any information related to changes in the structural integrity of a monitored object, the collected structural response signals inevitably contain components related to operational loads and ambient environmental factors, such as temperature, humidity, wind speed, and so on [4]. These signal components have an undesirable effect—the values of the identified modal parameters are affected not only by damage, but also by the aforementioned environmental factors. It is well-known that the extent of environmental influence on the modal parameters is usually greater than that of damage, thereby overwhelming the true severity and often the fact of damage existence in monitored structures [5,6]. Among the various environmental factors, studies document that temperature has the most pronounced effect on DSFs, particularly frequencies [7]. In [8], the authors addressed the impact of climate change on the effectiveness of long-term damage detection for the Z-24 Bridge in Switzerland. A classifier rooted in machine learning was used for one-year data and tested with current and future data. The objective of the paper was to assess whether a competent machine learning algorithm for damage detection may become less competent because of the temperature increase caused by climate change. On the other hand, it is of interest to explore the effects of other environmental factors. Several studies have tackled this problem. In [9], a small-scale structure was used to reproduce the behavior of a tower of bridge column under seasonal thermal effects. A comparative study between approaches based on machine learning and cointegration was conducted, with the aim of detecting damage as early as possible. It was also pointed out that there are situations in which nonlinear relations between variables are prominent. Therefore, assumptions of linear cointegration theory may not be met. A case study monitoring a lattice tower was presented in [10]. The Spearman correlation coefficient was used as a tool to identify the primary influences of environmental factors such as temperature, global radiation, and wind speed on resonance frequencies in short-term monitoring. Although the Spearman correlation coefficient is less sensitive to outliers compared to the Pearson correlation coefficient, it will yield a value of one for all monotonically increasing functions. On the other hand, a combination of different environmental variables may not contribute to a monotonic increase or decrease in resonant frequency values. Thus, more complex nonlinear algorithms may need to be employed.
It is of high importance to remove the effects of environmental factors from the values of the monitored modal parameters. In the scientific literature, the removal of environmental factors from the monitored modal parameters has been achieved by two types of methods—explicit and implicit. In explicit methods, data on environmental variables are available [11]. Often, they are measured continuously with sensors in parallel to acceleration or strain data. An example is fitting a multivariate linear regression model to the modal parameters identified from the measured data [7,12,13]. The advantage of this approach is its relative simplicity, interpretability, and a computational burden that is smaller compared to other machine learning algorithms. On the other hand, such an approach assumes linearity between the environmental factors and the resonance frequency, which is not the case, as demonstrated in other studies. Other methods are based on the stochastic nature of variables, for example, the Gaussian process regression vector AR method [14]. Implicit methods deal with cases where the environmental data are unknown. Principal component analysis (PCA) [15,16,17] is the most popular approach, where the main idea is that the principal components describing the largest proportion of variance in the data are the ones containing the most contributions from environmental factors. These components are then removed. However, there is a risk of removing the information on damage as well [11]. Other methods include Gaussian mixture models [17,18,19], neural networks [19], and various unsupervised non-parametric search models [20,21].
Recently, more advanced data-driven approaches have also emerged. Kuok et al. [22] developed a propagative broad learning method that adaptively models ambient influences on resonant frequencies, allowing the model to evolve as conditions change. Amer and Kopsaftopoulos [23] employed Gaussian process regression to capture both damage-related signals and environmental uncertainties, providing more robust damage-state estimates under varying loads. In a comparative test on bridge-cable data, Dia and Makhoul [24] illustrated that non-parametric schemes can often detect subtle damage shifts more reliably than strictly modal-based parametric methods, especially under strong environmental variability. These recent studies underscore the growing importance of flexible, data-driven frameworks that can actively discriminate structural changes and ambient effects in SHM applications.
SHM is performed on the basis of the statistical control of DSFs, with the aim of detecting deviations from a reference state. For this purpose, Mahalanobis distance (MD), as an unsupervised algorithm for detecting changes in structural state, has been widely used in the scientific community [25,26,27] owing to its simplicity and low computational cost. Nevertheless, the MD-based approach produces false alarms whenever the effect of environmental factors is not removed from the analyzed DSFs [28]. Several studies have attempted to tackle this issue. In [28], the k-nearest neighbor classifier was used to classify the observations in training and testing sets and an optimal k was searched to estimate the local covariance matrix and mean vector necessary for the calculation of the MD. In this work, the environmental effects were not removed directly, but rather the calculated MD accounted for different possible variations in the environmental conditions present in the lengthy training phase. In [29], variational mode decomposition was used to remove noise and trends from the frequency data induced by the changing environment. This output was then passed to a recurrent neural network with long short-time memory in conjunction with a minimum covariance determinant framework to estimate the mean vector and covariance matrix to prepare the frequency data for the computation of the MD. This method, however, implies extremely costly computations.
In the present study, a methodology for structural damage detection is proposed. It is demonstrated on a wooden two-story frame structure. It encompasses the identification of resonance frequencies, exploration of the effects of the monitored environmental factors on the resonant frequencies, removal of ambient environmental factors in order to obtain a clear baseline of resonance frequency values for damage detection, and, finally, employment of the Mahalanobis distance metric to detect the observations related to damage. The study is summarized with the main findings and conclusions.

2. Damage Detection Methodology

2.1. Effect of Environmental Factors on the Resonant Frequencies

Not all environmental variables affect resonant frequencies equally. The nonlinear effects of environmental variables on resonance frequencies imply employing nonlinear methods to determine the relative effect. For this purpose, the effects of environmental variables on each of the resonance frequencies are explored using a support vector regression (SVR) machine learning algorithm. This algorithm is chosen due to its ability to effectively model nonlinear relationships between environmental factors and target outputs while maintaining a robust performance in complex data [30]. The inherent working of SVR is capable of preventing overfitting. Compared to neural network algorithms, SVR works well with much smaller datasets.
The SVR method estimates the relationship between environmental variables and resonant frequencies by identifying an optimal hyperplane in a transformed feature space. The predicted resonant frequencies for the i-th observation, f ^ i , of an SVR model are defined according to the following:
f ^ i = w · ϑ X i + b ,
where X i represents the vector of environmental factors, ϑ X i is a nonlinear mapping function implemented using a nonlinear kernel that projects the data into a higher-dimensional space, w is the weight vector, and b is the bias term. To train the SVR model, the following optimization problem is solved:
min w , b ,   φ i , φ i *   1 2 w 2 + C i = 1 N φ i + φ i * subject   to   the   following   constraints : f i w · ϕ X i + b ϵ + φ i w · ϕ X i + b y i ϵ + φ i * φ i , φ i * 0 ,                             i = 1 ,   ,   N ,
where C is a box constraint—a regularization parameter that balances model complexity with the penalty for errors exceeding ϵ —while φ i and φ i * are slack variables that allow for deviations outside the ϵ insensitive zone [31] and f i is the value of the observed resonant frequency. Prediction errors in SVR are measured through the loss function, which does not penalize deviations within some tolerance ϵ . This loss for the i-th observation is defined as follows:
L ϵ f i ,   f ^ i =                                       0 ,         | f i f ^ i | ϵ | f i f ^ i | ϵ ,         otherwise
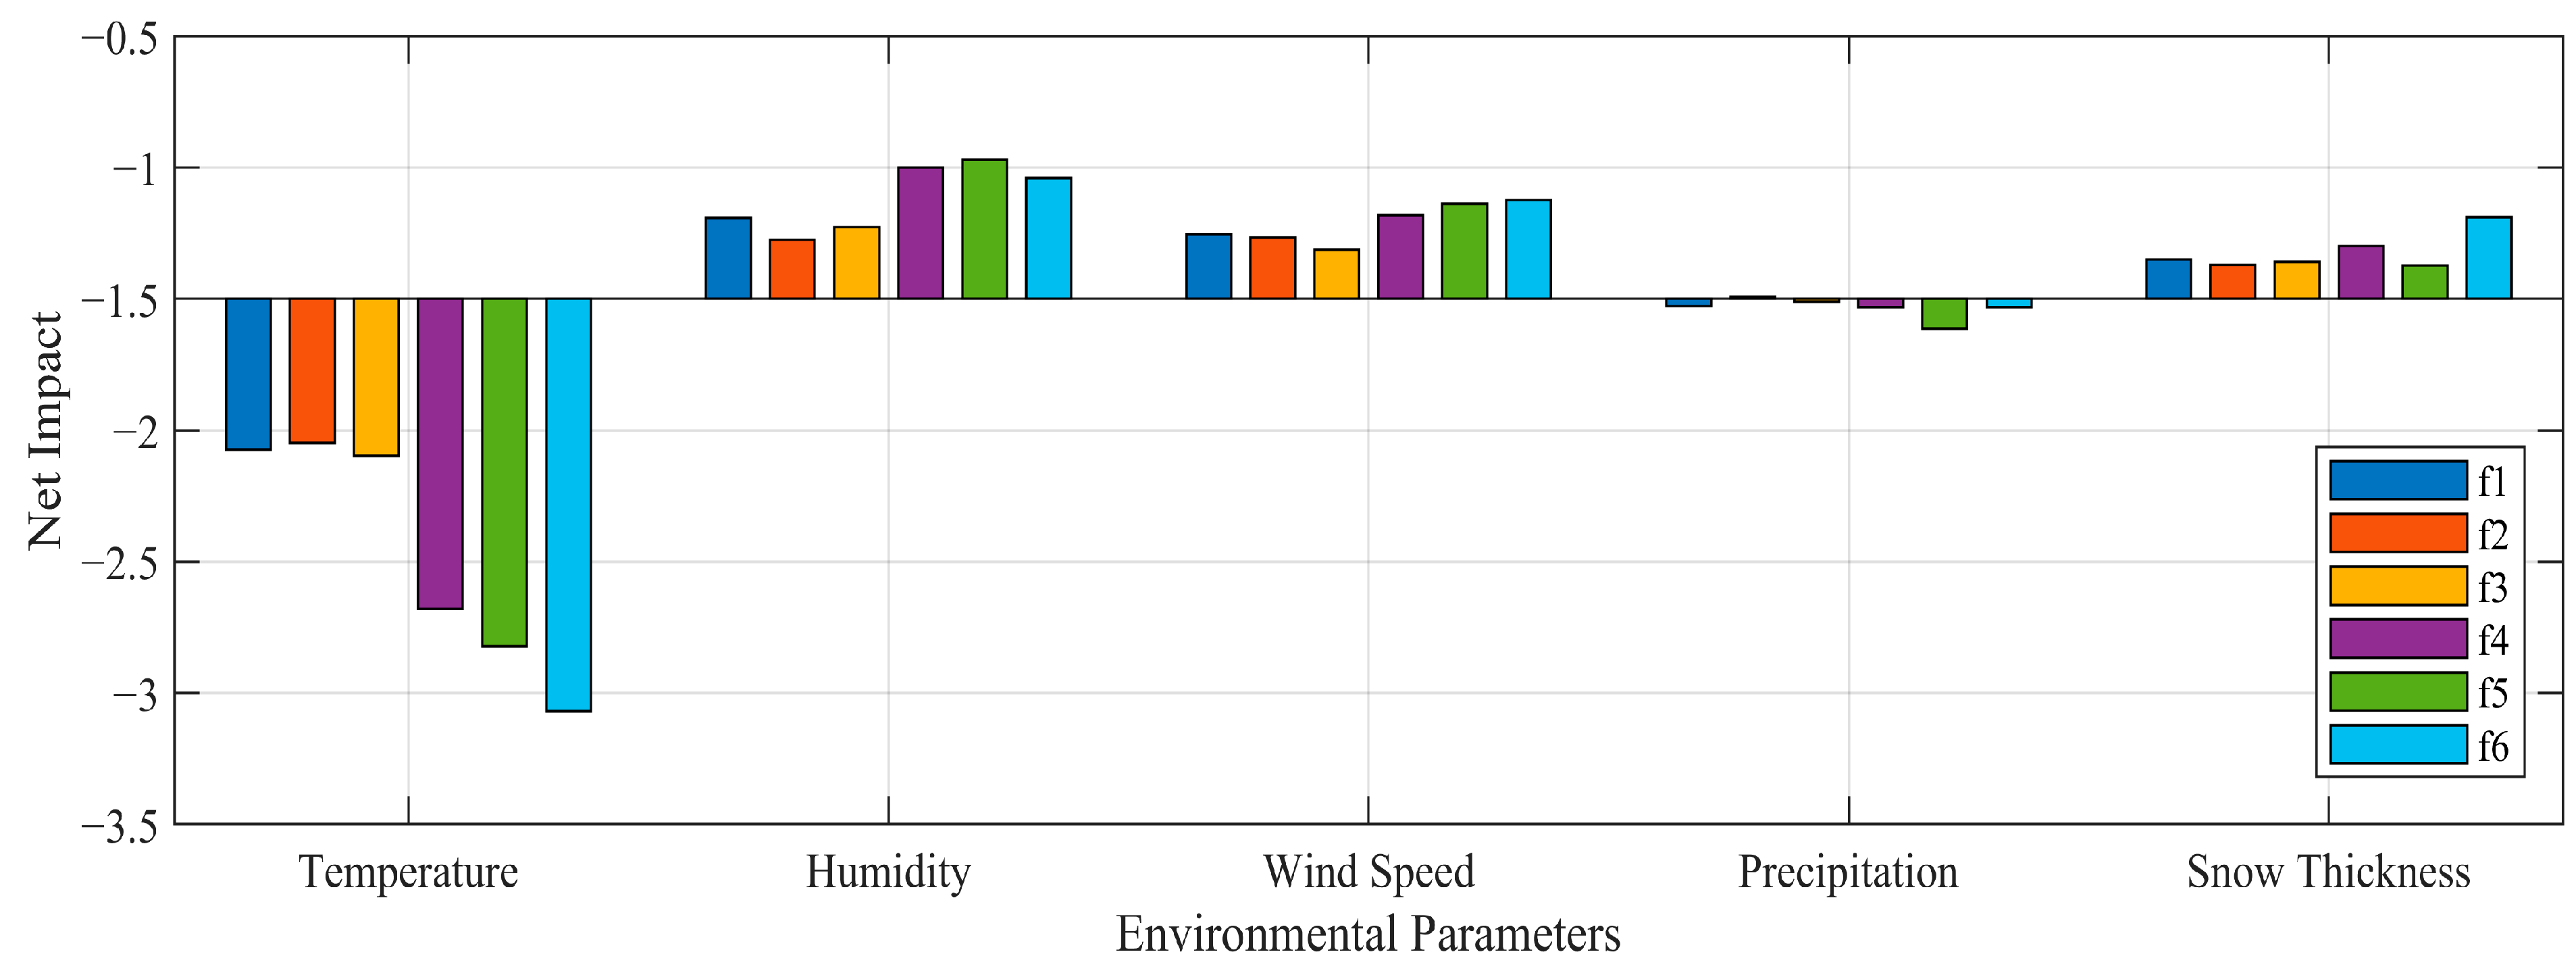
In order to compare how each environmental factor impacts the resonant frequencies, the net impact is calculated for each of the factors. The net impact indicates how much the resonant frequency changes in absolute terms when the environmental factor varies across its range, as follows:
N e t   i m p a c t = f ^ p r e d ( m a x ) f ^ p r e d ( m i n ) ,
where f ^ p r e d ( m a x ) is the predicted value of the resonant frequency when the environmental factor is at its maximum observed value and f ^ p r e d ( m i n ) is the predicted value of the resonant frequency when the environmental factor is at its minimum observed value. A higher net impact indicates a greater influence of the corresponding variable on the resonant frequency and vice versa. The sign of the impact indicates whether the particular environmental factor increases (positive sign) or decreases (negative sign) the resonance frequencies.

2.2. Removal of Effect of Environmental Factors

In SHM, it is essential to achieve a near-constant value for a monitored variable reflecting the structural condition at a reference state. Any deviations from this value over the time of observation are related changes in structural state. As with the calculation of the impacts that the environmental factors have on the resonant frequencies, the SVR algorithm is also used for the removal of these impacts. Nonlinear problems can be efficiently tackled owing to the nonlinear kernel function, which introduces the capabilities of nonlinear prediction to the SVR. A Gaussian kernel as a nonlinear kernel is chosen for the task. While PCA is a common implicit method for removing environmental variability, it is fundamentally linear and information on damage can inadvertently be discarded if it is contained in high variance components. SVR directly incorporates known environmental variables in a supervised manner, and its kernel-based formulation readily models nonlinear relationships. The SVR method reduces the risk of conflating damage effects with environmental shifts and more accurately preserves damage-sensitive features through its residual-based approach.
The removal of the effects of environmental factors is also achieved by predicting the resonant frequencies (see Equation (1)). To improve performance of the trained SVR model, Bayesian optimization is used to optimize the following hyperparameters—box constraint, the kernel scale controlling the width of the Gaussian kernel, and epsilon over m independent runs. A surrogate model is constructed to approximate the validation error as the function of these hyperparameters, and an acquisition function, expected improvement (EI), is used to calculate the optimal parameters by the following equation:
E I x = f m i n μ x Φ f m i n μ x σ x + σ x ϕ f m i n μ x σ x ,
where μ x and σ x are the predicted mean and standard deviation from the surrogate model at the hyperparameter configuration x , f m i n is the minimum observed validation error, Φ is the cumulative distribution function, and ϕ is the probability density function of the standard normal distribution [32].
The surrogate model in this Bayesian optimization procedure is a Gaussian process that approximates the relationship between the SVR hyperparameters and the resulting validation error. For each chosen set of hyperparameters, the SVR is trained on part of the data, and a validation error is measured. This pair is the used to update the Gaussian process, which provides both a predictive mean μ x and a predictive variance σ 2 x . The acquisition function defined in Equation (5) leverages μ x and σ x to propose new hyperparameter sets that either reduce uncertainty or refine promising regions. As more pairs are observed, the surrogate model becomes progressively more accurate near optimal hyperparameter configurations, guiding the search more efficiently than exhaustive or random approaches.
Considering the multidimensional character of the real monitoring data, the prediction function for all features can be rewritten in a matrix form as Y ^ = f X , where matrix X = X 1,1 X 1 , K X N , 1 X N , K is of a dimension N × K and contains all K environmental factors, such as temperature, humidity, etc., for every observation i = 1 : N . By subtracting the response approximation Y ^ from the measured response Y , a matrix of residuals is obtained, as follows:
E = Y Y ^ = Y f X
The matrix of residuals E is then used in structural damage detection [13].

2.3. Selection of Damage-Sensitive Features

In order to improve the efficiency of the MD algorithm, it is necessary to select the most appropriate DSFs. In this work, the Neighborhood Component Analysis (NCA) algorithm is used for such a purpose. NCA is a non-parametric algorithm that can be applied to continuous variables. As opposed to, for example, PCA, NCA has several merits. First, it retains the interpretability of features and, secondly, class distinction in the case of classification problems can be retained as well [33]. NCA is conducted in MATLAB (version R2023a) using the command fscnca(...). The goal is to learn the weights of the DSFs, w r , that maximize a leave-one-out objective function, classification probability, as follows:
F w = 1 N i = 1 N p i λ r = 1 K w r 2 = 1 N i = 1 N j = 1 , j i N p i j y i j λ r = 1 K w r 2 = 1 N i = 1 N F i w ,
where p i is the mean leave-one-out probability for the correct classification, λ is a regularization parameter that reduces the weights of many DSFs to near zero, y i j = I y i = y j , p i j = k d w x i ,   x j j = 1 , j i N k d w x i ,   x j , d w x i ,   x j = r = 1 K w r 2 x i r , x j r is the distance between the observations x i and x j in a multidimensional space of K variables, and k = e z σ is some kernel function with a parameter σ (usually set to 1). The weights of the DSFs are obtained by minimizing the probability from Equation (7).
w ^ = argmin w F w

2.4. Mahalanobis Distance in Structural Damage Detection

For a data matrix X with N observations and K number of variables, the Mahalanobis distance (MD) is defined as follows [34]:
M D = X 0 X ¯ 0 T Σ 1 X 0 X ¯ 0
where M D is a vector of the MD values, X 0 is a vector containing a single observation of a potential outlier for all variables, X ¯ 0 is a vector containing the mean values of all variables, and Σ 1 is an inverse of a covariance matrix Σ . Even though their computation is straightforward, the requirement is that data must be normally distributed [35].
According to the literature [36], MD values have a chi-squared distribution with degrees of freedom ν equal to the number of variables. By calculating the chi-squared distribution of p-values associated with every MD value, a threshold of MD can be set such that the associated p-value is equal to 0.001. This value was proposed by Tabachnik and Fidell [37] as a conservative estimation of a threshold for MD. A threshold based on a distribution of extreme value statistics, such as Gumbell, Weibull, or Fréchet, has also been proposed [19]. Essentially, the task is a binary classification—the state of the structure has to be classified as either healthy or damaged.
All the steps of the developed damage detection methodology are summarized in Figure 1. Resonant frequencies f serving as DSFs are identified from the measured structural responses. Then, the nonlinear machine learning algorithm, support vector regression, is applied to assess the effect of every environmental variable on the identified resonant frequencies. This is followed by the removal of the effects of environmental factors, and the respective residuals are obtained. The NCA algorithm is used to select the residuals of the resonant frequencies with the highest importance weights and, finally, MD is calculated with a threshold set to the MD’s p-value of 0.001. This model of damage detection is evaluated using the classification accuracy and confusion matrix.

3. Results and Discussion

3.1. The Monitored Object

The developed method is demonstrated on a wooden frame model which is a two-story truss structure. The dimensions are 0.705 m × 0.584 m with a height of 1.2 m (see Figure 2a, while the photo is shown in Figure 2b). The materials used are timber for the columns and diagonal slats with a cross-section of (0.015 × 0.015) m and a 0.004 m thick fiberboard covering. The monitoring period was nearly a year, from 10 November 2021 to 27 October 2022. During this period, the structure was put outdoors, where it was exposed to ambient conditions in Skulte village, Latvia.
Six piezoelectric uniaxial sensors (Dytran IEPE with a built-in Faraday shield for electrostatic noise immunity, sensitivity of 10 V/g, operating temperature from −51 °C to 121 °C, and mass of 0.8 kg) were used. The sampling frequency of acceleration signals was set to 400 Hz. Sensors were connected to an acquisition system (DT9857E with an output range of ±10 V) using 15 m long polyurethane cables. Accelerometers were located at the corners of three joints, and accelerations were measured in two perpendicular directions, as shown in Figure 2a.
Over the course of the monitoring, a total of five progressive structural modifications were introduced (see Table 1), which led to changes in the stiffness and/or mass of the structure. These changes were non-destructive and reversible, enabling the study of their effects on modal parameters without actually damaging the structure. The same principle was used in, for example, [38]. They serve as a proof of concept, but their effect is similar to that of real damage which is known to affect structural modal parameters only in a destructive manner.

3.2. Exploration of Resonant Frequencies

3.2.1. Time Series

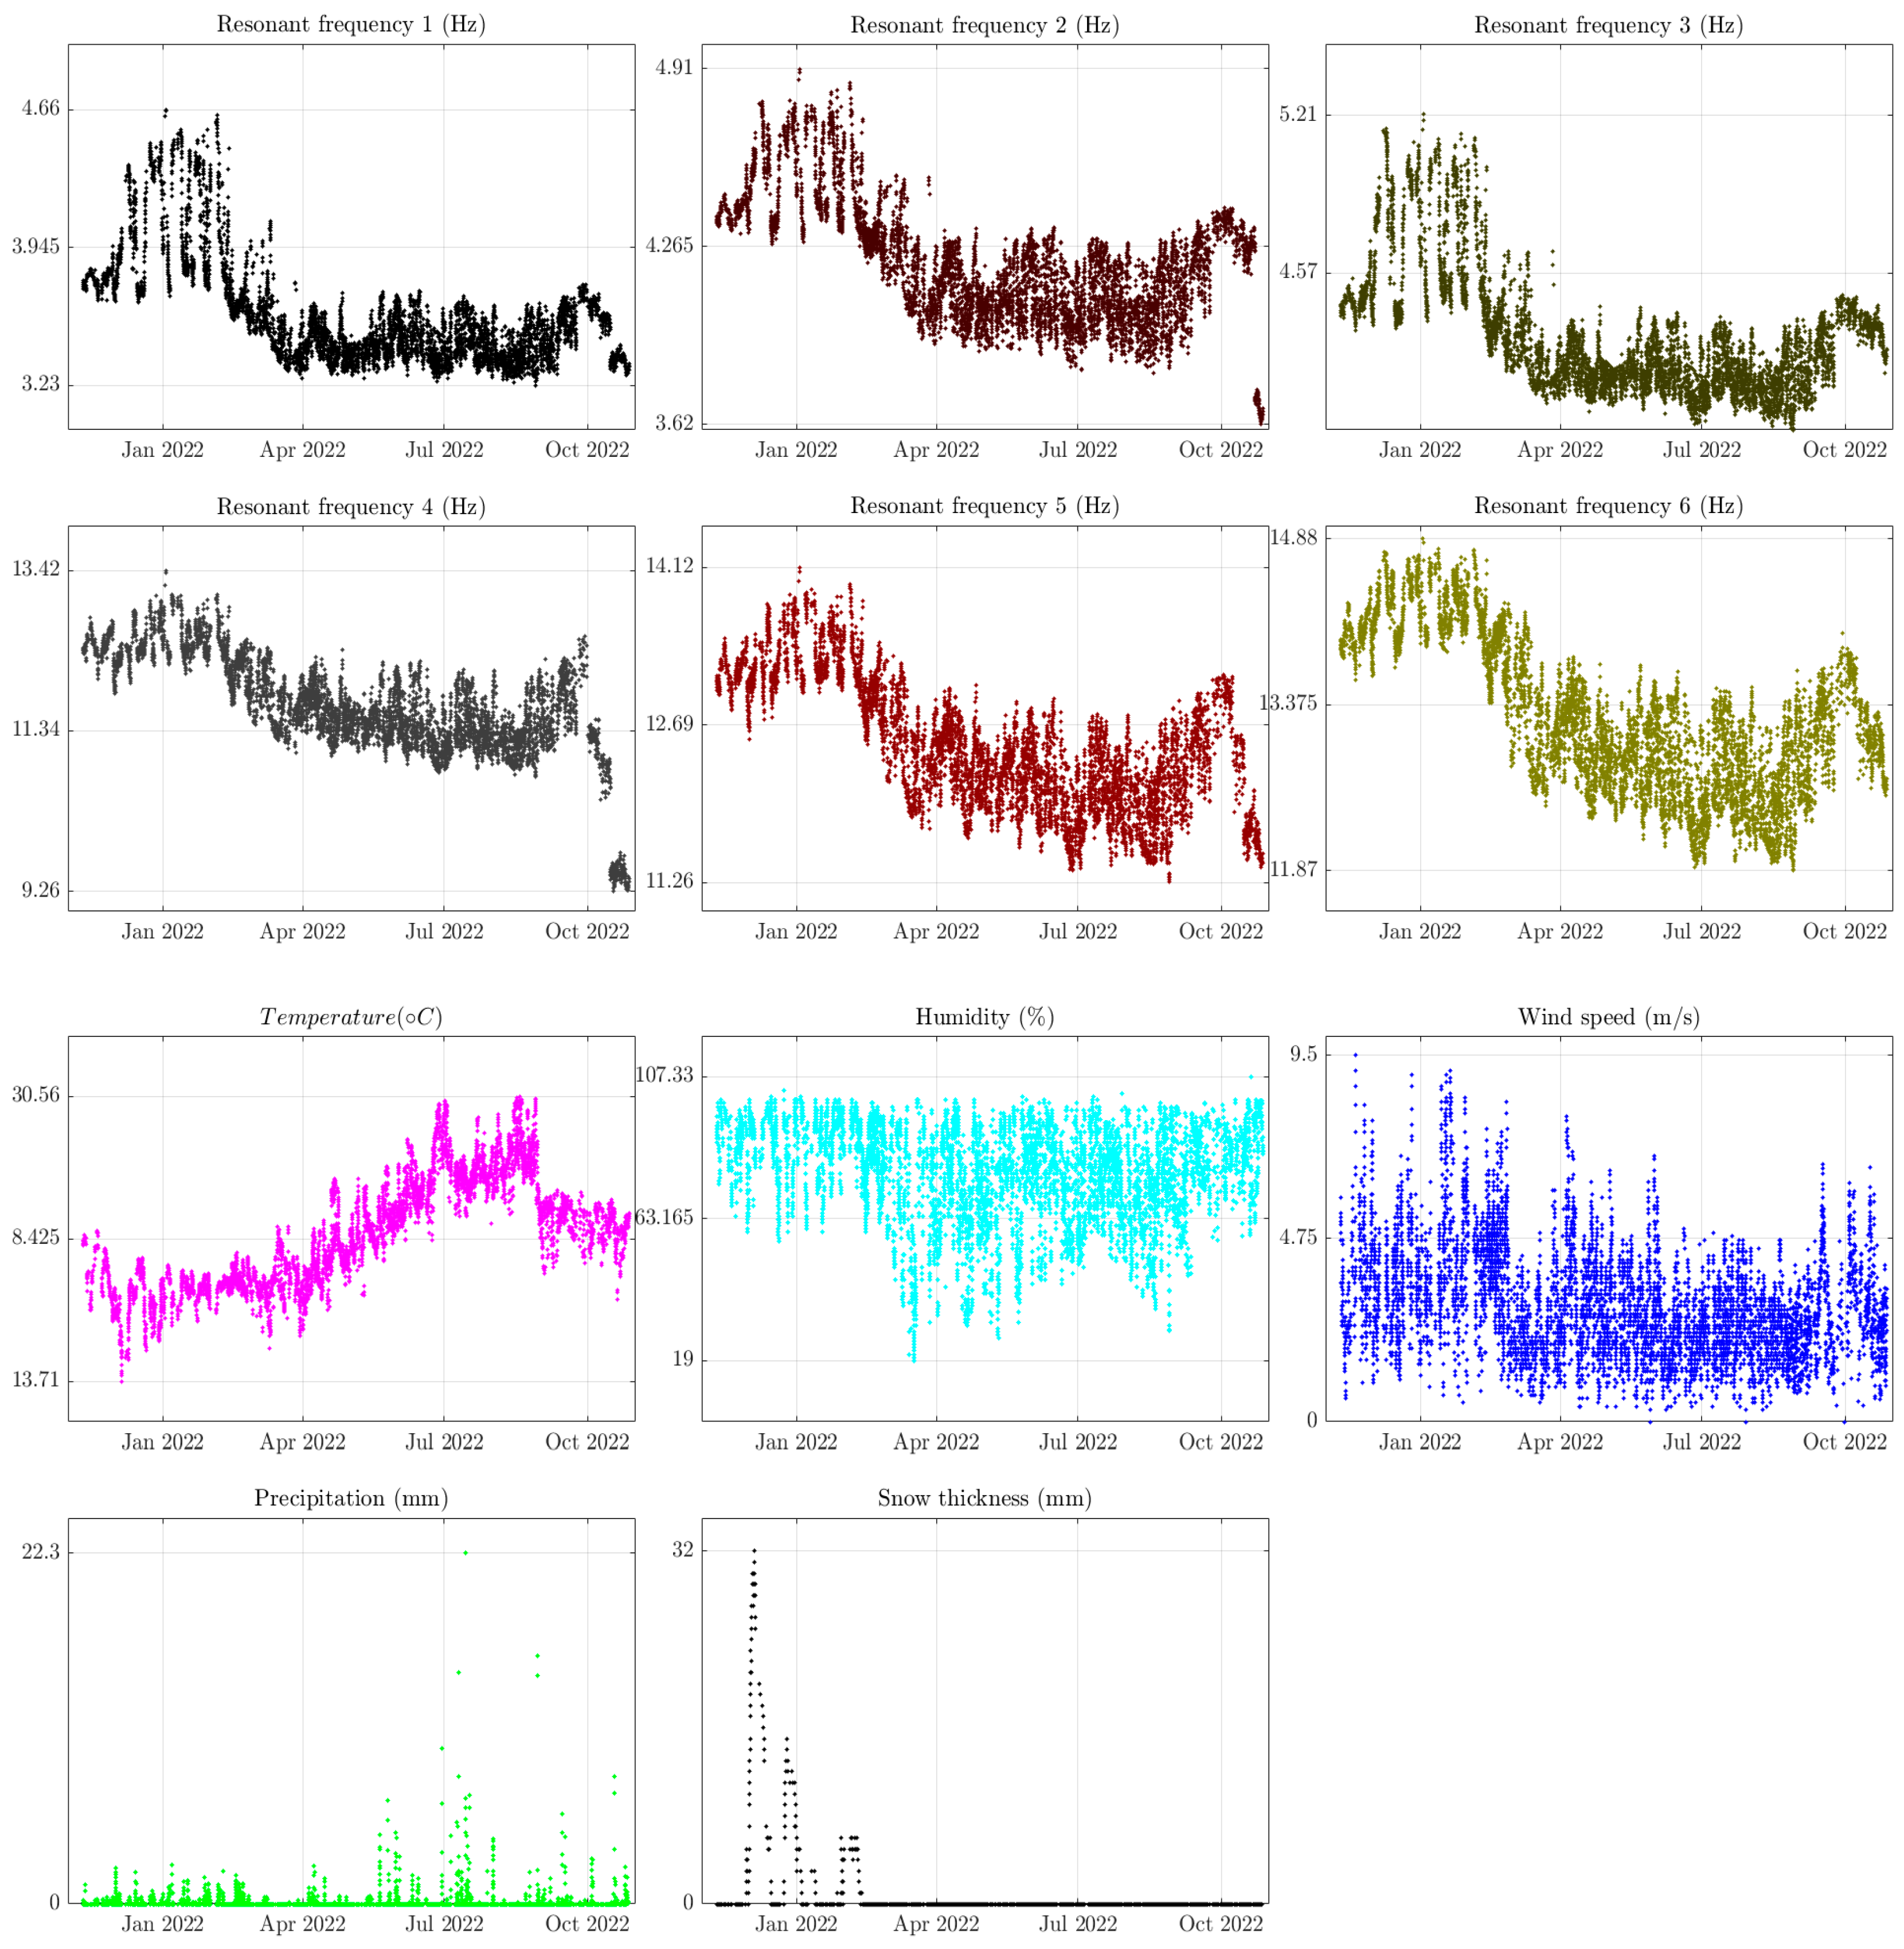
Resonance frequencies f were identified from the measured acceleration signals split into portions of 30 min using the Eigensystem Realization Algorithm (ERA) [12]. The entire dataset consisted of 7583 observations of 11 variables—resonance frequencies f 1 : f 6 (Hz) and 5 environmental factors, which were not measured with sensors at the same sampling frequency as the acceleration signals, but instead, their mean hourly values were registered from the local meteorological station. These environmental variables were temperature T (°C), air humidity H (%), wind speed W S (m/s), precipitation P (mm), and snow thickness S (mm). The dynamics of all the variables over the monitoring period are shown in Figure 3. It can be seen that all resonance frequencies exhibit sharp peaks during the cold months of the monitoring, whereas the values gradually decrease once the temperature increases during spring. On the other hand, the environmental variables do not show any particular trend. Of course, snow thickness has a peak in winter and then drops to zero. Humidity is over 60% most of the time. It is worth noting that there are no visible effects of structural modifications in any of the time series of the variables.

3.2.2. Probability Density Function Estimates

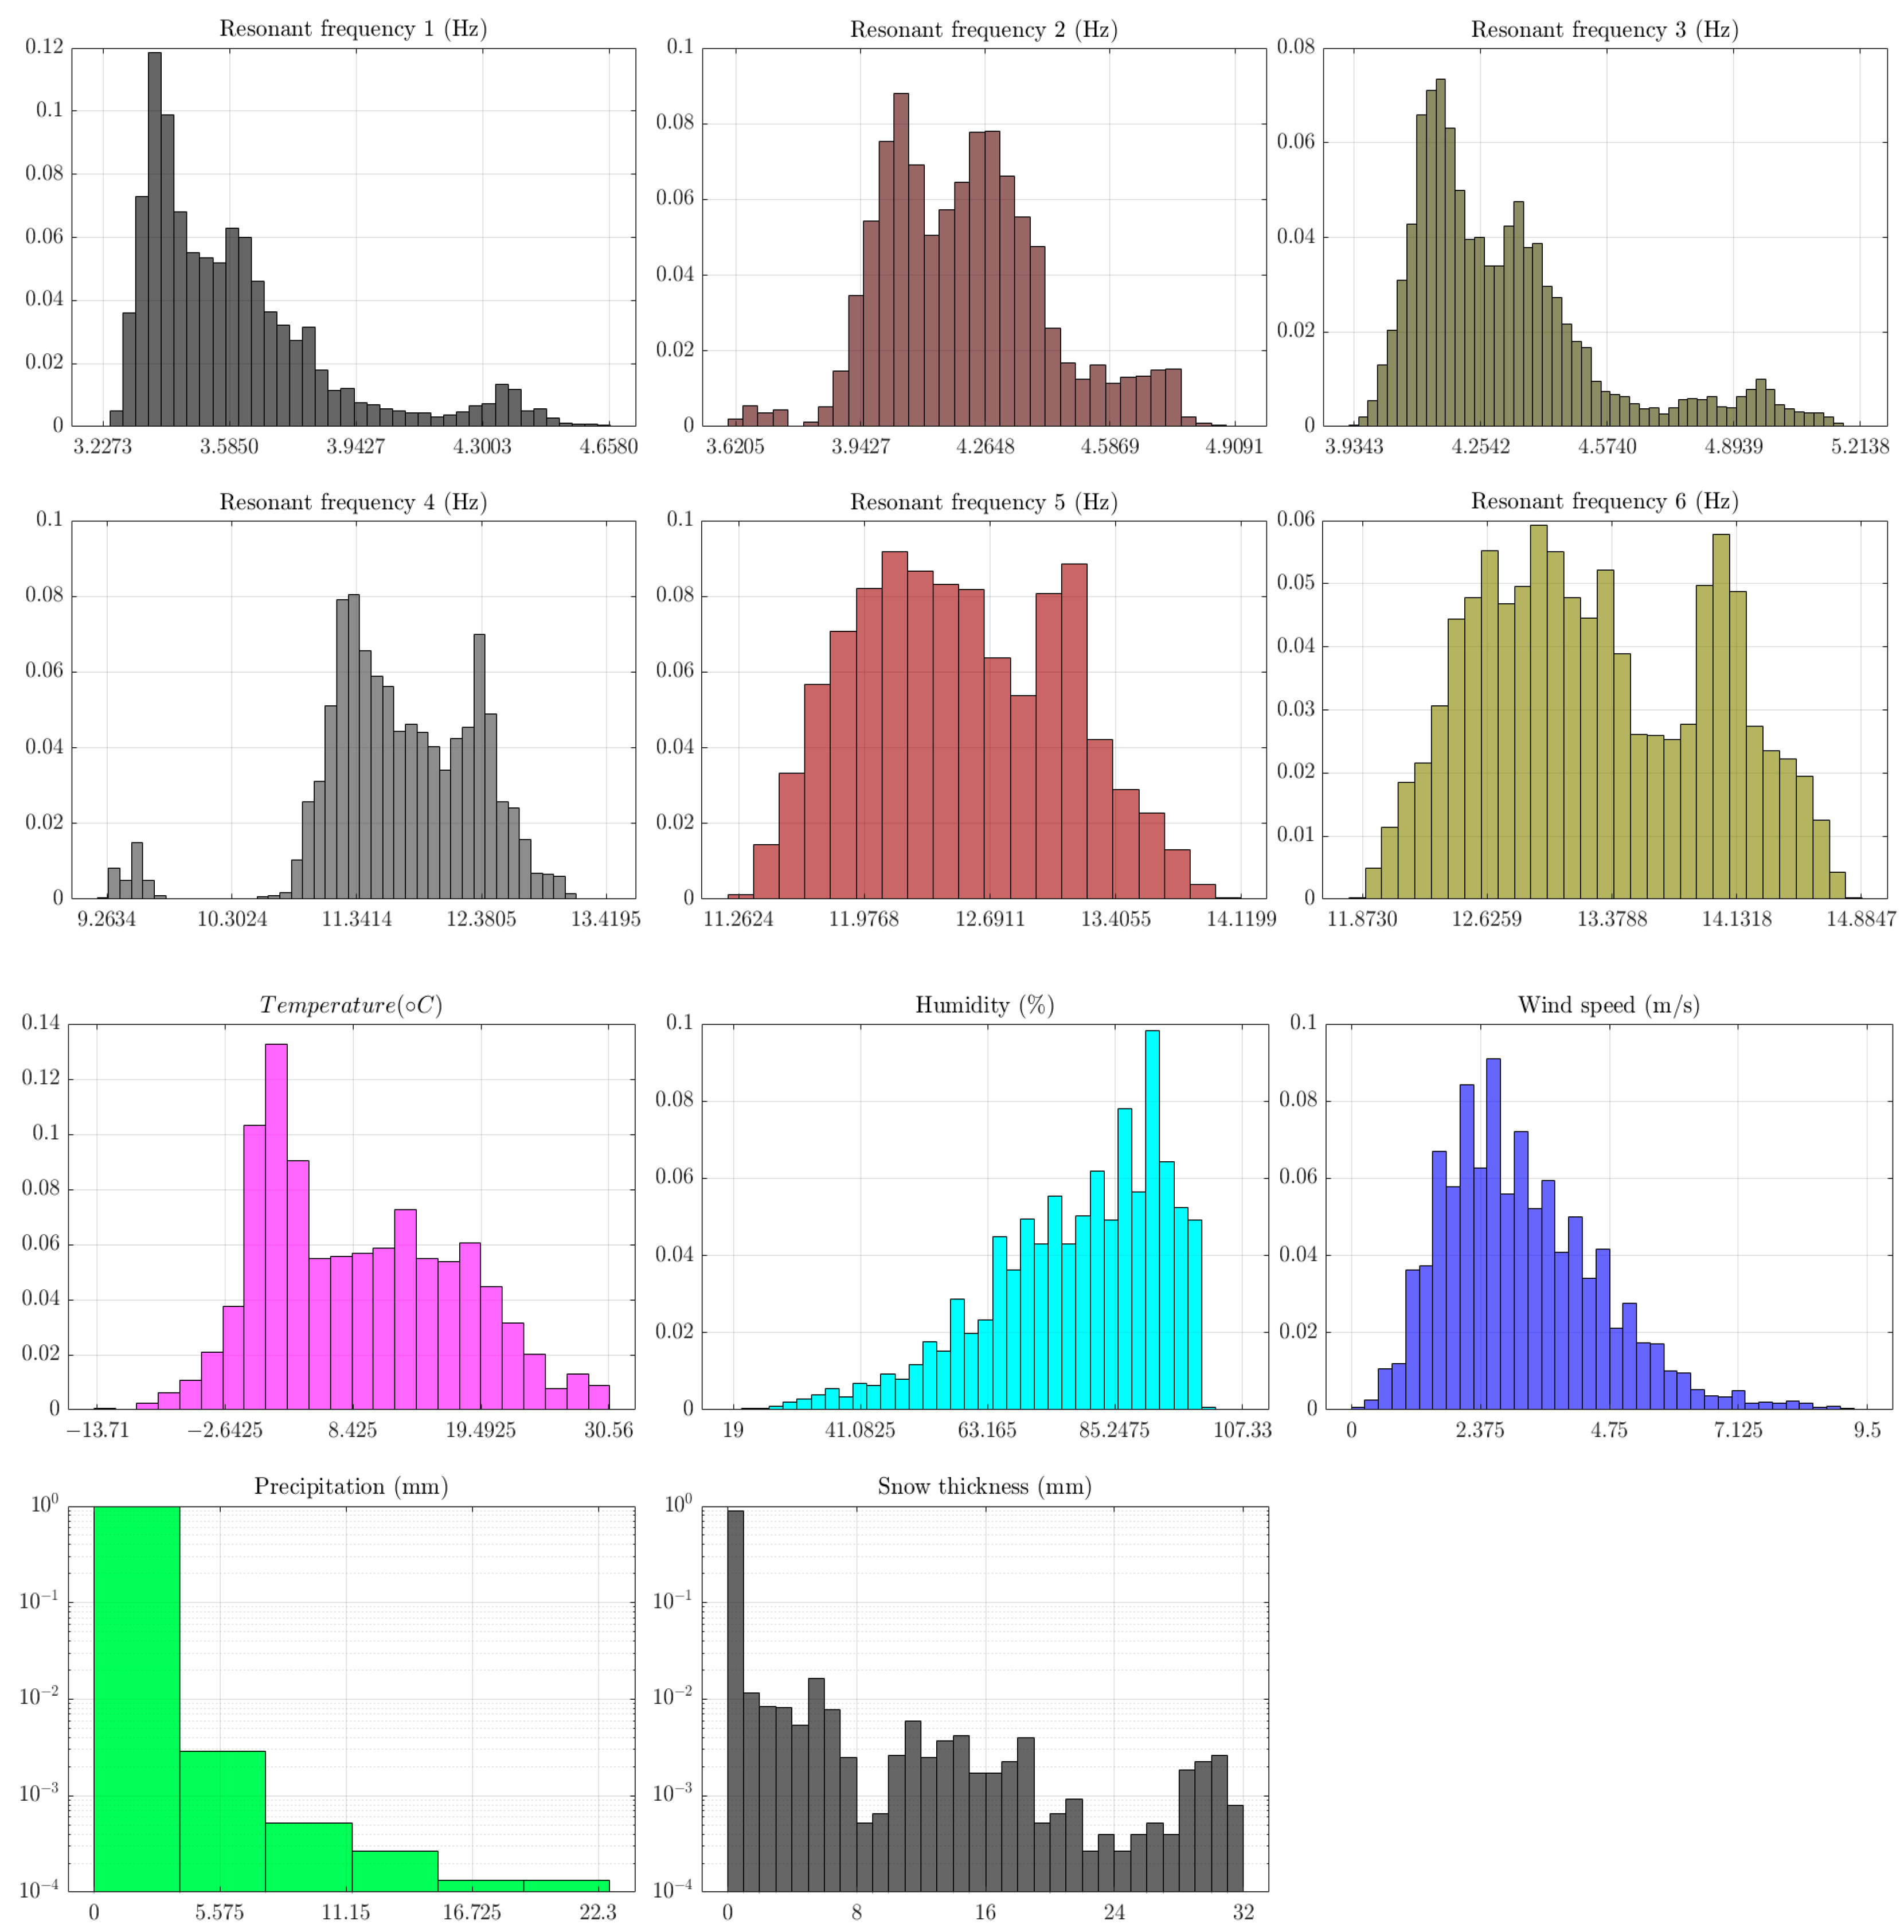
The exploration of the variables is continued with descriptive statistics. The mean value, median, variance, skewness, and kurtosis of all variables are shown in Table 2. The probability densities of the variables were estimated with a histogram, adopting strategies for the optimization of bin numbers. The resulting histograms are depicted in Figure 4. A smoother representation of the probability density function can be obtained using the kernel density smoothing approach [39] by choosing the correct bandwidth parameter. The compliance of the probability distribution of the variables to a normal distribution can be judged based on several properties of descriptive statistics, as follows:
  • If the mean value is equal (or very close) to the median and the skewness is equal (or close) to zero. This property holds for symmetric distributions, which is also the case of a normal distribution.
  • It is known that the kurtosis of a normal distribution is three. Hence, an excess kurtosis or a difference between the kurtosis of the distribution in question and that of a normal variable (3) is usually calculated. If the excess kurtosis is equal (or very close) to zero, the distribution is close to normal.
Although both the excess kurtosis and skewness for resonance frequency 2 were also close to zero, E x . k u r t o s i s f 2 = 3.18 3 = 0.18 , there was a bimodal distribution (thus, not normal), as seen from the respective histogram.
The number of histogram bins was optimized in program R using the library’s histogram command with the same name and utilizing all available penalty methods for the maximum likelihood function. The results for the optimum number of bins b * were different for each of the penalty methods; therefore, the rule for the selection of the final result was constructed as choosing the minimum between the median and mode of the various estimates as b * = m i n m e d i a n b * ,   m o d e b * . The justification for such a rule is a significant variance of b * estimates obtained with different penalty methods. Hence, the mean value would not be an appropriate statistic to rely on. On the other hand, the median and mode are more robust statistics.

3.2.3. Mutual Correlation

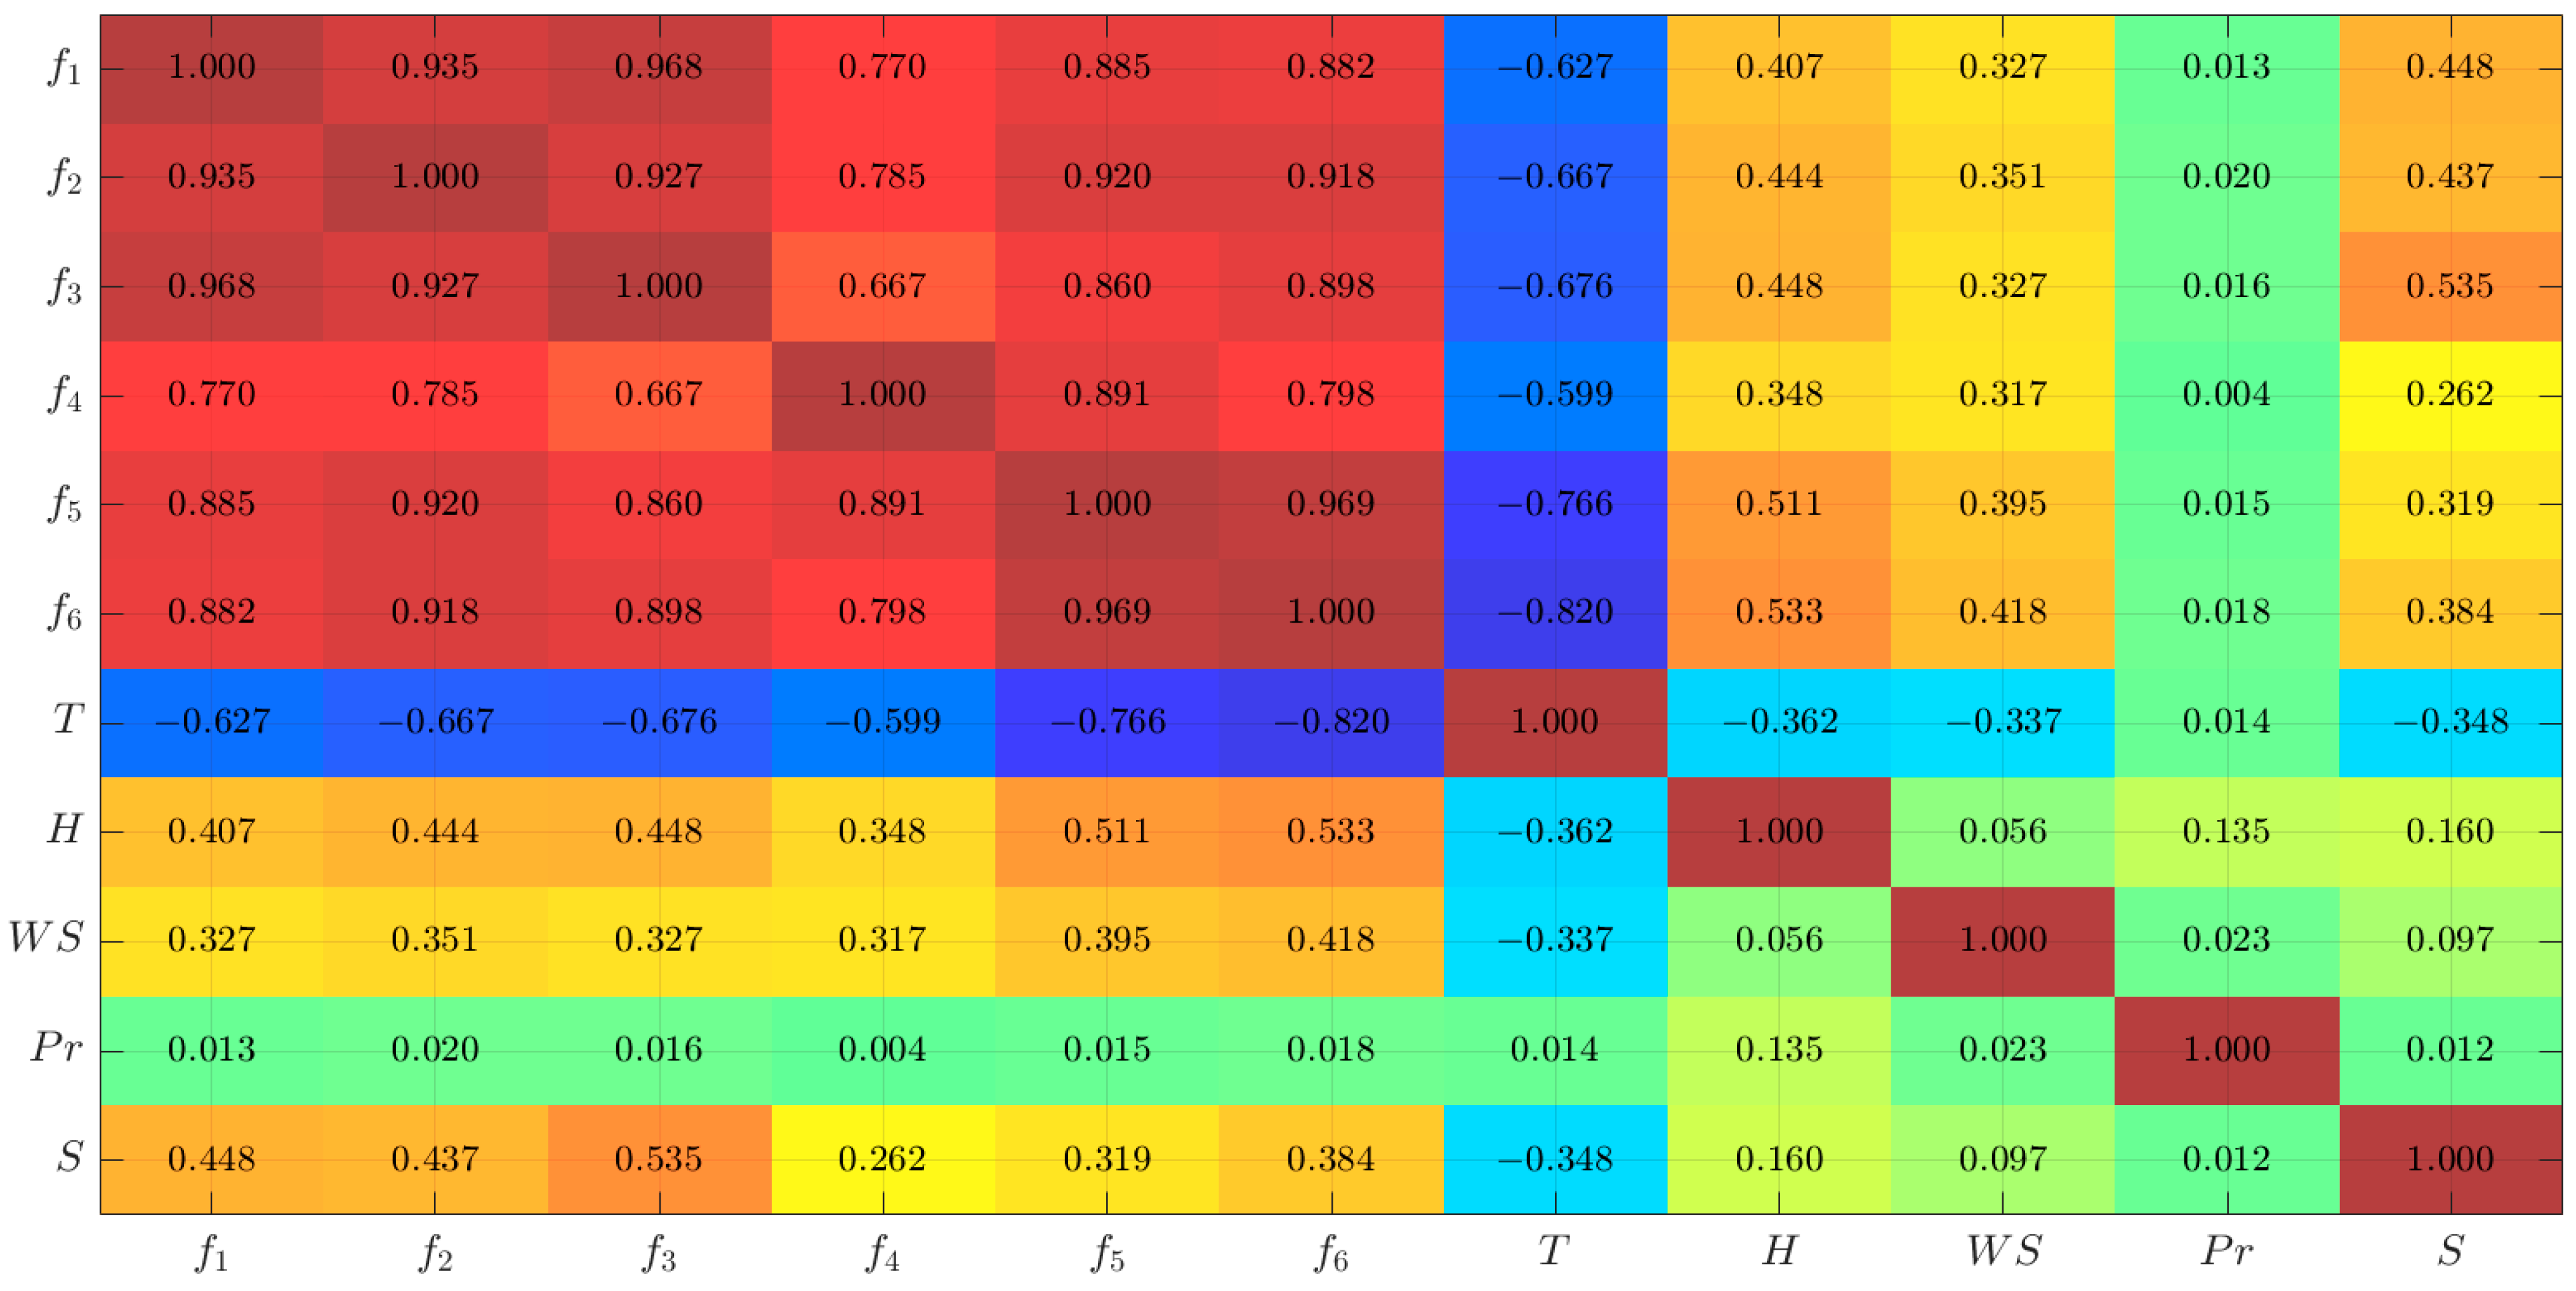
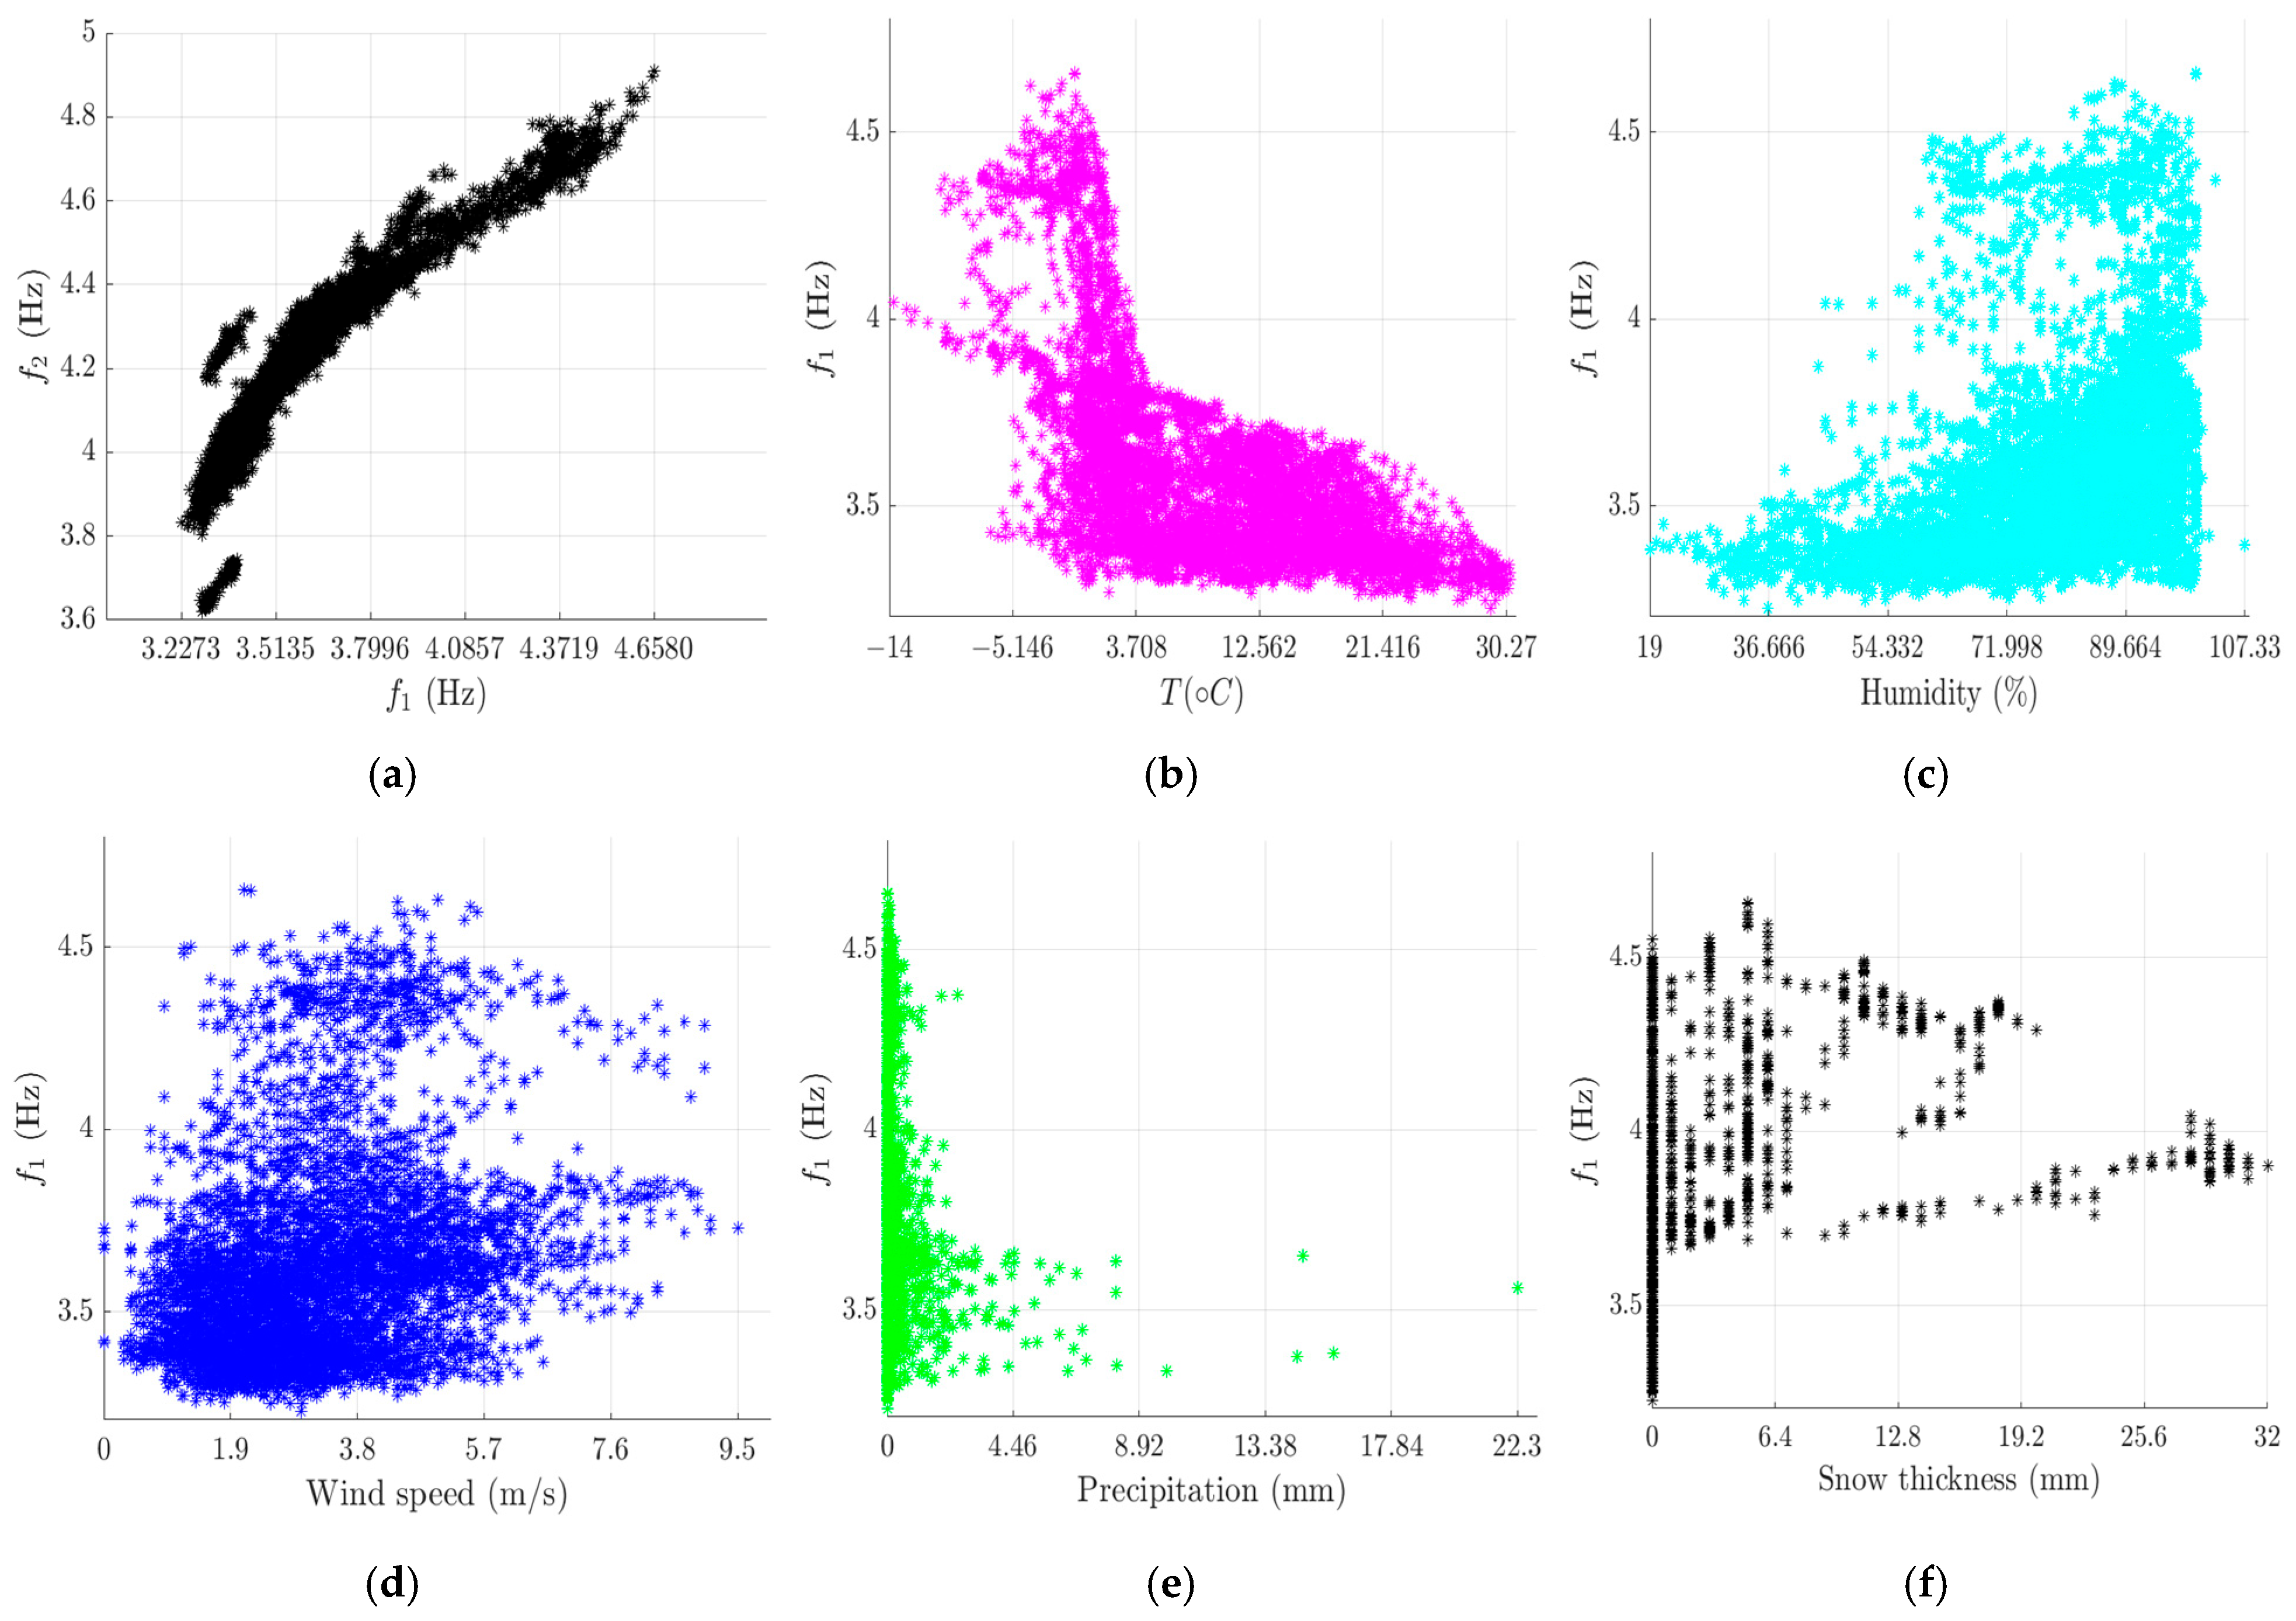
Even though the relationship between the resonant frequencies and the environmental factors is predominantly nonlinear, it is still of interest to check for linear relationships. To this end, a matrix of Pearson’s linear correlation coefficients calculated between all variables is shown in Figure 5. A very high positive linear correlation can be seen between all resonance frequency variables. For these variables, the correlation coefficient ranges from 0.667 to 0.969. Therefore, all resonance frequencies are related by some linear relationship. A very high negative correlation ranging from −0.599 to −0.820 is observed between resonance frequencies and temperature. This is also confirmed from Figure 3, where frequency peaks can be seen at low temperatures. These relationships are illustrated in Figure 6, where scatterplots of f 1 versus f 2 and f 1 versus all environmental factors are shown. A positive linear relationship is clearly visible in Figure 6a. The authors in [40] state that the relationship of natural frequencies versus temperature is commonly bilinear for typical structures. This statement is confirmed in Figure 6b, where it can be seen that there are two nearly linear regions with different slopes—the region with a steeper slope is at negative temperatures T < 0   ° C , while the region with a smaller slope is at positive temperatures T 0   ° C . An examination of the relationship between the first resonance frequency and the rest of the environmental factors reveals a nonlinear relationship. Hence, linear methods for the removal of the effects of environmental factors on resonant frequencies cannot be applied.

3.3. Feature Analysis

3.3.1. Hyperparameter Optimization

As stated in Section 2.2 “Removal of effect of environmental factors”, the hyperparameters of the SVR model were optimized. A total of 100 runs of optimization with 30 iterations each were carried out, since the Bayesian optimization routine does not explore an entire hyperparameter space and instead sweeps through different regions of this space in each optimization run. Hence, in each of these different regions, the optimizer converges to a different local minimum. Nevertheless, the majority of outcomes were clustered in a smaller region of this hyperparameter space, as shown in Figure 7 (left). The right side of Figure 7 depicts the centroid values of the optimized hyperparameters for each resonant frequency. These centroid values were calculated as medians over all three hyperparameter directions, since mean values would be heavily skewed due to the considerable scatter of the results.
The centroid values of the optimized hyperparameters are provided in Table 3. It can be seen that the order of magnitude of the same hyperparameters stayed constant over all resonant frequencies, with higher deviations associated with f 6 . These values were then used as an input for SVR model training, where resonant frequency residuals according to Equation (6) were obtained.

3.3.2. Residual Analysis

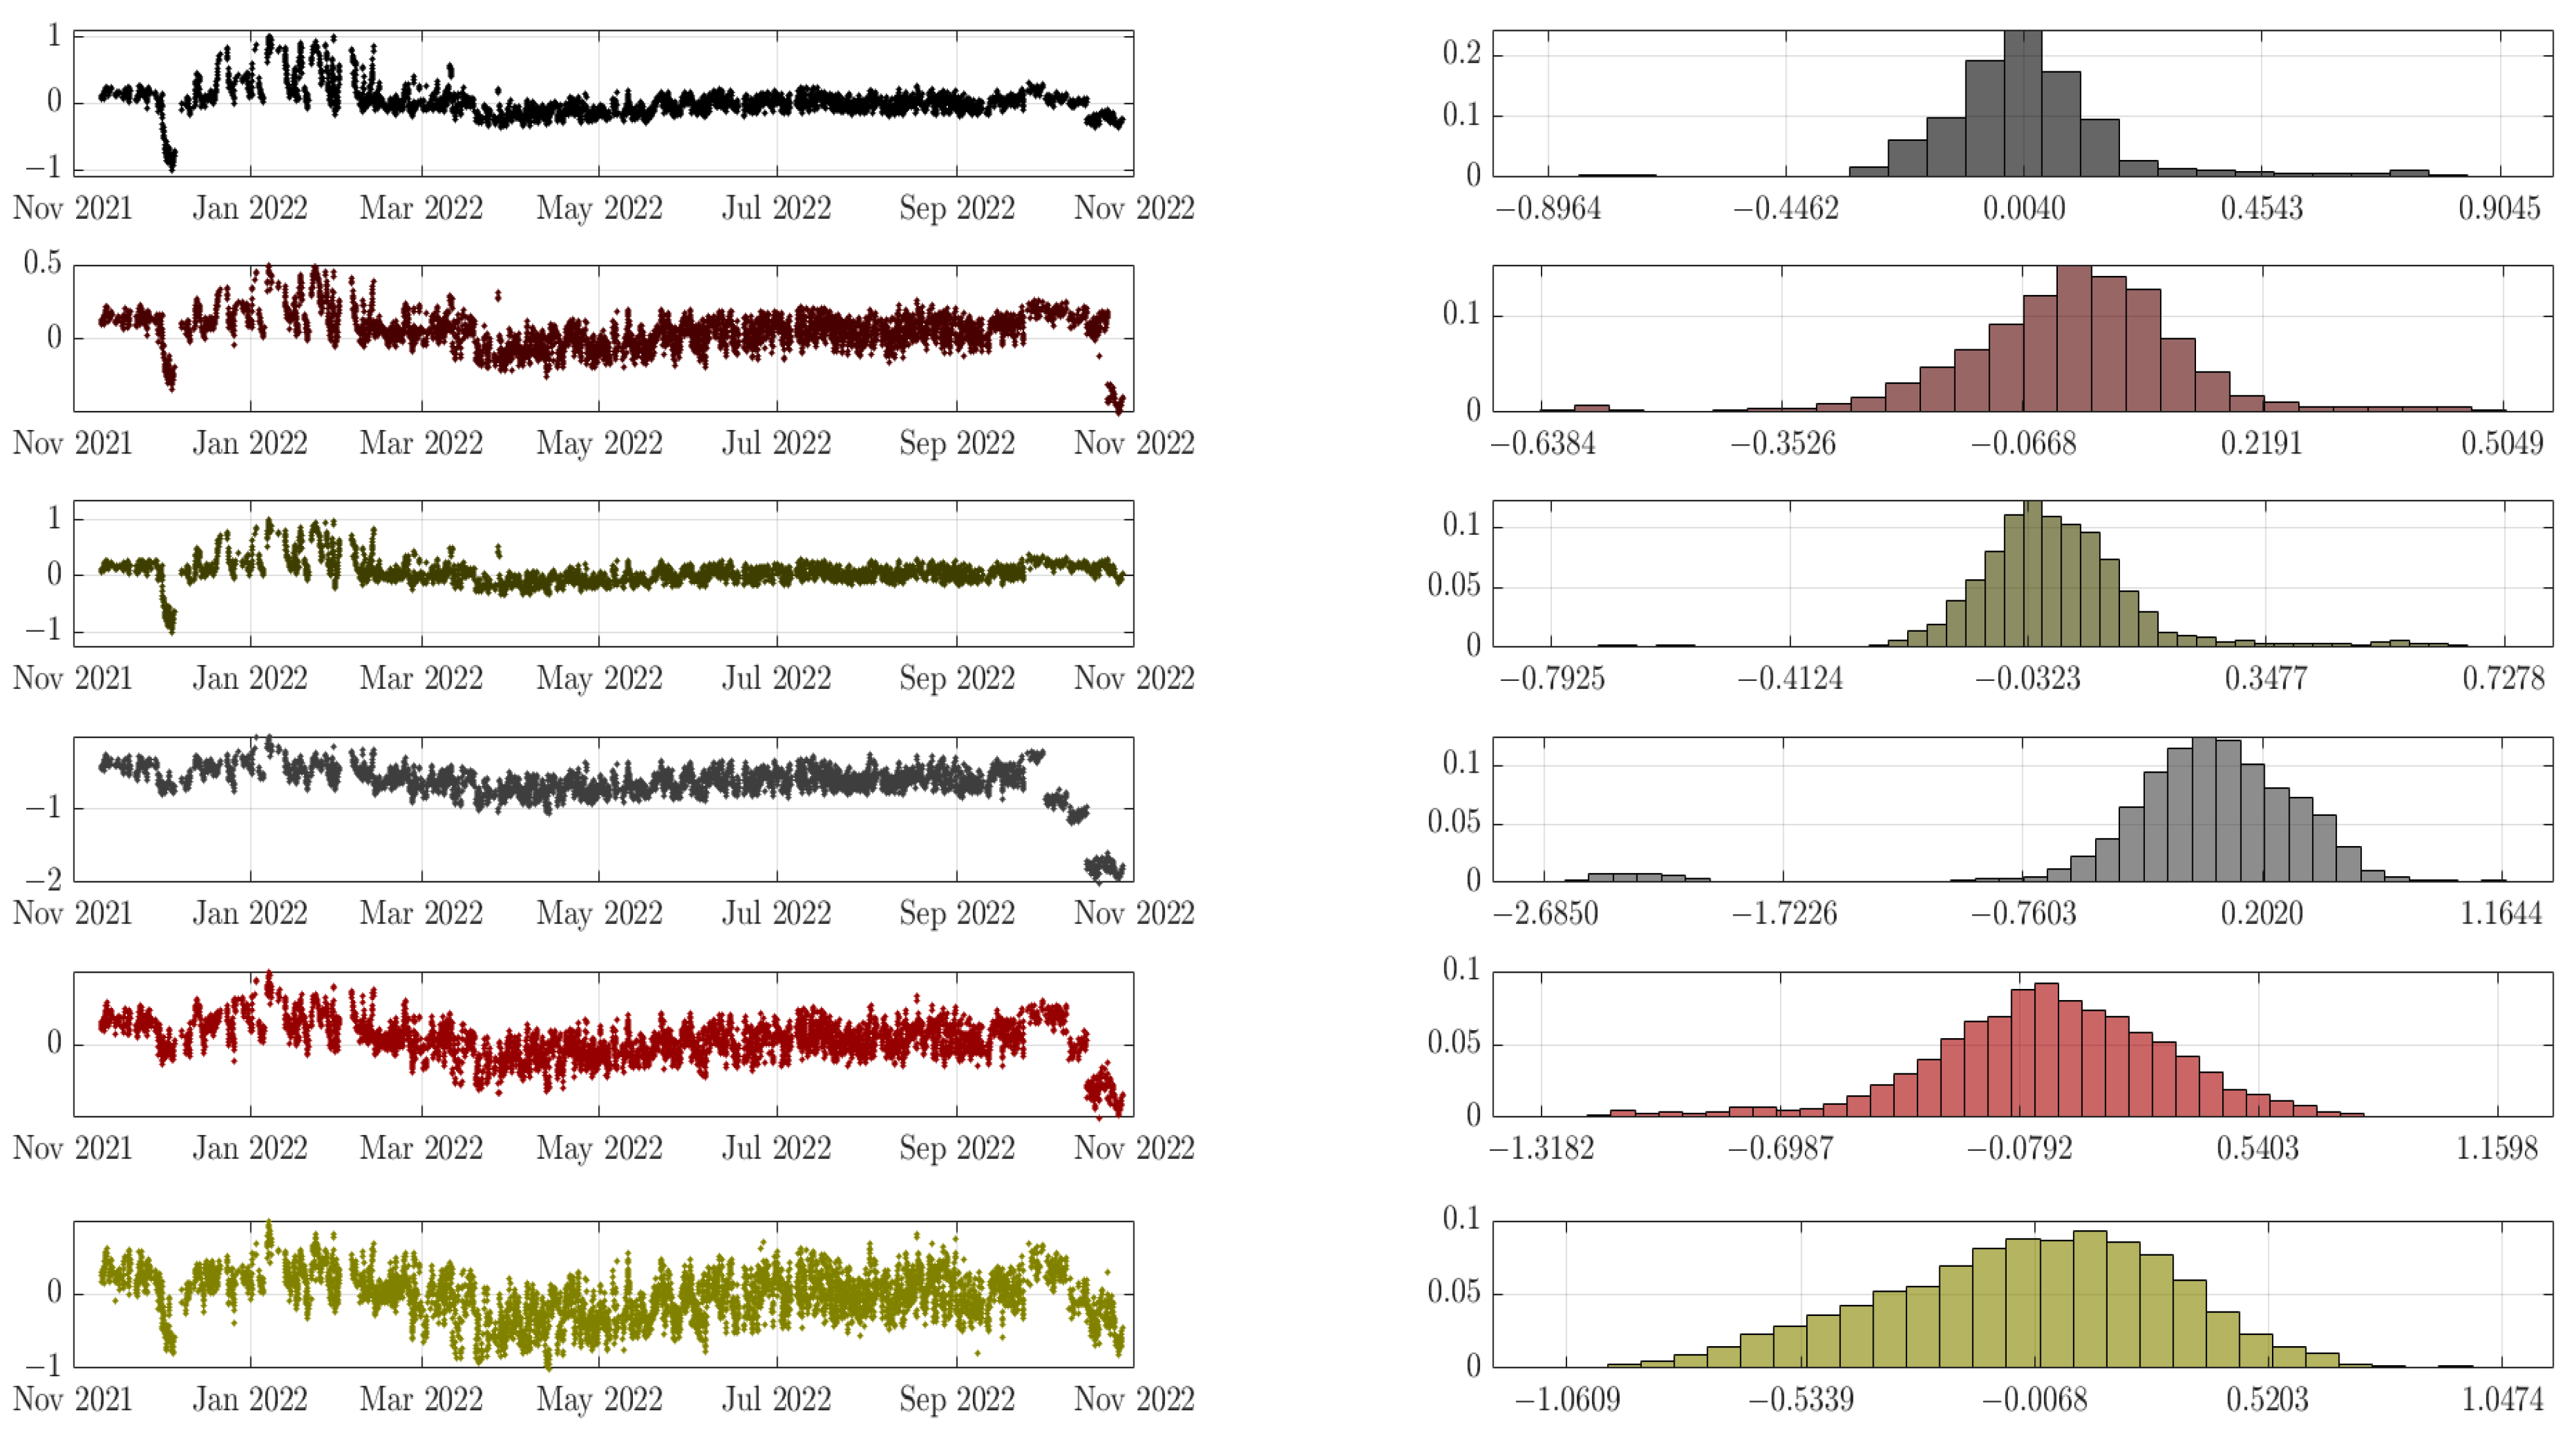
Residuals for each resonance frequency and their respective histograms are shown in Figure 8. Optimization of the number of bins was performed in the same manner as that described in Section 3.2.2 “Probability density function estimates”. Visual evaluation of these histograms suggests that the residuals may have a normal distribution, although the histograms do have “heavy tails”. A normality test was conducted on the residuals of the resonance frequencies in program R using library nortest and its command ad.test (...) in order to conduct the Anderson–Darling test. Conducting a normality test implies testing the following hypotheses—null hypothesis H 0 : the probability distribution is normal versus an alternative hypothesis H 1 : the probability distribution is not normal. The results showing the p-values of the test (at 95% confidence) and the verdict on the hypothesis test are found in Table 4. The residuals of resonance frequencies are not normally distributed, since the p-values are all less than 0.05 and near zero. Hence, the null hypothesis is rejected. This finding is in accordance with the one stated by K. Worden in [16]. This outcome may be attributed to fluctuations that are still present in the winter period, as seen in the time series of residuals. Hence, the removal of the effects of environmental variables may have been imperfect.

3.3.3. Impact of Environmental Factors on Resonant Frequencies

The results indicating a change in the resonant frequencies under the influence of each separate environmental factor are shown in Figure 9. It is found that temperature has the largest overall effect on all resonance frequencies. This effect is observed as a decrease in the resonance frequency values. Temperature has the greatest influence on the resonance frequencies f 4 , f 5 , and f 6 . The second and third most important environmental factors are humidity and wind speed, both of which exhibit an increasing effect, with the strongest influence again observed on f 4 , f 5 , and f 6 . The least significant environmental variable is precipitation, which has a minor decreasing effect. Snow thickness has an almost similar increasing effect on all resonance frequencies.
The variations in the magnitude of impacts across different resonance frequencies indicate that environmental parameters do not influence all frequencies uniformly. The higher sensitivity of f 4 , f 5 , and f 6 to environmental changes suggests that these modes are more sensitive to external conditions.

3.4. Classification of Structural Integrity

The p-values of Mahalanobis distances (MD) are calculated using R program’s command pchisq (MD, df = K 1 , lower.tail = FALSE), where df is the number of degrees of freedom and is equal to number of variables minus one. The threshold value of p-values is set to 0.001. After the completion of the SVR hyperparameter optimization routine and establishing the centroid value, the following two different scenarios are considered in calculation of MD:
(1)
Residuals of all resonance frequencies E f 1 : f 6 are used. Here, N = 7583 , K = 6 .
(2)
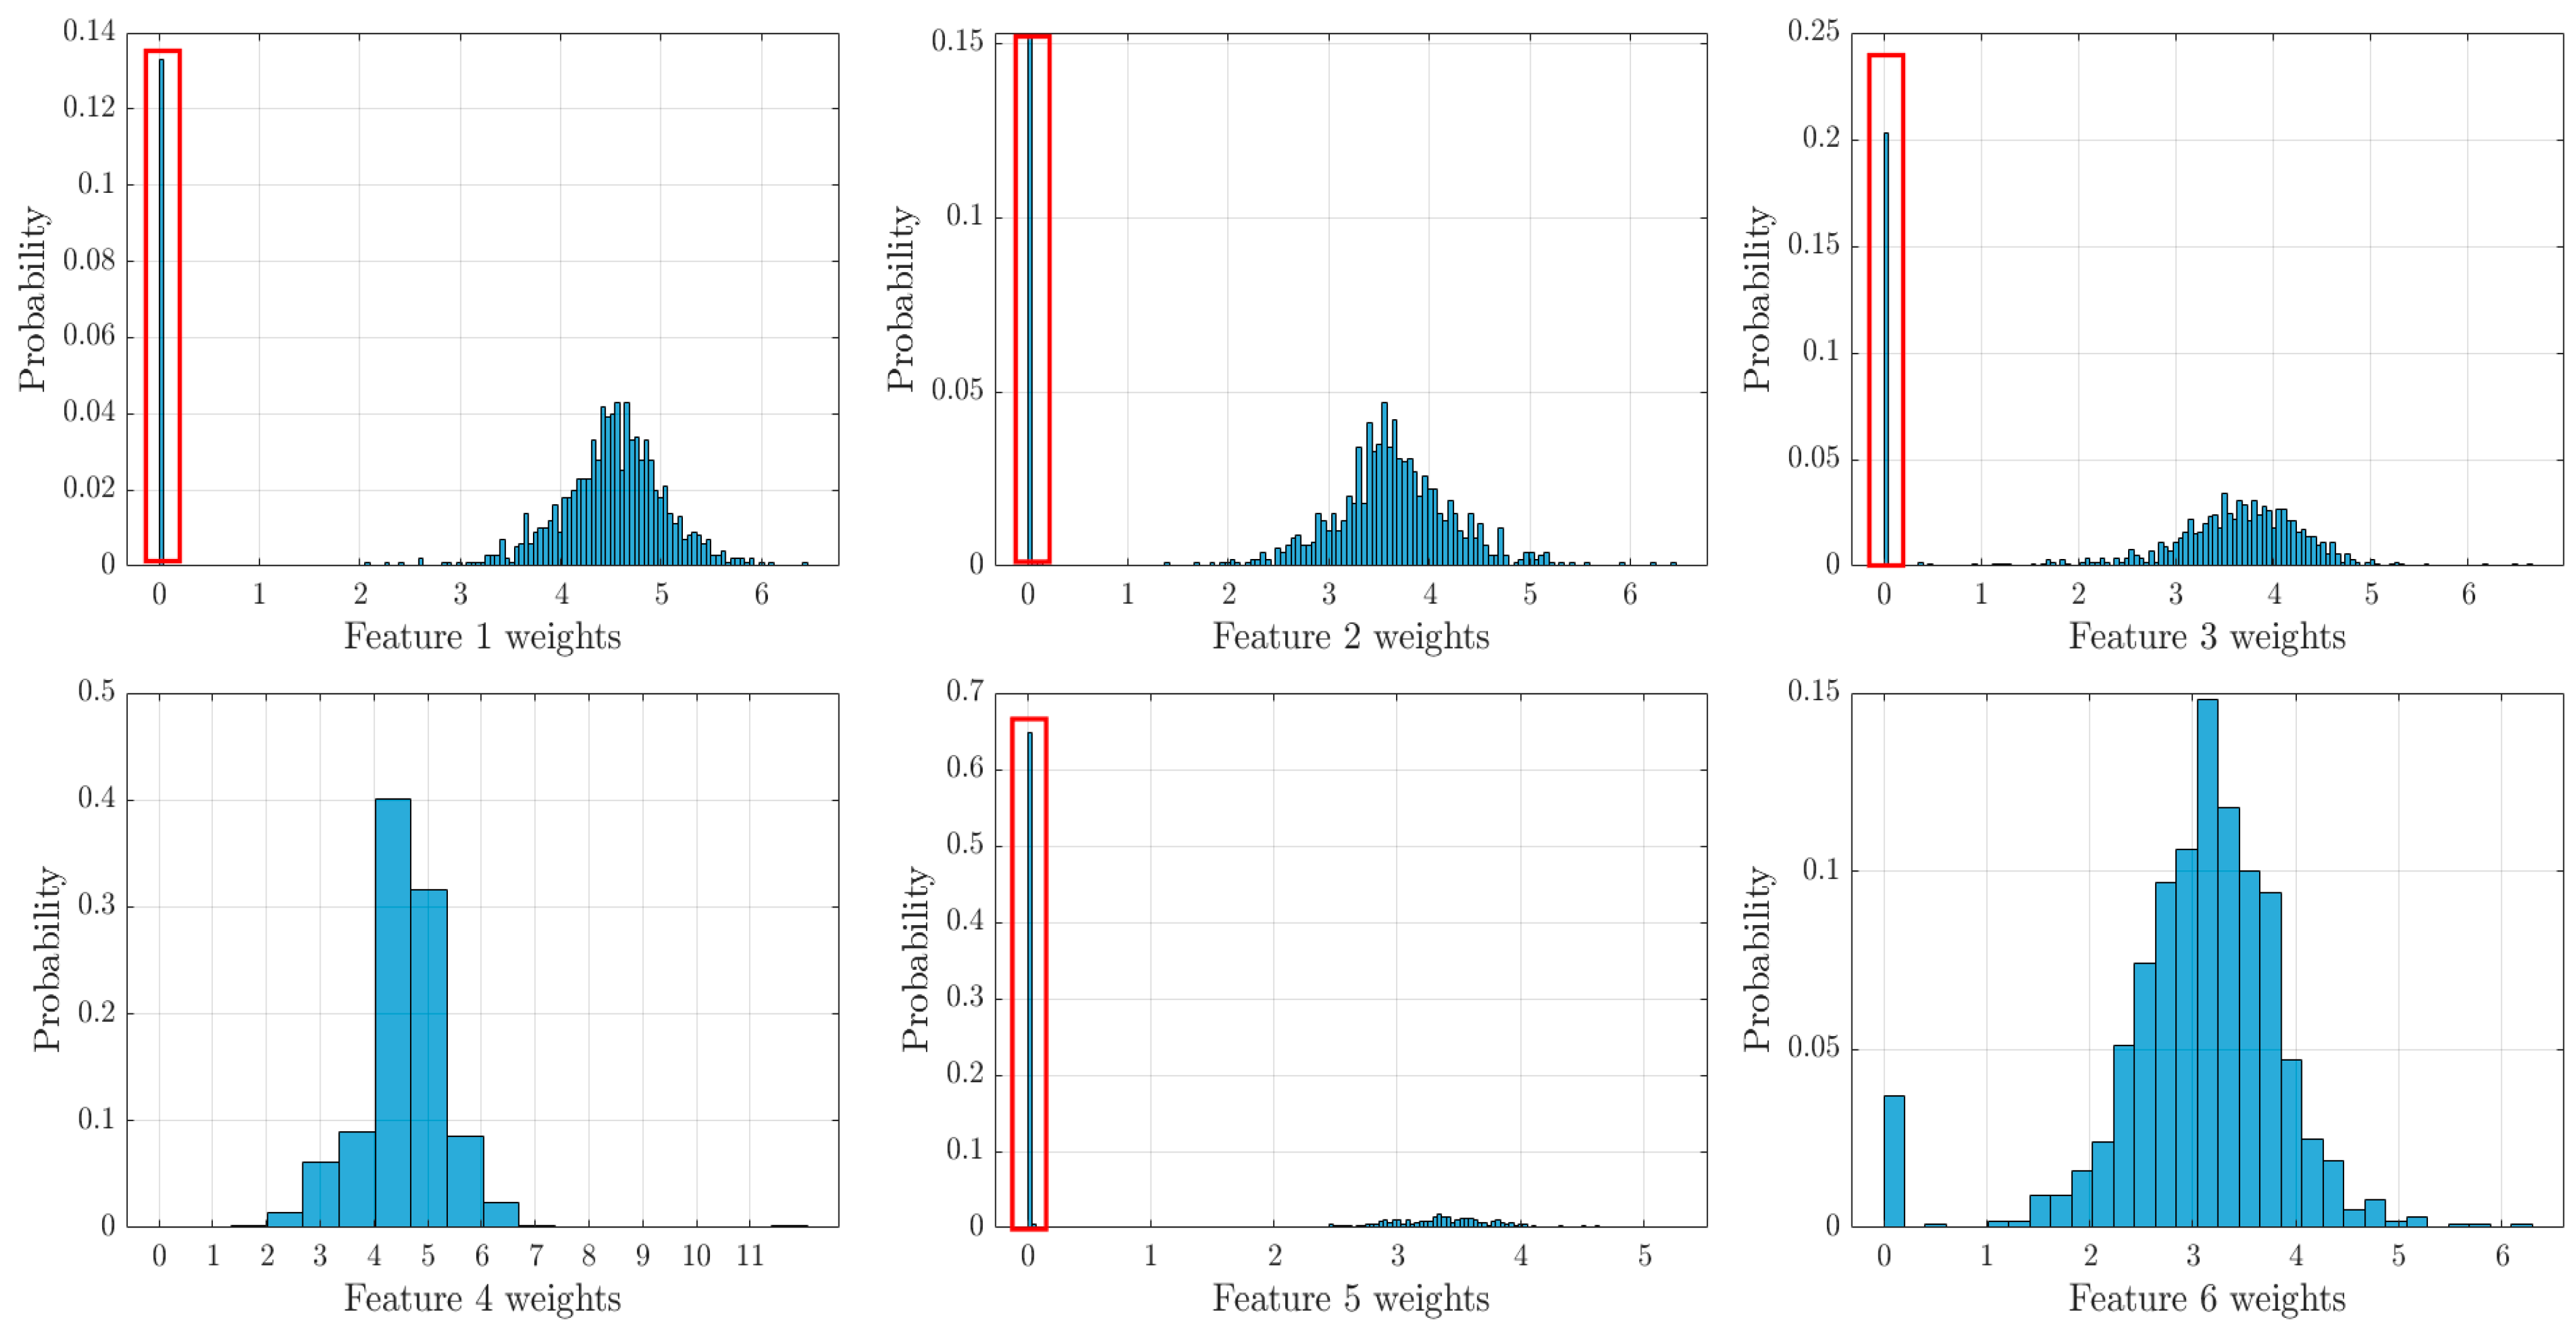
Only the most informative residuals are selected. The employment of the NCA algorithm results in using only two features with the largest importance weights—resonance frequencies no. 4 and 6, as shown in Figure 10. Thus, for this scenario E f 4 ,     f 6 . Then, N = 7583 and K = 2 . A total of 1000 NCA algorithm runs are performed, since the outcome of the procedure is not fully deterministic. In Figure 11, histograms of feature weights normalized to probability for residuals of each frequency are plotted. Bin number is optimized according to the procedure described earlier. As can be seen, large probabilities of very small feature weights are obtained for features (residuals) no. 1, 2, 3, and 5. These probabilities are, respectively, 0.133, 0.153, 0.203, and 0.649. Thus, these features do not contribute significantly due to small weights and are dismissed. On the other hand, features (residuals) no. 4 and 6 are retained.
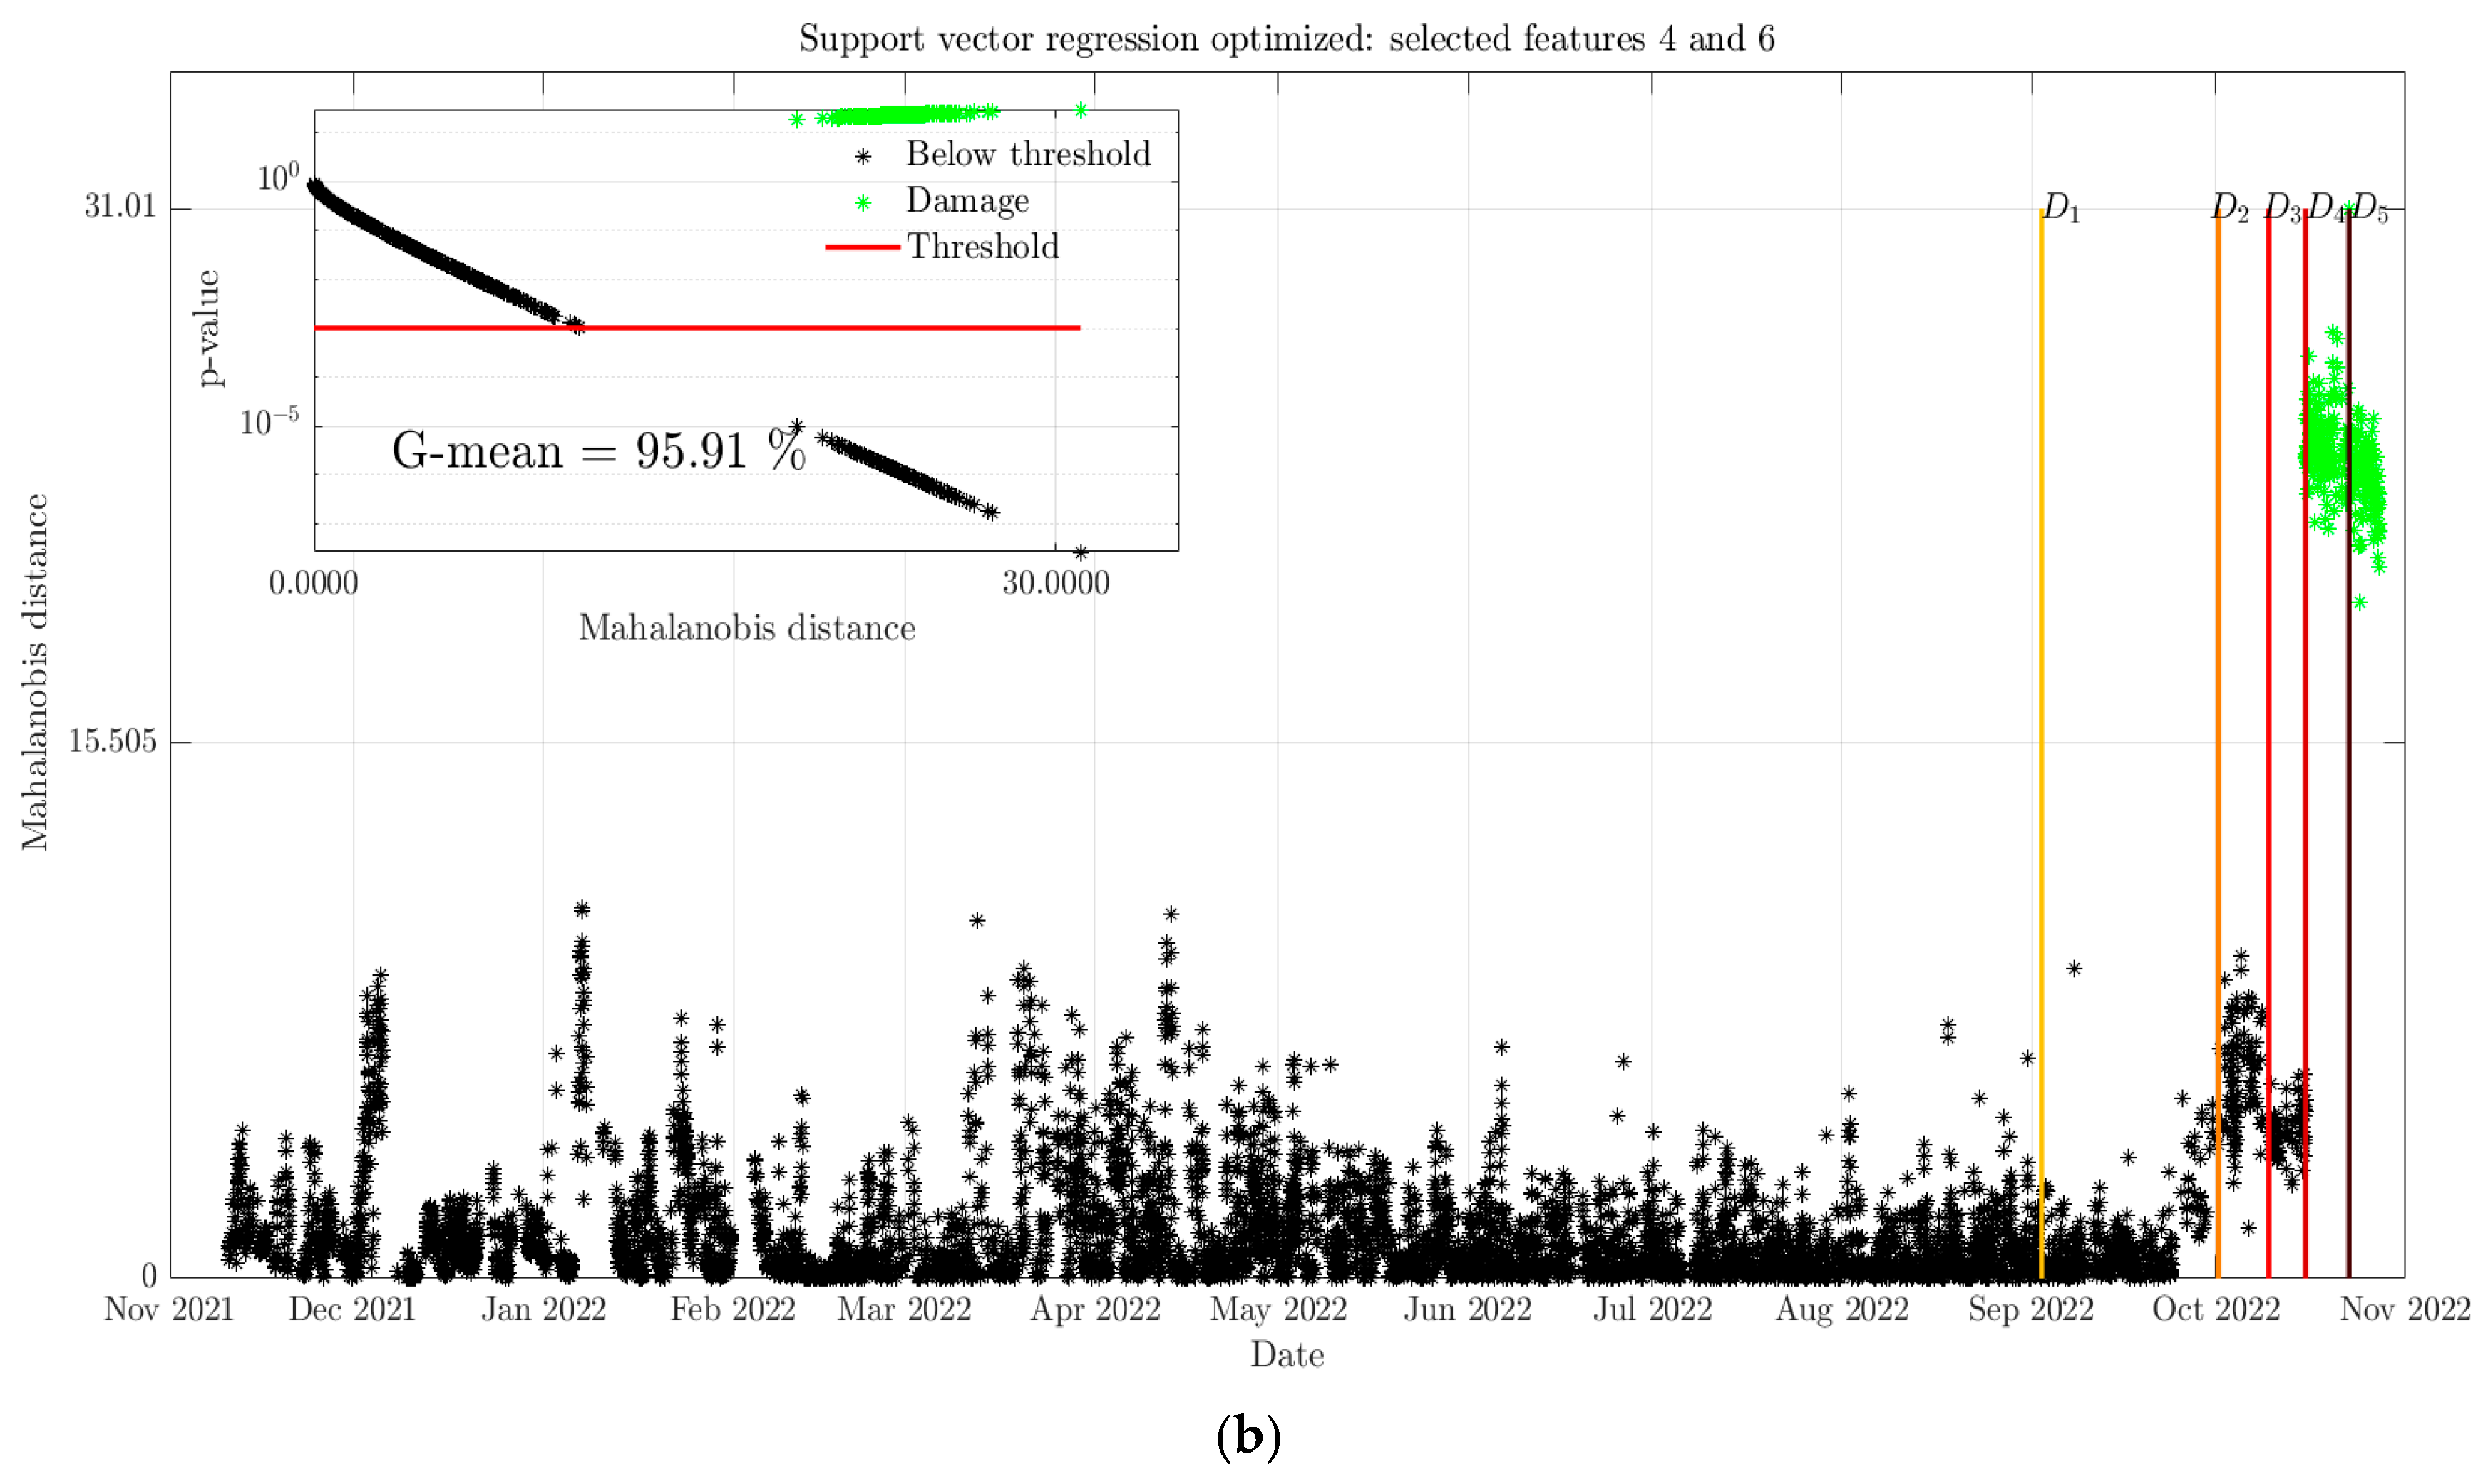
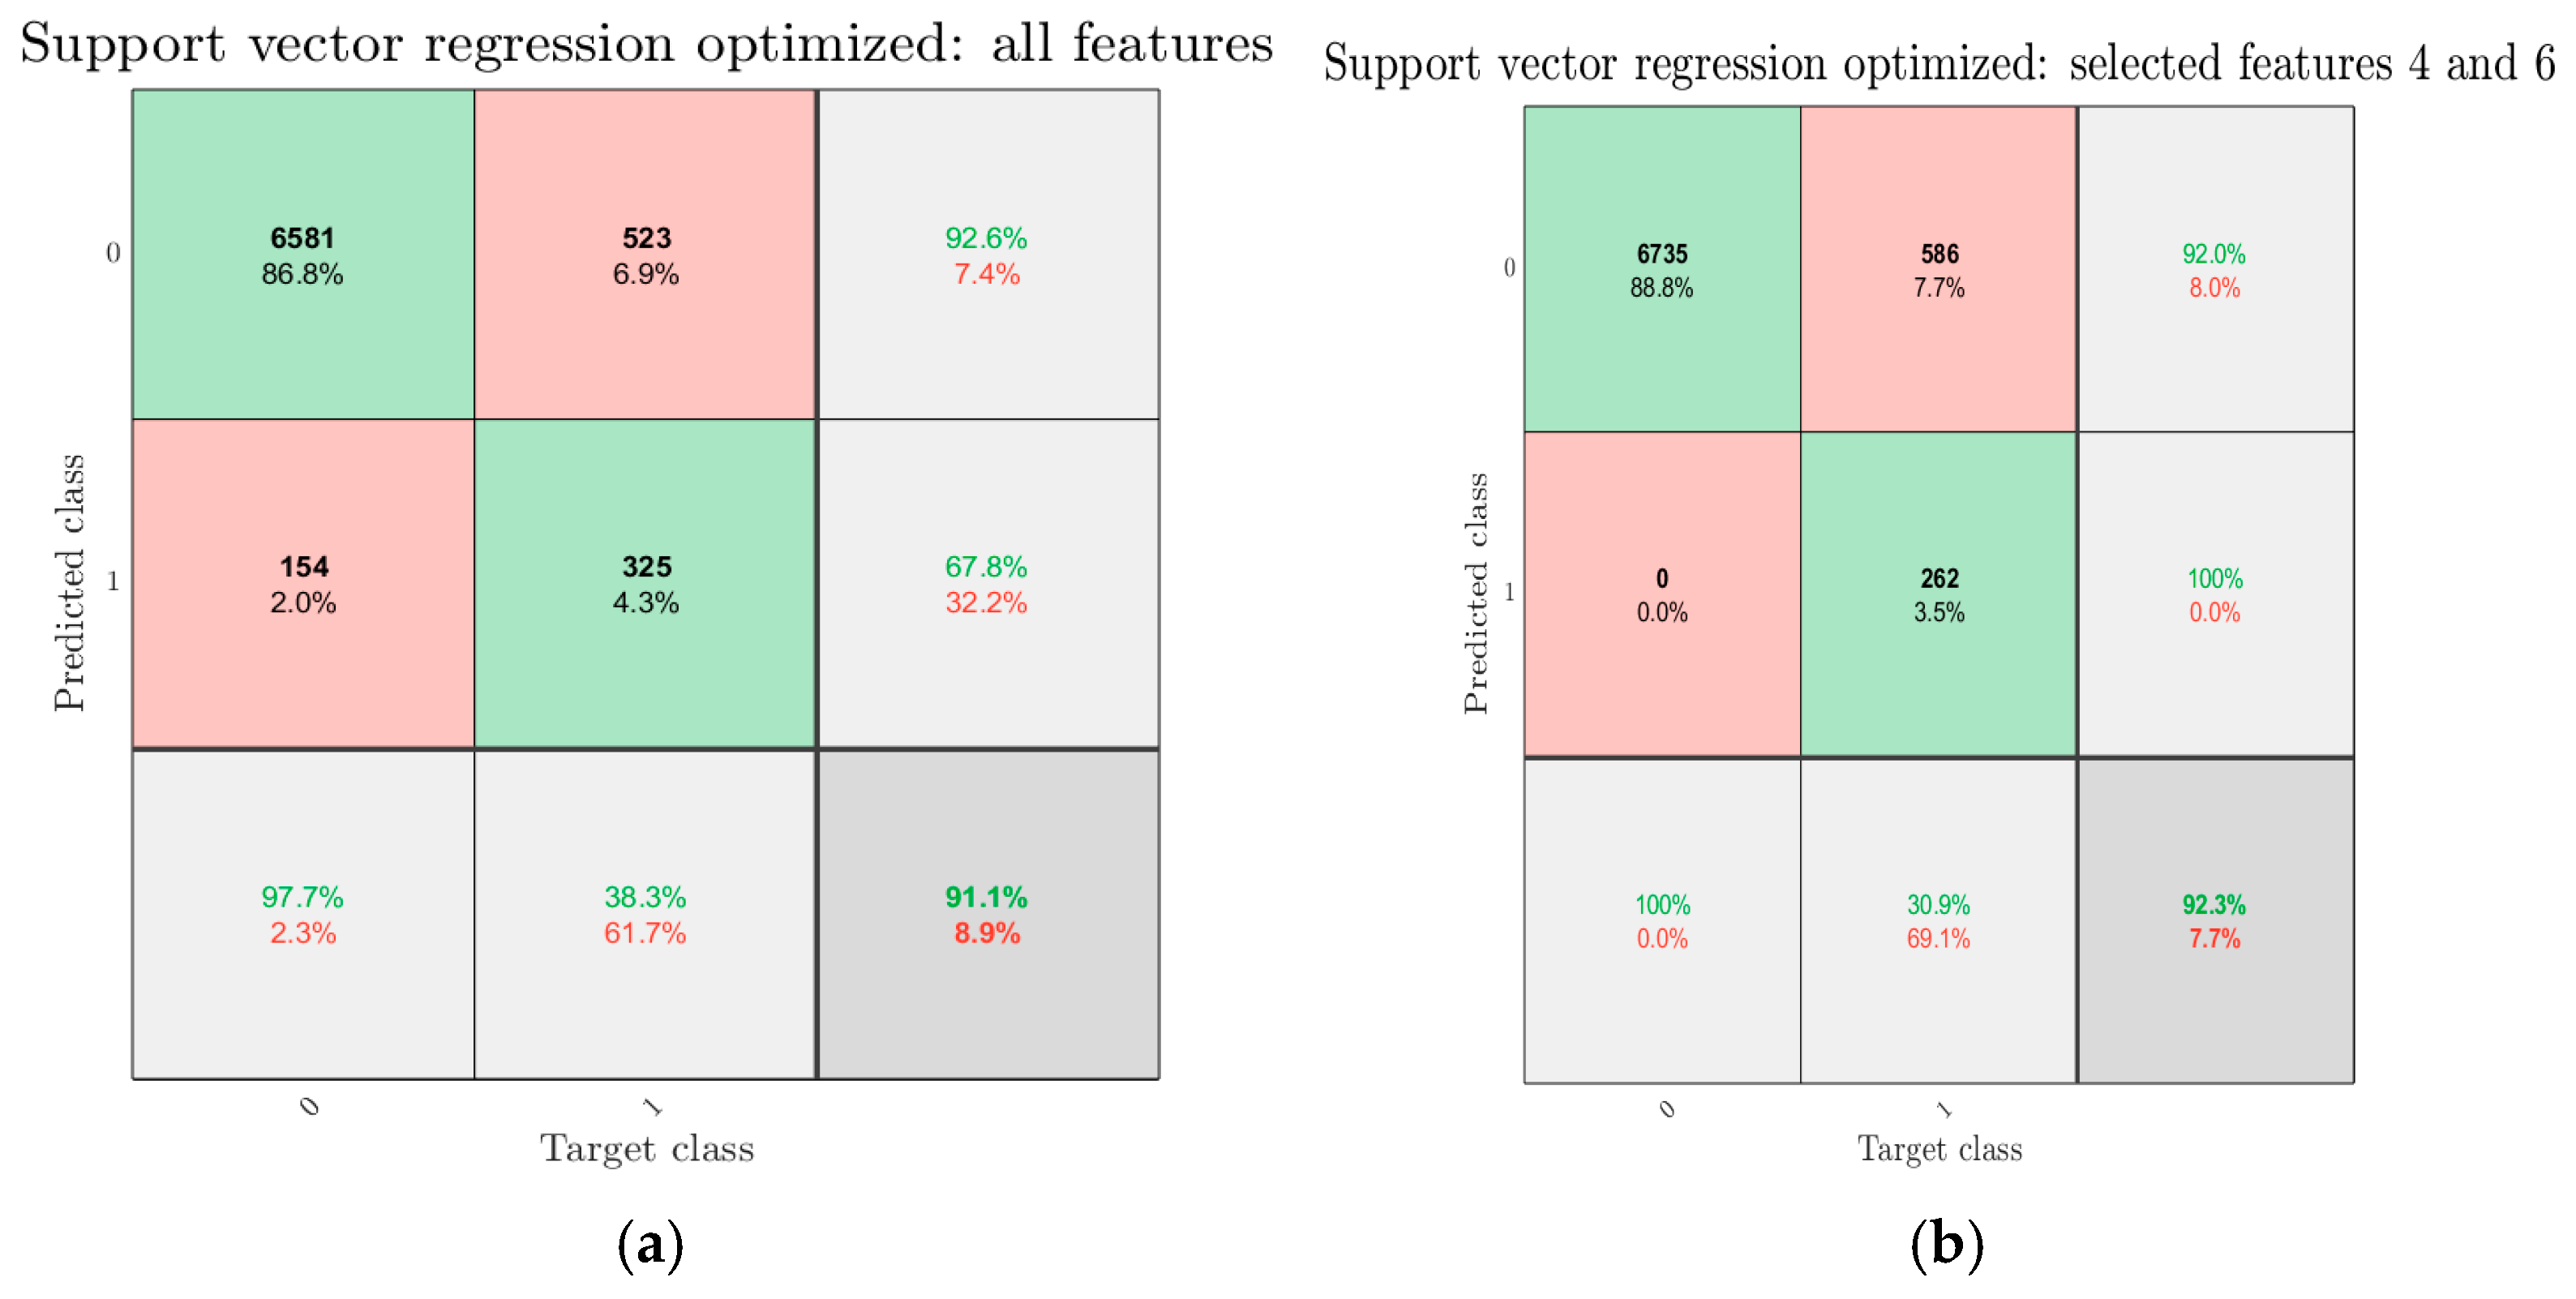
The dynamics of the Mahalanobis distance over the course of monitoring for both scenarios are illustrated in Figure 10a,b. The occurrence of structural modifications is marked with vertical lines. It is expected that an increase in MD values will be observed as more structural modifications are made, leading to the accumulation of changes in stiffness and mass. Observations exceeding the threshold and not related to structural modifications—“false alarm”—are shown in a red color, whilst observations correctly classified as “damage”—“true positives”—are shown in green. In addition, small inset graphs show the p-values of MD for each of the five scenarios and a red horizontal line marks the threshold p v a l = 0.001 . MD values below this threshold are deemed as outliers or damage. As a measure of classifier performance, the geometric mean is chosen, since, as opposed to the classification accuracy, it is valid for cases with imbalanced datasets. In our case, the number of observations at a healthy structural condition (6735) far outweighs those for the damaged condition (848). For a healthy class defined as “positive” and damaged class defined as “negative”, the geometric mean is calculated as follows:
G m e a n = T P T P + F N × T N T N + F P ,
where T P is true positives (correctly classified as healthy), T N is true negatives (correctly classified as damaged), F N is false negatives (incorrectly classified as damaged or “false alarm”), and F P is false positives (incorrectly classified as healthy or “missed detection”). Confusion matrices corresponding to both cases are provided in Figure 12a,b.
For the scenario when all features are used, the geometric mean is moderately high (79.28%), but there are numerous false alarms in winter months. The largest extent of structural modifications (interchangeably called “damage”), that is, observation intervals D 2 : D 3 , D 4 : D 5 , and D 5 + are correctly classified as damage. It is anticipated that the observation intervals D 1 : D 2 and D 3 : D 4 will also be classified correctly. Nevertheless, the respective MD values are too small to pass the threshold. It seems that the current approach is not sensitive to bolt tightening, which solely affects the global stiffness of the structure at question. On the other hand, as damage progresses, MD values increase. As expected, a more dramatic loss in mass (removal of slats) is able to initiate more significant changes in MD.
When using only the selected features, a very high geometric mean is obtained (95.91%) on account that all MD values of a healthy condition are below the threshold, so there are no false alarms. On the other hand, the proportion of missed detections is greater than that for the case where all features are used. Here, only the last two damage cases are classified correctly. Moreover, these last two damage cases have a significantly higher MD values than the rest of the damage cases.
In general, a vast majority of false alarms are associated with the winter period, where there are peaks in resonance frequency values. It seems that such fluctuations in resonance frequency values are difficult to predict accurately. The detection of damage is problematic when only the stiffness is changed. Better results are achieved with changes in mass, even though a progressive reduction in mass does not yield a steady progression of damage indicators (MD in our study). The differences in damage detection accuracy may be due to the structural influence of each slat on the overall modal properties. The final two damage cases are correctly classified, likely because the removed slats have a stronger effect on the global structural stiffness and mass distribution. Conversely, slat #2, being located in a region with a lower modal sensitivity, has a smaller impact on frequency changes, leading to less detectable effects in the classification process.

4. Summary and Conclusions

A methodology for operational modal analysis-based structural damage detection in the presence of varying environmental factors, such as temperature, humidity, wind speed, precipitation, and snow thickness, was developed. The key aspects of this methodology were the estimation and removal of the effects of different environmental factors on resonant frequencies using the support vector regression algorithm. The obtained residuals between the regression model and the resonance frequencies identified from the measured acceleration time series were used as inputs for the calculation of the Mahalanobis distance (MD). As a second scenario, the nearest component analysis algorithm was employed on the residuals to select the most important features (residuals) as inputs for the MD. The methodology was applied to a 1.2 m high model of a two-story wooden shear building exposed to ambient environmental conditions over the course of approximately one year. Artificial structural modifications consisting of bolt tightening and the removal of structural elements were introduced sequentially to simulate the progression of damage, leading to changes in the mass and stiffness of the structure. The following conclusions were formulated:
  • No visible indications of damage could be seen from the measured acceleration signals. On the other hand, the use of the MD statistical indicator revealed the progression of damage.
  • Analysis of the Pearson correlation coefficients revealed that the resonance frequencies exhibited a strong positive mutual linear correlation. However, a visual inspection of scatterplots between variables suggested that the relationship between the resonant frequencies and all environmental factors was nonlinear.
  • Estimation of impacts of environmental factors on the resonant frequencies showed that temperature had a dominant effect on all resonance frequencies overall and this effect was to decrease the frequency values. The second most important variable was humidity and also wind speed, which both increased the values of all resonant frequencies. Precipitation was a negligible factor, while snow thickness was moderately important.
  • The residuals of resonance frequencies obtained through the support vector regression were not normally distributed. This may have been related to the partial mitigation of environmental effects on resonant frequencies, especially the significant fluctuations occurring during the winter period.
  • The detection of damage was formulated as a classification task and classification performance was assessed via the geometric mean (G-mean), which is suitable for imbalanced datasets. In general, the classification performance was about 79% and 96% for the scenarios of using all features and selecting only the most informative features, respectively. In both scenarios, bolt tightening was not detected as damage, since the associated MD values were below the threshold. It may have been that the induced resonance frequency changes were not significant enough. For this purpose, other damage-sensitive features, for example, autoregressive coefficients derived from the measured signals, may prove to be more effective. Such an approach was used in [41,42,43]. Other types of damage were successfully detected, even though a single case of the removal of a structural element was not detected. This may have been due to the location of this element relative to the position of accelerometers.
  • The largest proportion of false alarms was observed in the winter months, where the resonance frequencies had the largest deviations from the mean value. This stemmed from the non-normality of the residuals (see point 4) and implied that the removal of the temperature effect was not entirely complete. The selection of features resulted in significant reduction in false alarms, but also increased the masking of damage. Here, there was a trade-off between both types of errors—missed damage detections and false alarms. In the case when structural collapse could lead to a loss of human lives, it is preferable to minimize the possibility of missed damage detections, since each occurrence of damage may be catastrophic (depending on the structural exploitation conditions). False alarms can only cause inconvenience. From this point of view, feature selection actually worsened the performance of the model, even though the overall performance indicator (the G-mean) was higher.
The future application of the proposed methodology is envisioned on a TV tower in Riga, Latvia. This is a 368.5 m high, large-scale strategic structure for radio and television signal transmission operating under ambient environmental conditions. The main difference would be to use different sensors, as the TV tower is significantly bigger than the wooden frame structure, so more sensitive accelerometers (geophones) with a frequency band in a lower range would have to be applied.

Author Contributions

Conceptualization, R.J. and L.G.; methodology, R.J. and L.R.; software, R.J., L.R. and L.G.; validation, R.J. and L.R.; formal analysis, R.J. and L.R.; investigation, L.G.; resources, L.G. and S.R.; data curation, L.G.; writing—original draft preparation, R.J.; writing—review and editing, R.J., L.R. and S.R.; visualization, R.J. and L.R.; supervision, S.R.; project administration, S.R.; funding acquisition, S.R. All authors have read and agreed to the published version of the manuscript.

Funding

This research was partially funded by the Latvian Council of Science project “Smart Materials, Photonics, Technologies and Engineering Ecosystem” (project No. VPP-EM-FOTONIKA-2022/1-0001).

Data Availability Statement

The data that support the findings of this study are available upon reasonable request. The data are not publicly available due to ongoing research process.

Conflicts of Interest

The authors declare no conflicts of interest. The funders had no role in the design of the study; in the collection, analyses, or interpretation of data; in the writing of the manuscript; or in the decision to publish the results.

Abbreviations

The following abbreviations are used in this manuscript:
SHMStructural health monitoring
MDMahalanobis distance
DSFDamage-sensitive features
OMAOperational modal analysis
SVRSupport vector regression
NCANeighborhood component analysis
G-meanGeometric mean

References

  1. William, C.; Salawu, O.S. Damping as a damage indication parameter. In Proceedings of the 15th International Modal Analysis Conference, Tokyo, Japan, 1–4 September 1997; pp. 1531–1536. [Google Scholar]
  2. Chang, K.C.; Kim, C.W. Modal parameter identification and vibration-based damage detection of a damaged steel trussed bridge. Eng. Struct. 2016, 122, 156–173. [Google Scholar] [CrossRef]
  3. Janeliukstis, R.; McGugan, M. Control of damage-sensitive features for early failure prediction of wind turbine blades. Struct. Control Health Monit. 2022, 29, e2852. [Google Scholar] [CrossRef]
  4. Song, M.; Mehr, N.P.; Moaveni, B.; Hines, E.; Ebrahimian, H.; Bajric, A. One year monitoring of an offshore wind turbine: Variability of modal parameters to ambient and operational conditions. Eng. Struct. 2023, 297, 117022. [Google Scholar]
  5. Figueiredo, E.; Park, G.; Farrar, C.R.; Worden, K.; Figueiras, J. Machine learning algorithms for damage detection under operational and environmental variability. Struct. Health Monit. 2011, 10, 559–572. [Google Scholar] [CrossRef]
  6. Weijtjens, W.; Verbelen, T.; Sitter, G.D.; Devriendt, C. Foundation structural health monitoring of an offshore wind turbine a full-scale case study. Struct. Health Monit. 2016, 15, 389–402. [Google Scholar] [CrossRef]
  7. Peeters, B.; De Roeck, G. Reference-based stochastic subspace identification for output-only modal analysis. Mech. Syst. Signal Pr. 1999, 13, 855–878. [Google Scholar] [CrossRef]
  8. Figueiredo, E.; Peres, N.; Moldovan, I.; Nasr, A. Impact of climate change on long-term damage detection for structural health monitoring of bridges. Struct. Health Monit. 2024. [Google Scholar] [CrossRef]
  9. Rodrigues, M.; Miguéis, V.L.; Felix, C.; Rodrigues, C. Machine learning and cointegration for structural health monitoring of a model under environmental effects. Expert. Syst. Appl. 2024, 238, 121739. [Google Scholar] [CrossRef]
  10. Leibniz University Hannover; Kahrger, B.; Möller, S.K.; Jonscher, C.; Grießmann, T.; Rolfes, R. Detectability of structural damage to a lattice tower using eigenfrequencies and Gaussian Process Regression. Res. Rev. J. Nondestruct. Test. 2024, 2, 1–12. [Google Scholar] [CrossRef]
  11. Cava, C.R.D.G.; Avendaño-Valencia, L. Addressing practicalities in multivariate nonlinear regression for mitigating environmental and operational variations. Struct. Health Monit. 2023, 22, 1237–1255. [Google Scholar]
  12. Gaile, L.; Amador, S.; Brincker, R. Initial results from the continuous monitoring campaign of a wooden frame specimen. In Proceedings of the 9th International Modal Analysis Conference, Vancouver, BC, Canada, 3–6 July 2022. [Google Scholar]
  13. Ubertini, F.; Comanducci, G.; Cavalagli, N.; Pisello, A.L.; Materazzi, A.L.; Cotana, F. Environmental effects on natural frequencies of the San Pietro bell tower in Perugia, Italy, and their removal for structural performance assessment. Mech. Syst. Signal Pr. 2017, 82, 307–322. [Google Scholar] [CrossRef]
  14. Avendaño-Valencia, L.D.; Chatzi, E.N. Sensitivity driven robust vibration-based damage diagnosis under uncertainty through hierarchical bayes time-series representations. Procedia Eng. 2017, 199, 1852–1857. [Google Scholar]
  15. Zhang, H.; Guo, J.; Xie, X.; Bie, R.; Sun, Y. Environmental effect removal based structural health monitoring in the internet of things. In Proceedings of the Seventh International Conference on Innovative Mobile and Internet Services in Ubiquitous Computing, Taichung, Taiwan, 3–5 July 2013; pp. 512–517. [Google Scholar] [CrossRef]
  16. Deraemaeker, A.; Worden, K. A comparison of linear approaches to filter out environmental effects in structural health monitoring. Mech. Syst. Signal Pr. 2018, 10, 1–15. [Google Scholar] [CrossRef]
  17. Giglioni, V.; García-Macías, E.; Venanzi, I.; Ierimonti, L.; Ubertini, F. The use of receiver operating characteristic curves and precision-versus-recall curves as performance metrics in unsupervised structural damage classification under changing environment. Eng. Struct. 2021, 246, 113029. [Google Scholar] [CrossRef]
  18. Cieri, L.; De Corso, A.; Fabbrocino, G.; Rainieri, C. Analysis of environmental effects on the natural frequencies of the Civitacampomarano’s belfry. In Proceedings of the International Conference on Operational Modal Analysis (IOMAC 2024), Naples, Italy, 22–24 May 2024; pp. 166–176. [Google Scholar]
  19. De Corso, A.; Rainieri, C. Extreme value statistics for alarm threshold setting in data-driven damage detection. In Proceedings of the International Conference on Operational Modal Analysis (IOMAC 2024), Naples, Italy, 22–24 May 2024; pp. 3–14. [Google Scholar]
  20. Sarmadi, H.; Yuen, K.V. Structural health monitoring by a novel probabilistic machine learning method based on extreme value theory and mixture quantile modeling. Mech. Syst. Signal Pr. 2022, 173, 109049. [Google Scholar] [CrossRef]
  21. Entezami, A.; Shariatmadar, H.; De Michele, C. Non-parametric empirical machine learning for short-term and long-term structural health monitoring. Struct. Health Monit. 2022, 21, 2700–2718. [Google Scholar] [CrossRef]
  22. Amer, A.; Kopsaftopoulos, F. Gaussian process regression for active sensing probabilistic structural health monitoring: Experimental assessment across multiple damage and loading scenarios. Struct. Health Monit. 2023, 22, 1105–1139. [Google Scholar] [CrossRef]
  23. Dia, A.; Makhoul, N. Comparison of modal parametric and nonparametric vibration-based techniques. In Proceedings of the 12th International Conference on Bridge Maintenance, Safety and Management (IABMAS), Copenhagen, Denmark, 24–28 June 2024; pp. 769–776. [Google Scholar]
  24. Kuok, S.C.; Yuen, K.V.; Roberts, S.; Girolami, M.A. Propagative broad learning for nonparametric modeling of ambient effects on structural health indicators. Struct. Health Monit. 2021, 20, 1409–1427. [Google Scholar]
  25. Helbing, G.; Ritter, M. Deep learning for fault detection in wind turbines. Renew. Sust. Energ. Rev. 2018, 98, 189–198. [Google Scholar]
  26. Bangalore, P.; Patriksson, M. Analysis of SCADA data for early fault detection, with application to the maintenance management of wind turbines. Renew. Energ. 2018, 115, 521e532. [Google Scholar] [CrossRef]
  27. Garcia, D.; Tcherniak, D.; Trendafilova, I. Damage assessment for wind turbine blades based on a multivariate statistical approach. J. Phys. Conf. Ser. 2015, 628, 012086. [Google Scholar]
  28. Sarmadi, H.; Karamodin, A. A novel anomaly detection method based on adaptive Mahalanobis-squared distance and one-class kNN rule for structural health monitoring under environmental effects. Mech. Syst. Signal Pr. 2020, 140, 106495. [Google Scholar]
  29. Mousavi, M.; Gandomi, A.H. Structural health monitoring under environmental and operational variations using MCD prediction error. J. Sound. Vib. 2021, 512, 116370. [Google Scholar]
  30. Smola, A.J.; Schölkopf, B. A tutorial on support vector regression. Stat. Comput. 2004, 14, 199–222. [Google Scholar]
  31. Cristianini, N.; Shawe-Taylor, J. An Introduction to Support Vector Machines and Other Kernel-Based Learning Methods; Cambridge University Press: Cambridge, UK, 2000. [Google Scholar]
  32. Snoek, J.; Larochelle, H.; Adams, R.P. Practical Bayesian Optimization of Machine Learning Algorithms. In Advances in Neural Information Processing Systems; Pereira, F., Burges, C.J., Bottou, L., Weinberger, K.Q., Eds.; Curran Associates, Inc.: Newry, UK, 2012. [Google Scholar]
  33. Agrawal, A.K.; Chakraborty, G. Neighborhood component analysis to leverage the class label information during feature selection to enhance the damage classification performance. Structures 2023, 57, 105174. [Google Scholar]
  34. Janeliukstis, R.; Mironovs, D.; Safonovs, A. Statistical structural integrity control of composite structures based on an automatic operational modal analysis—A review. Mech. Compos. Mater. 2022, 58, 181–208. [Google Scholar]
  35. Sohn, H.; Farrar, C.R.; Hunter, N.F.; Worden, K. Structural health monitoring using statistical pattern recognition techniques. J. Dyn. Syst-T ASME 2011, 123, 706–711. [Google Scholar]
  36. Colone, L.; Hovgaard, M.K.; Glavind, L.; Brincker, R. Mass detection, localization and estimation for wind turbine blades based on statistical pattern recognition. Mech. Syst. Signal Pr. 2018, 107, 266–277. [Google Scholar]
  37. Tabachnick, B.G.; Fidell, L.S. Using Multivariate Statistics, 5th ed.; Pearson/Allyn Bacon: Boston, MA, USA, 2007. [Google Scholar]
  38. Janeliukstis, R.; Rucevskis, S.; Chate, A. Condition monitoring with defect localisation in a two-dimensional structure based on linear discriminant and nearest neighbour classification of strain features. Nondestruct. Test. Eva 2020, 35, 48–72. [Google Scholar]
  39. Janeliukstis, R.; Mironovs, D. Wavelet-based output-only damage detection of composite structures. Sensors 2023, 23, 6121. [Google Scholar] [CrossRef]
  40. Wah, W.S.L.; Chen, Y.T.; Elamin, A.; Roberts, G.W. Damage detection under temperature conditions using PCA—An application to the Z24 Bridge. Proc. Inst. Civ. Eng. Struct. Build. 2020, 175, 1–13. [Google Scholar]
  41. Mosavi, A.A.; Dickey, D.A.; Seracino, R.; Rizkalla, S. Identifying damage locations under ambient vibrations utilizing vector autoregressive models and Mahalanobis distances. Mech. Syst. Signal Pr. 2012, 26, 254–267. [Google Scholar]
  42. Nandan, H.; Abrahamson, E.; Wang, X.; Brinkmann, C. Time series based damage detection and localization in an offshore platform using wireless sensor networks. In Proceedings of the 33rd International Conference on Ocean, Offshore and Arctic Engineering (OMAE14), San-Francisco, CA, USA, 8–13 June 2014. [Google Scholar]
  43. Siddiqui, M.A.; Zonzini, F.; Quqa, S.; Palermo, A.; Landucci, M. A damage detection strategy based on autoregressive parameters. In Proceedings of the International Conference on Operational Modal Analysis (IOMAC 2024), Naples, Italy, 22–24 May 2024; pp. 3–14. [Google Scholar]
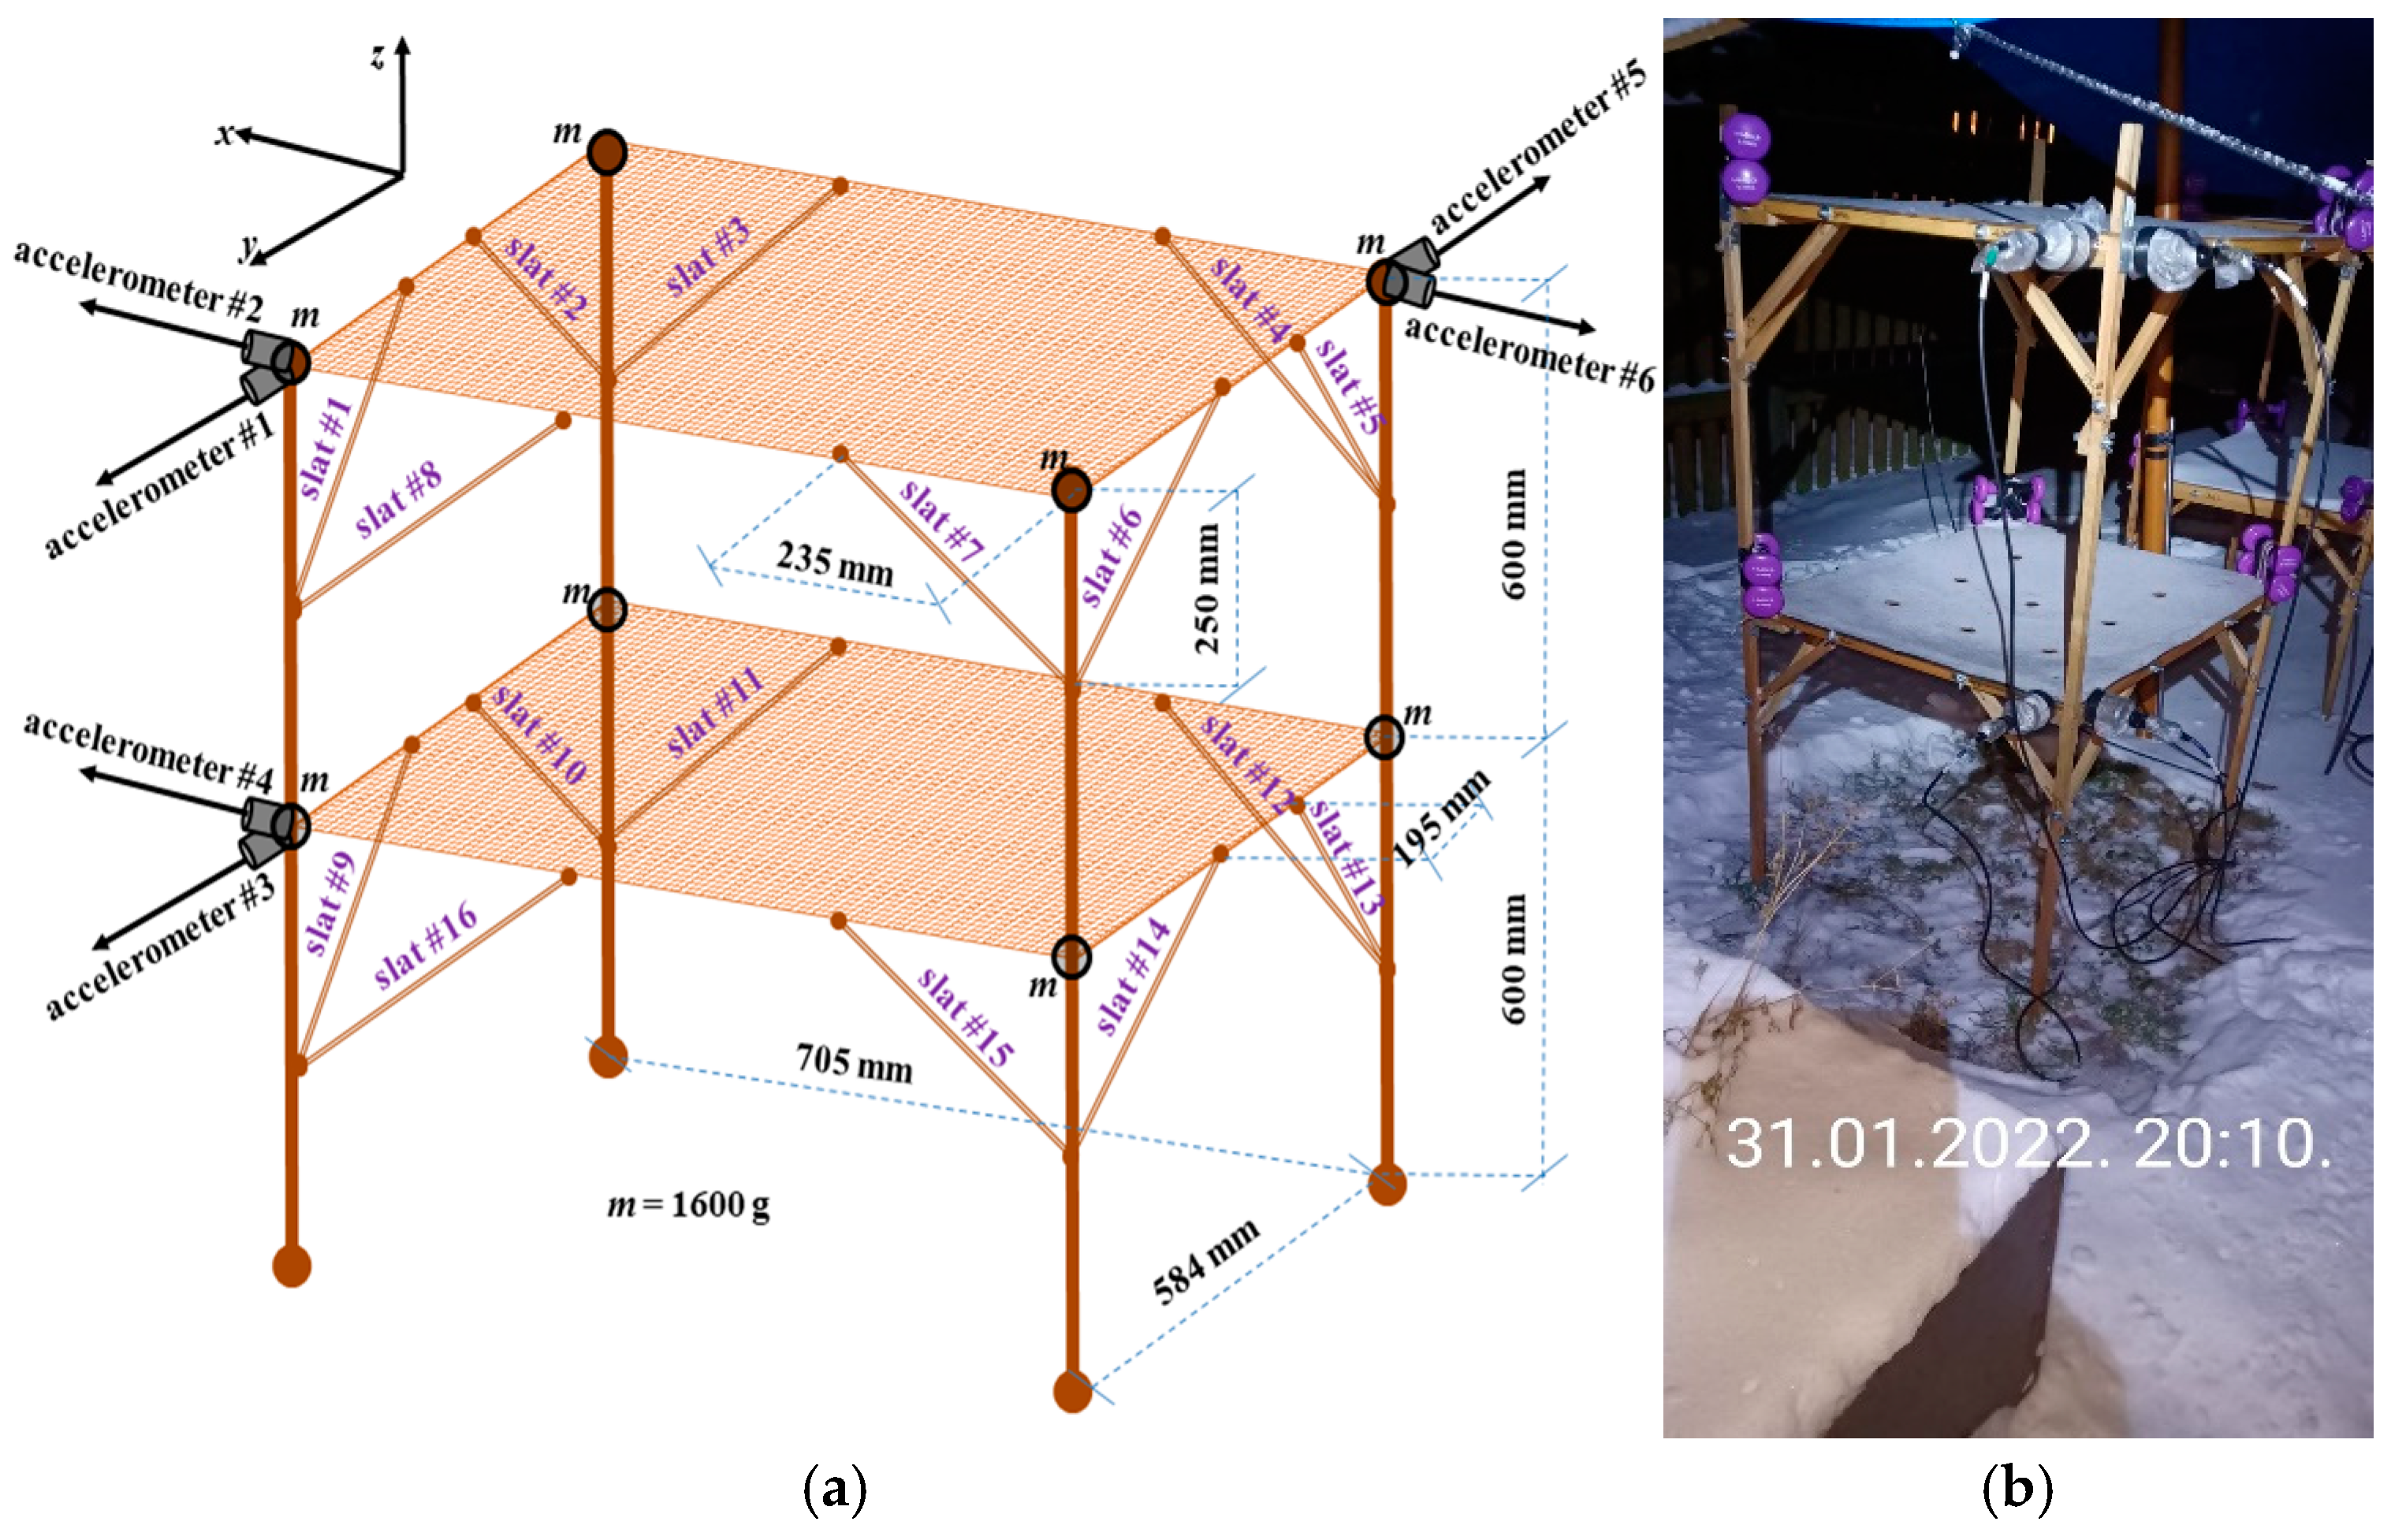
Figure 1. Structural health monitoring methodology with removal of environmental effects.
Jsan 14 00033 g001
Figure 2. Two-story truss structure for validation of the proposed damage detection methodology: (a) schematic representation of structural geometry and location of sensors and (b) photo during the period of monitoring in winter 2022 [12].
Jsan 14 00033 g002
Figure 3. Dynamics of variable values during the monitoring period (10 November 2021–27 October 2022).
Jsan 14 00033 g003
Figure 4. Variable histograms with optimized number of bins.
Jsan 14 00033 g004
Figure 5. Matrix of Pearson correlation coefficients between all variables. All resonance frequencies are with a high positive linear correlation between themselves. Strong negative correlation exists between resonant frequencies and temperature. Dark red color shows strong positive correlation, while dark blue color shows strong negative correlation.
Jsan 14 00033 g005
Figure 6. Scatterplots of relationship between the first resonance frequency f 1   and all environmental factors: (a) between the first and the second resonance frequencies; (b) temperature; (c) humidity; (d) wind speed; (e) precipitation; and (f) snow thickness. Strong positive linear relationship between the first two resonance frequencies is observed in accordance with the correlation matrix, whilst the environmental factors display nonlinear relationship with a clearer trend for temperature—resonance frequencies tend to decrease with increasing temperature.
Jsan 14 00033 g006
Figure 7. Hyperparameter space with SVR hyperparameter Bayesian optimization results for all six resonant frequencies over 100 runs with 30 iterations each: left—an entire hyperparameter space and right—a zoomed-in portion showing centroid values.
Jsan 14 00033 g007
Figure 8. Time series of resonance frequency residuals (left) and the corresponding histograms with the optimized bin number (right).
Jsan 14 00033 g008
Figure 9. Analysis of impact of environmental factors on resonance frequencies using the SVR machine learning algorithm. Legends: f1, f2, f3, f4, f5, and f6—number of resonance frequency. Sign of the relative effect indicates either increasing effect (+) or decreasing effect (−). Temperature has the most pronounced effect on all resonance frequencies. The effect is that temperature decreases the resonance frequencies substantially. The second most important effect is from humidity (increasing) followed by wind speed (decreasing). The least important effect is from precipitation.
Jsan 14 00033 g009
Figure 10. Mahalanobis distance (MD) for damage detection with optimized hyperparameters in two different scenarios: (a) from all features and (b) from features no. 4 and 6 selected using the NCA algorithm. Small inset graphs show determination of threshold, where p-value of a chi-square distribution is calculated for each MD value. The threshold is set to p-value = 0.001. Vertical lines marked D1 to D5 mark the moments of damage (refer to Table 1).
Jsan 14 00033 g010aJsan 14 00033 g010b
Figure 11. Histograms showing feature selection based on neighborhood component analysis (NCA) conducted in 1000 independent runs. Red ellipses show that large proportion of weights for several features have very low values and are thus not informative. Residuals of frequencies (or features) no. 4 and 6 are selected.
Jsan 14 00033 g011
Figure 12. Confusion matrix with class 0 as healthy and class 1 as damaged: (a) from all features and (b) from features no. 4 and 6 selected using the NCA algorithm. Feature selection has decreased false alarm rate, however, false negatives proportion has increased.
Jsan 14 00033 g012
Table 1. Structural modifications of the monitored structure simulating progressive damage.
DateModificationDamage Case
24 September 2022 13:56:25All bolts tightenedD1D2D3D4D5
1 October 2022 11:03:10Slat #1 removed
9 October 2022 15:20:50Slats #1 + #2 removed
15 October 2022 15:57:17Slats #1 + #2 + #3 + #4 removed
22 October 2022 18:11:24Slats #1 + #2 + #3 + #4 + #5 removed
Table 2. Descriptive statistics of variables.
VariableMeanMedianVarianceSkewnessKurtosis
f 1 3.603.530.071.515.00
f 2 4.214.210.050.423.18
f 3 4.314.250.061.384.58
f 4 11.6911.650.45−0.915.09
f 5 12.5212.480.330.162.13
f 6 13.2913.200.470.181.97
T 8.877.7670.250.362.25
H 7881234−0.833.25
W S 3.122.902.10.823.78
P 0.100.417.25449.63
S 0.9014.55.2233.02
Table 3. Support vector regression hyperparameters optimized in 100 runs (centroid values).
Frequency f 1 f 2 f 3 f 4 f 5 f 6
Box constraint2.09992.448232.358214.780814.5160418.0755
Epsilon0.001767630.003159760.0019260.002218520.002720660.00694395
Kernel scale0.6615710.8932240.7072010.7871611.118351.35609
Table 4. The Anderson–Darling normality test of resonance frequency residuals.
AD Test f 1 f 2 f 3 f 4 f 5 f 6
p-value3.7 × 10−243.7 × 10−243.7 × 10−243.7 × 10−243.7 × 10−243.7 × 10⁻²⁴
H 0 rejectrejectrejectrejectrejectreject
Disclaimer/Publisher’s Note: The statements, opinions and data contained in all publications are solely those of the individual author(s) and contributor(s) and not of MDPI and/or the editor(s). MDPI and/or the editor(s) disclaim responsibility for any injury to people or property resulting from any ideas, methods, instructions or products referred to in the content.