


Enhancing the Fault Tolerance of a Multi-Layered IoT Network through Rectangular and Interstitial Mesh in the Gateway Layer

 ,
, 

Abstract
:1. Introduction
Challenges and Motivation for the Research
2. Related Work
3. Research Gap and Research Objectives
3.1. Research Gap
3.2. Research Objectives
- Enhance the fault tolerance of the IoT network by introducing a rectangular and interstitial mesh network topology;
- Develop an improved probabilistic formulation that can compute the fault tolerance of the rectangular and interstitial mesh network topology;
- Develop two algorithms that help to convert an IoT network into a fault tree and generate a failure rate computation table given a fault tree;
- Develop a computational method that can be used to compute the fault tolerance of the entire IoT network;
- Implement a failure analysis model to justify the efficiency of using the rectangular and interstitial mesh network topology over other techniques;
- Compute and compare the results through empirical models and external observations.
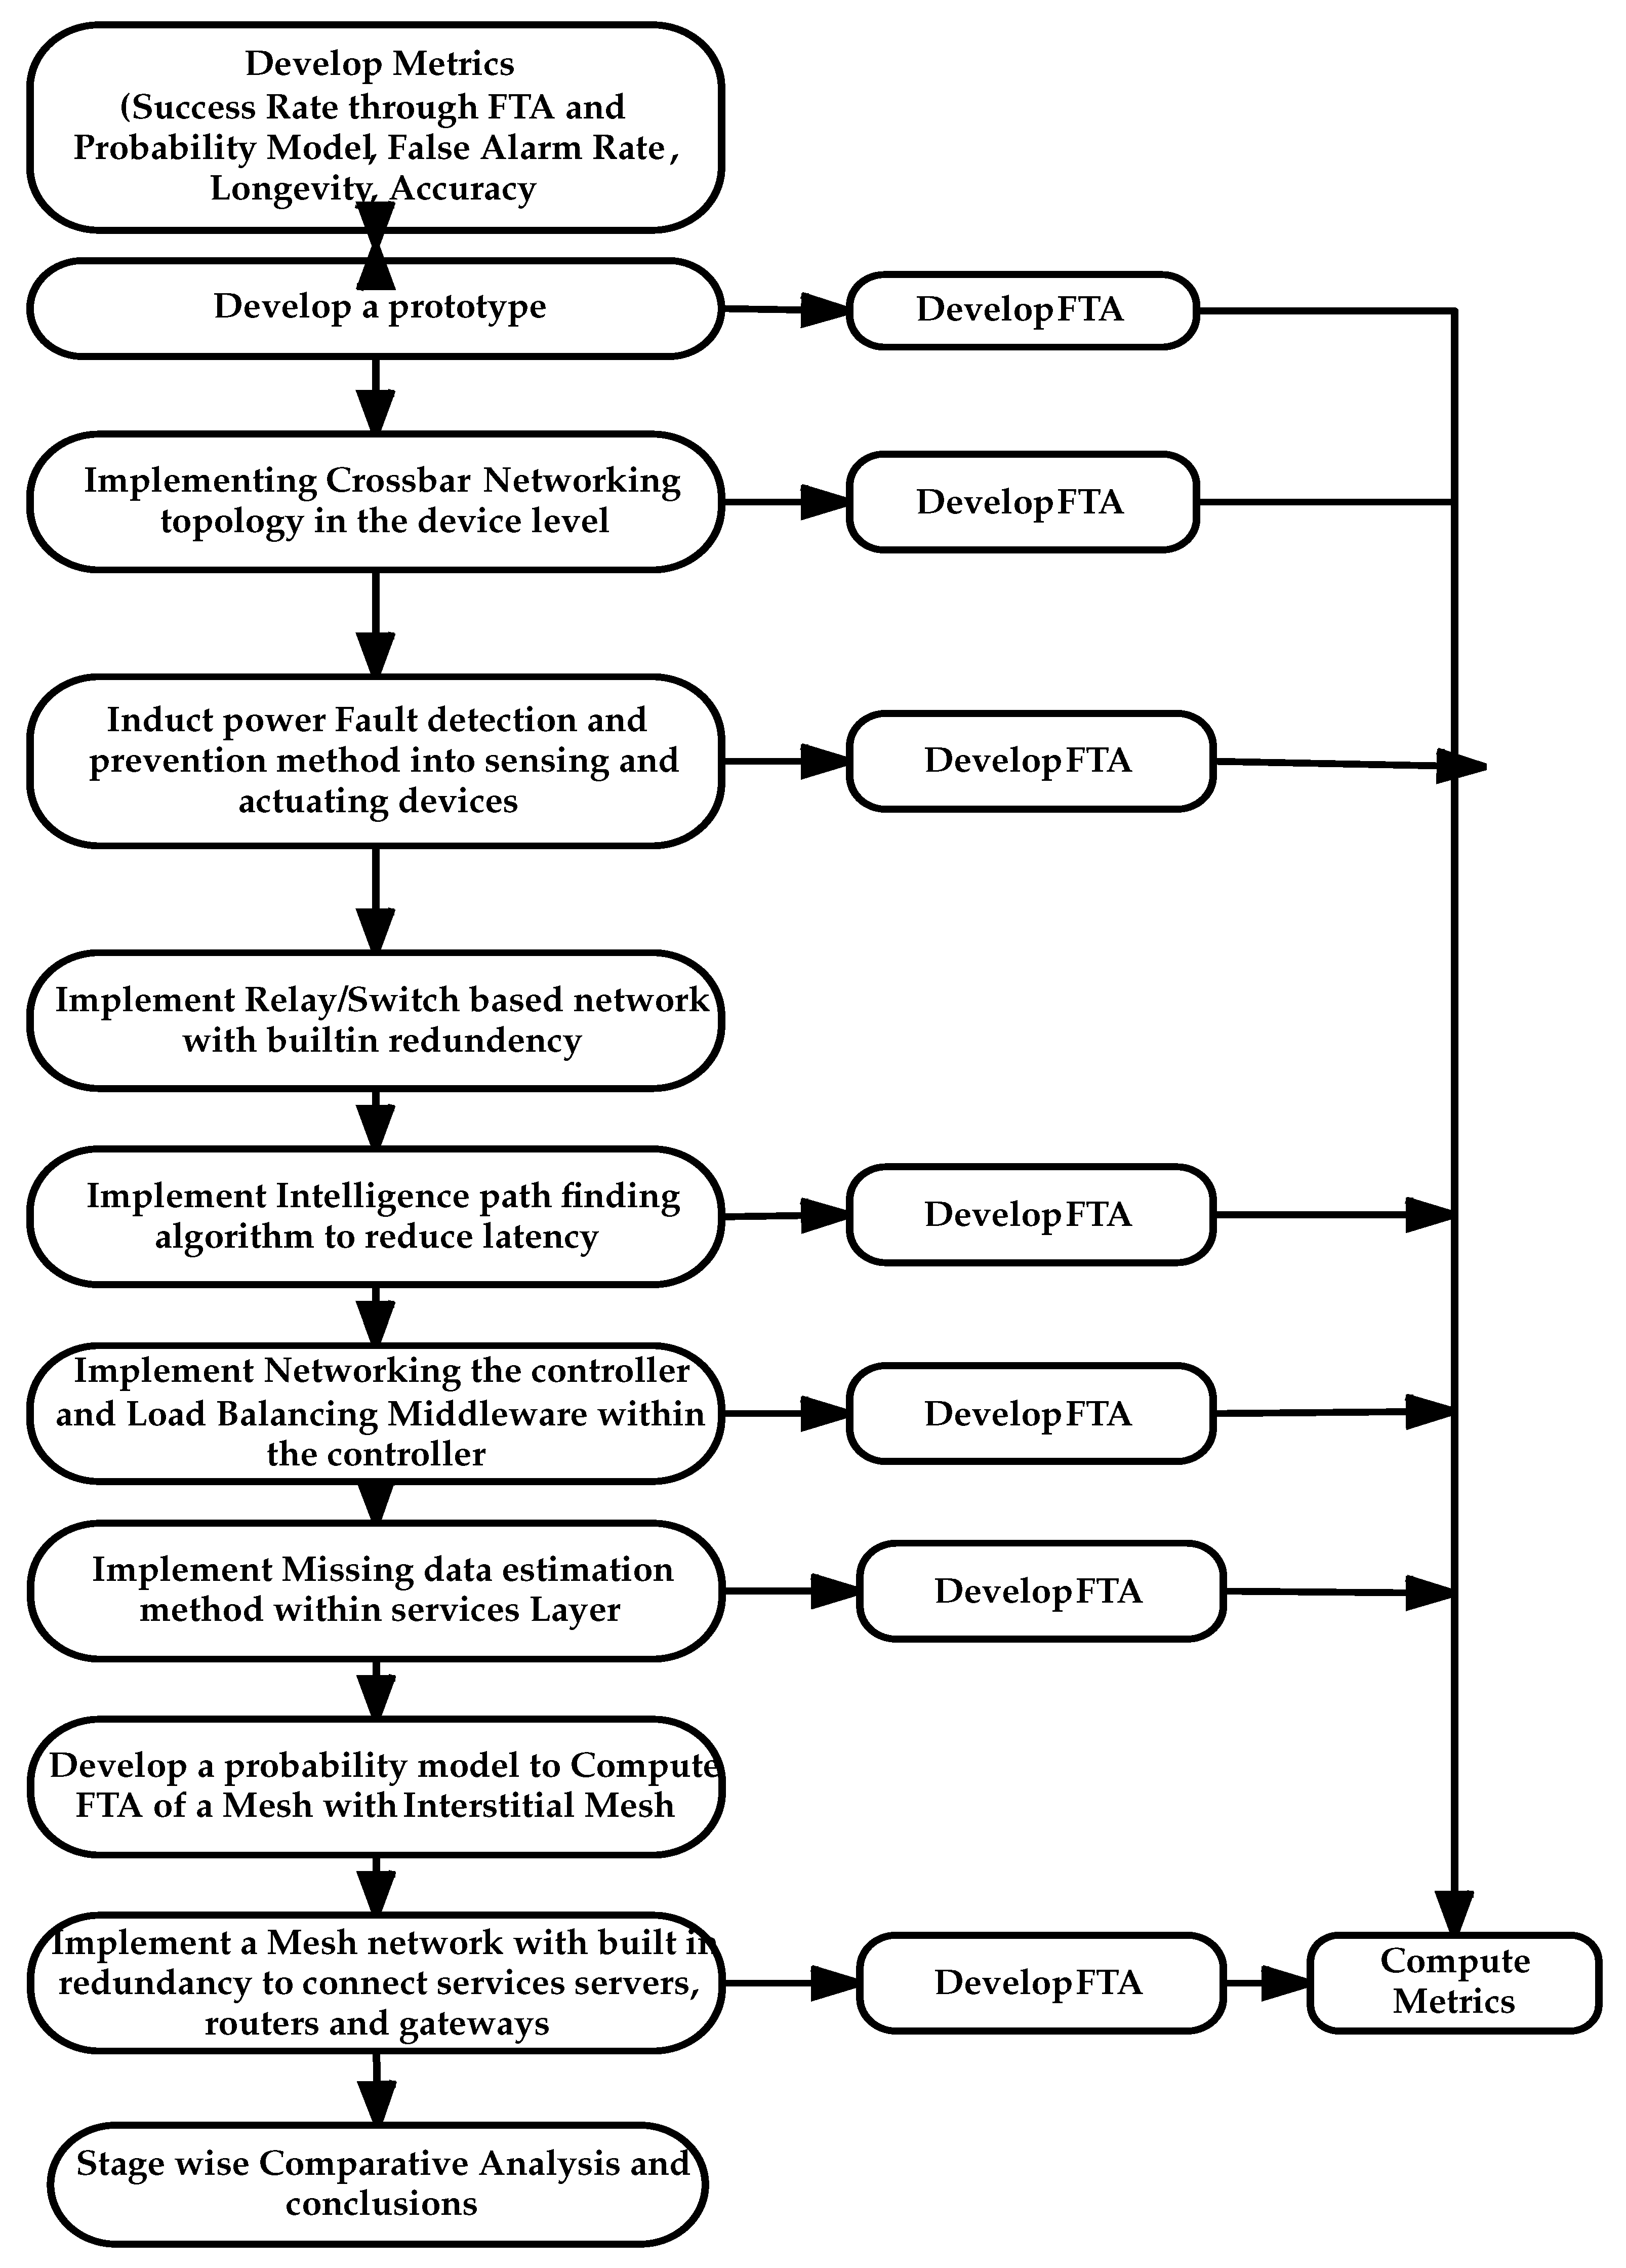
4. The Overall Method to Enhance the Fault Tolerance of the IoT Network with Changes Induced in the Gateway Layer
| Algorithm 1: Generating Fault Tree. | |
| Step 1 | Identify the hardware hierarchy in an IoT network and update a database. |
| Step 2 | Copy the IoT diagram’s clusters, transform them into hierarchical models and update the database’s entries. |
| Step 3 | Record the networking topologies utilized in the Internet of Things network, calculate the fault rate for each one using the relevant probability model and add a database element to reflect the computed fault rate. |
| Step 4 | Update the database with manufacturers’ information about other devices’ failure rates. |
| Step 5 | Update the database after recording the relationship (OR, AND) between each device and its ancestors. |
| Step 6 | Create a graph model from the linear tree. |
| Algorithm 2: Generating Fault Rate Table. | |
| Step 1: | Query the database’s elements according to the preceding relationships that connect the child nodes in hierarchical order. |
| Step 2: | Determine the fault rate of the outgoing device using AND/OR rules. |
| Step 3: | Multiply an outgoing device’s fault rate by the incoming device’s fault rate. |
| Step 4: | The outgoing device’s fault rate is the lowest of the incoming devices’ fault rates if the relationship between the devices is an OR relationship. |
| Step 5: | Determine the root device’s fault rate. No parents exist for a root device. |
| Step 6: | Create a fault computation table. |
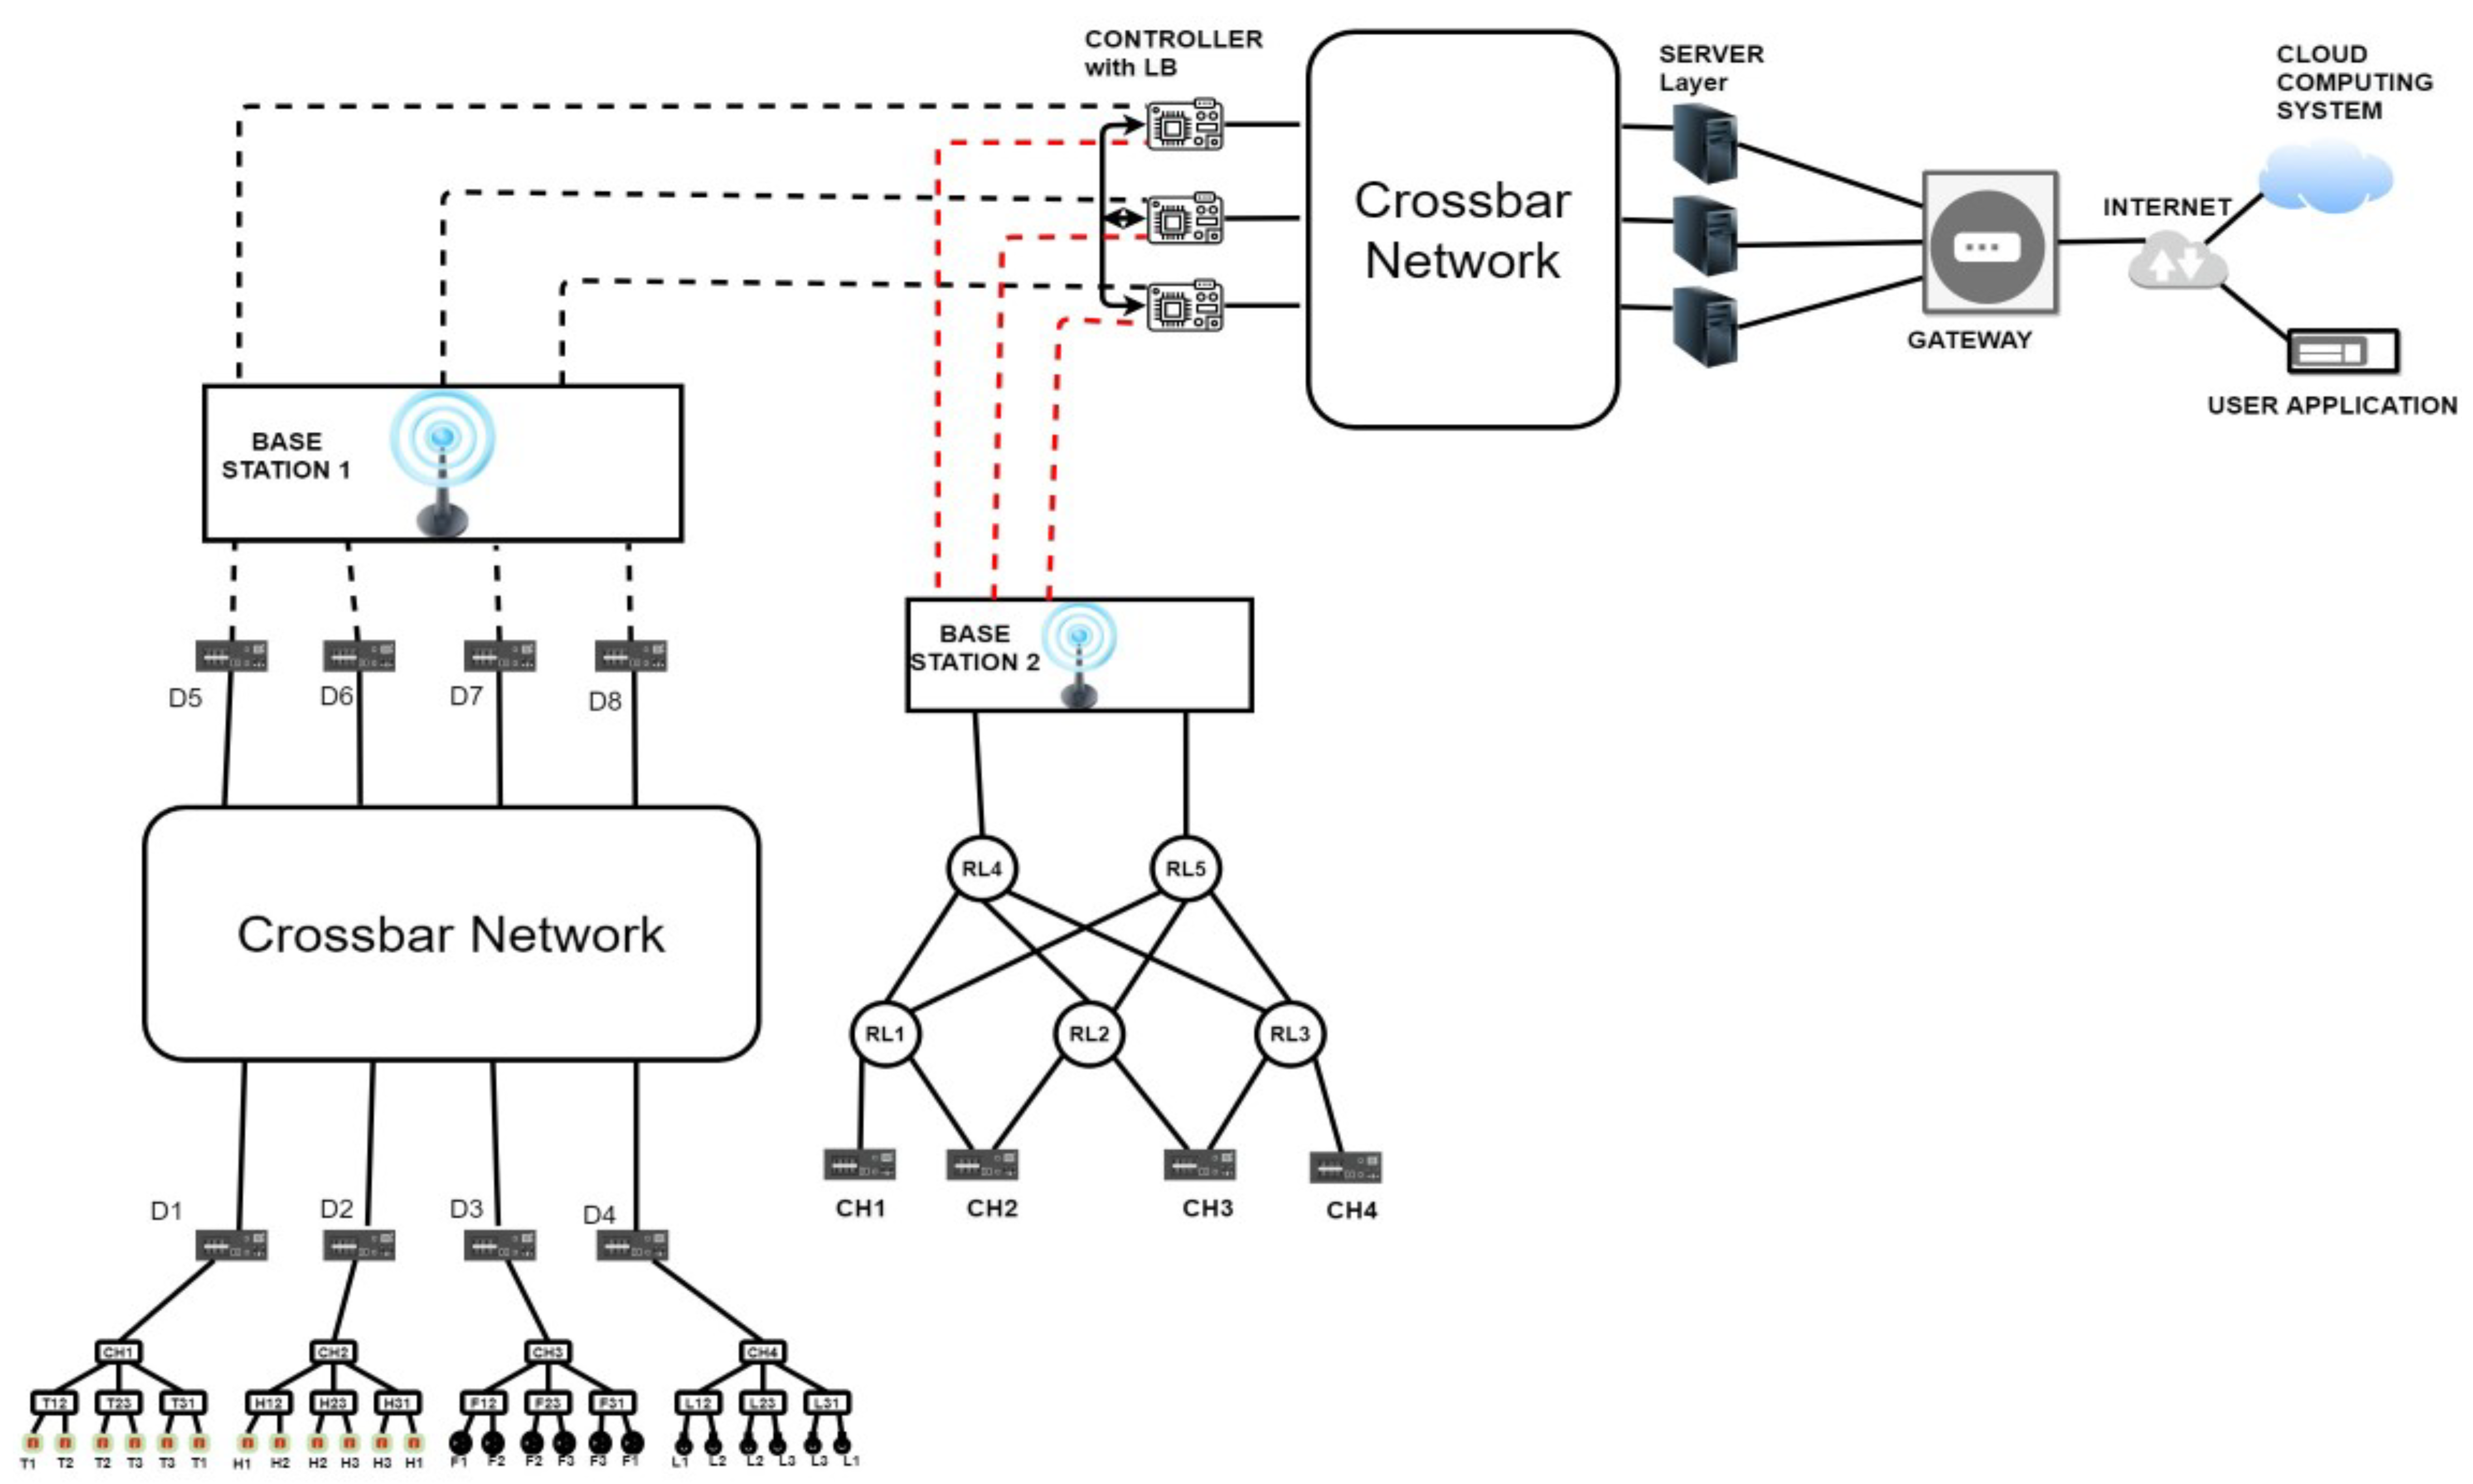
5. Example IoT Network
6. Investigations and Findings
6.1. Success Rate Computation Method for Rectangular and Interstitial Mesh Network
6.2. Algorithm to Convert an IoT Network into an FTA Graph
6.3. Algorithm to Convert an FTA Graph into a Table of Fault Rate Computations
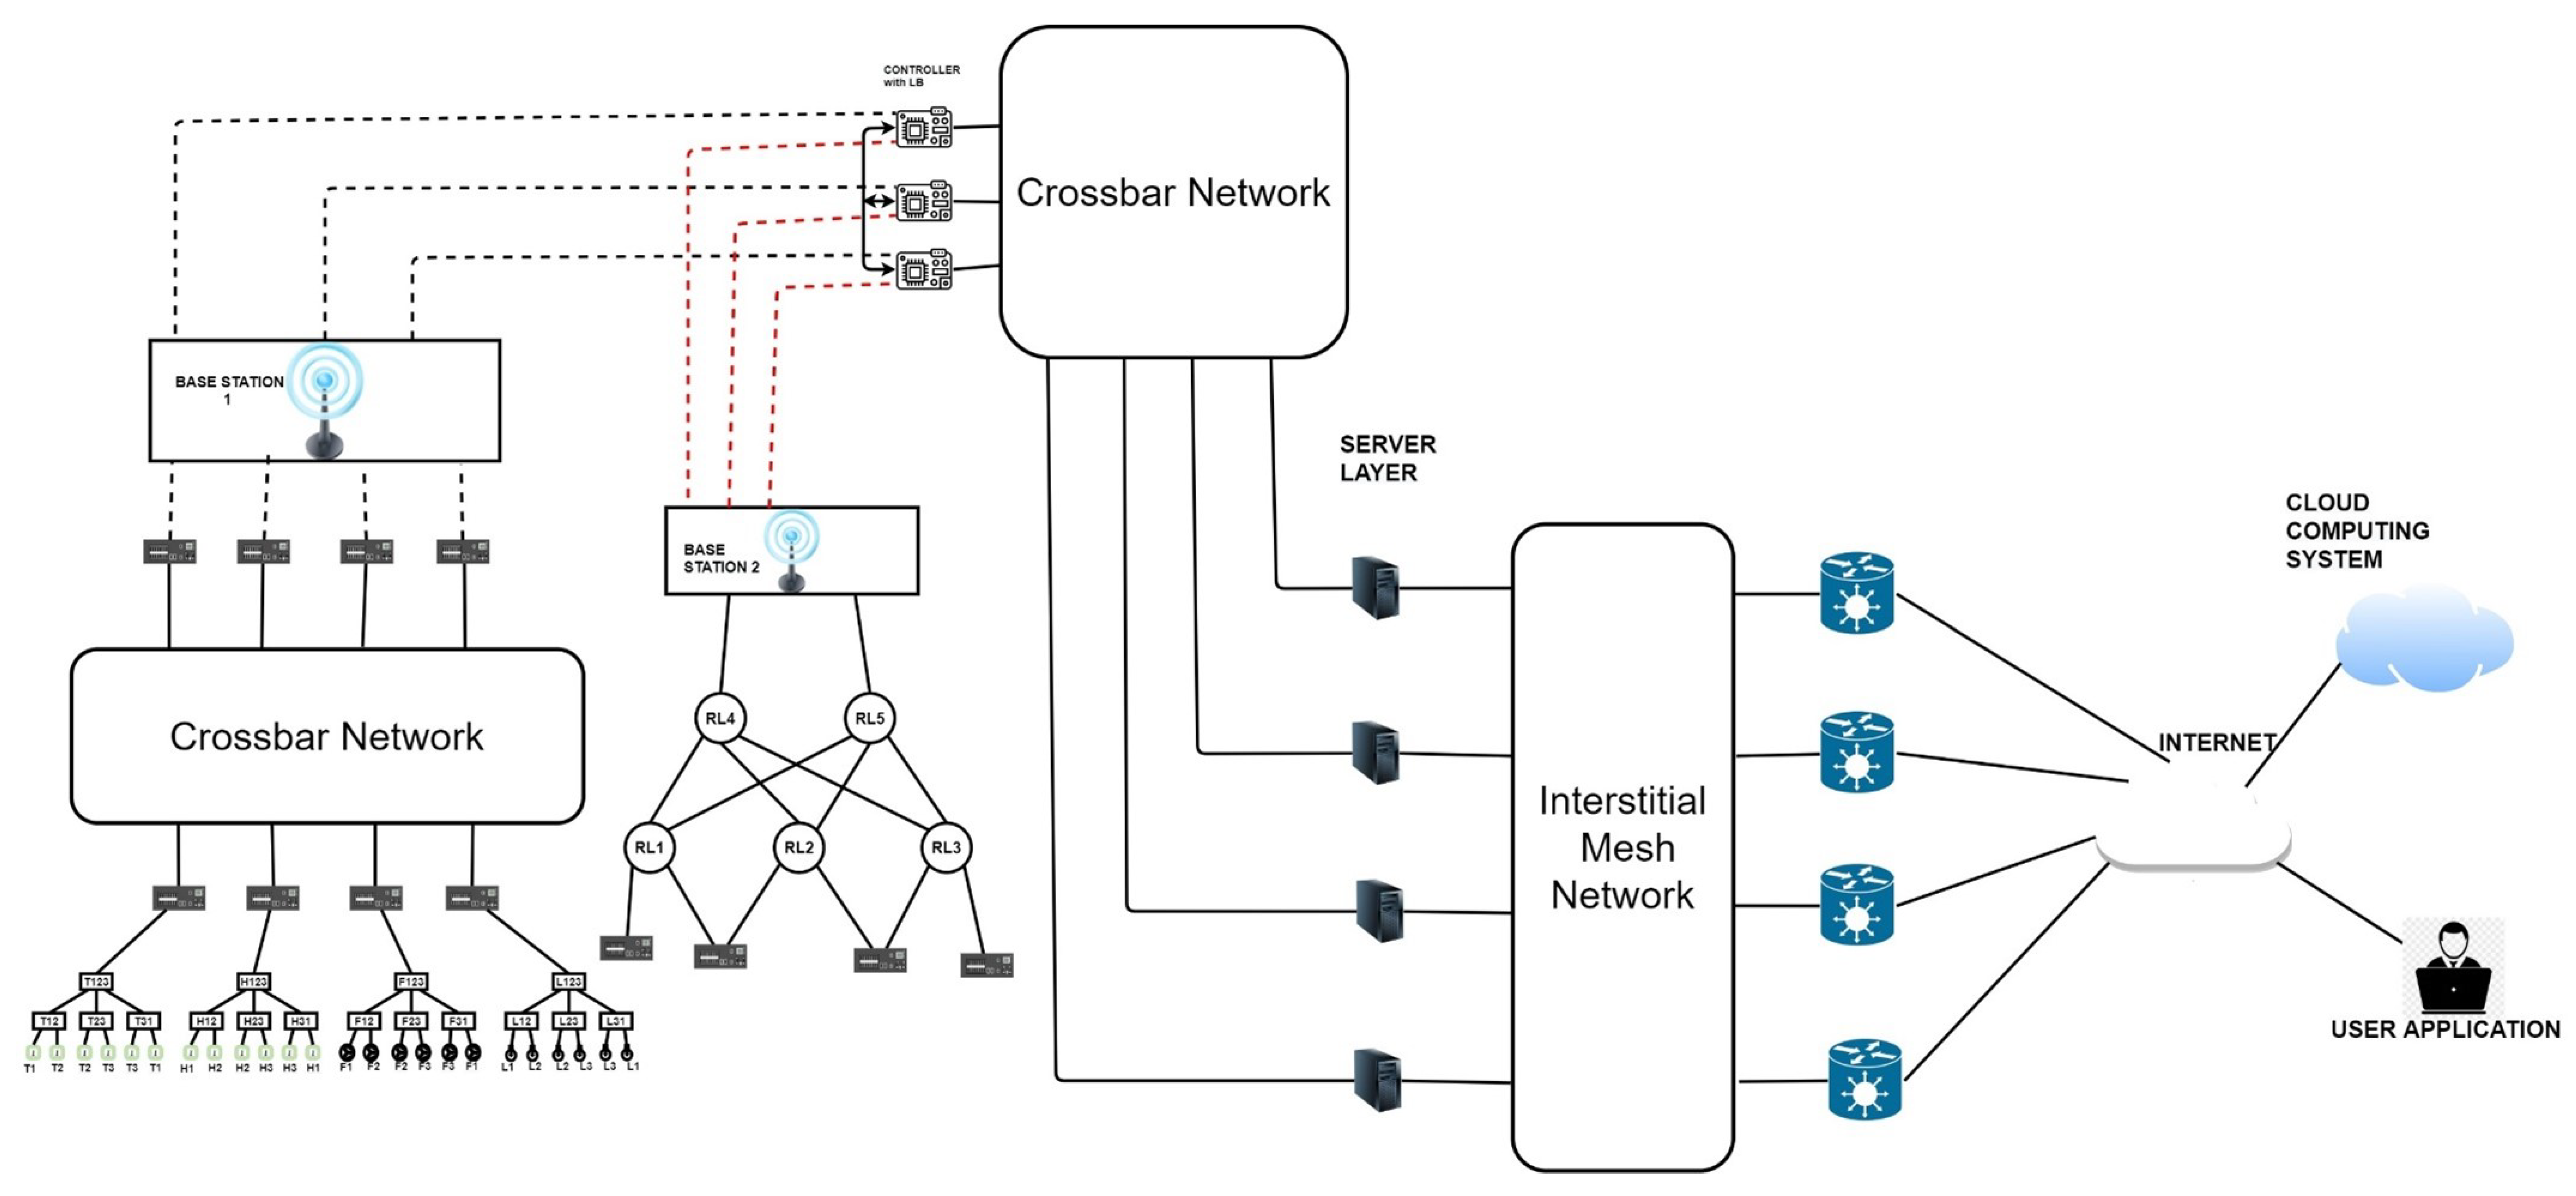
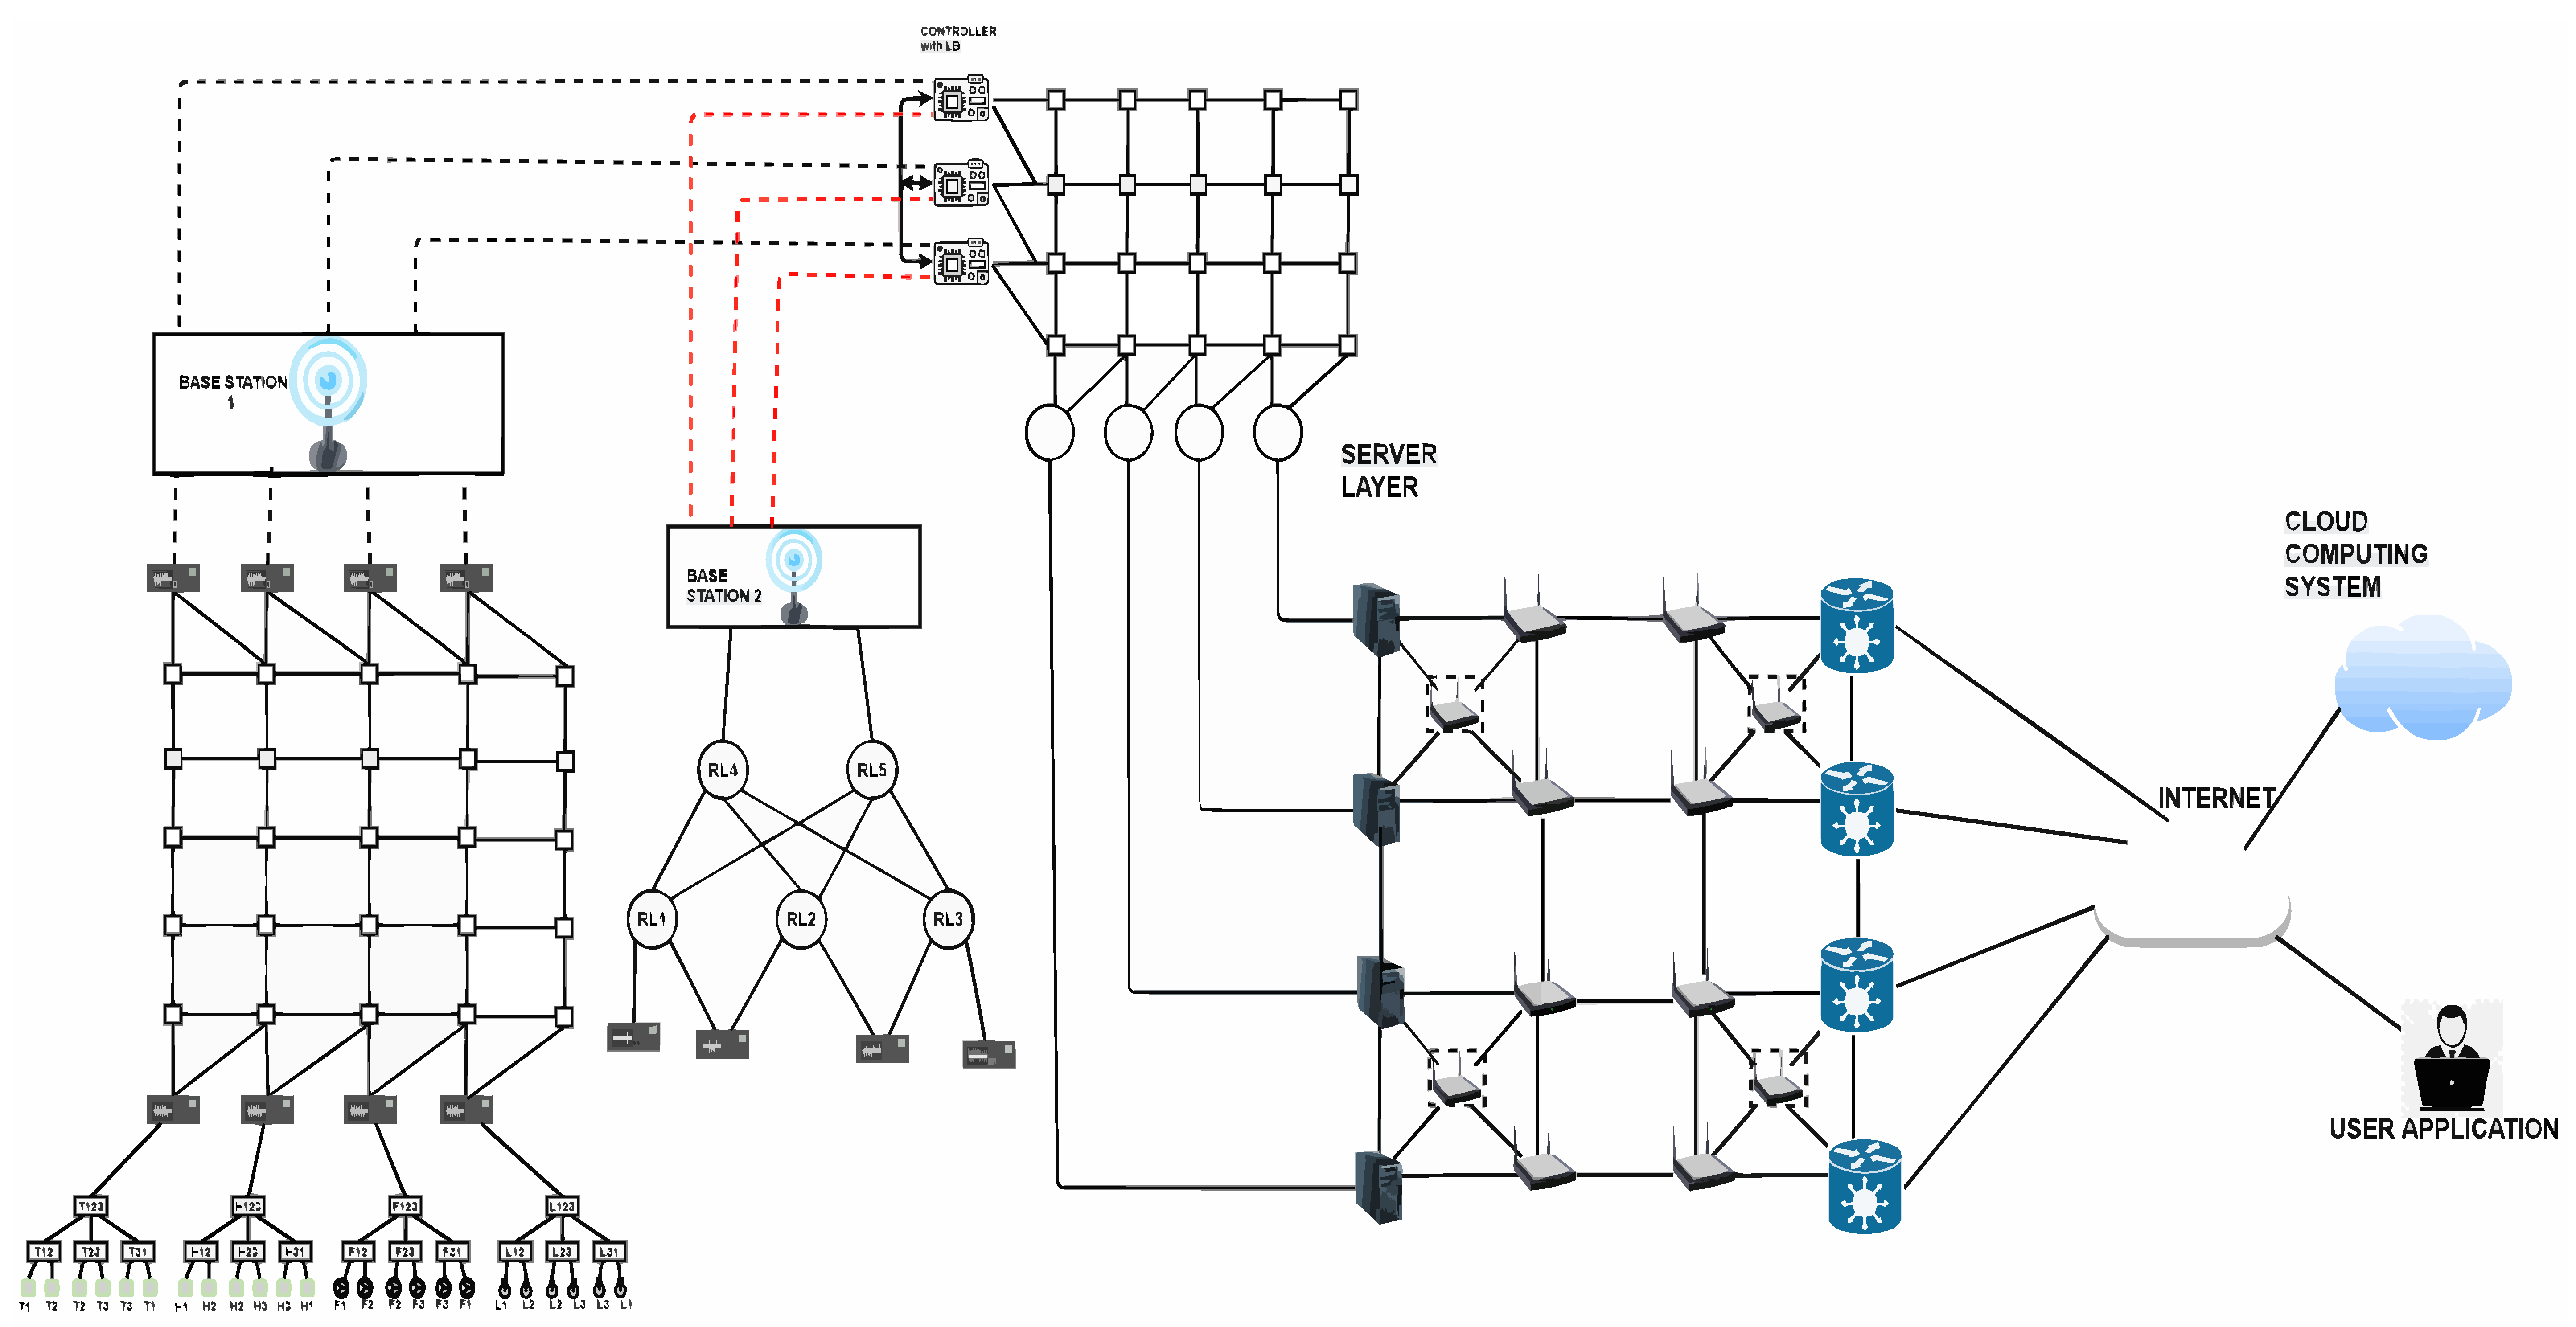
6.4. Revised IoT Network
- A mesh network is established connecting the service servers, routers and gateways;
- One spare router is included for every four processing nodes;
- All the gateways are connected to the cloud through the Internet;
- The gateway is loaded with intelligent software for receiving, buffering, de-buffering, selecting communication speeds and implementing the accounting systems.
7. Experimentation and Results
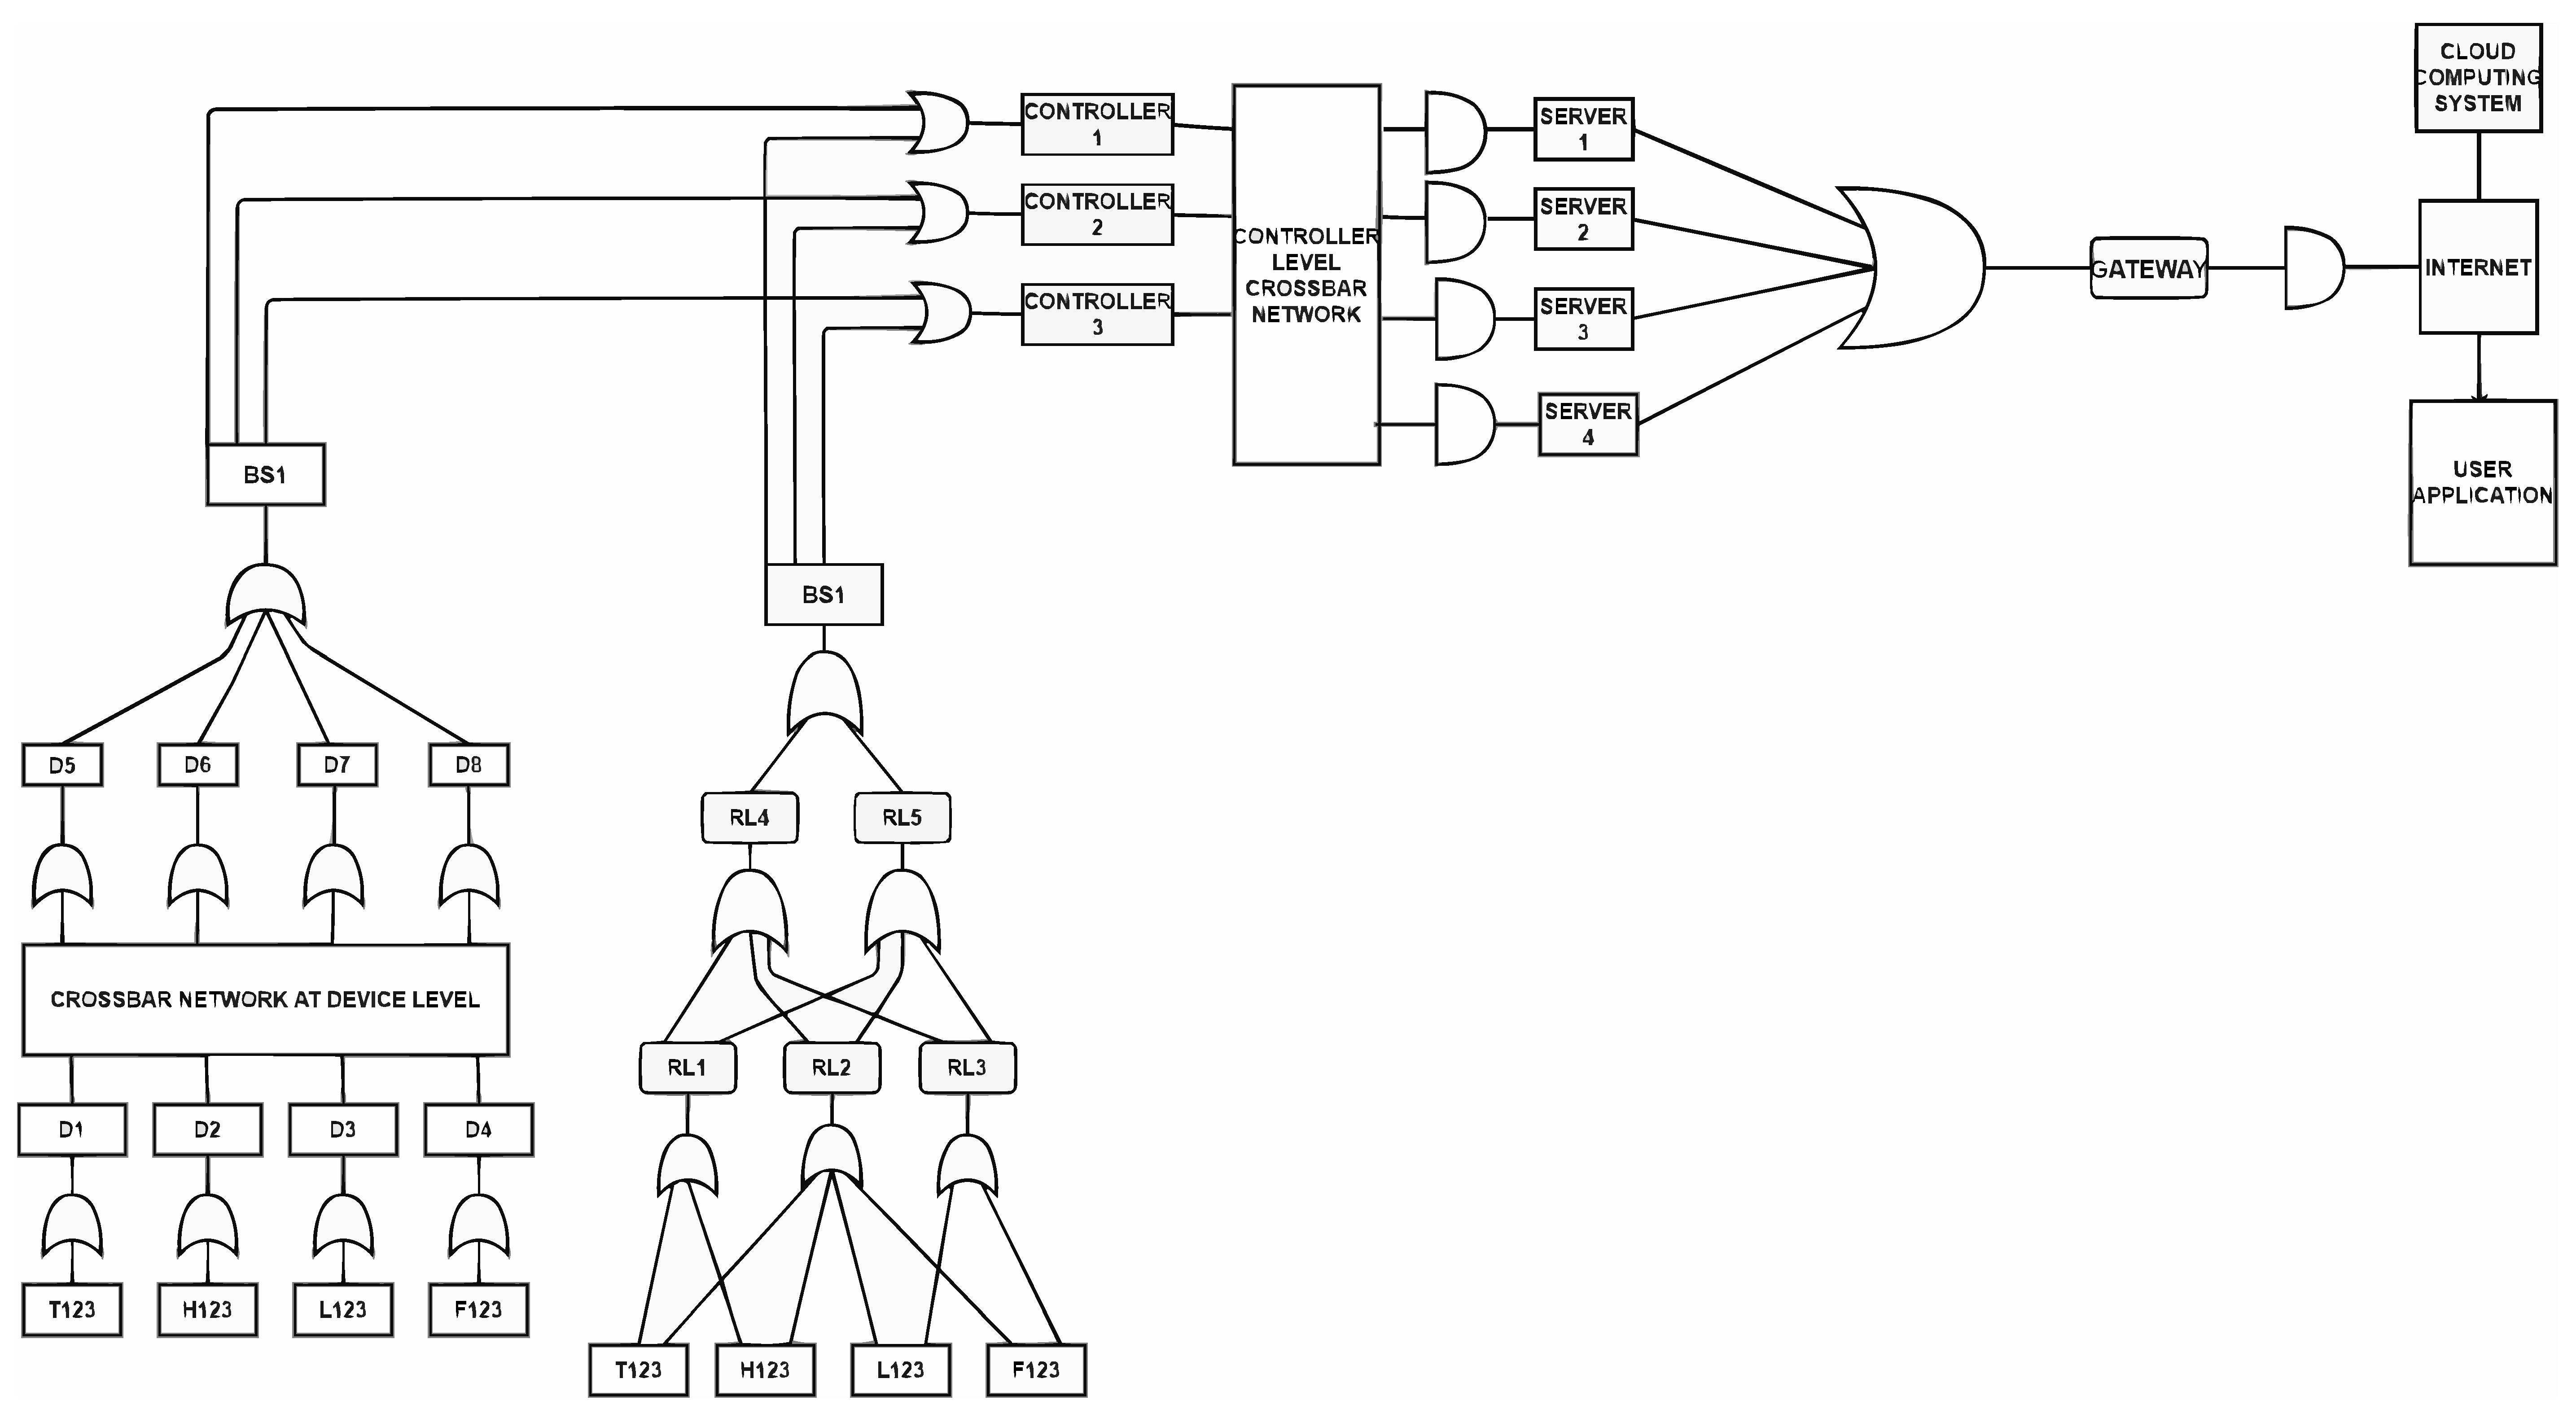
7.1. FTA, Example, IoT Network
7.2. Success Rate Computation of Example IoT Network
7.3. FTA for Revised IoT Network
7.4. Success Rate Computation for Revised IoT Network
8. Discussion
8.1. Stage-Wise Performance Analysis, Including the Changes Made in the Gateway Layer
8.2. Failure Analysis of the Proposed Gateway Layer and the Related Comparative Models Based on Node Failures
9. Conclusions
- The gateway layer is the most critical in an IoT network, as most of the communication is undertaken in this layer, connecting the internal IoT systems to the external cloud related to the network. Computing is done in the service layer, and the data are moved to the gateway layer for onward transmission to the cloud.
- The speed at which the servers transmit data to the gateway layer is slow, while the gateway layer transmits the data at very high speeds to the cloud.
- The equipment (routers and gateways) included in the gateway layer is expensive, and creating excessive redundancy leads to much larger expenses. This cost is not justified when the gateway layer is highly reliable.
- It is risky if no redundancy is created in this area; entire networks will fail, causing disasters. Therefore, a low-cost solution is required to create redundancy in the gateway layer.
- Creating a low-cost solution in the gateway layer can be achieved by implementing interstitial mesh networks in the layer, which introduces redundancy to 25%.
- It has been proven that the IoT network will cater for four node failures using the interstitial mesh network. The failure of four nodes simultaneously is impossible, and the strategy presented in this paper addresses the possibility of the failure of several nodes simultaneously.
- Implementing an interstitial mesh network in the gateway layer increases the fault tolerance of the IoT network by 11%. An empirical formulation is developed, which helps to compute the fault tolerance of the IoT network when an interstitial mesh network is implemented in the service layer. This is not the case with other models.
- Interstitial mesh networks in the gateway layer can readily link to the topologies in other network layers.
Author Contributions
Funding
Data Availability Statement
Conflicts of Interest
References
- Atzori, L.; Iera, A.; Morabito, G. The Internet of Things: A survey. Comput. Netw. 2010, 54, 2787–2805. [Google Scholar] [CrossRef]
- Kawamoto, Y.; Nishiyama, H.; Kato, N.; Yoshimura, N.; Yamamoto, S. Internet of Things (IoT): Present state and prospects. IEICE Trans. Inf. Syst. 2014, E97.D, 2568–2575. [Google Scholar] [CrossRef]
- Rawat, P.; Singh, K.D.; Bonnin, J.M. Cognitive radio for M2M and Internet of Things: A survey. Comput. Commun. 2016, 94, 1–29. [Google Scholar] [CrossRef]
- Pan, J.; McElhannon, J. Future edge cloud and edge computing for Internet of Things applications. IEEE Internet Things J. 2018, 5, 439–449. [Google Scholar] [CrossRef]
- Adhinugraha, K.; Rahayu, W.; Hara, T.; Taniar, D. On Internet-of-Things (IoT)gateway coverage expansion. Future Gener. Comput. Syst. 2020, 107, 578–587. [Google Scholar] [CrossRef]
- Singh, F.; Kotagi, V.; Siva Ram Murthy, C. Parallel opportunistic routing in IoT networks. In Proceedings of the 2016 IEEE Wireless Communications and Networking Conference, Doha, Qatar, 3–6 April 2016; pp. 1–6. [Google Scholar] [CrossRef]
- Zhu, Q.; Wang, R.; Chen, Q.; Liu, Y.; Qin, W. IoT gateway: Bridging wireless sensor networks into Internet of Things. In Proceedings of the 2010 IEEE/IFIP International Conference on Embedded and Ubiquitous Computing, Hong Kong, China, 11–13 December 2010; pp. 347–352. [Google Scholar] [CrossRef]
- Sastry, J.K.R.; Ramya, G.S.; Niharika, V.M.; Sowmya, K.V. Performance Optimization of IoT Networks Within the Gateway Layer. Recent Adv. Comput. Sci. Commun. 2020, 13, 1338–1346. [Google Scholar] [CrossRef]
- Liu, Y.; Tong, K.F.; Qiu, X.; Liu, Y.; Ding, X. Wireless mesh networks in IoT networks. In Proceedings of the 2017 International Workshop on Electromagnetics: Applications and Student Innovation Competition, London, UK, 30 May–1 June 2017; pp. 183–185. [Google Scholar] [CrossRef]
- Sahni, Y.; Cao, J.; Zhang, S.; Yang, L. Edge mesh: A new paradigm to enable distributed intelligence in the Internet of Things. IEEE Access 2017, 5, 16441–16458. [Google Scholar] [CrossRef]
- Tang, X.; Tan, L.; Hussain, A.; Wang, M. Three-dimensional Voronoi diagram-based self-deployment algorithm in IoT sensor networks. Ann. Telecommun. 2019, 74, 517–529. [Google Scholar] [CrossRef]
- Lin, Q.; Song, H.; Gui, X.; Wang, X.; Su, S. A shortest path routing algorithm for unmanned aerial systems based on grid position. J. Netw. Comput. Appl. 2018, 103, 215–224. [Google Scholar] [CrossRef]
- Liu, X.; Wang, X.; Jia, J.; Huang, M. A distributed deployment algorithm for communication coverage in wireless robotic networks. J. Netw. Comput. Appl. 2021, 180, 103019. [Google Scholar] [CrossRef]
- Zhu, C.; Zheng, C.; Shu, L.; Han, G. A survey on coverage and connectivity issues in wireless sensor networks. J. Netw. Comput. Appl. 2012, 35, 619–632. [Google Scholar] [CrossRef]
- Safar, M.; Ibrahimi, D.; Taniar, D. Voronoi-based reverse nearest neighbour query processing on spatial networks. Multimed. Syst. 2019, 15, 295–308. [Google Scholar] [CrossRef]
- Tran, Q.T.; Taniar, D.; Safar, M. Reverse k nearest neighbour and reverse farthest neighbour search on spatial networks. In Lecture Notes in Computer Science; including subseries Lecture Notes in Artificial Intelligence and Lecture Notes in Bioinformatics, LNCS; Springer: Berlin/Heidelberg, Germany, 2009; Volume 5740, pp. 353–372. [Google Scholar]
- Abeywickrama, T.; Cheema, M.A.; Taniar, D. K-nearest neighbours on road networks: A journey in experimentation and in-memory implementation. arXiv 2016, arXiv:1601.01549. [Google Scholar] [CrossRef]
- Xuan, K.; Zhao, G.; Taniar, D.; Rahayu, W.; Safar, M.; Srinivasan, B. Voronoi-based range and continuous range query processing in mobile databases. J. Comput. Syst. Sci. 2011, 77, 637–651. [Google Scholar] [CrossRef]
- Kolahdouzan, M.; Shahabi, C. Voronoi-based K nearest neighbour search for spatial network databases. In Proceedings of the Thirtieth International Conference on Very Large Data Bases—Volume 30, Toronto, ON, Canada, 31August–3 September 2004; pp. 840–851. [Google Scholar]
- Cheema, M.A.; Zhang, W.; Lin, X.; Zhang, Y.; Li, X. Continuous reverse k nearest neighbours queries in Euclidean space and spatial networks. VLDB J. 2012, 21, 69–95. [Google Scholar] [CrossRef]
- Yang, S.; Cheema, M.A.; Lin, X.; Wang, W. Reverse k nearest neighbours query processing. Proc. VLDB Endow. 2015, 8, 605–616. [Google Scholar] [CrossRef]
- Shao, Z.; Taniar, D.; Adhinugraha, K.M. Voronoi-based range-kNN search with map grid in a mobile environment. Future Gener. Comput Syst. 2017, 67, 305–314. [Google Scholar] [CrossRef]
- Lee, I.; Lee, K. Higher order Voronoi diagrams for concept boundaries and tessellations. In Proceedings of the 6th IEEE/ACIS International Conference on Computer and Information Science (ICIS 2007), Melbourne, VIC, Australia, 11–13 July 2007; pp. 513–518. [Google Scholar] [CrossRef]
- Gummadi, K.P.; Saroiu, S.; Gribble, S.D. King: Estimating Latency Between Arbitrary Internet end Hosts. In Proceedings of the 2nd Internet Measurement, Workshop (IMW 2002), Marseille, France, 6–8 November 2002; pp. 5–18. [Google Scholar]
- Okabe, A.; Boots, B.; Sugihara, K.; Chiu, S.N. Spatial Tessellations: Concepts and Applications of Voronoi Diagrams; Wiley Series in Probability and Statistics; Wiley: Hoboken, NJ, USA, 2009. [Google Scholar]
- Okabe, A.; Satoh, T.; Furuta, T.; Suzuki, A.; Okano, K. Generalized network Voronoi diagrams: Concepts, computational methods, and applications. Int. J. Geogr. Inf. Sci. 2008, 22, 965–994. [Google Scholar] [CrossRef]
- Saha, T.; Sunitha, R. A framework for Fault detection and prevention in IOT using Smart Gateway. JCSE Int. J. Comput. Sci. Eng. 2018, 6, 112–122. [Google Scholar]
- Ma, G.; Yang, Y.; Xuesong, Q.; Gao, Z.; Li, H. Fault-tolerant topology control for heterogeneous wireless sensor networks using the multi-routing tree. In Proceedings of the 2017 IFIP/IEEE Symposium on Integrated Network and Service Management (IM), Pisa, Italy, 8–11 October 2007; pp. 620–623. [Google Scholar] [CrossRef]
- Ismail, M.; Zhuang, W. A distributed multi-service resource allocation algorithm in heterogeneous wireless access medium. IEEE J. Sel. Areas Commun. 2012, 30, 425–432. [Google Scholar] [CrossRef]
- Li, Y.; Yu, J.; Tao, D. Genetic algorithm for spanning tree construction in P2P distributed interactive applications. Neurocomputing 2014, 140, 185–192. [Google Scholar] [CrossRef]
- Karthikeya, S.A.; Vijeth, J.K.; Murthy, C.S.R. Leveraging Solution-Specific Gateways for cost-effective and fault-tolerant IoT networking. In Proceedings of the 2016 IEEE Wireless Communications and Networking Conference, Doha, Qatar, 15 September 2016. [Google Scholar] [CrossRef]
- Kim, M.; Ko, I. An efficient resource allocation approach based on a genetic algorithm for composite services in IoT environments. In Proceedings of the 2015 IEEE International Conference on Web Services, New York, NY, USA, 27 June–2 July 2015; pp. 543–550. [Google Scholar] [CrossRef]
- Takahashi, R.; Ota, M.; Fukazawa, Y. Fault-Tolerant Topology Determination for IoT Network. In Proceedings of the 13th International Conference on Ubiquitous Information Management and Communication (IMCOM), Phuket, Thailand, 4–6 January 2019; 2019; pp. 62–76. [Google Scholar] [CrossRef]
- Leonardi, L.; Patti, G.; Lo Bello, L. Multi-hop real-time communications over Bluetooth low-energy industrial wireless mesh networks. IEEE Access 2018, 6, 26505–26519. [Google Scholar] [CrossRef]
- Rondon, R.; Mahmood, A.; Grimaldi, S.; Gidlund, M. Understanding the performance of Bluetooth mesh: Reliability, delay, and scalability analysis. IEEE Internet Things J. 2019, 7, 2089–2101. [Google Scholar] [CrossRef]
- He, B.; Xie, B.; Agrawal, D.P. Optimizing the internet gateway deployment in a wireless mesh network. In Proceedings of the 2007 IEEE International Conference on Mobile Adhoc and Sensor Systems, Pisa, Italy, 8–11 October 2007. [Google Scholar] [CrossRef]
- Seyedzadegan, M.; Othman, M.; Ali, B.M.; Subramaniam, S. Zero-degree algorithm for internet gateway placement in backbone wireless mesh networks. J. Netw. Comput. Appl. 2013, 36, 1705–1723. [Google Scholar] [CrossRef]
- Shih, C.-S.; Wu, G.-F. Multiple protocol transport network gateway for IoT systems. ACM SIGAPP Appl. Comput. Rev. 2016, 15, 7–18. [Google Scholar] [CrossRef]
- Jean-Philippe, V.; Mario, P.; Piet, D. Network recovery: Protection and restoration of optical, SONET-SDH, IP, and MPLS. In Morgan Kaufmann, Amsterdam, Series, 1st ed.; Elsevier: Amsterdam, The Netherlands, 2004. [Google Scholar] [CrossRef]
- Médard, M.; Barry, R.A.; Finn, S.G.; He, W.; Lumetta, S.S. Generalized loop back recovery in optical mesh networks. IEEE/ACM Trans. Netw. 2002, 10, 153–164. [Google Scholar] [CrossRef]
- Choi, H.; Subramaniam, S.; Choi, H.A. Loopback recovery from double-link failures in optical mesh networks. IEEE/ACM Trans. Netw. 2004, 12, 1119–1130. [Google Scholar] [CrossRef]
- Lakshmanan, S.; Sivakumar, R.; Sundaresan, K. Multi-gateway association in wireless mesh networks. Ad Hoc Netw. 2009, 7, 622–637. [Google Scholar] [CrossRef]
- Kawai, T.; Yusa, N.; Mineno, H. Implementation and Evaluation of adaptive multi-gateway mesh network. In Proceedings of the 2014 International Conference on Network-Based Information Systems, Salerno, Italy, 12–14 September 2014; pp. 61–68. [Google Scholar] [CrossRef]
- Adhinugraha, K.; Rahayu, W.; Hara, T.; Taniar, D. Backup gateways for IoT mesh network using order-k hop Voronoi diagram. World Wide Web 2021, 24, 955–970. [Google Scholar] [CrossRef]
- Kim, K.-H.; Shin, K.G. Self-reconfigurable wireless mesh networks. IEEE/ACM Trans. Netw. 2011, 19, 393–404. [Google Scholar] [CrossRef]
- Gilani, S.S.A.; Qayyum, A.; Rais, R.N.B.; Bano, M. SDNMesh: An SDN-based routing architecture for wireless mesh networks. IEEE Access 2020, 8, 136769–136781. [Google Scholar] [CrossRef]
- Sarkar, S.; Yen, H.H.; Dixit, S.; Mukherjee, B. RADAR: Risk-and-delay aware routing algorithm in a hybrid wireless-optical broadband access network, WOBAN. In Proceedings of the Optics InfoBase Conference Papers, Washington, DC, USA, 25–29 March 2007; pp. 4–6. [Google Scholar]
- Mahiddin, N.A.; Sarkar, N. An efficient gateway routing scheme for disaster recovery scenarios. In Proceedings of the International Conference on Information Networking, Kuala Lumpur, Malaysia, 9–11 January 2019; pp. 204–209. [Google Scholar] [CrossRef]
- Minh, Q.T.; Nguyen, K.; Borcea, C.; Yamada, S. On-the-fly establishment of multi-hop wireless access networks for disaster recovery. IEEE Commun. Mag. 2014, 52, 60–66. [Google Scholar] [CrossRef]
- Kiki, A.; Wenny, R.; Takahiro, H.; David, T. Measuring fault tolerance in IoT mesh networks using Voronoi diagram. J. Netw. Comput. Appl. 2022, 199, 103297. [Google Scholar] [CrossRef]
- Kiki, A.; Wenny, R.; Takahiro, H.; David, T. On Internet-of-Things (IoT) gateway coverage expansion. Future Gener. Comput. Syst. 2020, 107, 578–587. [Google Scholar]
- Moghaddam, M.T.; Muccini, H. Fault-Tolerant IoT. In Software Engineering for Resilient Systems. SERENE 2019. Lecture Notes in Computer Science; Calinescu, R., Di Giandomenico, F., Eds.; Springer: Cham, Switzerland, 2019; Volume 11732, pp. 67–84. [Google Scholar]
- Bhupati, C.; Sastry, K.R.J. Hybrid models for computing fault tolerance of IoT networks. TELKOMNIKA (Telecommun. Comput. Electron. Control.) 2023, 21, 333–345. [Google Scholar]
- Bhupati, R.R.; Sastry, J.K.R. Improving the fault tolerance of an IoT, Network through power detection and Isolation. J. Intell. Fuzzy Syst. 2023. submitted. [Google Scholar]
- Bhupati, J.K.R.; Ch, B.; Budaraju, R. Implementing dual base stations within an IoT network to sustain an IoT network’s fault tolerance through an Efficient Path Finding Algorithm. Sensors 2023, 23, 4032. [Google Scholar]


| Layer | Innovation Implemented | Reference |
|---|---|---|
| FTA Computation Model | A hybrid model that helps to compute the FTA considering a linear and probability model | [53] |
| Device Layer | Predicting the occurrence of a power fault and mitigating it through an isolation procedure | [54] |
| Using a crossbar network in the device layer to achieve a seamless connection between the devices and the cluster heads | ||
| Controller Layer | Connecting the cluster heads to the first base station using a peer-to-peer network | [55] |
| Connecting the second base station to the cluster heads through a distributed relay network | ||
| A new algorithm to find the shortest path to connect a cluster head to a second base station | ||
| Networking controllers and implementing load balancing within the controllers | ||
| Connecting the controller to the servers of the service through a crossbar network | ||
| Service Layer | Implementing a machine learning-based missing data estimation model |
| Sl. No. | Device | Success Rate | Gates Used for Connection | Preceding Devices | Combined Success Rate | |||
|---|---|---|---|---|---|---|---|---|
| Device Name D1 | Device Name D2 | Device Name D3 | Device Name D4 | |||||
| Success Rate S1 | Success Rate S2 | Success Rate S3 | Success Rate S4 | |||||
| 1 | Temp-Sensor-1 | 0.95 | 0.950 | |||||
| 2 | Temp-Sensor-2 | 0.95 | 0.950 | |||||
| 3 | Temp-Sensor-3 | 0.95 | 0.950 | |||||
| 4 | T12-Dummy | 0.95 | OR | T1 0.950 | T2 0.950 | 0.950 | ||
| 5 | T23-Dummy | 0.95 | OR | T2 0.950 | T3 0.950 | 0.950 | ||
| 6 | T13-Dummy | 0.95 | OR | T1 0.950 | T3 0.950 | 0.950 | ||
| 7 | T-123 | 0.95 | OR | T12 0.950 | T23 0.950 | T31 0.950 | 0.950 | |
| 8 | Humidity- Sensor-1 | 0.95 | 0.950 | |||||
| 9 | Humidity- Sensor-2 | 0.95 | 0.950 | |||||
| 10 | Humidity- Sensor-3 | 0.95 | 0.950 | |||||
| 11 | H12-Dummy | 0.95 | OR | H1 0.950 | H2 0.950 | 0.950 | ||
| 12 | H23-Dummy | 0.95 | OR | H2 0.950 | H3 0.950 | 0.950 | ||
| 13 | H31-Dummy | 0.95 | OR | H3 0.950 | H1 0.950 | 0.950 | ||
| 14 | H-123 | 0.95 | OR | H12 0.950 | H23 0.950 | H31 0.950 | 0.950 | |
| 15 | FAN-1 | 0.95 | 0.950 | |||||
| 16 | FAN-2 | 0.95 | 0.950 | |||||
| 17 | FAN-3 | 0.95 | 0.950 | |||||
| 18 | F12-Dummy | 0.95 | OR | F1 0.950 | F2 0.950 | 0.950 | ||
| 19 | F23-Dummy | 0.95 | OR | F2 0.950 | F3 0.950 | 0.950 | ||
| 20 | F31-Dummy | 0.95 | OR | F3 0.950 | F1 0.950 | 0.950 | ||
| 21 | F-123 | 0.95 | OR | F12 0.950 | F23 0.950 | F13 0.950 | 0.950 | |
| 22 | Light 1 | 0.95 | 0.950 | |||||
| 23 | Light 2 | 0.95 | 0.950 | |||||
| 24 | Light 3 | 0.95 | 0.950 | |||||
| 25 | L12-Dummy | 0.95 | OR | L1 0.950 | L2 0.950 | 0.950 | ||
| 26 | L23-Dummy | 0.95 | OR | L2 0.950 | L3 0.950 | 0.950 | ||
| 27 | L31-Dummy | 0.95 | OR | L3 0.950 | L1 0.950 | 0.950 | ||
| 28 | L-123 | 0.95 | OR | L12 0.950 | L23 0.950 | L31 0.950 | 0.950 | |
| 29 | D1 | 0.95 | OR | T-123/CH1 0.950 | 0.95 | |||
| 30 | D2 | 0.95 | OR | H-123/CH2 0.950 | 0.95 | |||
| 31 | D3 | 0.95 | OR | F-123/CH3 0.950 | 0.95 | |||
| 32 | D4 | 0.95 | OR | L-123/CH4 0.950 | 0.95 | |||
| 33 | Device Level Crossbar NW (DLCB) | 0.987 | OR | D1 0.950 | 0.987 | |||
| 34 | Device Level Crossbar NW (DLCB) | 0.987 | OR | D2 0.950 | 0.987 | |||
| 35 | Device Level Crossbar NW (DLCB) | 0.987 | OR | D3 0.950 | 0.987 | |||
| 36 | Device Level Crossbar NW (DLCB) | 0.987 | OR | D4 0.950 | 0.987 | |||
| 37 | D5 | 0.95 | OR | DLCB 0.987 | 0.987 | |||
| 38 | D6 | 0.95 | OR | DLCB 0.987 | 0.987 | |||
| 39 | D7 | 0.95 | OR | DLCB 0.987 | 0.987 | |||
| 40 | D8 | 0.95 | OR | DLCB 0.987 | 0.987 | |||
| 41 | BS1 | 0.95 | OR | D5 0.987 | D6 0.987 | D7 0.987 | D8 0.987 | 0.987 |
| 42 | RL1 | 0.95 | OR | Cluster Head1 0.950 | Cluster Head2 0.950 | 0.95 | ||
| 43 | RL2 | 0.95 | OR | Cluster Head1 0.950 | Cluster Head2 0.950 | Cluster Head3 0.950 | Cluster Head4 0.950 | 0.95 |
| 44 | RL3 | 0.95 | OR | Cluster Head3 0.950 | Cluster Head4 0.950 | 0.95 | ||
| 45 | RL4 | 0.95 | OR | RL1 0.950 | RL2 0.950 | 0.95 | ||
| 46 | RL5 | 0.95 | OR | RL1 0.950 | RL2 0.950 | 0.95 | ||
| 47 | BS2 | 0.95 | OR | RL4 0.950 | RL5 0.950 | 0.95 | ||
| 48 | CONTROLLER 1 | 0.9 | OR | BS1 0.987 | BS2 0.950 | 0.987 | ||
| 49 | CONTROLLER 2 | 0.9 | OR | BS1 0.987 | BS2 0.950 | 0.987 | ||
| 50 | CONTROLLER 3 | 0.9 | OR | BS1 0.987 | BS2 0.950 | 0.987 | ||
| 51 | CONTROLLER LEVEL CROSSBAR NW | 0.97 | CROSSBAR NW | CONTROLLER 1 0.987 | CONTROLLER 2 0.987 | CONTROLLER 3 0.987 | 0.987 | |
| 52 | SERVER 1 | 0.98 | OR | CONTROLLER LEVEL CROSSBAR NW 0.987 | 0.987 | |||
| 53 | SERVER 2 | 0.98 | OR | CONTROLLER LEVEL CROSSBAR NW 0.987 | 0.987 | |||
| 54 | SERVER 3 | 0.98 | OR | CONTROLLER LEVEL CROSSBAR NW 0.987 | 0.987 | |||
| 55 | GATEWAY | 0.98 | OR | SERVER 1 0.987 | SERVER 2 0.987 | SERVER 3 0.987 | 0.987 | |
| 56 | INTERNET | 0.95 | AND | GATEWAY 0.987 | 0.980 | |||
| Sl. No. | Device | Success Rate | Gates Used for Connection | Preceding Devices | Combined Success Rate | |||
|---|---|---|---|---|---|---|---|---|
| Device Name D1 | Device Name D2 | Device Name D3 | Device Name D4 | |||||
| Success Rate S1 | Success Rate S2 | Success Rate S3 | Success Rate S4 | |||||
| 1 | Temp-Sensor-1 | 0.95 | 0.950 | |||||
| 2 | Temp-Sensor-2 | 0.95 | 0.950 | |||||
| 3 | Temp-Sensor-3 | 0.95 | 0.950 | |||||
| 4 | T12-Dummy | 0.95 | OR | T1 0.950 | T2 0.950 | 0.950 | ||
| 5 | T23-Dummy | 0.95 | OR | T2 0.950 | T3 0.950 | 0.950 | ||
| 6 | T13-Dummy | 0.95 | OR | T1 0.950 | T3 0.950 | 0.950 | ||
| 7 | T-123 | 0.95 | OR | T12 0.950 | T23 0.950 | T31 0.950 | 0.950 | |
| 8 | Humidity- Sensor-1 | 0.95 | 0.950 | |||||
| 9 | Humidity- Sensor-2 | 0.95 | 0.950 | |||||
| 10 | Humidity- Sensor-3 | 0.95 | 0.950 | |||||
| 11 | H12-Dummy | 0.95 | OR | H1 0.950 | H2 0.950 | 0.950 | ||
| 12 | H23-Dummy | 0.95 | OR | H2 0.950 | H3 0.950 | 0.950 | ||
| 13 | H31-Dummy | 0.95 | OR | H3 0.950 | H1 0.950 | 0.950 | ||
| 14 | H-123 | 0.95 | OR | H12 0.950 | H23 0.950 | H31 0.950 | 0.950 | |
| 15 | FAN-1 | 0.95 | 0.950 | |||||
| 16 | FAN-2 | 0.95 | 0.950 | |||||
| 17 | FAN-3 | 0.95 | 0.950 | |||||
| 18 | F12-Dummy | 0.95 | OR | F1 0.950 | F2 0.950 | 0.950 | ||
| 19 | F23-Dummy | 0.95 | OR | F2 0.950 | F3 0.950 | 0.950 | ||
| 20 | F31-Dummy | 0.95 | OR | F3 0.950 | F1 0.950 | 0.950 | ||
| 21 | F-123 | 0.95 | OR | F12 0.950 | F23 0.950 | F13 0.950 | 0.950 | |
| 22 | Light 1 | 0.95 | 0.950 | |||||
| 23 | Light 2 | 0.95 | 0.950 | |||||
| 24 | Light 3 | 0.95 | 0.950 | |||||
| 25 | L12-Dummy | 0.95 | OR | L1 0.950 | L2 0.950 | 0.950 | ||
| 26 | L23-Dummy | 0.95 | OR | L2 0.950 | L3 0.950 | 0.950 | ||
| 27 | L31-Dummy | 0.95 | OR | L3 0.950 | L1 0.950 | 0.950 | ||
| 28 | L-123 | 0.95 | OR | L12 0.950 | L23 0.950 | L31 0.950 | 0.950 | |
| 29 | D1 | 0.95 | OR | T-123/CH1 0.950 | 0.95 | |||
| 30 | D2 | 0.95 | OR | H-123/CH2 0.950 | 0.95 | |||
| 31 | D3 | 0.95 | OR | F-123/CH3 0.950 | 0.95 | |||
| 32 | D4 | 0.95 | OR | L-123/CH4 0.950 | 0.95 | |||
| 33 | Device Level Crossbar NW (DLCB) | 0.987 | OR | D1 0.950 | 0.987 | |||
| 34 | Device Level Crossbar NW (DLCB) | 0.987 | OR | D2 0.950 | 0.987 | |||
| 35 | Device Level Crossbar NW (DLCB) | 0.987 | OR | D3 0.950 | 0.987 | |||
| 36 | Device Level Crossbar NW (DLCB) | 0.987 | OR | D4 0.950 | 0.987 | |||
| 37 | D5 | 0.95 | OR | DLCB 0.987 | 0.987 | |||
| 38 | D6 | 0.95 | OR | DLCB 0.987 | 0.987 | |||
| 39 | D7 | 0.95 | OR | DLCB 0.987 | 0.987 | |||
| 40 | D8 | 0.95 | OR | DLCB 0.987 | 0.987 | |||
| 41 | BS1 | 0.95 | OR | D5 0.987 | D6 0.987 | D7 0.987 | D8 0.987 | 0.987 |
| 42 | RL1 | 0.95 | OR | Cluster Head1 0.950 | Cluster Head2 0.950 | 0.95 | ||
| 43 | RL2 | 0.95 | OR | Cluster Head1 0.950 | Cluster Head2 0.950 | Cluster Head3 0.950 | Cluster Head4 0.950 | 0.95 |
| 44 | RL3 | 0.95 | OR | Cluster Head3 0.950 | Cluster Head4 0.950 | 0.95 | ||
| 45 | RL4 | 0.95 | OR | RL1 0.950 | RL2 0.950 | 0.95 | ||
| 46 | RL5 | 0.95 | OR | RL1 0.950 | RL2 0.950 | 0.95 | ||
| 47 | BS2 | 0.95 | OR | RL4 0.950 | RL5 0.950 | 0.95 | ||
| 48 | CONTROLLER 1 | 0.9 | OR | BS1 0.987 | BS2 0.950 | 0.987 | ||
| 49 | CONTROLLER 2 | 0.9 | OR | BS1 0.987 | BS2 0.950 | 0.987 | ||
| 50 | CONTROLLER 3 | 0.9 | OR | BS1 0.987 | BS2 0.950 | 0.987 | ||
| 51 | CONTROLLER LEVEL CROSSBAR NW | 0.97 | CROSSBAR NW | CONTROLLER 1 0.987 | CONTROLLER 2 0.987 | CONTROLLER 3 0.987 | 0.987 | |
| 52 | SERVER 1 | 0.98 | OR | CONTROLLER LEVEL CROSSBAR NW 0.987 | 0.987 | |||
| 53 | SERVER 2 | 0.98 | OR | CONTROLLER LEVEL CROSSBAR NW 0.987 | 0.987 | |||
| 54 | SERVER 3 | 0.98 | OR | CONTROLLER LEVEL CROSSBAR NW 0.987 | 0.987 | |||
| 55 | SERVER 4 | 0.98 | AND | CONTROLLER LEVEL CROSSBAR NW 0.987 | 0.967 | |||
| 56 | SERVER-LEVEL MESH NW | 0.98 | MESH NW | SERVER 1 0.967 | SERVER 2 0.967 | SERVER 3 0.967 | SERVER 4 0.967 | 0.999 |
| 57 | GATEWAY 1 | 0.95 | OR | SERVER- LEVEL MESH NW 0.999 | 0.999 | |||
| 58 | GATEWAY 2 | 0.95 | OR | SERVER- LEVEL MESH NW 0.999 | 0.999 | |||
| 59 | GATEWAY 3 | 0.95 | OR | SERVER- LEVEL MESH NW 0.999 | 0.999 | |||
| 60 | GATEWAY 4 | 0.95 | OR | SERVER- LEVEL MESH NW 0.999 | 0.999 | |||
| 61 | INTERNET | 0.98 | OR | GATEWAY 1 0.999 | GATEWAY 2 0.999 | GATEWAY 3 0.999 | GATEWAY 4 0.999 | 0.999 |
| Serial Number | Type of Network | Fault Tree Value |
|---|---|---|
| 1 | Example IoT network (prototype) [53] | 0.717 |
| 2 | Prototype with modified device layer [54] (implemented fault prediction, mitigation and crossbar network) | 0.827 |
| 3 | The prototype has been modified at the device and base station levels (by introducing dual networks to connect to two base stations and determining the quickest path for communication through the second base station) [55] | 0.948 |
| 4 | Prototype with modifications made at the device and base station levels, with load balancing at the controller layer (controllers interconnected over an I2C network, with middleware implemented within the controllers) and linking the controllers to the service’s servers through a crossbar network | 0.980 |
| 5 | Example IoT network with modifications made at the device level and base station levels, with load balancing at the controller layer (controllers interconnected through an I2C network and middleware implemented within the controllers), connecting the controllers to the service’s servers through a crossbar network and implementing the prediction model to predict the missing data | 0.980 |
| 6 | Example IoT network with modifications made at the device level and base station level, with load balancing at the controller layer (controllers interconnected through an I2C network and middleware implemented within the controllers), connecting the controllers to the service’s servers through a crossbar network and implementing the prediction and estimating the missing data. The service layer also implements a rectangular and interstitial mesh network to link the service’s server to the gateways. | 0.999 |
| Parameter | Mesh with Interstitial Mesh | NVD [21] | HVD [51] |
|---|---|---|---|
| Existence of empirical formulation for computation of FTA | Yes | No | No |
| Total number of nodes in the network | 24 | 16 | 16 |
| Number of paths existing in the network | 16 | 16 | 16 |
| Number of paths available when a node fails | 16 | 12 | 12 |
| Number of paths available when two nodes fail | 16 | 8 | 8 |
| Number of paths available when three nodes fail | 16 | 4 | 4 |
| Number of paths available when four nodes fail | 16 | 0 | 0 |
| FTA of network when four nodes fail | 0.999 | 0.000 | 0.00 |
Disclaimer/Publisher’s Note: The statements, opinions and data contained in all publications are solely those of the individual author(s) and contributor(s) and not of MDPI and/or the editor(s). MDPI and/or the editor(s) disclaim responsibility for any injury to people or property resulting from any ideas, methods, instructions or products referred to in the content. |
© 2023 by the authors. Licensee MDPI, Basel, Switzerland. This article is an open access article distributed under the terms and conditions of the Creative Commons Attribution (CC BY) license (https://creativecommons.org/licenses/by/4.0/).
Share and Cite
Jammalamadaka, S.K.R.; Chokara, B.; Jammalamadaka, S.B.; Duvvuri, B.K.; Budaraju, R. Enhancing the Fault Tolerance of a Multi-Layered IoT Network through Rectangular and Interstitial Mesh in the Gateway Layer. J. Sens. Actuator Netw. 2023, 12, 76. https://doi.org/10.3390/jsan12050076
Jammalamadaka SKR, Chokara B, Jammalamadaka SB, Duvvuri BK, Budaraju R. Enhancing the Fault Tolerance of a Multi-Layered IoT Network through Rectangular and Interstitial Mesh in the Gateway Layer. Journal of Sensor and Actuator Networks. 2023; 12(5):76. https://doi.org/10.3390/jsan12050076
Chicago/Turabian StyleJammalamadaka, Sastry Kodanda Rama, Bhupati Chokara, Sasi Bhanu Jammalamadaka, Balakrishna Kamesh Duvvuri, and Rajarao Budaraju. 2023. "Enhancing the Fault Tolerance of a Multi-Layered IoT Network through Rectangular and Interstitial Mesh in the Gateway Layer" Journal of Sensor and Actuator Networks 12, no. 5: 76. https://doi.org/10.3390/jsan12050076
APA StyleJammalamadaka, S. K. R., Chokara, B., Jammalamadaka, S. B., Duvvuri, B. K., & Budaraju, R. (2023). Enhancing the Fault Tolerance of a Multi-Layered IoT Network through Rectangular and Interstitial Mesh in the Gateway Layer. Journal of Sensor and Actuator Networks, 12(5), 76. https://doi.org/10.3390/jsan12050076